Article

Effects of Climate Change on the Distribution of Threatened Fishing Bat Myotis pilosus in China

1
College of Life Science, Jilin Agricultural University, Changchun 130118, China
2
Jilin Provincial Key Laboratory of Animal Resource Conservation and Utilization, Northeast Normal University, Changchun 130117, China
3
Key Laboratory of Vegetation Ecology of Education Ministry, Institute of Grassland Science, Northeast Normal University, Changchun 130024, China
*
Authors to whom correspondence should be addressed.
Animals 2023, 13(11), 1784; https://doi.org/10.3390/ani13111784
Submission received: 28 March 2023 / Revised: 23 May 2023 / Accepted: 25 May 2023 / Published: 27 May 2023
(This article belongs to the Special Issue Behavioural Ecology, Conservation and Management of Wildlife and Fish)

Abstract

:

Simple Summary

Myotis pilosus is a globally “Vulnerable” species. As the only known fishing bat in East Asia, M. pilosus is mainly distributed in China, and the protection of Chinese M. pilosus is of great significance for its persistence. Therefore, we collected species distribution data of M. pilosus from China and applied MaxEnt to assess its habitat suitability, recognize the important environmental variables, predict future distribution changes, and identify the potential future climate refugia. The results showed that temperature and precipitation, especially the minimum temperature, could be important environmental factors affecting the distribution of M. pilosus. The current suitable habitats of M. pilosus are located primarily in southwest and southeast China. Under future climate scenarios, the suitable habitats were expected to expand and shift toward higher latitudes and altitudes, but the area of predicted suitable habitats that M. pilosus could disperse and successfully colonize will be reduced in 2050 and 2070. Thus, five regions were identified as potential future climate refugia and suggested to be under priority protection and long-term monitoring. This study provides helpful information on the possible distribution changes of M. pilosus under current and future climate scenarios, which is important for the conservation of this vulnerable piscivorous bat.

Abstract

Climate change and biodiversity loss are two severe challenges that the world is facing. Studying the distribution shifts of species in response to climate change could provide insights into long-term conservation and biodiversity maintenance. Myotis pilosus is the only known fishing bat in East Asia, whereas its population has been decreasing in recent years and it is listed as a “Vulnerable” species. To assess the impact of climate change on the distribution of M. pilosus, we obtained 33 M. pilosus occurrence records within China where they are mainly distributed, and extracted 30 environmental variables. MaxEnt was applied to assess the habitat suitability, recognize the important environmental variables, predict future distribution changes, and identify the potential future climate refugia. The prediction result based on eleven dominant environmental variables was excellent. The Jackknife test showed that the “minimum temperature of coldest month”, “precipitation of wettest quarter”, “percent tree cover”, and “precipitation of driest month” were the main factors affecting the distribution of M. pilosus. The current suitable areas were predicted to be mainly located in southwest and southeast China with a total area of about 160.54 × 10⁴ km2, accounting for 16.72% of China’s land area. Based on the CCSM4, it was predicted that the future (2050 and 2070) suitable areas of M. pilosus will expand and shift to high latitudes and altitudes with global warming, but the area of moderately and highly suitable habitats will be small. Considering the dispersal capacity of M. pilosus, the area of colonized suitable habitats in 2050 and 2070 was predicted to be only ca. 94 × 104 km2 and 155 × 104 km2, respectively. The central and southern parts of Hainan, southern Guangdong, central Guizhou, and southern Beijing were identified as potential climate refugia and could be considered as priority conservation areas for M. pilosus. Thus, we suggest long-term monitoring of the priority conservation areas, especially the areas at high latitudes and altitudes. These results contribute to our knowledge of the possible spatial distribution pattern of M. pilosus under current and future climate scenarios, which is important for the population protection and habitat management of this special piscivorous bat species.

1. Introduction

Two severe challenges that the world is facing are climate change and biodiversity loss [1]. The Living Planet Report 2022, published by the World Wide Fund for Nature, showed that the relative abundance of global wildlife populations declined by an average of 69% between 1970 and 2018 [2]. Climate change is likely to be the leading cause of species loss or extinction over the past century [3]. With the accelerating rate of species extinction, the conservation of biodiversity has become the focus of biological research [4].
Bats are one of the most sensitive mammals to climate change [5,6]. As the only mammals with true powered flight, bats are widely distributed, have extremely high species diversity, and play important roles in ecosystems. However, because of the slow reproductive rate, high metabolism and longevity, as well as habitat specialization, bats are particularly sensitive to the effects of climate change [7,8,9]. According to the study of Tadarida teniotis, years of drought largely impaired the reproduction of T. teniotis in the Mediterranean region and led to a significant reduction in pregnant or lactating females and juveniles [10]. A similar situation was reported by a study of vespertilionid bats in western North America; when the temperature was greater than average and the precipitation was less than average, the reproductive output of bat populations reduced [11]. The study of Myotis daubentonii found that the increased rainfall could also lead to reduced reproductive success, especially when extreme weather events (such as excessive summer rainfall) occur [12]. These studies indicated that climate change affects bat populations, while the specific impacts may vary by species and environmental factors. To date, over 16% of bats are listed as threatened species in the IUCN Red List [13], and more than half of the bat populations have declined dramatically due to climate change, habitat degradation, habitat destruction, etc. [14].
Rickett’s big-footed bat, Myotis pilosus, is mainly distributed in China and very scattered in Laos and Vietnam [13]. This species is the only known fishing bat in East Asia [15], preying on both insects and freshwater fishes [16,17,18,19], and has a relatively large body size with well-developed feet and claws [16]. Myotis pilosus generally inhabits forested hills, mountains, and wetlands [19,20,21], and forages from the water surface of nearby reservoirs, ponds, and rivers [17,22,23]. In addition, hibernation was observed in the Beijing population of this species from November to mid-March of the following year [17]. Many researchers focused on this species and made significant progress in understanding the genetic basis of echolocation system specialization [24], the role of paleoclimate in shaping the current population genetic structure [25], the reason for dietary niche expansion from insects to fish [18], and the evolution of taste receptor genes [26]. However, according to the IUCN Red List, M. pilosus is globally “Vulnerable” and its population is declining year by year [19]. For species conservation and ongoing research, there is an urgent need to assess the survival potential and habitat suitability of M. pilosus.
Species distribution model (SDM), also known as ecological niche model, is a mathematical model based on species existence records and environmental data [27]. SDM associates the information of species occurrence records and the environmental characteristics on the occurrence sites, and infers the relationship between species occurrence and environmental data. Based on the relationship, the SDM can further predict the potential distribution areas that meet the ecological requirements of the species [28,29]. SDMs play an important role in conservation biology research [30] and have been widely used to study species’ responses to climate change [31,32], potential distribution area predictions [33], impacts of local climate change on species richness and community stability [34,35], protected area delineation for endangered species, and impacts of human activities on endangered species [36,37]. Among the different species distribution models, maximum entropy modeling (MaxEnt) is widely used in the study of species suitable habitat assessment because of its high prediction accuracy and stability [38,39,40,41].
In this study, we collected the distribution data of M. pilosus in China and predicted the potentially suitable habitats using MaxEnt. The aims of this study were: (1) to recognize important environmental variables that influence the distribution of M. pilosus; (2) to predict the spatial distribution pattern of M. pilosus under current and future climate scenarios; and (3) to identify the potential future climate refugia. Our results will demonstrate the likely distribution of M. pilosus under current and future climate scenarios, help to understand the effects of environmental factors on the distribution and survival of this species, and provide fundamental data for the protection and management of this ecologically important species.

2. Materials and Methods

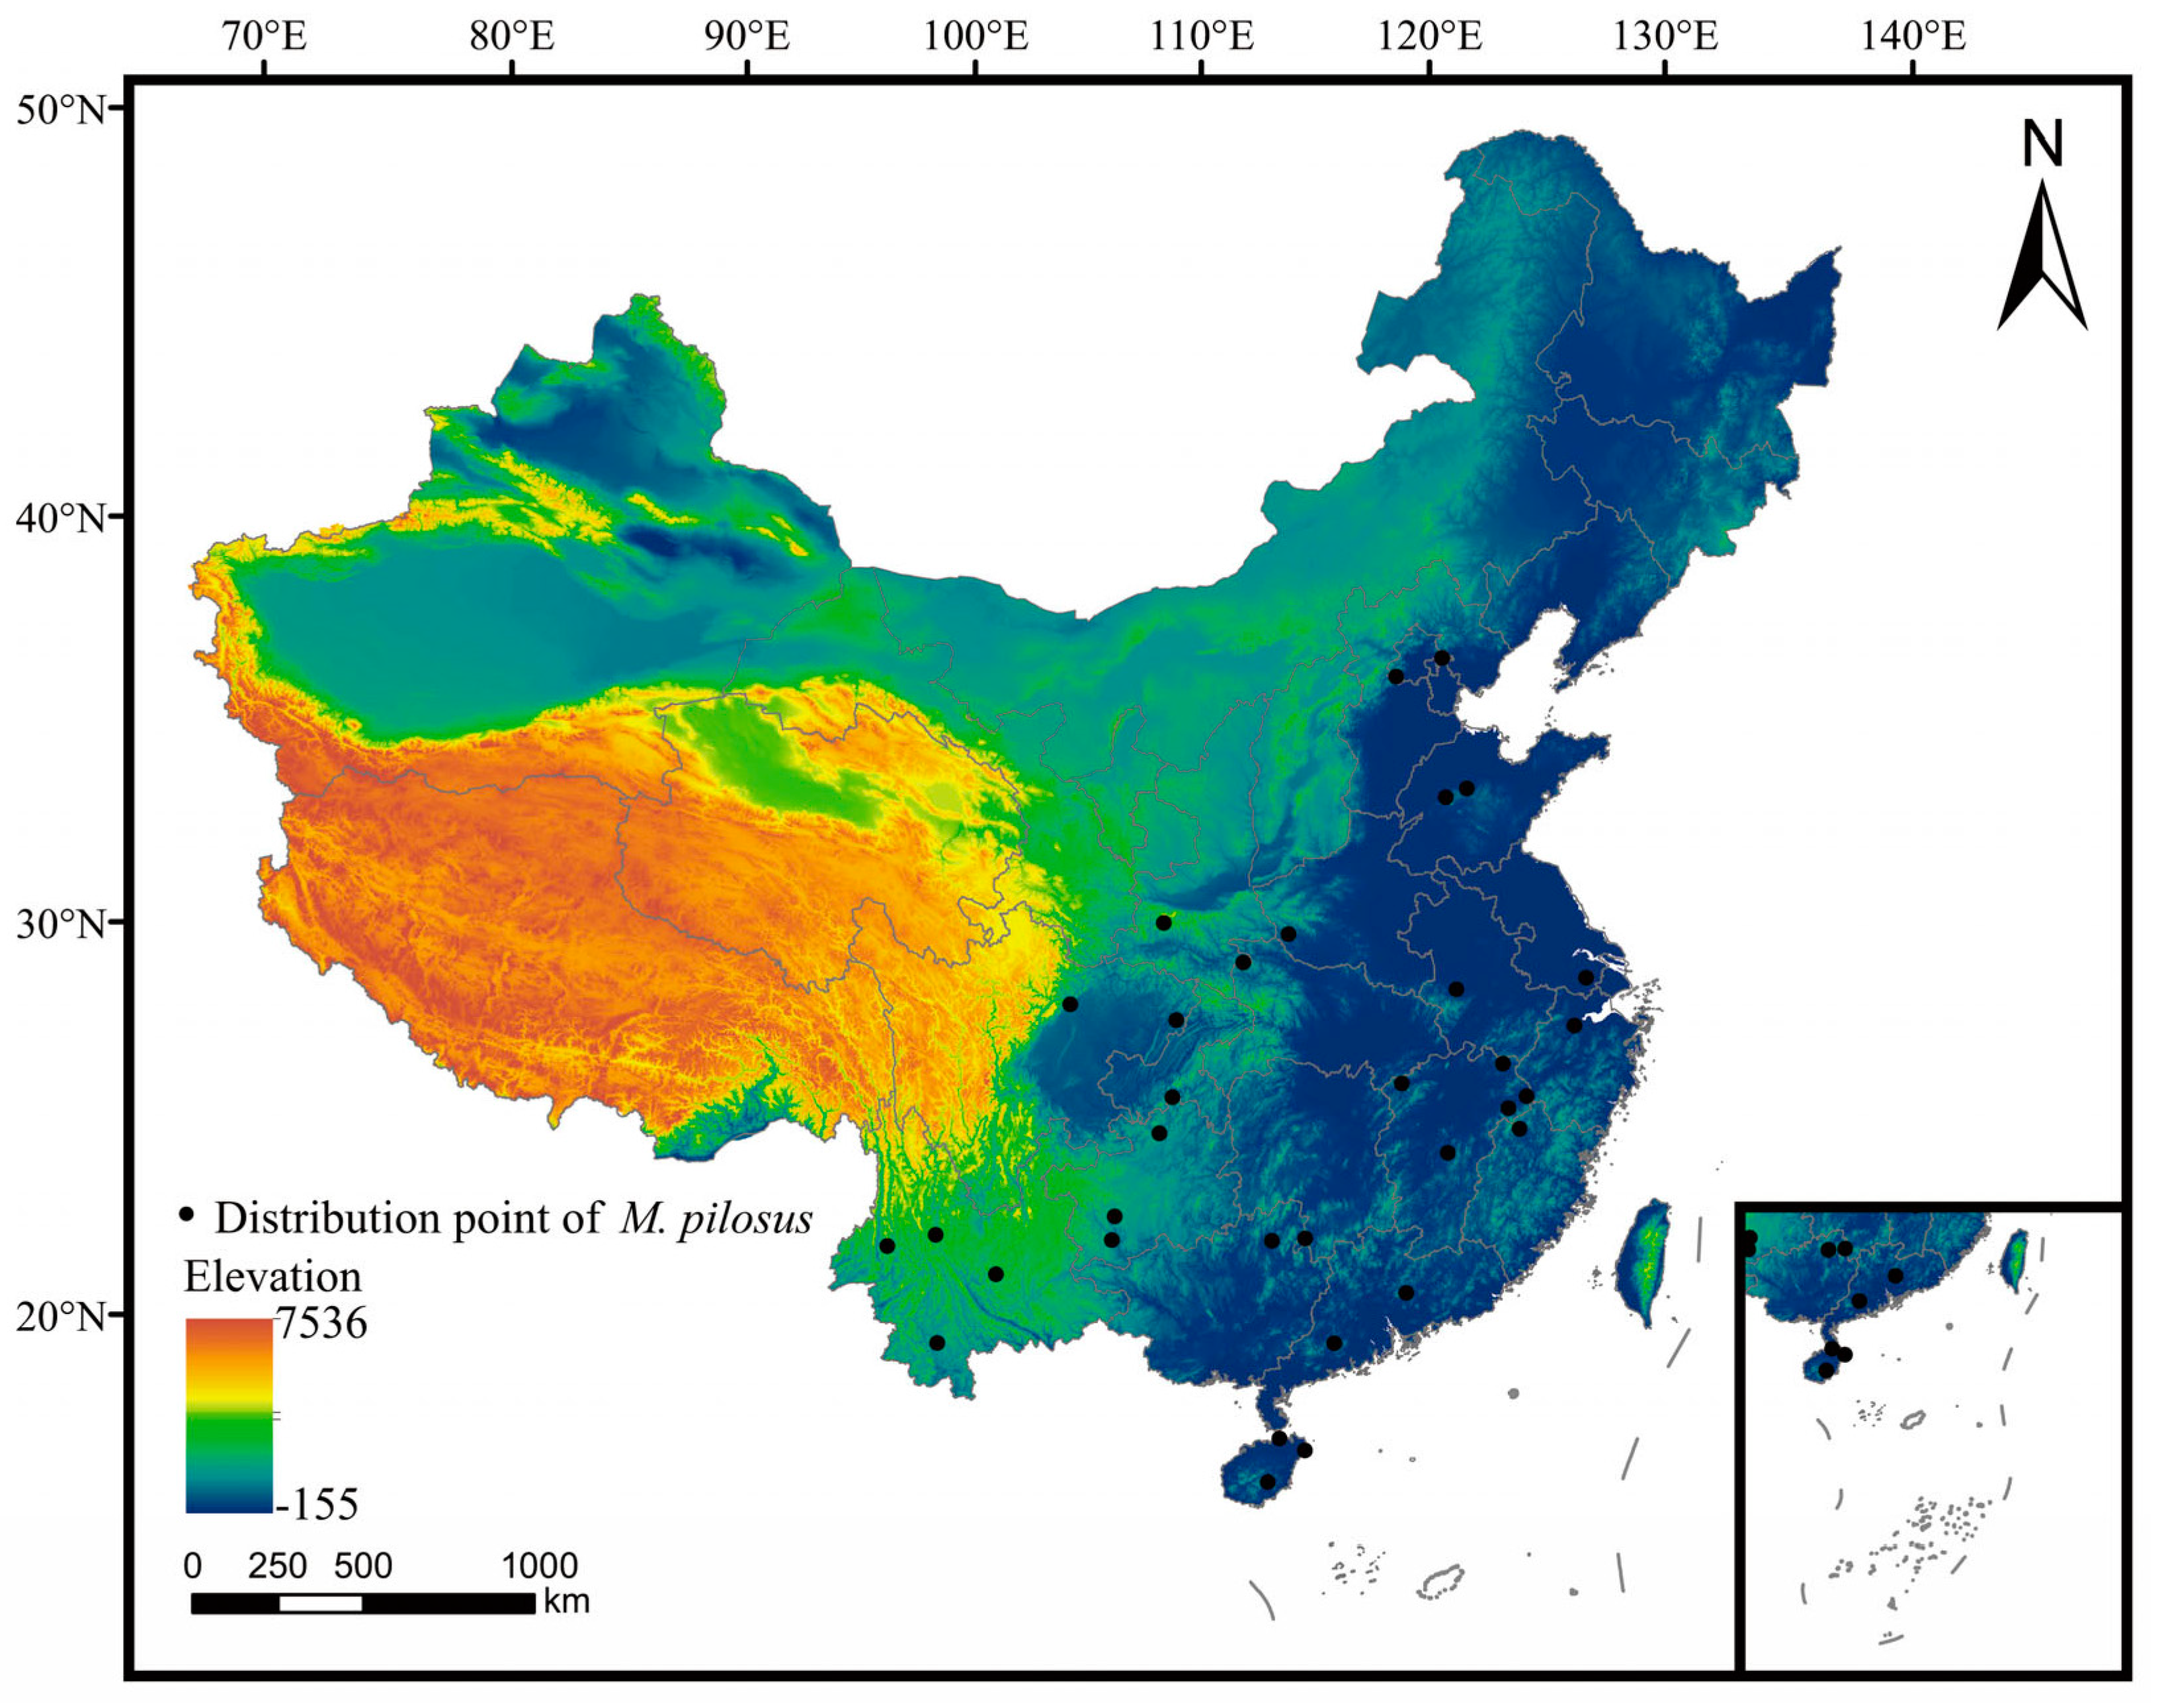
2.1. Species Distribution Data

The distribution data of M. pilosus was collected from the Global Biodiversity Information Agency (https://www.gbif.org/, accessed on 10 October 2022), scientific literature, and field survey data (2006–2022). The distribution points were loaded into ArcGIS v.10.4, and ENMTools was used to eliminate the autocorrelation and ensure that there was only one distribution point in each 2.5 min grid cell (about 4.5 km × 4.5 km). Finally, a total of 33 distribution points were kept for subsequent analyses (Figure 1; Table S1).

2.2. Environmental Variables

A total of 30 environmental variables were collected and divided into six categories: climate, land cover and vegetation, terrain, light index, human disturbance, and river (Table 1). Nineteen climate variables were downloaded from the WorldClim database (http://www.worldclim.org, accessed on 10 October 2022). Percent tree cover and normalized vegetation index were downloaded from the Earth Science Data and Information System Engineering website (https://earthdata.nasa.gov/, accessed on 10 October 2022). Land use, light index, settlements, roads, and river data were obtained from the Resource and Environmental Science and Data Center of the Chinese Academy of Sciences (https://www.resdc.cn/, accessed on 26 April 2023). Three terrain variables were extracted from DEM digital elevation data, which was obtained from the Computer Network Information Center of the Chinese Academy of Sciences and the International Scientific Data Website (http://www.gscloud.cn/, accessed on 10 October 2022). The human influence index data was downloaded from Socioeconomic Data and Applications Center (https://sedac.ciesin.columbia.edu/, accessed on 28 April 2023). Based on the CCSM4 which has a high accuracy for climate simulation and prediction [42], future (2050 and 2070) climate projections were reconstructed under three representative concentration pathway (RCP) scenarios, i.e., RCP2.6, RCP4.5, and RCP8.5, with increasing atmospheric concentrations of carbon dioxide and other greenhouse gases and aerosols [43]. The spatial resolution of all environmental variables was adjusted to 2.5 min by ArcGIS, and the environmental variables were cut by the Chinese administrative map downloaded from the Standard Mapping Service website of the Natural Resource of the People’s Republic of China (GS (2019) 1822, http://bzdt.ch.mnr.gov.cn/, accessed on 10 October 2022). All the maps in this study represent the authors’ views and are not used for political purposes.
The distribution data and environmental variables were imported into MaxEnt v.3.4.4 for simulation. All the simulations were repeated ten times, and the environmental variables with a contribution rate of less than 1% were eliminated (Table S2). High spatial correlations between environmental variables will reduce the accuracy of MaxEnt. Thus, ENMTools was used to examine the correlations between environmental variables. For the environmental variables with an absolute value of correlation coefficient greater than 0.75, only those with higher contribution rates were retained (Figure S1). Finally, eleven environmental variables (Aspect, Bio6, Bio14, Bio15, Bio16, Dis_riv, Dis_set, Landuse, Light, Slope, and TREE) were kept for subsequent model reconstruction.

2.3. MaxEnt Procedures

Distribution data and eleven environmental variables were imported into MaxEnt. Seventy-five percent of the distribution data was used for model training, and the remaining 25% was used for testing. The model was repeated ten times, and the replicate runs were subsampled for model accuracy. The model results were outputted in logistic format.
The Jackknife test was used to evaluate the importance of each environmental variable. The influence of the environmental variable on the distribution was visualized by an environmental variable response curve. The accuracy of the model prediction was measured using AUC (the area value under the receiver operating characteristic curve). The value of AUC ranged from zero to one. The higher the AUC, the better the model’s performance, with the prediction considered failed (AUC 0.5–0.6), poor (0.6–0.7), fair (0.7–0.8), good (0.8–0.9), or excellent (0.9–1) [44].

2.4. Classification of Suitable Habitats

Habitat suitability is typically represented by a value from zero to one, where the higher the value is, the greater probability of occurrence (p). According to the maximum test sensitivity plus specificity threshold (MTSPS), the prediction results were divided into suitable habitat and unsuitable habitat [45]. There were four grades of suitability: unsuitable habitat (p < MTSPS), lowly suitable habitat (MTSPS < p < 0.5), moderately suitable habitat (0.5 < p < 0.7), and highly suitable habitat (0.7 < p < 1). The SDM Toolbox tool was used to calculate the changes in centroid positions under different scenarios.

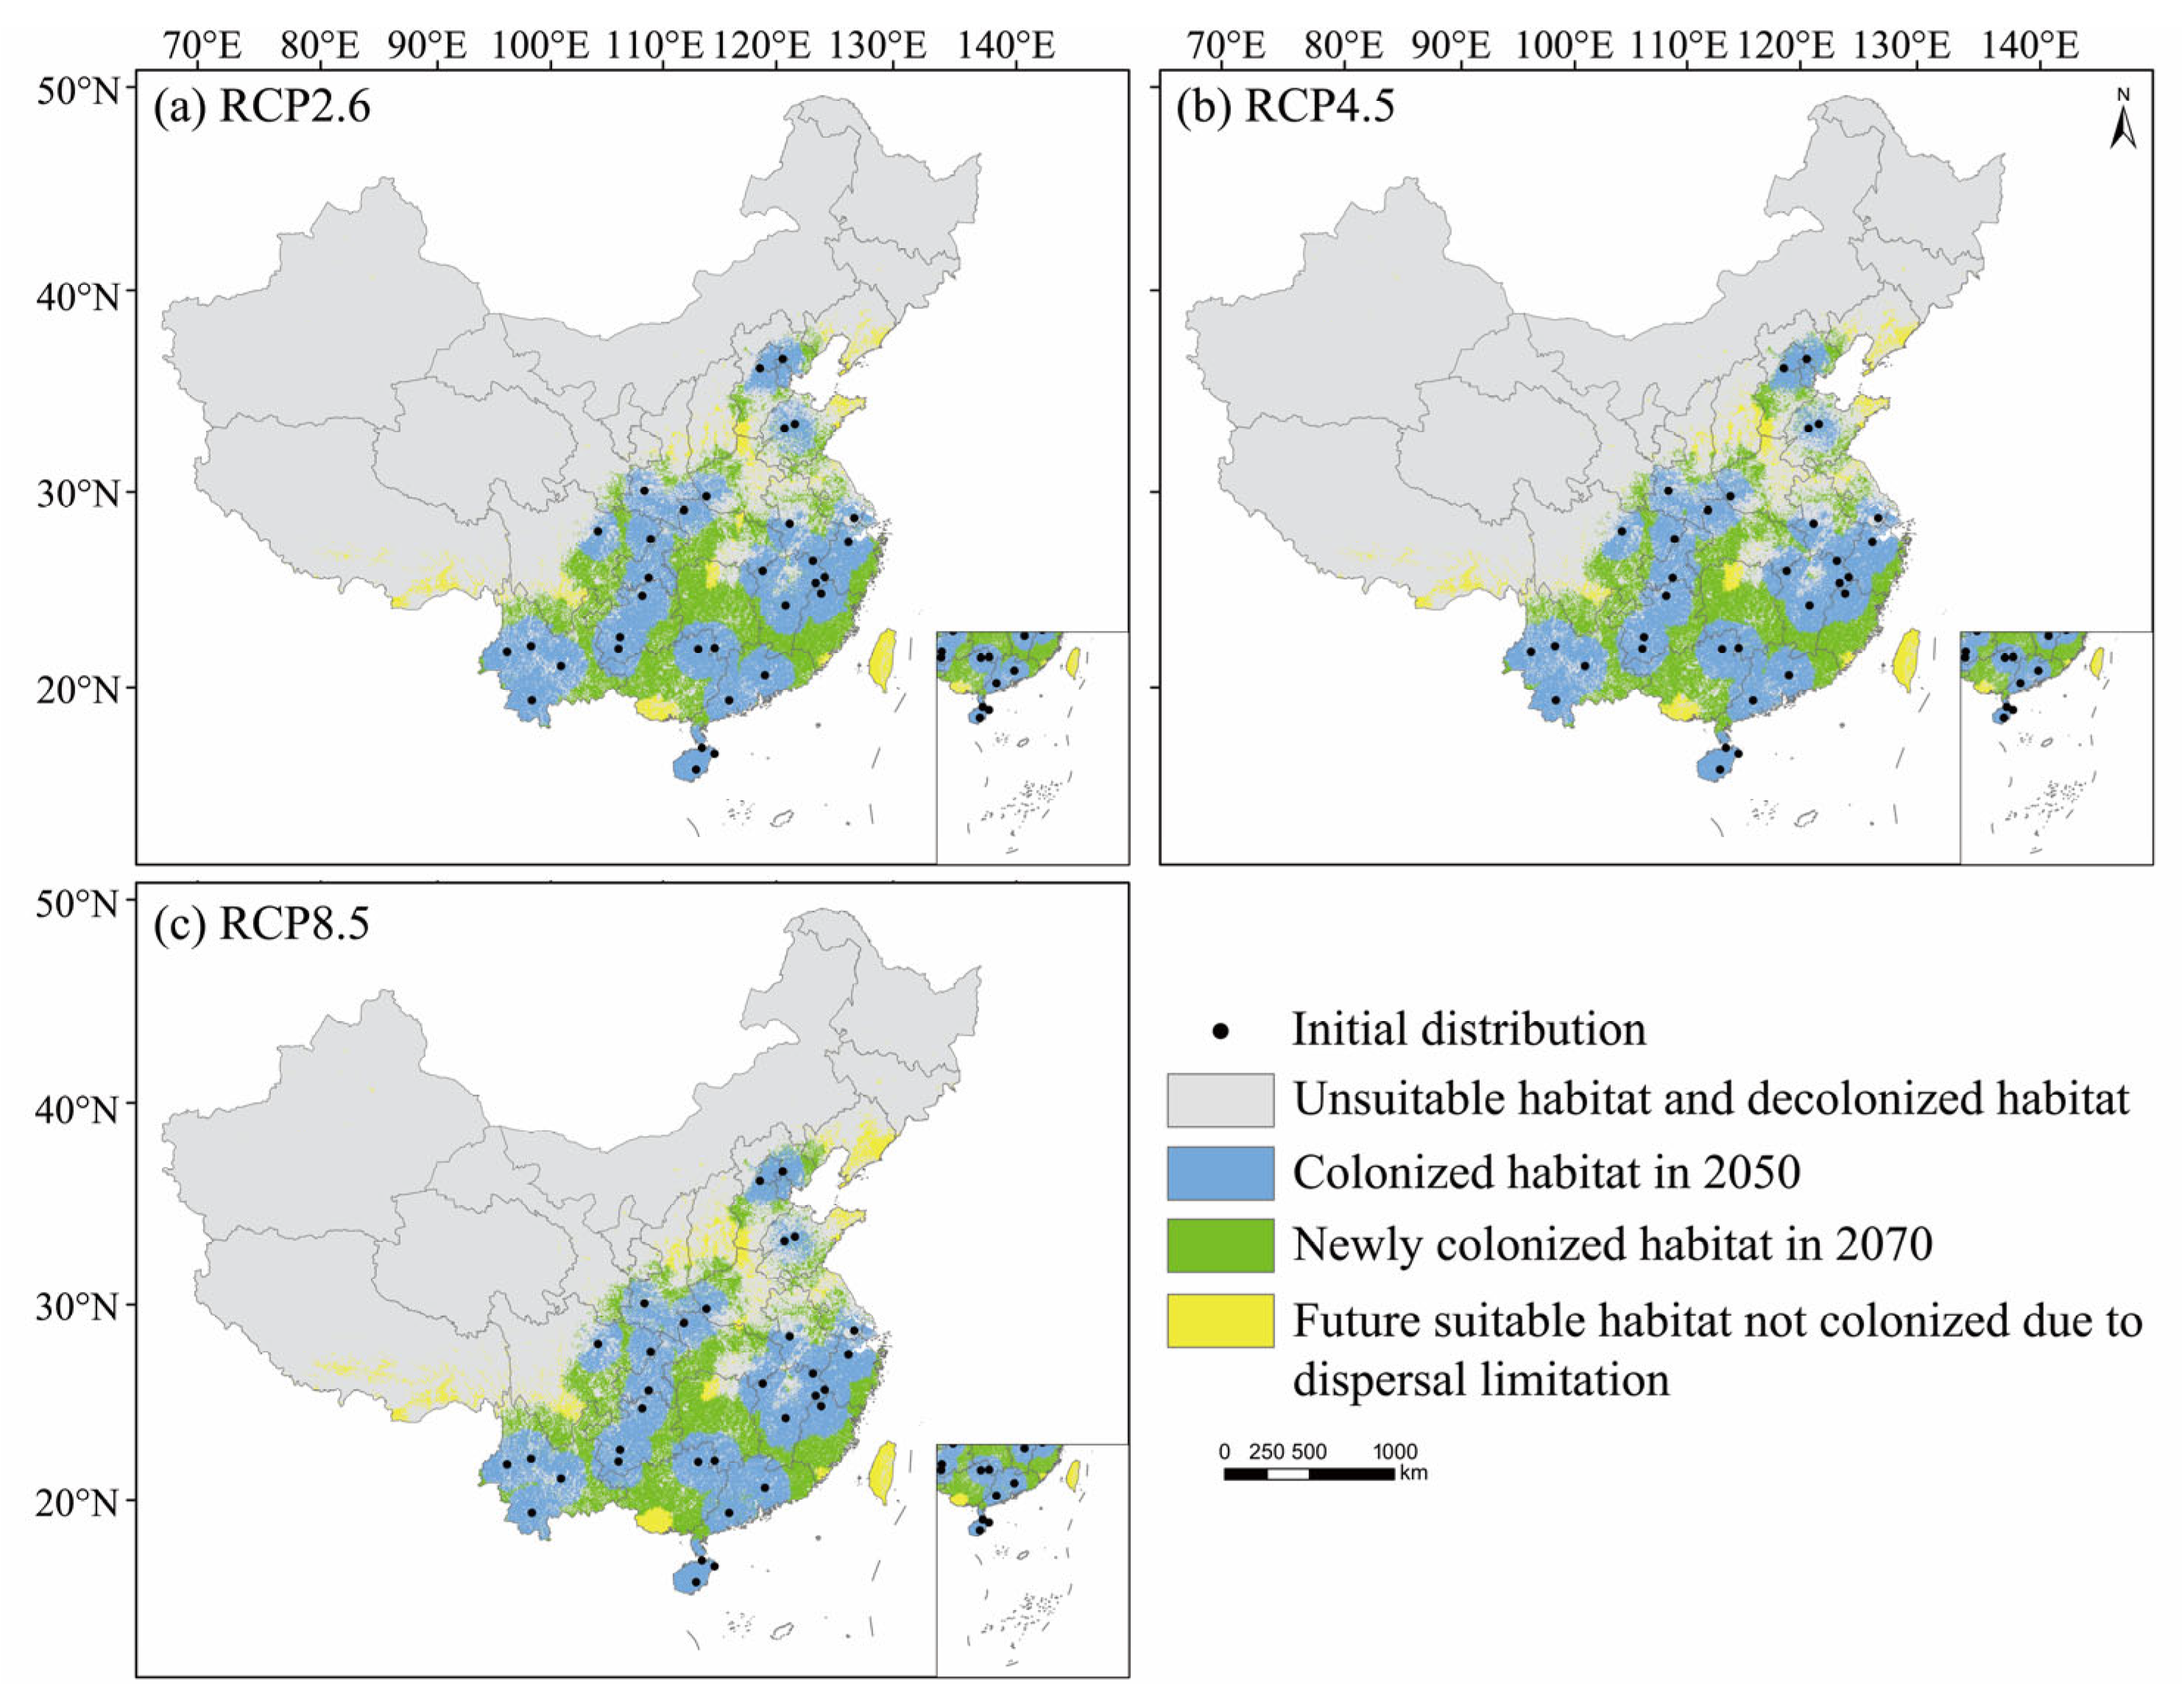
2.5. Dispersal Simulations

We used the “MigClim” package [46] in R v.4.2.3 [47] to simulate the dispersal of M. pilosus and incorporate species dispersal limits into the species distribution predictions. The species’ initial distribution points and habitat suitability maps in 2050 and 2070 generated from the MaxEnt models were used as input files. The reclassification threshold was set to 208 according to the MTSPS, and environmental change step number was set to 2. We assumed that our species can disperse once a year, so the dispersal step number was adjusted to 20. According to Ma et al. [17], M. pilosus can forage about 8 km away from its roosts, almost twice that of the grid cell used in this analysis, so we modified the dispersal kernel to c(1.0, 1.0, 0.4, 0.16, 0.06). We defined the maximum long-distance dispersal distance as 15 km based on the research of congenus species, Myotis bechsteinii and Myotis emarginatus [48]. The remaining parameters were set using the default values.

2.6. Identification of Climate Refugia

A conservative prediction of future climate refugia was obtained by merging the maps of highly suitable habitats under current and future climate scenarios. In this study, two types of refugia were identified [49,50,51]: (1) in situ refugia, which are the most important areas for species and highly suitable under all climate scenarios, (2) ex situ refugia, which are un-highly suitable areas for the species under current climate conditions, but highly suitable under all future scenarios. Although in situ refugia are crucial for the survival and reproduction of species, ex situ refugia are important for promoting resilience in the future. The intersection of climate refugia under three climate scenarios was obtained in 2050 and 2070 and projected to the range of M. pilosus, which was downloaded from the IUCN Red List (https://www.iucnredlist.org/, accessed on 10 October 2022) to determine the priority conservation areas.

3. Results

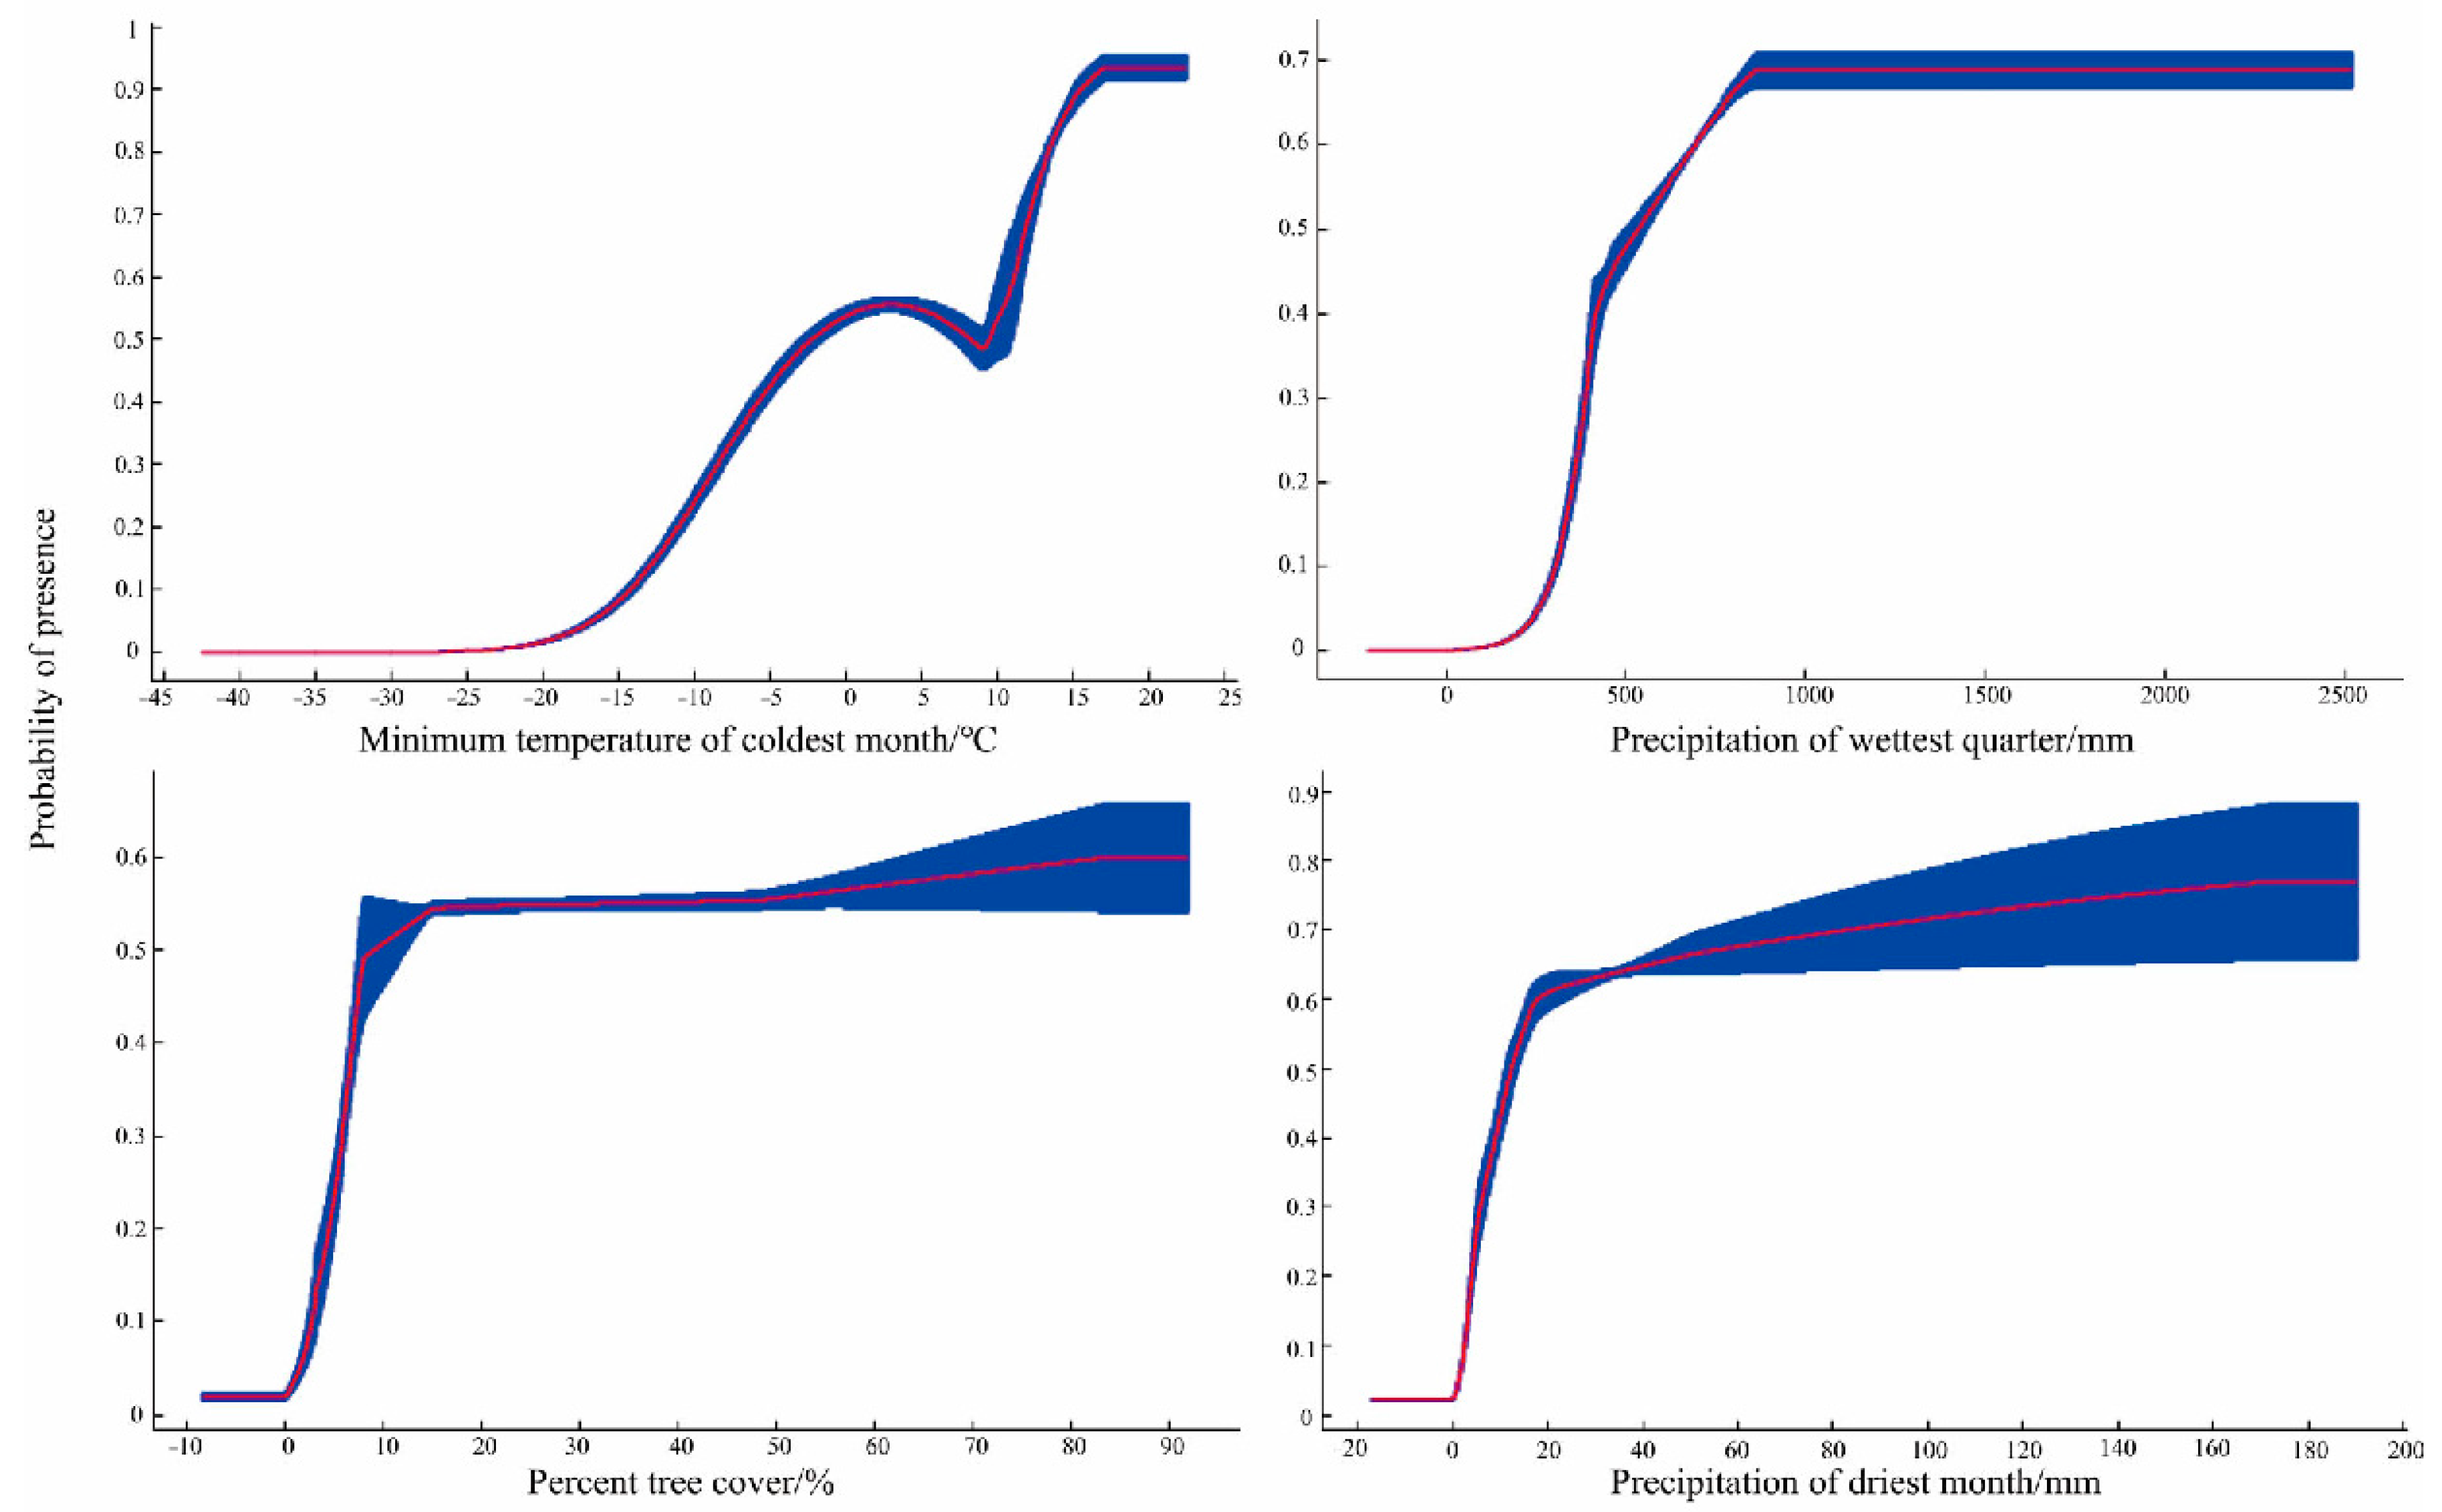
3.1. Model Verification and Environmental Variables

The average AUC value of ten replications was higher than 0.9 (Figure 2a), indicating that MaxEnt had an excellent predictive ability and was able to accurately predict the potential distribution of M. pilosus. According to the results of the Jackknife test (Figure 2b), minimum temperature of coldest month (Bio6) contributed most to the distribution of M. pilosus, followed by precipitation of wettest quarter (Bio16), percent tree cover (TREE), and precipitation of driest month (Bio14), with the cumulative contribution totaling up to 72.4% (Table 2).
The response curves of these four environmental variables show a marked increase in the occurrence probability with increasing levels of temperature, precipitation, and tree cover (Figure 3). According to the response curves and MTSPS threshold (0.2806), M. pilosus prefers habitats with warm temperatures (Bio6 > −8.9 °C), humid climates (Bio14 > 5.33 mm and Bio16 > 384.48 mm), and high percent tree cover (TREE > 5.68%).

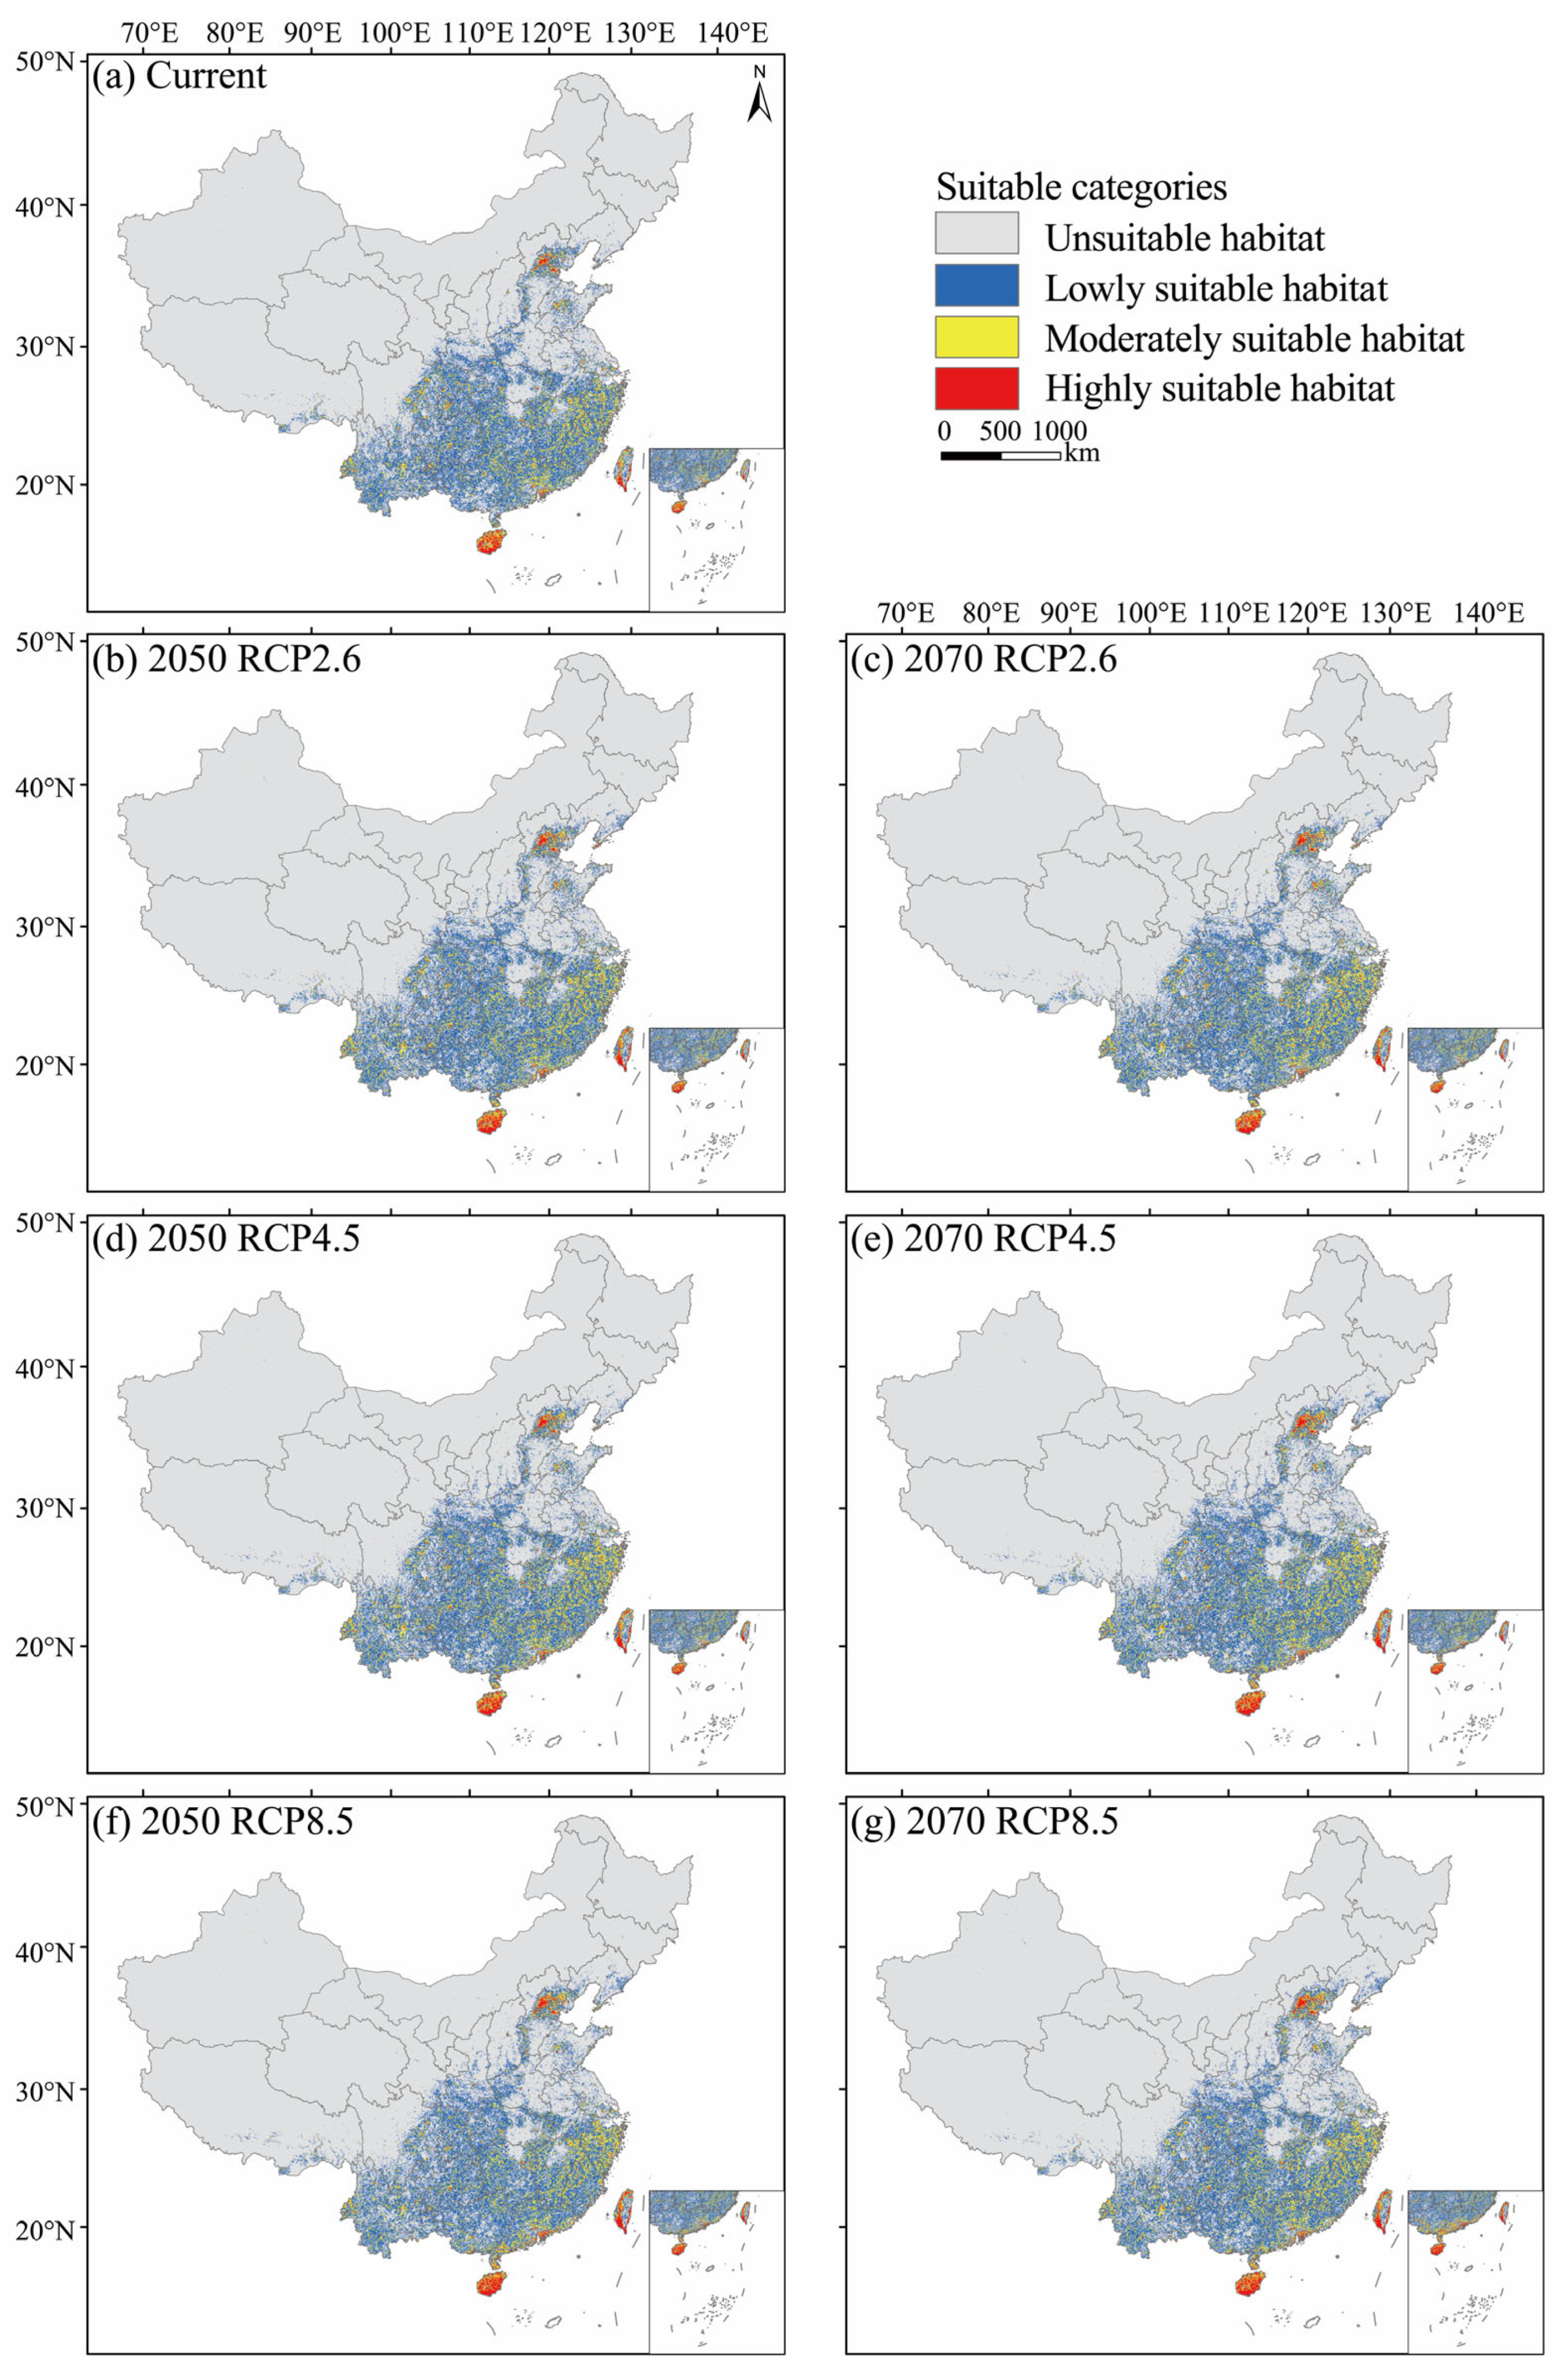
3.2. Current Potential Suitable Habitats

Under the current climatic condition, the suitable habitats of M. pilosus were predicted to be mainly distributed in southwest and southeast China (Figure 4a and Figure S2), at an average altitude of 648.19 m, and covered a total area of 160.54 × 10⁴ km2 accounting for 16.72% of China’s land area (Table 3). The habitats with high, moderate, and low suitability were predicted to be 5.74 × 10⁴ km2, 34.82 × 10⁴ km2, and 119.98 × 10⁴ km2, respectively (Table 3). The moderately and highly suitable habitats were predicted to be mainly distributed in southern coastal areas and Beijing (Figure 4a).

3.3. Future Potential Suitable Habitats

Compared with the current distribution, the average altitude and area of suitable habitats estimated under the unlimited dispersal assumption were both increased in the future climate scenarios (Table 3). The most obvious changes were observed under the RCP8.5 scenario in 2070, with an average altitude increase of 60.37 m and the total area of suitable habitats expanded by 18.46 × 10⁴ km2 (Figure 4; Table 3). More specifically, the areas of highly and moderately suitable habitats increased to 9.70 × 10⁴ km2 and 41.43 × 10⁴ km2, and the area of habitats with low suitability markedly expanded with an increase of 6.58% compared with the current value (Table 3).
However, when considering the dispersal capacity of M. pilosus, the area of colonized suitable habitats in the future was decreased (Table 3). In 2050, the average area of colonized suitable habitats under three RCPs was 94.38 × 10⁴ km2 and accounted for 58.78% of the current suitable habitat area. In 2070, the area of colonized suitable habitats increased the most to 156.99 × 10⁴ km2 under the RCP8.5 scenario and reduced by 3.55 × 10⁴ km2 compared to the current suitable habitats. Myotis pilosus could disperse to most areas of southern China, and the northernmost regions could spread to the north of Heibei Province in 2050 and the center of Liaoning Province in 2070 (Figure 5).

3.4. Shift in Centroid Position

The current centroid of M. pilosus is located in Anhua County of Hunan Province. In the future climatic context, the centroid position was predicted to slightly shift to higher latitudes but was still located in the same county (Figure 6). Under the RCP2.6 climate scenario, the center of the potential suitable habitat shifted to the northwest by 15.50 km in 2050, and to the southeast by 15.14 km in 2070. Under the RCP4.5 climate scenario, the centroid position shifted to the northwest by 23.18 km in 2050, and to the northeast by 25.11 km in 2070. Under the RCP8.5 climate scenario, the centroid position shifted to the northeast by 25.83 km in 2050, and to the northeast by 20.13 km in 2070.

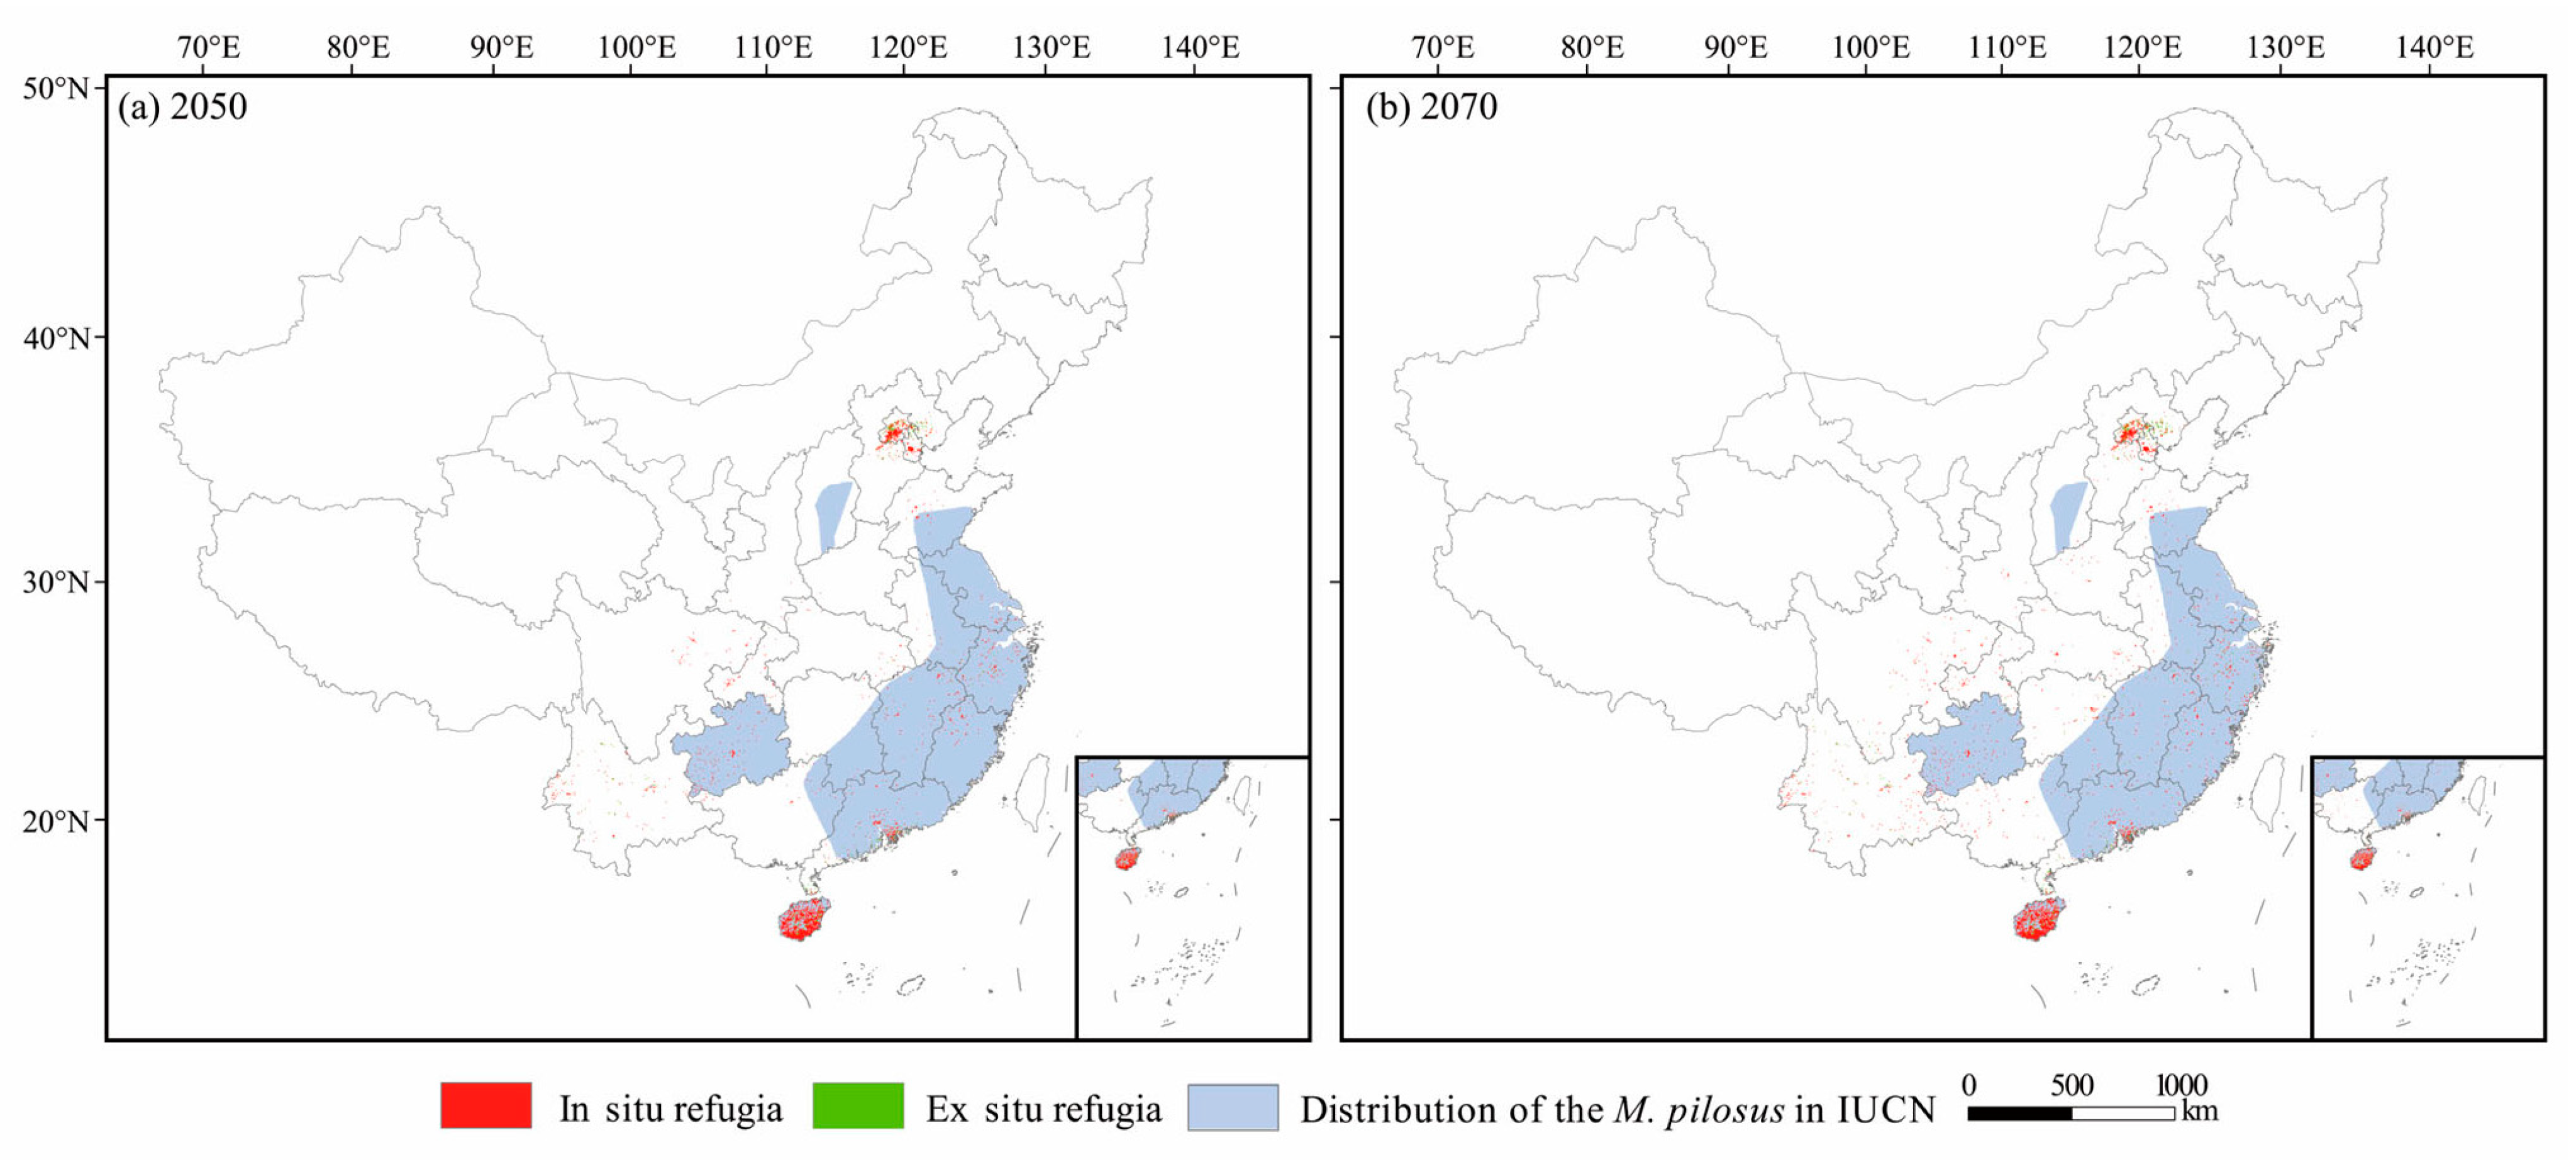
3.5. Future Climate Refugia

The area of in situ refugia was slightly reduced with the increase in greenhouse gas concentrations in 2050 and 2070 (Figure S3; Table 4). The area of ex situ refugia markedly increased under each scenario; the area under the RCP8.5 scenario was more than one and a half times that of RCP2.6 in 2050, and almost three times that in 2070 (Figure S3; Table 4).
Several large patches of climate refugia were identified as priority conservation areas, including the central and southern Hainan Island, southern Guangdong Province, central Guizhou Province, and southern Beijing (Figure 7).

4. Discussion

Understanding the potential distribution of threatened species under current and future climate scenarios is critical to biological conservation and strategic planning formulation [52,53]. Occurrence data of threatened species are often insufficient, which hinders the design of appropriate conservation strategies [54]; thus, the species distribution model has been widely applied to fill the gap of insufficient data in species conservation. In this study, MaxEnt was used to predict the potential distribution of M. pilosus based on the data of 33 occurrence records within China. Although the data set of distribution is small, our simulation shows a high accuracy (Figure 2a). Similarly, Jiang et al. (2020) used MaxEnt to predict the suitable habitat of Stachyris nonggangensis with 33 occurrence records with a model accuracy of 0.99 [55], indicating that the model performed well with limited data. Silva et al. (2014) used only 17, 25, and 6 occurrence points to estimate the potential distribution of endemic lizard species Tropidurus montanus, Cercosaura albostrigata, and Bachia oxyrhina in the Brazilian Cerrado hotspot; the model accuracies were 0.99, 0.94, and 0.99, respectively [56], also suggesting that MaxEnt can obtain accurate simulation results with small data sets [57,58].
Bats are sensitive to changes in temperature and precipitation, as evidenced by the studies of Pipistrellus kuhlii in Europe [59] and 17 bat species in China over the past 50 years [60]. Similarly, in this study, we also found that the distribution of M. pilosus was mainly associated with four main environmental variables, including minimum temperature, percent tree cover, and minimum and maximum precipitation. Moreover, the minimum temperature was found to be the most important environmental variable (Figure 2b; Table 2), consistent with the study of Hypsugo savii, Pipistrellus pipistrellus, and P. kuhlii, suggesting that the lowest temperature may be an important environmental factor affecting the distribution of bats [59,61].
Temperature changes may affect the food resource availability, duration and intensity of hibernation, and thermal requirements during reproduction, which may lead to strong alterations of population demographics and distribution [59,61,62]. Myotis pilosus is both a piscivore and an insectivore; when fish resources become limited, it will shift its diet to insects [18]. However, the activity of insects is affected by ambient temperature [63]. Low ambient temperatures reduce the activity of volant insects, and long-term low temperatures will delay the development of insects [64]. Thus, the temperature may influence the distribution of bats by acting on their food resources. Indeed, according to Park et al. (2000), Rhinolphus ferrumequinum increased its activity duration when the ambient temperature was higher than 10 °C, which is related to the thermal threshold of insect activity [65]. In addition, temperature may affect the hibernation and reproduction of bats. Many bats hibernate to survive harsh environments, such as low temperatures [66]. However, frequent hibernation of male bats would lead to sperm production delayed, which affects reproduction in the autumn [66]. For female bats, frequent hibernation leads to pregnancy prolongation and developmental delay of the fetal organs [67]. This is unfavorable as a short summer may not be enough for pups to learn how to fly and forage, and they may not be able to accumulate enough fat for migration or hibernation [63].
Climate-driven habitat shifts might influence the distribution of species. According to the IUCN Red List, the population of M. pilosus has been declining in recent years due to environmental degradation, habitat destruction, and other factors [19]. Our study predicts that the suitable habitat of M. pilosus will expand in the future. This may be because the temperature will increase under future warming scenarios and more areas will reach the temperature suitable for the survival of M. pilosus (Figure 4). A similar conclusion was drawn from the study of Pipistrellus nathusii in the UK where the areas suitable for P. nathusii were projected to triple by 2050, and the minimum temperature contributed most to the expansion [68]. However, when we considered the dispersal ability of M. pilosus, almost half of the predicted suitable habitats cannot be reached by 2050 and about 11% of predicted suitable habitats are unreachable by 2070 (Figure 5; Table 3). In addition, the total area of moderately and highly suitable habitats of M. pilosus under the current climate is likely to be just 40.56 × 10⁴ km2 (accounting for 4.23 % of China’s land area) or even smaller if we considered their dispersal ability (Table 3).
In the face of global climate change, organisms may respond to climate change by migrating to new regions, adapting to new environments, or going extinct [69]. Fortunately, there are no reports of bat extinction due to climate change [69]. Studies show that climate warming has caused many species to migrate and spread to high altitudes and latitudes [70,71]. Our results suggested that M. pilosus is likely to shift slightly to higher latitudes and altitudes in the future (Figure 4 and Figure 5; Table 3). The migration process predicted in our study seems to have occurred or is progressing, as Wu found that bats in China, including M. pilosus, mainly shifted northward in the past 50 years (1960s–2000s), and most of these changes were related to thermal indices [60]. The same trend was observed in Lasiurus seminolus in the United States [72] and P. nathusii in Europe [73]; both species expanded rapidly to high latitudes in response to climate change in recent decades. In recent years, there have been many studies on local adaptation. It has been reported that R. ferrumequinum in Italy may adapt to new environments by changing its body size (such as increasing forearm length) [74]. Another study has confirmed that bats can respond quickly to climate change by changing their phenology. Twenty-two years of monitoring at Bracken Cave showed that the spring migration and summer breeding cycles of bats were approximately two weeks ahead, which could be the bats’ responses to climate changes [75]. However, we still know little about whether there are phenotypic, genetic, or behavioral changes in M. pilosus associated with environmental adaptation.
China is the concentrated distribution area of M. pilosus, and the protection of M. pilosus in China is of great significance for its global conservation and persistence. According to the results of this study, several regions were identified as potential highly suitable habitats, such as southern Beijing, central and southern parts of Hainan, and other priority conservation areas (Figure 7). These areas are both the current distribution areas and probably the most suitable habitats for the survival of M. pilosus in the future, and should be given more attention when developing protection strategies. Our results showed that “TREE” is an important environmental factor affecting the distribution of M. pilosus (Table 2); thus, the contiguous forests around these areas should be protected. Although the predicted variables related to human disturbance, including “Light” and “human disturbance,” have relatively small effects on the distribution of M. pilosus, the anthropogenic impacts, such as night light, noise, and hunting, should still be restricted around these areas. In addition, given the particular foraging behavior of M. pilosus, we could conduct long-term monitoring of several M. pilosus populations and nearby freshwater resources in future studies, and integrate the transcriptomic and metabolomic technologies, to demonstrate the effects of freshwater quality on the growth, development, reproduction, and metabolism of M. pilosus.

5. Conclusions

Our results indicate that climate change might have an important influence on the distribution of M. pilosus. Temperature and precipitation are important environmental factors affecting its distribution. Minimum temperature of coldest month was predicted to be the most important environmental variable. With the increase in temperature in the future, the suitable habitats will probably expand and shift toward higher latitudes and altitudes, but the area of suitable habitats that M. pilosus could disperse and successfully colonize is likely to be reduced in 2050 and 2070. Five priority conservation areas in central and southern Hainan Province, southern Guangdong Province, central Guizhou Province, and southern Beijing were identified as potential future refugia. We suggest long-term monitoring of these areas, which could be important for the population persistence of M. pilosus and biodiversity conservation.

Supplementary Materials

The following supporting information can be downloaded at: https://www.mdpi.com/article/10.3390/ani13111784/s1, Table S1: Myotis pilosus occurrence coordinates in China; Table S2: Analysis of variable contributions for the current suitable habitats of M. pilosus; Figure S1: Correlation analysis based on 26 environmental variables; Figure S2: Distribution pattern of M. pilosus under current climate scenario; Figure S3: Distribution of in situ and ex situ refugia for M. pilosus under different climate scenarios.

Author Contributions

W.G. analyzed the data and wrote the original manuscript; Z.L. collected the occurrence data and prepared the figures; T.L. and J.F. designed the study and revised the manuscript. All authors have read and agreed to the published version of the manuscript.

Funding

This research was supported by the Jilin Provincial Natural Science Foundation (grant number 20230101268JC), the National Natural Science Foundation of China (grant number 32201262), and the Special Foundation for the National Science and Technology Basic research program of China (grant number 2021FY100301).

Institutional Review Board Statement

Not applicable.

Informed Consent Statement

Not applicable.

Data Availability Statement

The data from this study are available from the corresponding authors upon reasonable request.

Acknowledgments

We thank Guanjun Lu, Yang Chang, and Hao Gu for the help in collecting the occurrence data. We also thank Can Ke for the help in environmental data extraction.

Conflicts of Interest

The authors declare no conflict of interest.

References

  1. Shin, Y.J.; Midgley, G.F.; Archer, E.R.; Arneth, A.; Barnes, D.K.; Chan, L.; Hashimoto, S.; Hoegh-Guldberg, O.; Insarov, G.; Leadley, P. Actions to halt biodiversity loss generally benefit the climate. Glob. Chang. Biol. 2022, 28, 2846–2874. [Google Scholar] [CrossRef]
  2. WWF. Living Planet Report 2022—Building a Nature Positive Society; Almond, R.E.A., Grooten, M., Juffe Bignoli, D., Petersen, T., Eds.; WWF: Gland, Switzerland, 2022. [Google Scholar]
  3. Jones, K.R.; Watson, J.E.; Possingham, H.P.; Klein, C.J. Incorporating climate change into spatial conservation prioritisation: A review. Biol. Conserv. 2016, 194, 121–130. [Google Scholar] [CrossRef]
  4. Davis, M.; Faurby, S.; Svenning, J.-C. Mammal diversity will take millions of years to recover from the current biodiversity crisis. Proc. Natl. Acad. Sci. USA 2018, 115, 11262–11267. [Google Scholar] [CrossRef] [PubMed]
  5. Scheel, D.; Vincent, T.; Cameron, G.N. Global warming and the species richness of bats in Texas. Conserv. Biol. 1996, 10, 452–464. [Google Scholar] [CrossRef]
  6. Sachanowicz, K.; Ciechanowski, M. First winter record of the migratory bat Pipistrellus nathusii (Keyserling and Blasius 1839) (Chiroptera: Vespertilionidae) in Poland: Yet more evidence of global warming?/Premiere observation hivernale de la chauve-souris migratrice Pipistrellus nathusii (Keyserling and Blasius 1839) (Chiroptera: Vespertilionidae) en Pologne: Un autre signe du réchauffement de la planete? Mammalia 2006, 70, 168–169. [Google Scholar]
  7. Dool, S.E. Conservation genetic studies in bats. In Conservation Genetics in Mammals: Integrative Research Using Novel Approaches; Ortega, J., Maldonado, J.E., Eds.; Springer: Basel, Switzerland, 2020; pp. 29–62. [Google Scholar]
  8. Jones, G.; Rebelo, H. Responses of bats to climate change: Learning from the past and predicting the future. In Bat Evolution, Ecology, and Conservation; Adams, R.A., Pedersen, S.C., Eds.; Springer: Berlin, Germany, 2013; pp. 457–478. [Google Scholar]
  9. Jones, G.; Jacobs, D.S.; Kunz, T.H.; Willig, M.R.; Racey, P.A. Carpe noctem: The importance of bats as bioindicators. Endanger. Species Res. 2009, 8, 93–115. [Google Scholar] [CrossRef]
  10. Amorim, F.; Mata, V.A.; Beja, P.; Rebelo, H. Effects of a drought episode on the reproductive success of European free-tailed bats (Tadarida teniotis). Mamm. Biol. 2015, 80, 228–236. [Google Scholar] [CrossRef]
  11. Adams, R.A. Bat reproduction declines when conditions mimic climate change projections for western North America. Ecology 2010, 91, 2437–2445. [Google Scholar] [CrossRef]
  12. Lučan, R.; Weiser, M.; Hanák, V. Contrasting effects of climate change on the timing of reproduction and reproductive success of a temperate insectivorous bat. J. Zool. 2013, 290, 151–159. [Google Scholar] [CrossRef]
  13. IUCN. The IUCN Red List of Threatened Species. Version 2022-2. 2023. Available online: https://www.iucnredlist.org (accessed on 10 October 2022).
  14. Frick, W.F.; Kingston, T.; Flanders, J. A review of the major threats and challenges to global bat conservation. Ann. N. Y. Acad. Sci. 2020, 1469, 5–25. [Google Scholar] [CrossRef]
  15. Aizpurua, O.; Alberdi, A. Ecology and evolutionary biology of fishing bats. Mammal Rev. 2018, 48, 284–297. [Google Scholar] [CrossRef]
  16. Ma, J.; Jones, G.; Zhang, S.; Shen, J.; Metzner, W.; Zhang, L.; Liang, B. Dietary analysis confirms that Rickett’s big-footed bat (Myotis ricketti) is a piscivore. J. Zool. 2003, 261, 245–248. [Google Scholar] [CrossRef]
  17. Ma, J.; Zhang, J.; Liang, B.; Zhang, L.; Zhang, S.; Metzner, W. Dietary characteristics of Myotis ricketti in Beijing, north China. J. Mammal. 2006, 87, 339–344. [Google Scholar] [CrossRef]
  18. Chang, Y.; Song, S.; Li, A.; Zhang, Y.; Li, Z.; Xiao, Y.; Jiang, T.; Feng, J.; Lin, A. The roles of morphological traits, resource variation and resource partitioning associated with the dietary niche expansion in the fish-eating bat Myotis pilosus. Mol. Ecol. 2019, 28, 2944–2954. [Google Scholar] [CrossRef]
  19. Jiang, T.L.; Feng, J.; Csorba, G.; Bates, P. Myotis pilosus. In The IUCN Red List of Threatened Species 2019; International Union for Conservation of Nature: Cambridge, UK, 2019; p. E.T14193A22062554. [Google Scholar] [CrossRef]
  20. Jie, M.; Qiang, D.; Shuyi, Z.; Junxian, S.; Bing, L. Distribution of ricketti’s big footed bat (Myotis ricketti). Sichuan Dong Wu Sichuan Dongwu Sichuan J. Zool. 2003, 22, 155–156. [Google Scholar]
  21. Jie, M.; Gareth, J.; Bing, L.; Junxian, S.; Shuyi, Z. Biology of the Bid footed Bat, Myotis ricketti. Chin. J. Zool. 2003, 38, 93–95. [Google Scholar]
  22. Jiang, F.; Zhenxin, L.; Min, C.; Ying, L.; Xichen, Z.; Jiang, Z.; Shuyi, Z. Morphological features, echolocation calls and foraging strategy in the trawling piscivorous bat: Rickett’s big-footed bat Myotis ricketti. Acta Ecol. Sin. 2003, 23, 1712–1718. [Google Scholar]
  23. Thong, V.D.; Limbert, H.; Limbert, D. First Records of Bats (Mammalia: Chiroptera) from the World’s Largest Cave in Vietnam. Diversity 2022, 14, 534. [Google Scholar] [CrossRef]
  24. Dong, D.; Lei, M.; Liu, Y.; Zhang, S. Comparative inner ear transcriptome analysis between the Rickett’s big-footed bats (Myotis ricketti) and the greater short-nosed fruit bats (Cynopterus sphinx). BMC Genom. 2013, 14, 1–10. [Google Scholar] [CrossRef]
  25. Lu, G.; Lin, A.; Luo, J.; Blondel, D.V.; Meiklejohn, K.A.; Sun, K.; Feng, J. Phylogeography of the Rickett’s big-footed bat, Myotis pilosus (Chiroptera: Vespertilionidae): A novel pattern of genetic structure of bats in China. BMC Evol. Biol. 2013, 13, 1–11. [Google Scholar] [CrossRef]
  26. Jiao, H.; Xie, H.-W.; Zhang, L.; Zhuoma, N.; Jiang, P.; Zhao, H. Loss of sweet taste despite the conservation of sweet receptor genes in insectivorous bats. Proc. Natl. Acad. Sci. USA 2021, 118, e2021516118. [Google Scholar] [CrossRef] [PubMed]
  27. Elith, J.; Leathwick, J.R. Species distribution models: Ecological explanation and prediction across space and time. Annu. Rev. Ecol. Evol. Syst. 2009, 40, 677–697. [Google Scholar] [CrossRef]
  28. Deng, X.; Xu, D.; Liao, W.; Wang, R.; Zhuo, Z. Predicting the distributions of Scleroderma guani (Hymenoptera: Bethylidae) under climate change in China. Ecol. Evol. 2022, 12, e9410. [Google Scholar] [CrossRef] [PubMed]
  29. Zhu, G.; Liu, G.; Bu, W.; Gao, Y. Ecological niche modeling and its applications in biodiversity conservation. Biodivers. Sci. 2013, 21, 90. [Google Scholar]
  30. Graham, C.H.; Ferrier, S.; Huettman, F.; Moritz, C.; Peterson, A.T. New developments in museum-based informatics and applications in biodiversity analysis. Trends Ecol. Evol. 2004, 19, 497–503. [Google Scholar] [CrossRef]
  31. Anderson, R.P. A framework for using niche models to estimate impacts of climate change on species distributions. Ann. N. Y. Acad. Sci. 2013, 1297, 8–28. [Google Scholar] [CrossRef]
  32. Dyderski, M.K.; Paź, S.; Frelich, L.E.; Jagodziński, A.M. How much does climate change threaten European forest tree species distributions? Glob. Chang. Biol. 2018, 24, 1150–1163. [Google Scholar] [CrossRef]
  33. Mainali, K.P.; Warren, D.L.; Dhileepan, K.; McConnachie, A.; Strathie, L.; Hassan, G.; Karki, D.; Shrestha, B.B.; Parmesan, C. Projecting future expansion of invasive species: Comparing and improving methodologies for species distribution modeling. Glob. Chang. Biol. 2015, 21, 4464–4480. [Google Scholar] [CrossRef]
  34. Ramirez-Villegas, J.; Cuesta, F.; Devenish, C.; Peralvo, M.; Jarvis, A.; Arnillas, C.A. Using species distributions models for designing conservation strategies of Tropical Andean biodiversity under climate change. J. Nat. Conserv. 2014, 22, 391–404. [Google Scholar] [CrossRef]
  35. Guisan, A.; Rahbek, C. SESAM–a new framework integrating macroecological and species distribution models for predicting spatio-temporal patterns of species assemblages. J. Biogeogr. 2011, 38, 1433–1444. [Google Scholar] [CrossRef]
  36. Guo, Y.; Li, X.; Zhao, Z.; Wei, H.; Gao, B.; Gu, W. Prediction of the potential geographic distribution of the ectomycorrhizal mushroom Tricholoma matsutake under multiple climate change scenarios. Sci. Rep. 2017, 7, 1–11. [Google Scholar] [CrossRef] [PubMed]
  37. McCune, J. Species distribution models predict rare species occurrences despite significant effects of landscape context. J. Appl. Ecol. 2016, 53, 1871–1879. [Google Scholar] [CrossRef]
  38. Phillips, S.J.; Dudík, M. Modeling of species distributions with Maxent: New extensions and a comprehensive evaluation. Ecography 2008, 31, 161–175. [Google Scholar] [CrossRef]
  39. Merow, C.; Silander Jr, J.A. A comparison of Maxlike and Maxent for modelling species distributions. Methods Ecol. Evol. 2014, 5, 215–225. [Google Scholar] [CrossRef]
  40. Harte, J.; Newman, E.A. Maximum information entropy: A foundation for ecological theory. Trends Ecol. Evol. 2014, 29, 384–389. [Google Scholar] [CrossRef]
  41. Phillips, S.J.; Anderson, R.P.; Dudík, M.; Schapire, R.E.; Blair, M.E. Opening the black box: An open-source release of Maxent. Ecography 2017, 40, 887–893. [Google Scholar] [CrossRef]
  42. Otto-Bliesner, B.L.; Marshall, S.J.; Overpeck, J.T.; Miller, G.H.; Hu, A.; CAPE Last Interglacial Project members. Simulating Arctic climate warmth and icefield retreat in the last interglaciation. Science 2006, 311, 1751–1753. [Google Scholar] [CrossRef]
  43. Jubb, I.; Canadell, P.; Dix, M. Representative Concentration Pathways (RCPs); Australian Government, Department of the Environment: Parkes, Australia, 2013.
  44. Araujo, M.B.; Pearson, R.G.; Thuiller, W.; Erhard, M. Validation of species–climate impact models under climate change. Glob. Chang. Biol. 2005, 11, 1504–1513. [Google Scholar] [CrossRef]
  45. Liu, C.; White, M.; Newell, G. Selecting thresholds for the prediction of species occurrence with presence-only data. J. Biogeogr. 2013, 40, 778–789. [Google Scholar] [CrossRef]
  46. Engler, R.; Hordijk, W.; Guisan, A. The MIGCLIM R package–seamless integration of dispersal constraints into projections of species distribution models. Ecography 2012, 35, 872–878. [Google Scholar] [CrossRef]
  47. R Core Team. R: A Language and Environment for Statistical Computing; R Foundation for Statistical Computing: Vienna, Austria, 2023; Available online: https://www.R-project.org/ (accessed on 3 May 2023).
  48. Dupont-Doaré, C.; Alagador, D. Overlooked effects of temporal resolution choice on climate-proof spatial conservation plans for biodiversity. Biol. Conserv. 2021, 263, 109330. [Google Scholar] [CrossRef]
  49. Brambilla, M.; Rubolini, D.; Appukuttan, O.; Calvi, G.; Karger, D.N.; Kmecl, P.; Mihelič, T.; Sattler, T.; Seaman, B.; Teufelbauer, N. Identifying climate refugia for high-elevation Alpine birds under current climate warming predictions. Glob. Chang. Biol. 2022, 28, 4276–4291. [Google Scholar] [CrossRef] [PubMed]
  50. Brambilla, M.; Caprio, E.; Assandri, G.; Scridel, D.; Bassi, E.; Bionda, R.; Celada, C.; Falco, R.; Bogliani, G.; Pedrini, P. A spatially explicit definition of conservation priorities according to population resistance and resilience, species importance and level of threat in a changing climate. Divers. Distrib. 2017, 23, 727–738. [Google Scholar] [CrossRef]
  51. Morelli, T.L.; Barrows, C.W.; Ramirez, A.R.; Cartwright, J.M.; Ackerly, D.D.; Eaves, T.D.; Ebersole, J.L.; Krawchuk, M.A.; Letcher, B.H.; Mahalovich, M.F. Climate-change refugia: Biodiversity in the slow lane. Front. Ecol. Environ. 2020, 18, 228–234. [Google Scholar] [CrossRef]
  52. Liu, T.; Liu, H.; Tong, J.; Yang, Y. Habitat suitability of neotenic net-winged beetles (Coleoptera: Lycidae) in China using combined ecological models, with implications for biological conservation. Divers. Distrib. 2022, 28, 2806–2823. [Google Scholar] [CrossRef]
  53. Cardoso, P.; Erwin, T.L.; Borges, P.A.; New, T.R. The seven impediments in invertebrate conservation and how to overcome them. Biol. Conserv. 2011, 144, 2647–2655. [Google Scholar] [CrossRef]
  54. Gaston, K.J.; Fuller, R.A. The sizes of species’ geographic ranges. J. Appl. Ecol. 2009, 46, 1–9. [Google Scholar] [CrossRef]
  55. Jiang, D.; Goodale, E.; Yang, G.; Yu, L.; Jiang, A.; Luo, X. Modeling the distribution of Nonggang Babbler Stachyris nonggangensis, a threatened bird of limestone karst forests of the Sino-Vietnam border, and implications for its conservation. Bird Conserv. Int. 2020, 30, 75–86. [Google Scholar] [CrossRef]
  56. e Silva, V.d.N.; Pressey, R.L.; Machado, R.B.; VanDerWal, J.; Wiederhecker, H.C.; Werneck, F.P.; Colli, G.R. Formulating conservation targets for a gap analysis of endemic lizards in a biodiversity hotspot. Biol. Conserv. 2014, 180, 1–10. [Google Scholar] [CrossRef]
  57. Phillips, S.J.; Anderson, R.P.; Schapire, R.E. Maximum entropy modeling of species geographic distributions. Ecol. Model. 2006, 190, 231–259. [Google Scholar] [CrossRef]
  58. Pearson, R.G.; Raxworthy, C.J.; Nakamura, M.; Townsend Peterson, A. Predicting species distributions from small numbers of occurrence records: A test case using cryptic geckos in Madagascar. J. Biogeogr. 2007, 34, 102–117. [Google Scholar] [CrossRef]
  59. Ancillotto, L.; Santini, L.; Ranc, N.; Maiorano, L.; Russo, D. Extraordinary range expansion in a common bat: The potential roles of climate change and urbanisation. Sci. Nat. 2016, 103, 1–8. [Google Scholar] [CrossRef] [PubMed]
  60. Wu, J. Detection and attribution of the effects of climate change on bat distributions over the last 50 years. Clim. Chang. 2016, 134, 681–696. [Google Scholar] [CrossRef]
  61. Smeraldo, S.; Bosso, L.; Salinas-Ramos, V.B.; Ancillotto, L.; Sánchez-Cordero, V.; Gazaryan, S.; Russo, D. Generalists yet different: Distributional responses to climate change may vary in opportunistic bat species sharing similar ecological traits. Mammal Rev. 2021, 51, 571–584. [Google Scholar] [CrossRef]
  62. Sherwin, H.A.; Montgomery, W.I.; Lundy, M.G. The impact and implications of climate change for bats. Mammal Rev. 2013, 43, 171–182. [Google Scholar] [CrossRef]
  63. Burles, D.; Brigham, R.; Ring, R.; Reimchen, T. Influence of weather on two insectivorous bats in a temperate Pacific Northwest rainforest. Can. J. Zool. 2009, 87, 132–138. [Google Scholar] [CrossRef]
  64. Anthony, E.; Stack, M.; Kunz, T. Night roosting and the nocturnal time budget of the little brown bat, Myotis lucifugus: Effects of reproductive status, prey density, and environmental conditions. Oecologia 1981, 51, 151–156. [Google Scholar] [CrossRef]
  65. Park, K.J.; Jones, G.; Ransome, R.D. Torpor, arousal and activity of hibernating greater horseshoe bats (Rhinolophus ferrumequinum). Funct. Ecol. 2000, 14, 580–588. [Google Scholar] [CrossRef]
  66. Kurta, A. Torpor patterns in food-deprived Myotis lucifugus (Chiroptera: Vespertilionidae) under simulated roost conditions. Can. J. Zool. 1991, 69, 255–257. [Google Scholar] [CrossRef]
  67. McNab, B.K. Evolutionary alternatives in the physiological ecology of bats. In Ecology of Bats; Springer: Boston, MA, USA, 1982; pp. 151–200. [Google Scholar]
  68. Lundy, M.; Montgomery, I.; Russ, J. Climate change-linked range expansion of Nathusius’ pipistrelle bat, Pipistrellus nathusii (Keyserling & Blasius, 1839). J. Biogeogr. 2010, 37, 2232–2242. [Google Scholar]
  69. Festa, F.; Ancillotto, L.; Santini, L.; Pacifici, M.; Rocha, R.; Toshkova, N.; Amorim, F.; Benítez-López, A.; Domer, A.; Hamidović, D. Bat responses to climate change: A systematic review. Biol. Rev. 2023, 98, 19–33. [Google Scholar] [CrossRef] [PubMed]
  70. Root, T.L.; Price, J.T.; Hall, K.R.; Schneider, S.H.; Rosenzweig, C.; Pounds, J.A. Fingerprints of global warming on wild animals and plants. Nature 2003, 421, 57–60. [Google Scholar] [CrossRef]
  71. Poloczanska, E.S.; Brown, C.J.; Sydeman, W.J.; Kiessling, W.; Schoeman, D.S.; Moore, P.J.; Brander, K.; Bruno, J.F.; Buckley, L.B.; Burrows, M.T. Global imprint of climate change on marine life. Nat. Clim. Chang. 2013, 3, 919–925. [Google Scholar] [CrossRef]
  72. Perry, R.W. Migration and recent range expansion of Seminole bats (Lasiurus seminolus) in the United States. J. Mammal. 2018, 99, 1478–1485. [Google Scholar] [CrossRef]
  73. Blomberg, A.S.; Vasko, V.; Salonen, S.; Pētersons, G.; Lilley, T.M. First record of a Nathusius’ pipistrelle (Pipistrellus nathusii) overwintering at a latitude above 60° N. Mammalia 2021, 85, 74–78. [Google Scholar] [CrossRef]
  74. Salinas-Ramos, V.B.; Agnelli, P.; Bosso, L.; Ancillotto, L.; Russo, D. Body size of Italian greater horseshoe bats (Rhinolophus ferrumequinum) increased over one century and a half: A response to climate change? Mamm. Biol. 2021, 101, 1127–1131. [Google Scholar] [CrossRef]
  75. Stepanian, P.M.; Wainwright, C.E. Ongoing changes in migration phenology and winter residency at Bracken Bat Cave. Glob. Chang. Biol. 2018, 24, 3266–3275. [Google Scholar] [CrossRef]
Figure 1. The distribution points of M. pilosus in China. The map was based on the standard map No. GS (2019) 1822 downloaded from the Standard Mapping Service website of the Natural Resource of the People’s Republic of China (http://bzdt.ch.mnr.gov.cn/, accessed on 10 October 2022). The base map has no modifications, and the geographical coordinate is WGS-84.
Animals 13 01784 g001
Figure 2. (a) Receiver operating characteristic (ROC) curve and AUC values for MaxEnt results averaged over ten replicate runs; (b) Jackknife test of the importance of eleven dominant environmental variables used in the M. pilosus potential distribution modeling.
Animals 13 01784 g002
Figure 3. Response curve of the four most important environmental variables. The x-axis indicates the environmental variable, the y-axis shows the probability of presence, the red curve represents the mean response, and the blue band represents the standard deviation (±SD) calculated from ten replicates.
Animals 13 01784 g003
Figure 4. Potential suitable habitats of M. pilosus in different years and under different climate scenarios. The potential distribution of M. pilosus in (a) current, (b) 2050 RCP2.6, (c) 2070 RCP2.6, (d) 2050 RCP4.5, (e) 2070 RCP4.5, (f) 2050 RCP8.5, and (g) 2070 RCP8.5 conditions.
Animals 13 01784 g004
Figure 5. Dispersal simulation of M. pilosus under three climate scenarios (a) RCP2.6, (b) RCP4.5, (c) RCP8.5.
Animals 13 01784 g005
Figure 6. Centroid shifts under different climate scenarios for M. pilosus. The arrow indicates the direction of the predicted shift over time. Solid lines and dashed lines represent the shifts happen during current–2050 and 2050–2070, respectively. Different colors represent the different climate scenarios.
Animals 13 01784 g006
Figure 7. Distribution of in situ refugia (red) and ex situ refugia (green) in (a) 2050 and (b) 2070. Light blue areas represent the distribution of M. pilosus downloaded from IUCN Red List.
Animals 13 01784 g007
Table 1. Environmental variables used in MaxEnt.
Category of Environmental VariablesEnvironmental VariablesAbbreviation
ClimateAnnual Mean TemperatureBio1
Mean Diurnal RangeBio2
IsothermalityBio3
Temperature SeasonalityBio4
Maximum Temperature of Warmest MonthBio5
Minimum Temperature of Coldest MonthBio6
Temperature Annual RangeBio7
Mean Temperature of Wettest QuarterBio8
Mean Temperature of Driest QuarterBio9
Mean Temperature of Warmest QuarterBio10
Mean Temperature of Coldest QuarterBio11
Annual PrecipitationBio12
Precipitation of Wettest MonthBio13
Precipitation of Driest MonthBio14
Precipitation SeasonalityBio15
Precipitation of Wettest QuarterBio16
Precipitation of Driest QuarterBio17
Precipitation of Warmest QuarterBio18
Precipitation of Coldest QuarterBio19
Land cover and vegetationLand Use TypeLanduse
Normalized Vegetation IndexNDVI
Percent Tree CoverTREE
TerrainAltitude
Slope
Aspect
Light indexNight Light BrightnessLight
Human disturbanceHuman Influence IndexHii
Distance to SettlementsDis_set
Distance to RoadsDis_roa
RiverDistance to FreshwaterDis_riv
Table 2. Dominant environmental variables and their contributions.
Environmental VariablePercent Contribution (%)Permutation Importance (%)
Bio625.952
Bio1616.10.6
TREE15.814.4
Bio1414.60.9
Slope7.110.9
Light6.53.8
Landuse6.21.3
Dis_riv2.56.1
Bio1524.2
Aspect1.71.5
Dis_set1.64.4
Table 3. Altitude and area of M. pilosus suitable habitats under current and future climate scenarios.
YearsClimate
Scenario
Altitude (m)Area (×104 km2)
Average AltitudeHighly Suitable HabitatsModerately Suitable HabitatsLowly Suitable HabitatsTotal AreaSuitable Habitats with Limited Dispersal
Current-648.19 5.7434.82119.98160.54-
2050RCP2.6681.94 6.8739.15123.55169.5894.00
RCP4.5698.58 6.9240.71123.86171.4895.00
RCP8.5692.79 7.4938.00124.25169.7494.14
2070RCP2.6678.94 6.9741.15123.35171.47154.16
RCP4.5687.75 7.6741.14124.86173.67155.16
RCP8.5708.56 9.7041.43127.87179.00156.99
Table 4. The area of climate refugia under different climate scenarios for M. pilosus.
Climate
Scenario
In Situ Refugia Area/(×104 km2)Ex Situ Refugia Area/(×104 km2)
2050207020502070
RCP2.63.874.770.861.22
RCP4.53.804.760.921.74
RCP8.53.774.511.363.55
Disclaimer/Publisher’s Note: The statements, opinions and data contained in all publications are solely those of the individual author(s) and contributor(s) and not of MDPI and/or the editor(s). MDPI and/or the editor(s) disclaim responsibility for any injury to people or property resulting from any ideas, methods, instructions or products referred to in the content.

