Associations between Dietary Fatty Acid Profile and Milk Fat Production and Fatty Acid Composition in Dairy Cows: A Meta-Analysis
Abstract
Simple Summary
Abstract
1. Introduction
2. Materials and Methods
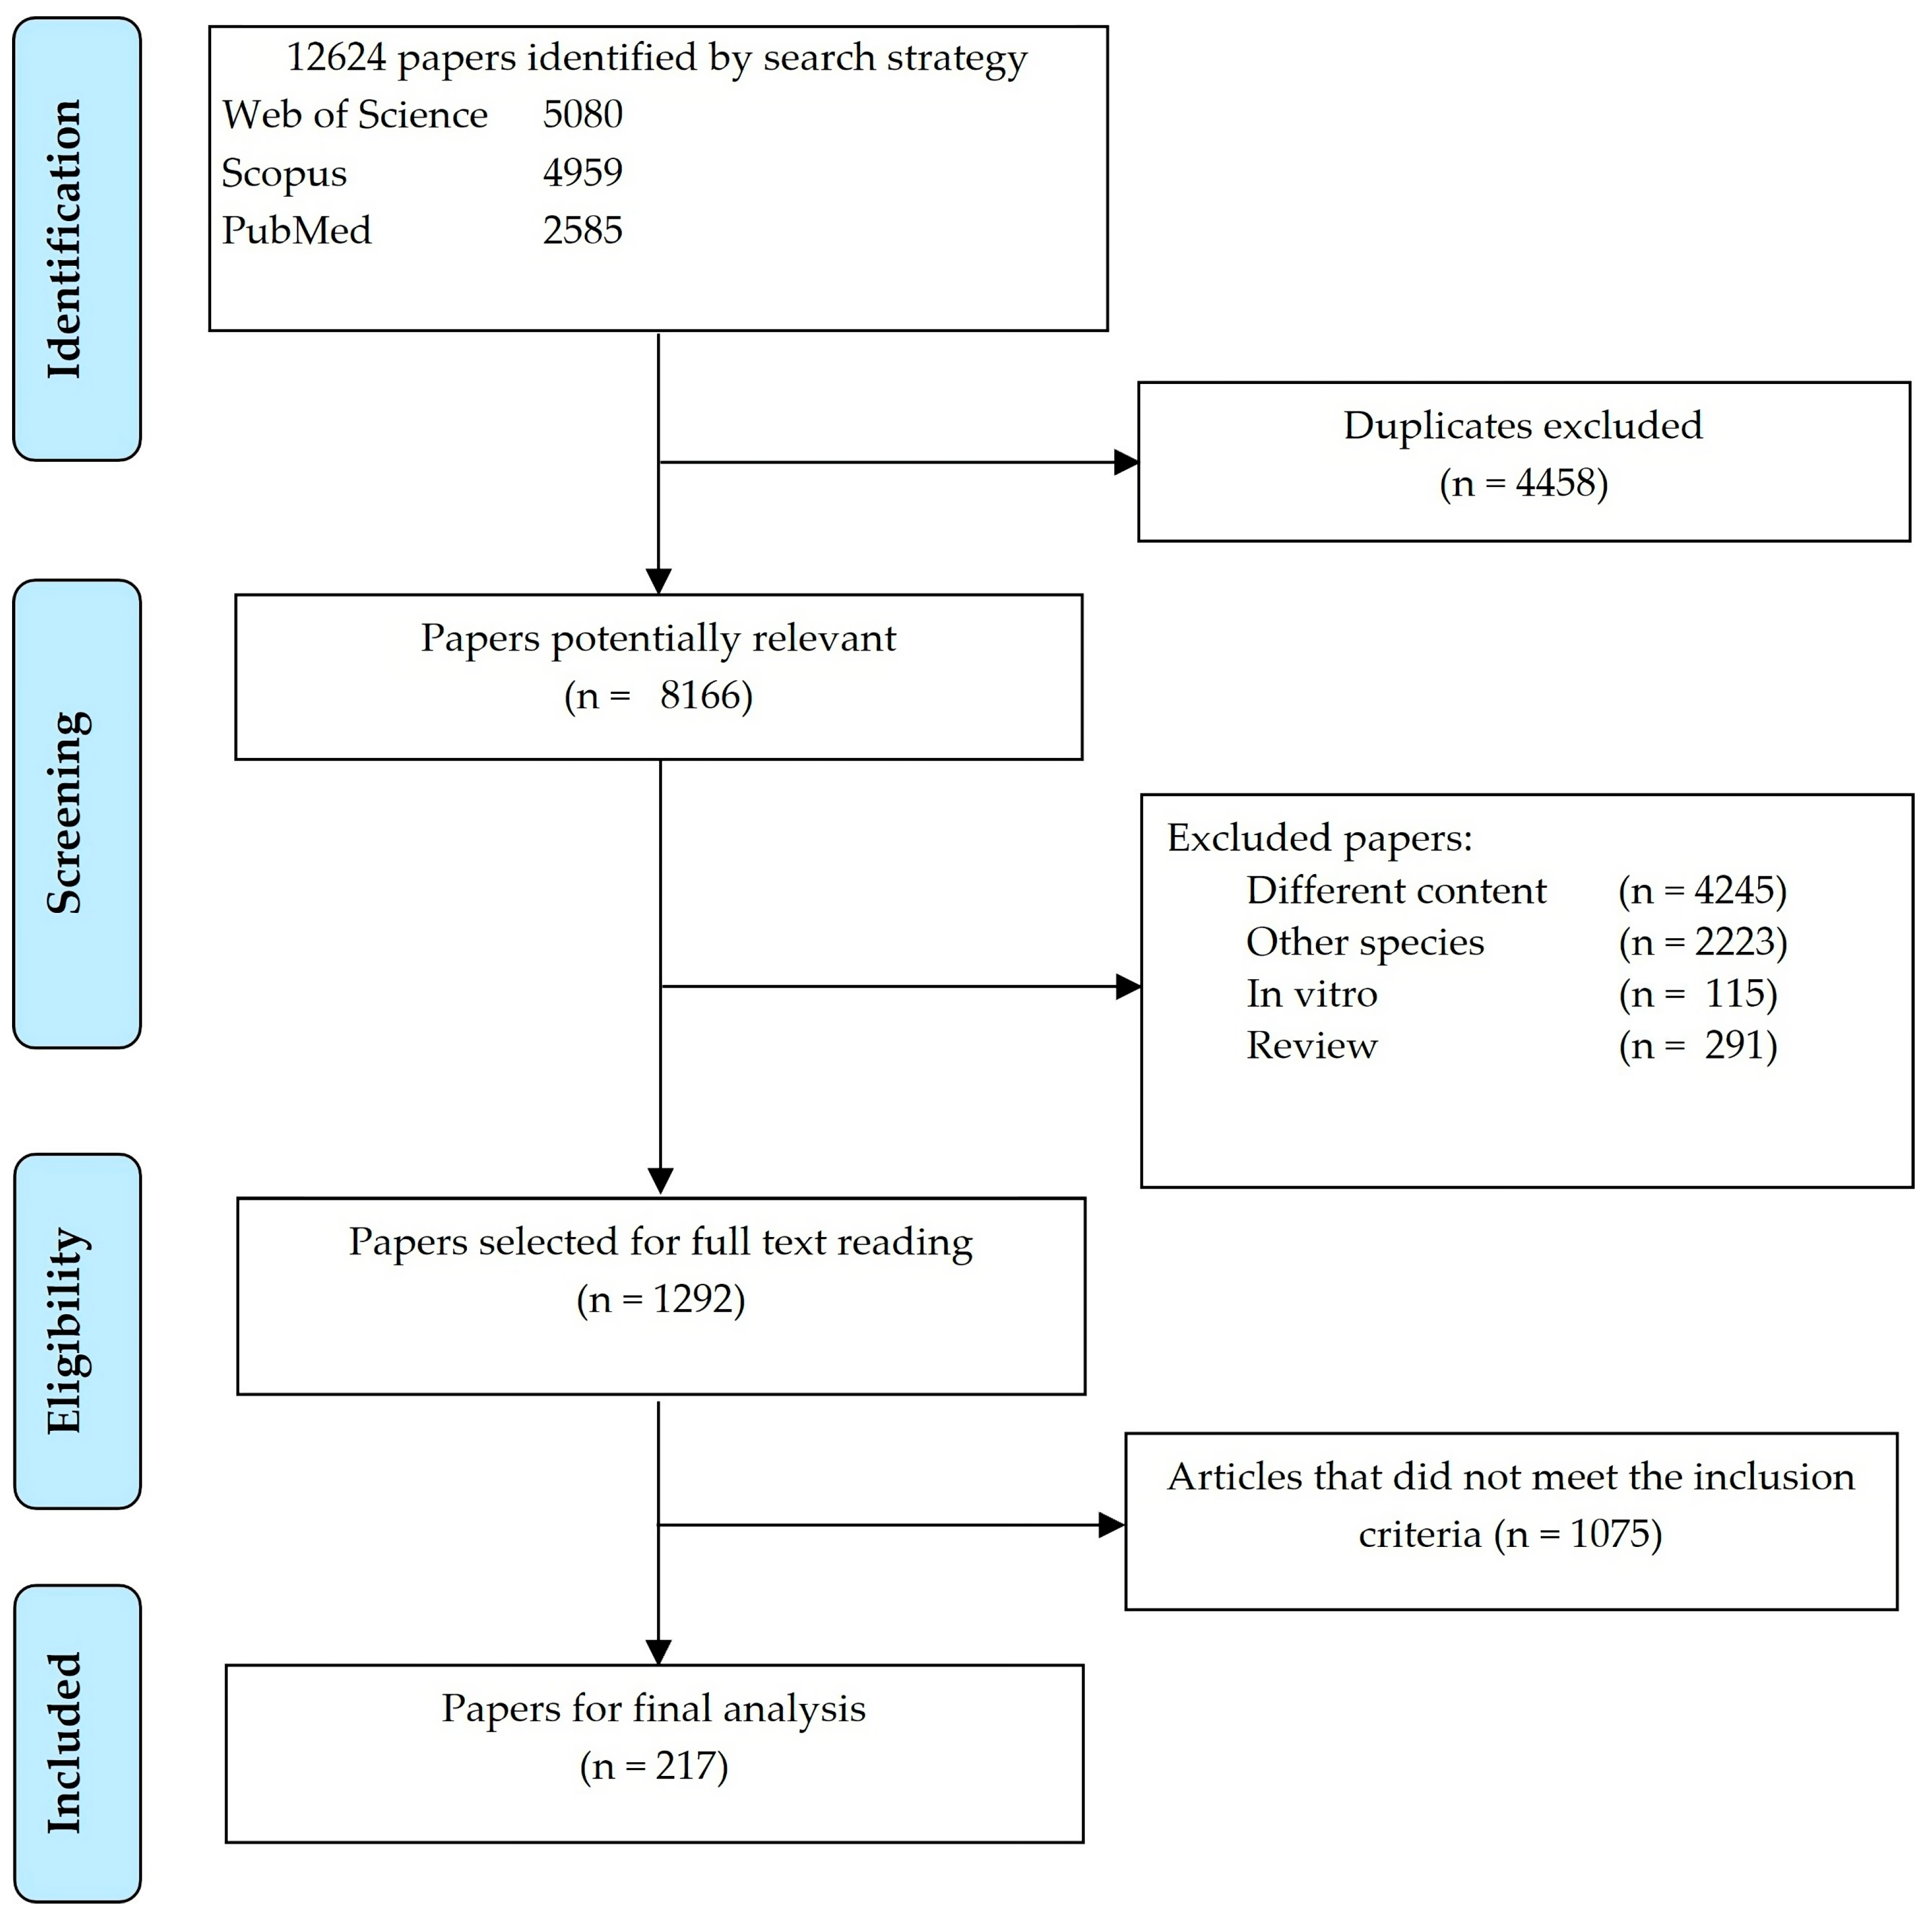
2.1. Literature Search
2.2. Data Extraction
2.3. Data Analysis
2.3.1. Effect Size
2.3.2. Meta-Regression
3. Results
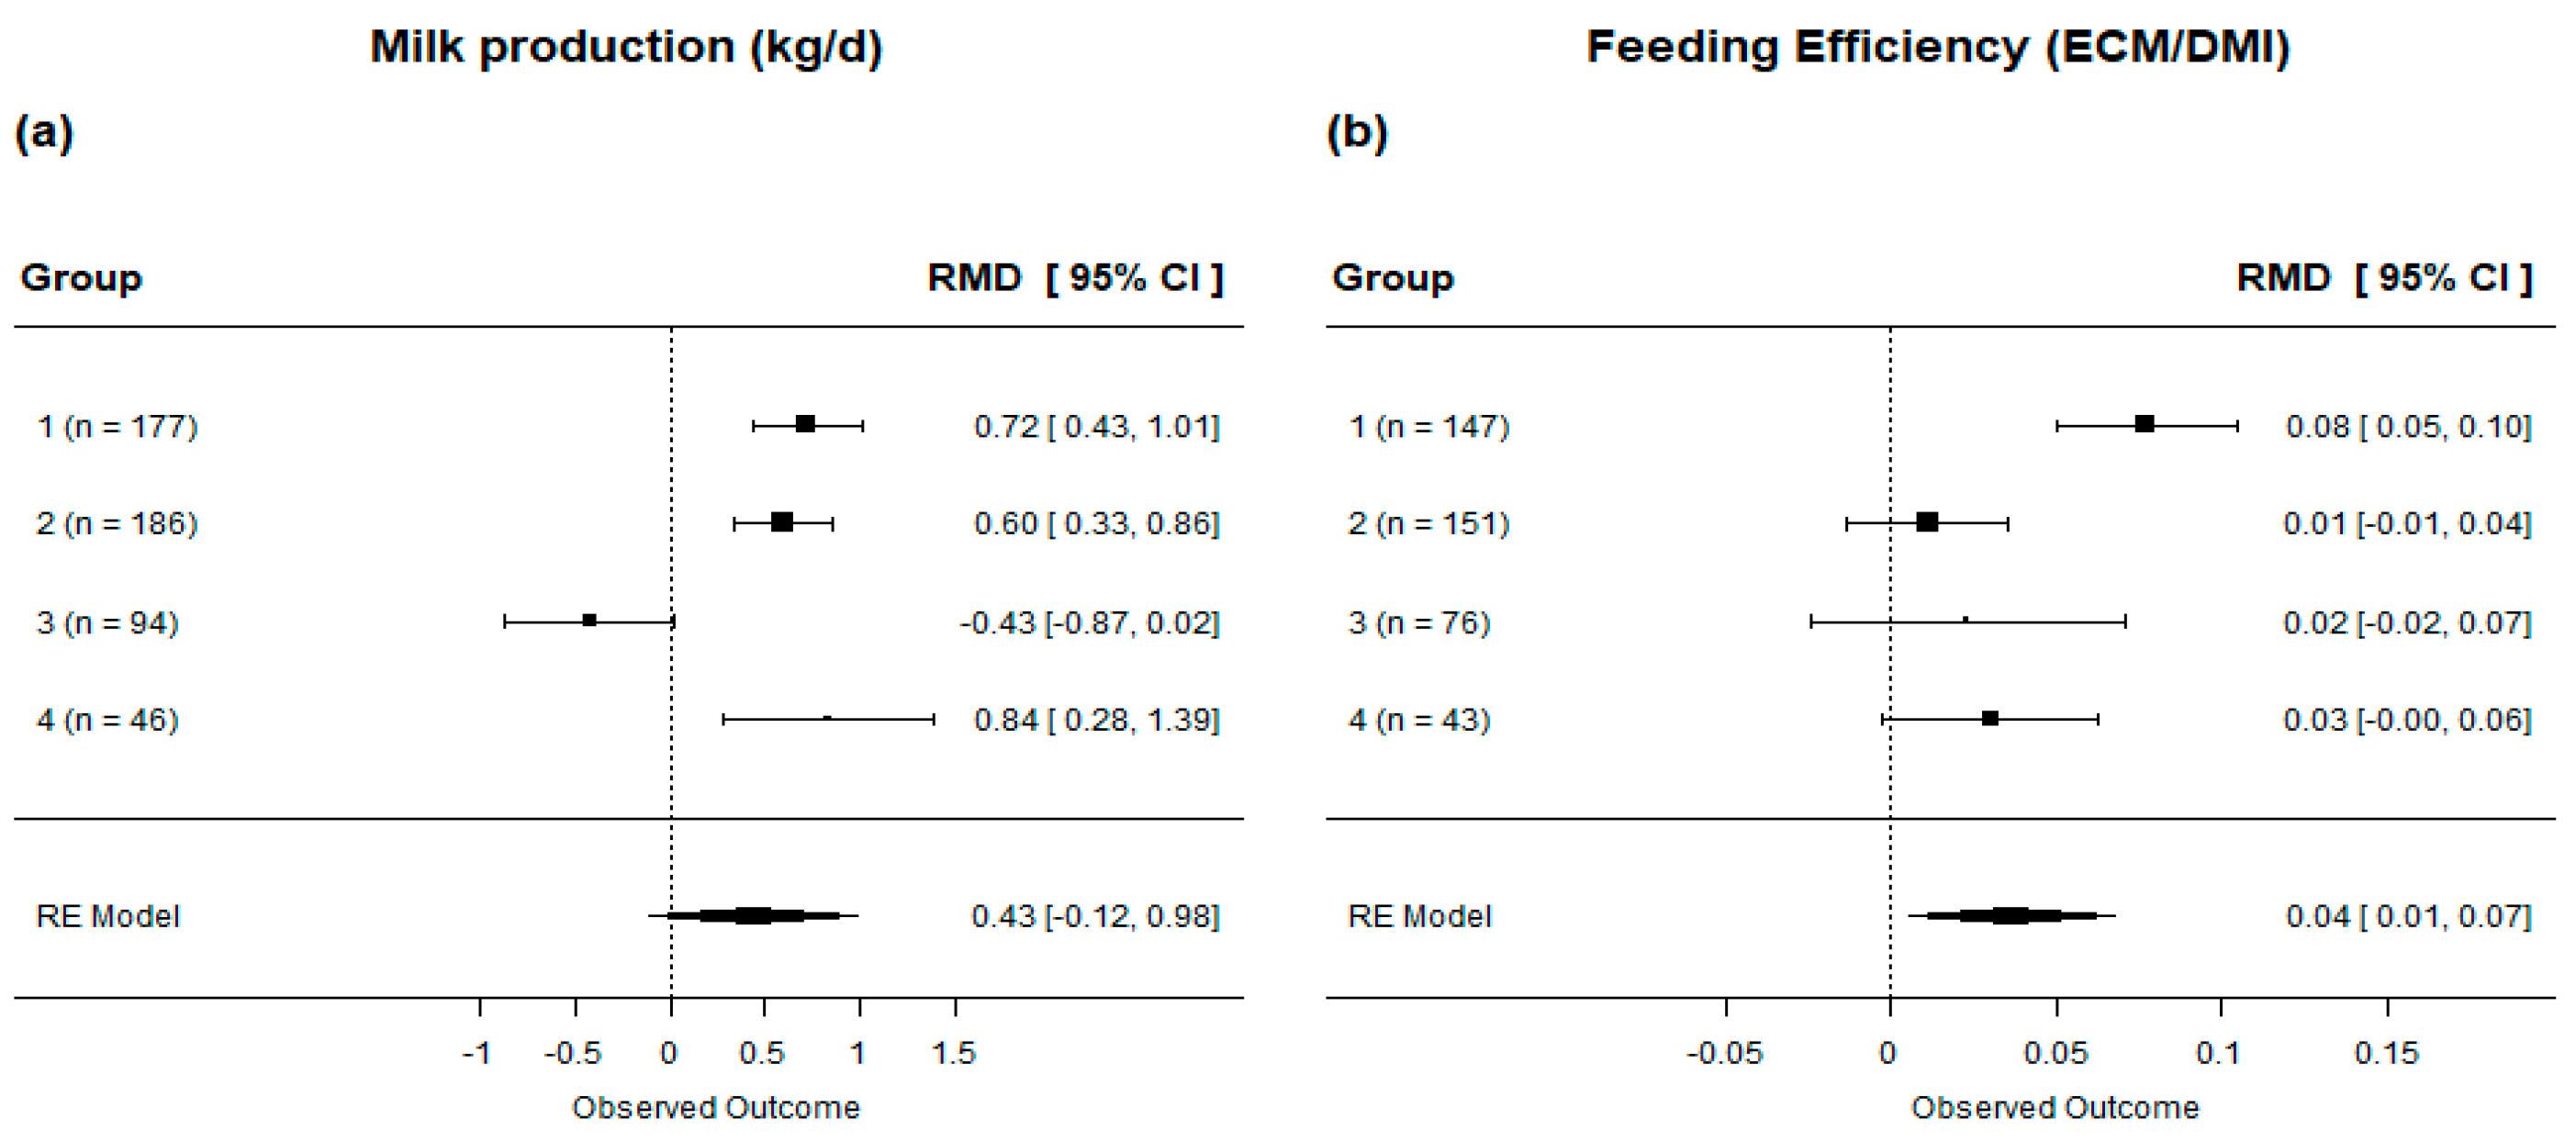
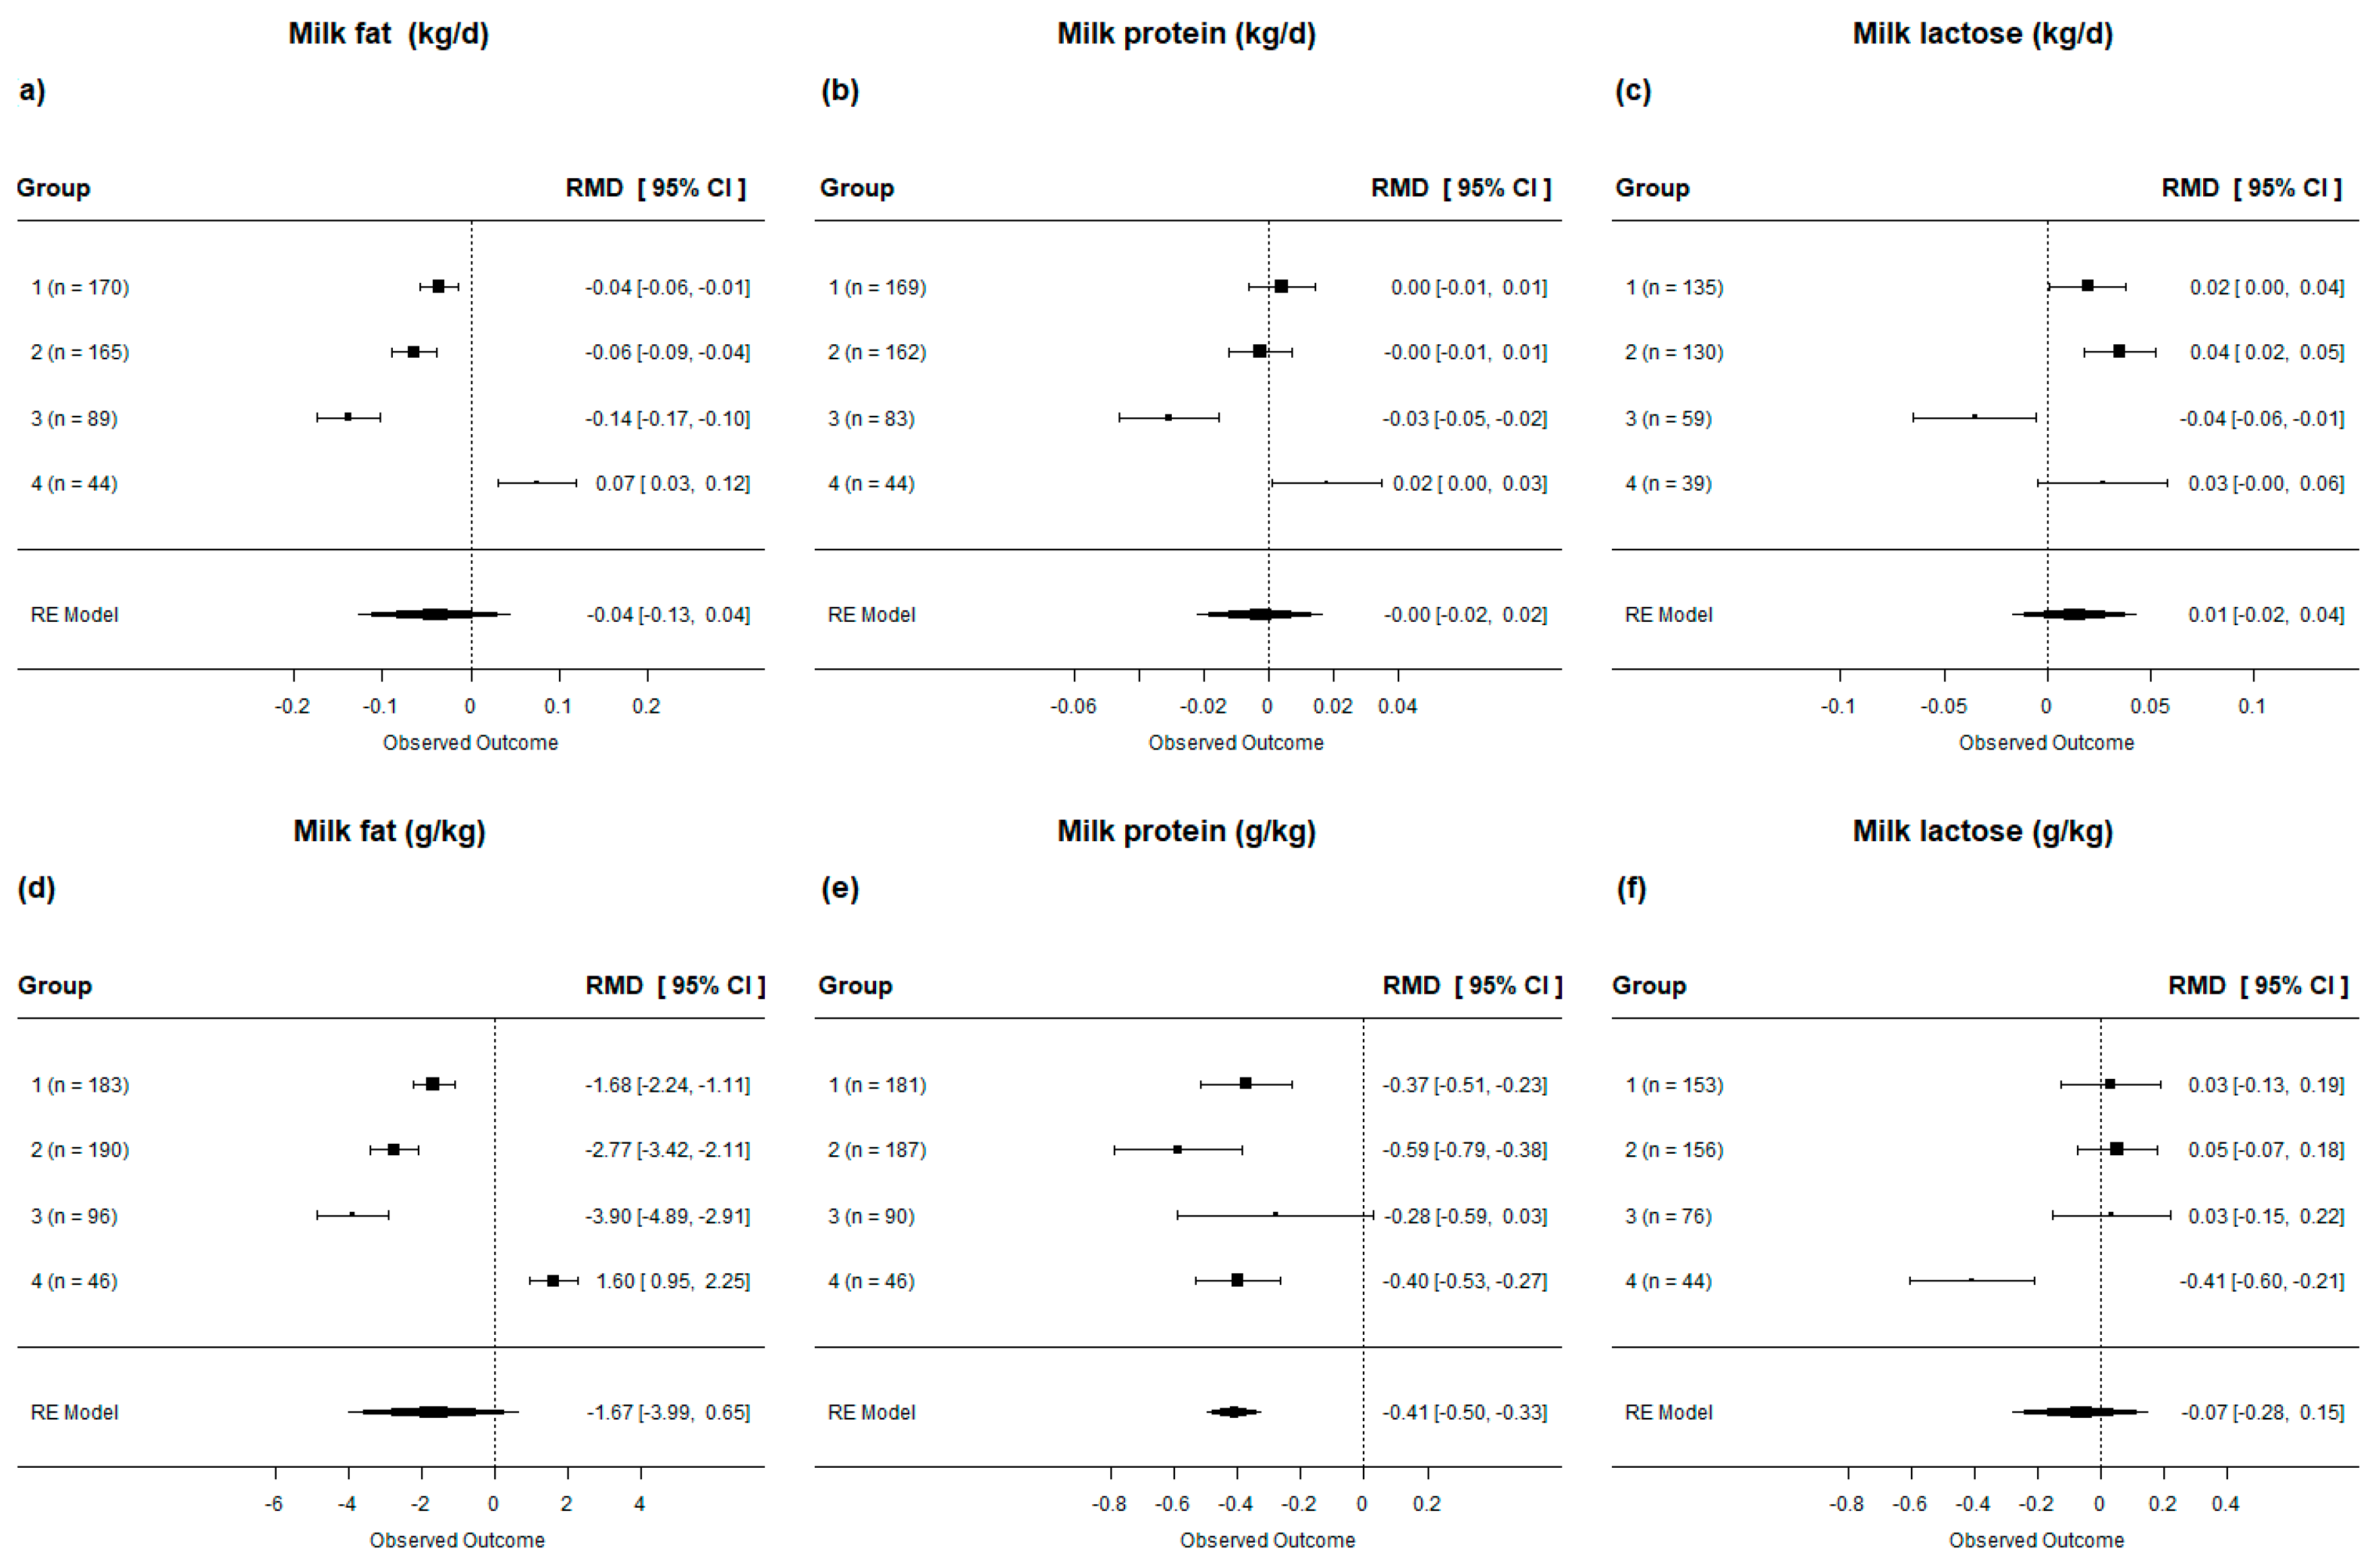
3.1. Effect Size Meta-Analysis
3.2. Meta-Regression
4. Discussion
4.1. Meta-Analysis—Effect Size
4.2. Meta-Regression
5. Conclusions
Supplementary Materials
Author Contributions
Funding
Institutional Review Board Statement
Informed Consent Statement
Data Availability Statement
Acknowledgments
Conflicts of Interest
References
- McCandlish, A.C. The Use of Cottonseed Meal to Increase the Percentage of Fat in Milk. J. Dairy Sci. 1921, 4, 310–333. [Google Scholar] [CrossRef]
- Cranfield, H.T.; Taylor, M.G.D. The effect of feeding on the composition of milk and butter: Linseed cake and hempseed cake. Analyst 1915, 40, 433–439. [Google Scholar] [CrossRef]
- Curtis, G.W. Effect of cotton seed and cotton seed meal on butter product. In Texas FARMER Collection; State Printing Office: Austin, TX, USA, 1890; Volume 11. [Google Scholar]
- Palmquist, D.L.; Jenkins, T.C. Fat in Lactation Rations1, 2: Review. J. Dairy Sci. 1980, 63, 1–14. [Google Scholar] [CrossRef]
- NASEM. Nutrient Requirements of Dairy Cattle: Eighth Revised Edition; The National Academies Press: Washington, DC, USA, 2021; p. 502. [Google Scholar]
- Rasooly, A.; Herold, K.E. Analytical Methods|Biosensors. In Encyclopedia of Dairy Sciences, 2nd ed.; Fuquay, J.W., Ed.; Academic Press: San Diego, CA, USA, 2011; pp. 235–247. [Google Scholar]
- Bauman, D.E.; Harvatine, K.J.; Lock, A.L. Nutrigenomics, Rumen-Derived Bioactive Fatty Acids, and the Regulation of Milk Fat Synthesis. Annual Review of Nutrition; Annual Reviews Inc.: Palo Alto, 2011. [Google Scholar] [CrossRef]
- Neville, M.C.; Picciano, M.F. Regulation of Milk Lipid Secretion and Composition. Annu. Rev. Nutr. 1997, 17, 159–184. [Google Scholar] [CrossRef]
- Osorio, J.S.; Lohakare, J.; Bionaz, M. Biosynthesis of milk fat, protein, and lactose: Roles of transcriptional and posttranscriptional regulation. Physiol. Genom. 2016, 48, 231–256. [Google Scholar] [CrossRef]
- Bauman, D.E.; Griinari, J.M. Nutritional regulation of milk fat synthesis. Annu. Rev. Nutr. 2003, 23, 203–227. [Google Scholar] [CrossRef]
- Harvatine, K.J.; Bauman, D.E.; McGuire, M.A. Mammary Gland, Milk Biosynthesis and Secretion: Milk Fat. In Encyclopedia of Dairy Sciences, 3rd ed.; McSweeney, P.L.H., McNamara, J.P., Eds.; Academic Press: Oxford, UK, 2022; pp. 190–197. [Google Scholar]
- dos Santos Neto, J.M.; de Souza, J.; Lock, A.L. Effects of calcium salts of palm fatty acids on nutrient digestibility and production responses of lactating dairy cows: A meta-analysis and meta-regression. J. Dairy Sci. 2021, 104, 9752–9768. [Google Scholar] [CrossRef]
- Hu, W.; Boerman, J.P.; Aldrich, J.M. Production responses of Holstein dairy cows when fed supplemental fat containing saturated free fatty acids: A meta-analysis. Asian-Australas. J. Anim. Sci. 2017, 30, 1105–1116. [Google Scholar] [CrossRef] [PubMed]
- Rabiee, A.R.; Breinhild, K.; Scott, W.; Golder, H.M.; Block, E.; Lean, I.J. Effect of fat additions to diets of dairy cattle on milk production and components: A meta-analysis and meta-regression. J. Dairy Sci. 2012, 95, 3225–3247. [Google Scholar] [CrossRef]
- Glasser, F.; Ferlay, A.; Chilliard, Y. Oilseed Lipid Supplements and Fatty Acid Composition of Cow Milk: A Meta-Analysis. J. Dairy Sci. 2008, 91, 4687–4703. [Google Scholar] [CrossRef]
- Viechtbauer, W. Conducting Meta-Analyses inRwith themetaforPackage. J. Stat. Softw. 2010, 36, 1–48. [Google Scholar] [CrossRef]
- DerSimonian, R.; Laird, N. Meta-analysis in clinical trials. Control Clin. Trials 1986, 7, 177–188. [Google Scholar] [CrossRef] [PubMed]
- Higgins, J.P.T.; Thompson, S.G.; Deeks, J.J.; Altman, D.G. Measuring inconsistency in meta-analyses. BMJ 2003, 327, 557–560. [Google Scholar] [CrossRef] [PubMed]
- Oliveira, A.S.; Weinberg, Z.G.; Ogunade, I.M.; Cervantes, A.A.P.; Arriola, K.G.; Jiang, Y.; Kim, D.; Li, X.J.; Goncalves, M.C.M.; Vyas, D.; et al. Meta-analysis of effects of inoculation with homofermentative and facultative heterofermentative lactic acid bacteria on silage fermentation, aerobic stability, and the performance of dairy cows. J. Dairy Sci. 2017, 100, 4587–4603. [Google Scholar] [CrossRef]
- Light, R.J.; Pillemer, D.B. Summing Up: The Science of Reviewing Research Harvard University Press: Cambridge, MA, 1984, xiii+191 pp. Educ. Res. 1986, 15, 16–17. [Google Scholar] [CrossRef]
- Egger, M.; Davey Smith, G.; Schneider, M.; Minder, C. Bias in meta-analysis detected by a simple, graphical test. BMJ 1997, 315, 629–634. [Google Scholar] [CrossRef]
- Shepardson, R.P.; Harvatine, K.J. Effects of fat supplements containing different levels of palmitic and stearic acid on milk production and fatty acid digestibility in lactating dairy cows. J. Dairy Sci. 2021, 104, 7682–7695. [Google Scholar] [CrossRef]
- Oliveira, M.X.S.; Palma, A.S.V.; Reis, B.R.; Franco, C.S.R.; Marconi, A.P.S.; Shiozaki, F.A.; Reis, L.G.; Salles, M.S.V.; Netto, A.S. Inclusion of soybean and linseed oils in the diet of lactating dairy cows makes the milk fatty acid profile nutritionally healthier for the human diet. PLoS ONE 2021, 16, e0246357. [Google Scholar] [CrossRef]
- Mahdavi, A.; Mahdavi, A.; Darabighane, B.; Mead, A.; Lee, M.R.F. Effects of soybean oil supplement to diets of lactating dairy cows, on productive performance, and milk fat acids profile: A meta-analysis. Ital. J. Anim. Sci. 2019, 18, 809–819. [Google Scholar] [CrossRef]
- Weld, K.A.; Armentano, L.E. The effects of adding fat to diets of lactating dairy cows on total-tract neutral detergent fiber digestibility: A meta-analysis. J. Dairy Sci. 2017, 100, 1766–1779. [Google Scholar] [CrossRef]
- Allen, M.S. Effects of diet on short-term regulation of feed intake by lactating dairy cattle. J. Dairy Sci. 2000, 83, 1598–1624. [Google Scholar] [CrossRef]
- Peterson, D.G.; Matitashvili, E.A.; Bauman, D.E. The Inhibitory Effect of trans-10, cis-12 CLA on Lipid Synthesis in Bovine Mammary Epithelial Cells Involves Reduced Proteolytic Activation of the Transcription Factor SREBP-1. J. Nutr. 2004, 134, 2523–2527. [Google Scholar] [CrossRef]
- Prom, C.M.; Lock, A.L. Replacing stearic acid with oleic acid in supplemental fat blends improves fatty acid digestibility of lactating dairy cows. J. Dairy Sci. 2021, 104, 9956–9966. [Google Scholar] [CrossRef] [PubMed]
- de Souza, J.; Prom, C.M.; Lock, A.L. Altering the ratio of dietary palmitic and oleic acids affects production responses during the immediate postpartum and carryover periods in dairy cows. J. Dairy Sci. 2021, 104, 2896–2909. [Google Scholar] [CrossRef] [PubMed]
- de Souza, J.; Lock, A.L. Effects of timing of palmitic acid supplementation on production responses of early-lactation dairy cows. J. Dairy Sci. 2019, 102, 260–273. [Google Scholar] [CrossRef]
- MacGibbon, A.K.H.; Haddadian, Z. Fatty Acids. In Encyclopedia of Dairy Sciences, 3rd ed.; McSweeney, P.L.H., McNamara, J.P., Eds.; Academic Press: Oxford, UK, 2022; pp. 808–813. [Google Scholar]
- Brossillon, V.; Reis, S.F.; Moura, D.C.; Galvao, J.G.B.; Oliveira, A.S.; Cortes, C.; Brito, A.F. Production, milk and plasma fatty acid profile, and nutrient utilization in Jersey cows fed flaxseed oil and corn grain with different particle size. J. Dairy Sci. 2018, 101, 2127–2143. [Google Scholar] [CrossRef] [PubMed]
- Hristov, A.N.; Price, W.J.; Shafii, B. A Meta-Analysis on the Relationship Between Intake of Nutrients and Body Weight with Milk Volume and Milk Protein Yield in Dairy Cows. J. Dairy Sci. 2005, 88, 2860–2869. [Google Scholar] [CrossRef] [PubMed]
- Ungerfeld, E.M.; Urrutia, N.L.; Vasconez-Montufar, C.; Morales, R. Factors associated with the content of mammary-synthesized fatty acids in milk fat: A meta-analysis. J. Dairy Sci. 2019, 102, 4105–4117. [Google Scholar] [CrossRef] [PubMed]
- Maxin, G.; Rulquin, H.; Glasser, F. Response of milk fat concentration and yield to nutrient supply in dairy cows. Animal 2011, 5, 1299–1310. [Google Scholar] [CrossRef]
- Daley, V.L.; Armentano, L.E.; Hanigan, M.D. Models to predict milk fat concentration and yield of lactating dairy cows: A meta-analysis. J. Dairy Sci. 2022, 105, 8016–8035. [Google Scholar] [CrossRef]



| Control Diets | Lipid-Supplemented Diets | |||||||||
|---|---|---|---|---|---|---|---|---|---|---|
| Nutrients | n 5 | Mean | SD 6 | Min 7 | Max 8 | n | Mean | SD | Min | Max |
| Composition (g/kg of dry matter (DM)) | ||||||||||
| Forage diet | 452 | 521.8 | 93.3 | 300.0 | 870.0 | 452 | 519.7 | 94.4 | 250.0 | 870.0 |
| Crude protein (CP) | 423 | 168.1 | 14.6 | 122.0 | 210.0 | 420 | 167.2 | 15.3 | 121.0 | 213.1 |
| Neutral detergent fiber (NDF) | 420 | 337.4 | 50.2 | 250.0 | 536.0 | 416 | 333.0 | 52.2 | 175.0 | 536.0 |
| FA | 515 | 26.0 | 9.40 | 8.0 | 87.0 | 515 | 47.6 | 14.3 | 13.8 | 97.4 |
| C12:0 | 282 | 0.42 | 0.61 | 0.01 | 4.46 | 282 | 0.97 | 2.18 | 0.01 | 22.1 |
| C14:0 | 390 | 0.28 | 0.48 | 0.02 | 4.47 | 389 | 0.57 | 1.02 | 0.04 | 8.5 |
| C16:0 | 512 | 4.73 | 2.37 | 1.38 | 23.0 | 512 | 8.65 | 4.93 | 2.42 | 47.9 |
| C16:1 | 328 | 0.16 | 0.11 | 0.01 | 0.78 | 333 | 0.35 | 0.34 | 0.02 | 2.99 |
| C18:0 | 508 | 0.88 | 1.05 | 0.25 | 11.63 | 508 | 1.92 | 2.19 | 0.11 | 21.9 |
| C18:1 | 511 | 4.40 | 2.86 | 0.22 | 30.35 | 515 | 8.9 | 5.90 | 0.32 | 61.0 |
| C18:2 | 515 | 9.82 | 4.44 | 2.63 | 32.0 | 515 | 16.34 | 7.44 | 1.40 | 44.45 |
| C18:3 | 510 | 3.29 | 2.59 | 0.05 | 18.1 | 508 | 6.58 | 6.25 | 0.01 | 39.3 |
| SFA 1 | 515 | 6.08 | 3.34 | 0.31 | 32.65 | 515 | 11.57 | 6.38 | 0.40 | 51.39 |
| UFA 2 | 515 | 17.66 | 6.76 | 5.99 | 51.29 | 515 | 33.72 | 13.01 | 8.42 | 83.57 |
| MUFA 3 | 515 | 4.47 | 2.88 | 0.22 | 30.35 | 515 | 9.13 | 5.88 | 0.38 | 61.0 |
| PUFA 4 | 515 | 13.19 | 5.19 | 3.96 | 33.3 | 515 | 24.6 | 10.84 | 3.5 | 78.14 |
| Item | Control Diets | Lipid-Supplemented Diets | ||||||||
|---|---|---|---|---|---|---|---|---|---|---|
| n 1 | Mean | SD 2 | Min 3 | Max 4 | n | Mean | SD | Min | Max | |
| Nutrient intake and digestibility | ||||||||||
| DMI 5, kg/d | 451 | 21.86 | 4.18 | 10.8 | 30.6 | 451 | 21.17 | 4.36 | 9.60 | 30.9 |
| CP 6 intake, kg/d | 86 | 3.33 | 0.83 | 1.85 | 5.15 | 86 | 3.22 | 0.96 | 1.80 | 6.50 |
| NDF 7 intake, kg/d | 116 | 7.53 | 1.47 | 4.26 | 10.5 | 116 | 7.10 | 1.46 | 3.65 | 10.2 |
| DM 8 digestibility, % | 113 | 67.34 | 3.83 | 58.2 | 74.7 | 113 | 67.43 | 4.03 | 58.1 | 75.3 |
| CP digestibility, % | 81 | 67.30 | 5.67 | 54.5 | 79.8 | 81 | 68.15 | 5.79 | 53.1 | 77.6 |
| NDF digestibility, % | 137 | 48.60 | 8.63 | 29.0 | 67.8 | 137 | 48.50 | 8.87 | 28.1 | 70.7 |
| Ruminal fermentation | ||||||||||
| Acetate, mol/100 mol | 104 | 62.70 | 6.08 | 42.4 | 72.8 | 104 | 61.9 | 6.50 | 37.1 | 72.3 |
| Propionate, mol/100 mol | 104 | 20.44 | 3.55 | 13.9 | 35.2 | 104 | 21.0 | 3.63 | 12.8 | 35.3 |
| Butyrate, mol/100 mol | 102 | 11.73 | 2.19 | 8.03 | 19.3 | 102 | 11.72 | 2.29 | 6.4 | 18.6 |
| Animal performance | ||||||||||
| Body weight, kg | 167 | 631.0 | 79.2 | 351 | 748 | 167 | 628.5 | 82.1 | 337 | 780 |
| Days in milk, d | 449 | 109 | 59.2 | 1 | 273 | 449 | 109 | 59.2 | 1 | 273 |
| Milk production, kg/d | 503 | 30.7 | 8.21 | 10.2 | 55.0 | 503 | 31.1 | 8.55 | 9.1 | 58.3 |
| Feed efficiency, ECM 9/DMI | 417 | 1.42 | 0.25 | 0.77 | 2.70 | 417 | 1.44 | 0.26 | 0.62 | 2.72 |
| Milk fat, kg/d | 468 | 1.11 | 0.30 | 0.39 | 2.22 | 468 | 1.06 | 0.34 | 0.31 | 2.31 |
| Milk protein, kg/d | 458 | 0.98 | 0.25 | 0.33 | 1.66 | 458 | 0.97 | 0.26 | 0.31 | 1.85 |
| Milk lactose, kg/d | 363 | 1.48 | 0.44 | 0.46 | 2.81 | 363 | 1.49 | 0.45 | 0.48 | 2.87 |
| Milk fat, g/kg | 515 | 36.71 | 4.58 | 24.0 | 61.0 | 515 | 34.43 | 6.19 | 14.4 | 58.3 |
| Milk protein, g/kg | 504 | 32.09 | 2.36 | 26.3 | 40.4 | 504 | 31.63 | 2.4 | 26.0 | 41.4 |
| Milk lactose, g/kg | 429 | 47.3 | 2.24 | 41.3 | 55.0 | 429 | 47.2 | 2.25 | 39.5 | 55.3 |
| Milk fatty acid profile, g/100 g FA | ||||||||||
| C12:0 | 359 | 3.60 | 0.84 | 1.71 | 7.1 | 359 | 2.77 | 0.83 | 0.88 | 6.0 |
| C14:0 | 371 | 11.7 | 1.77 | 6.44 | 16.7 | 371 | 9.90 | 1.91 | 3.9 | 15.1 |
| C16:0 | 392 | 31.15 | 4.32 | 16.0 | 46.1 | 392 | 26.80 | 5.64 | 15.0 | 48.8 |
| C18:0 | 395 | 10.10 | 3.17 | 3.1 | 24.5 | 395 | 12.0 | 4.13 | 1.95 | 30.3 |
| C18:1 | 347 | 18.60 | 4.12 | 3.1 | 31.5 | 347 | 21.50 | 5.53 | 1.38 | 36.2 |
| CLA 10 (cis 9, trans 11) | 330 | 0.55 | 0.29 | 0.11 | 2.33 | 330 | 1.02 | 0.77 | 0.15 | 5.15 |
| De novo | 110 | 25.82 | 3.88 | 13.8 | 31.2 | 110 | 21.79 | 4.20 | 8.19 | 30.0 |
| Mixed | 97 | 33.90 | 5.17 | 22.3 | 51.0 | 97 | 32.72 | 6.62 | 20.8 | 51.2 |
| Preformed | 94 | 39.65 | 7.48 | 19.5 | 54.8 | 94 | 43.67 | 8.91 | 25.1 | 61.8 |
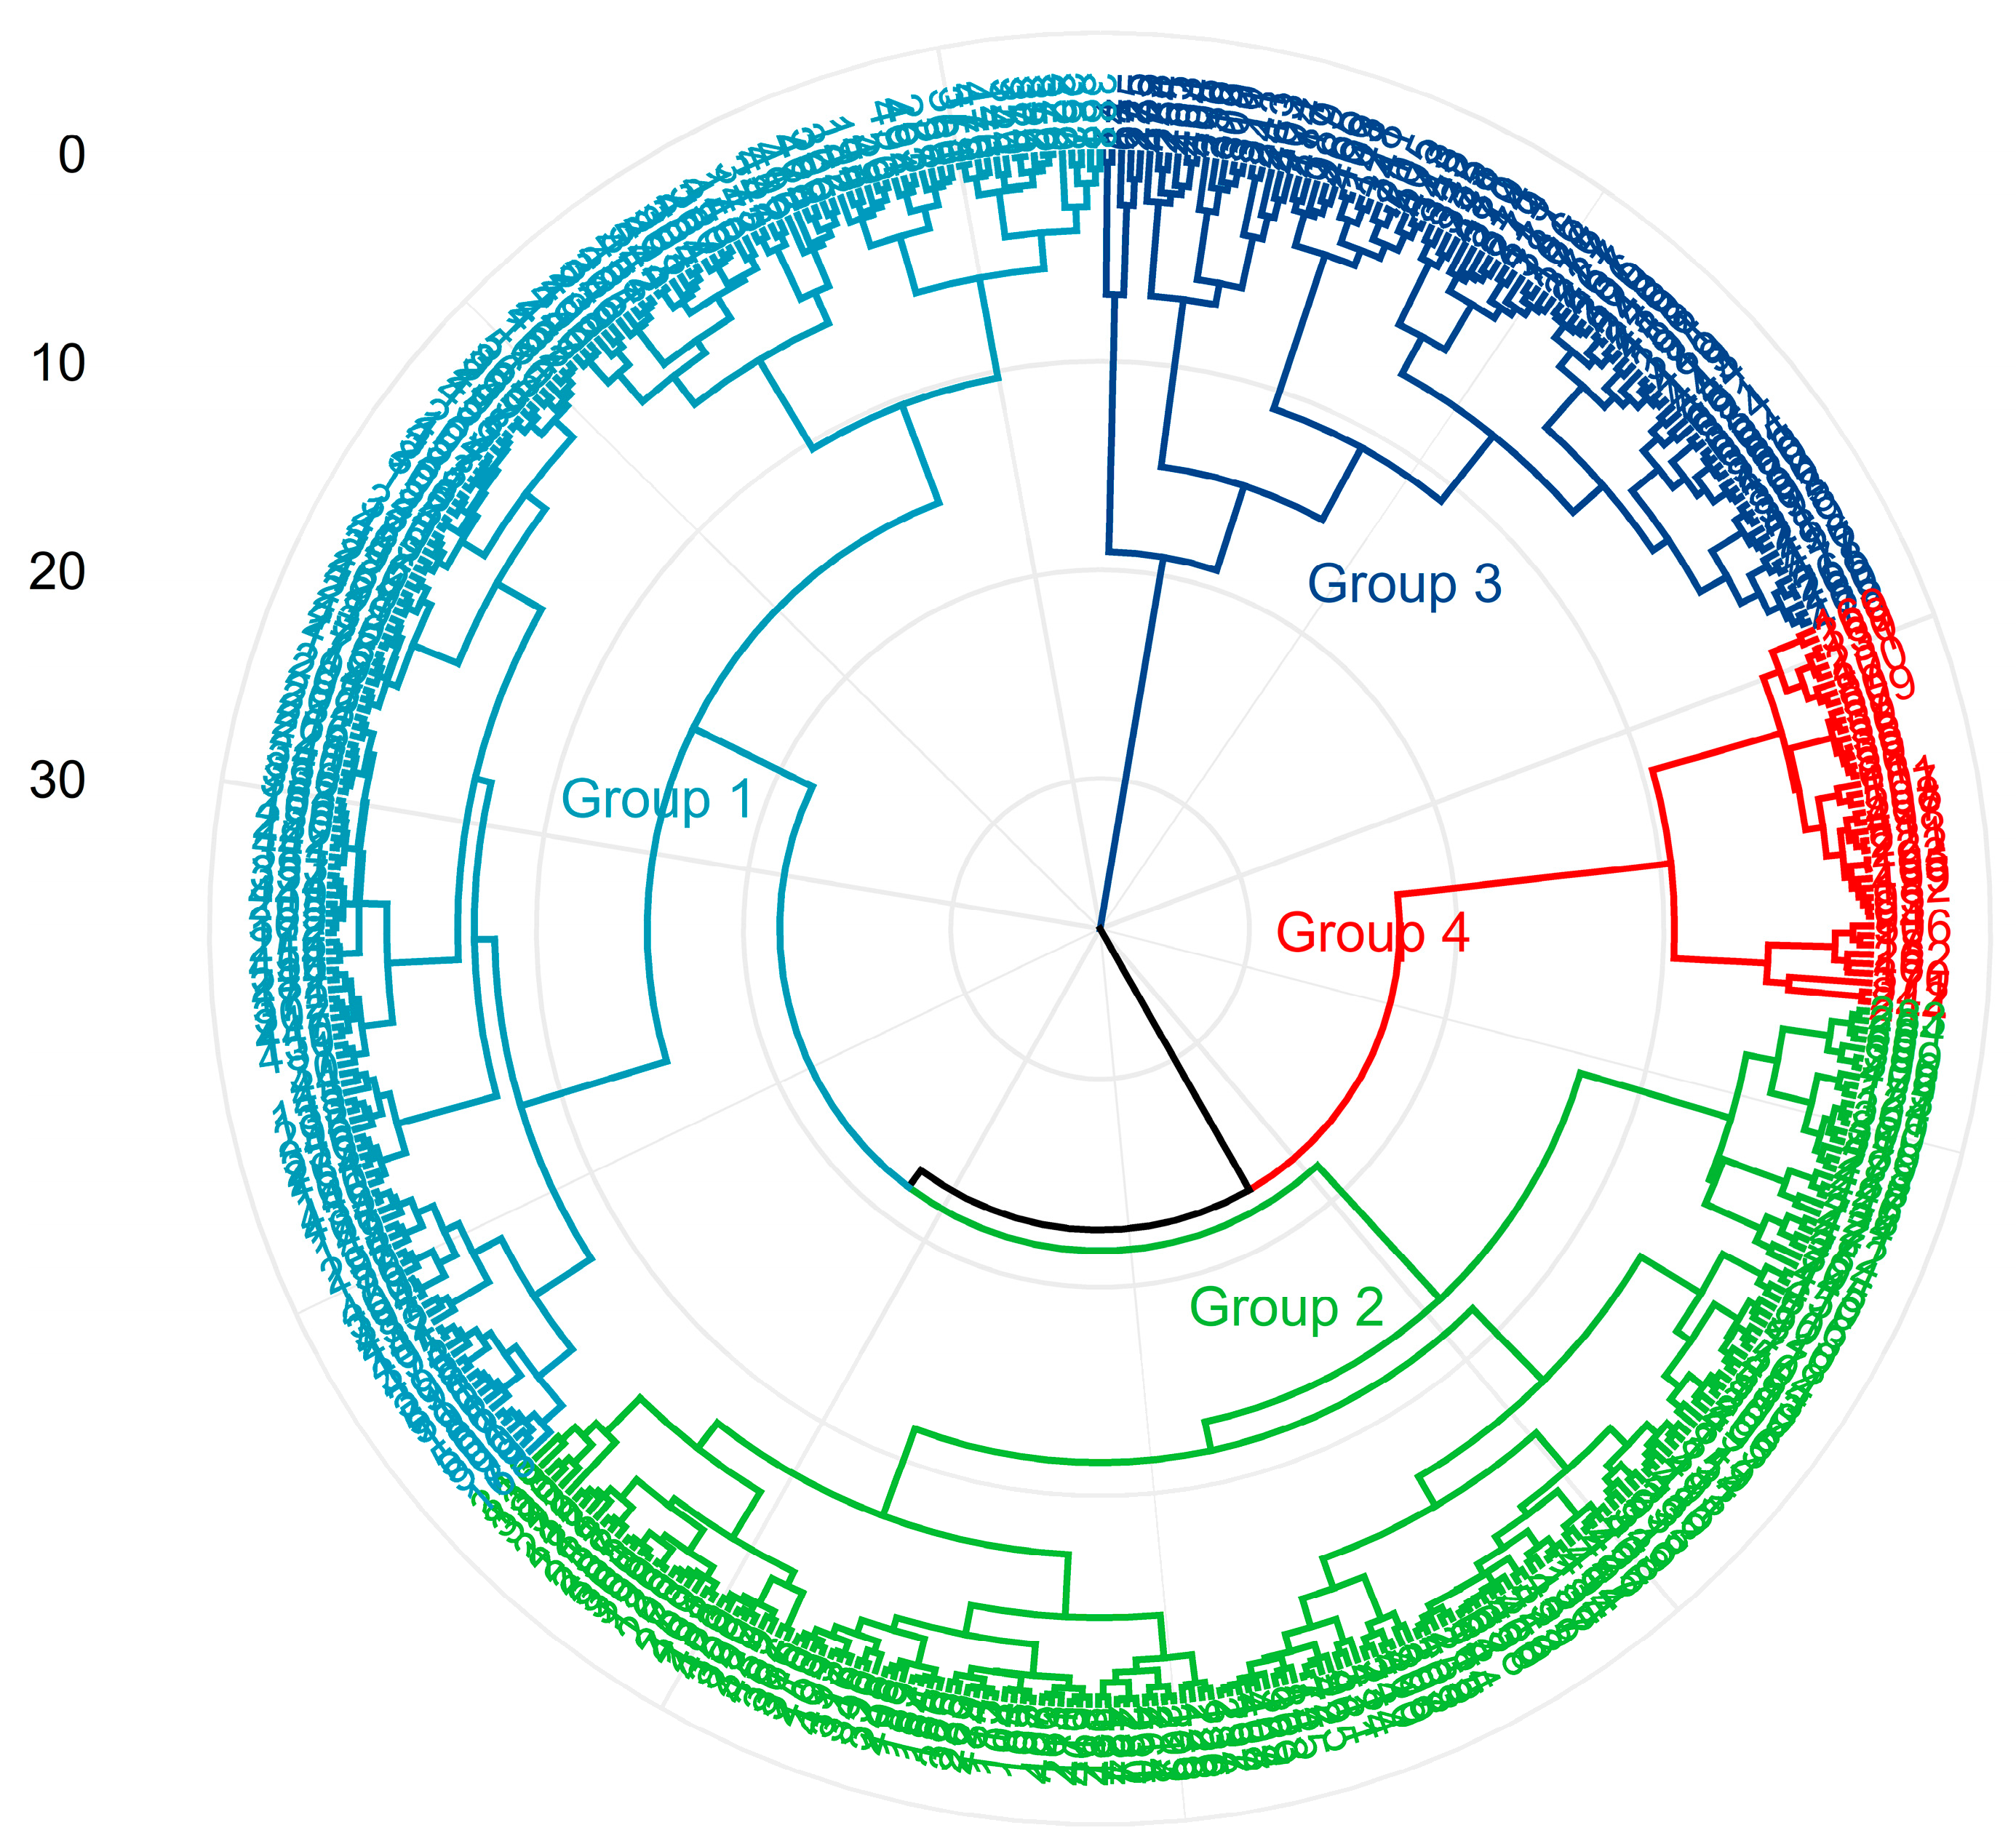
| Group of Diets | n 1 | Diet Characteristic 2 | FA Profile (g/kg of DM) |
|---|---|---|---|
| 1 | 183 | Intermediate amount of UFA | UFA 24–42, PUFA 19–34 |
| 2 | 190 | Low in SFA and UFA | SFA < 15, UFA < 27, PUFA < 19 |
| 3 | 96 | Rich in UFA high in PUFA | UFA > 42, PUFA > 34 |
| 4 | 46 | Rich in SFA and low in PUFA | SFA > 15, UFA < 26, PUFA < 17 |
| Item | n 1 | ControlMeans | Effect Size | Heterogeneity | |||
|---|---|---|---|---|---|---|---|
| RMD 2 | (95% CI) | p-Value | I2% | p-Value | |||
| Nutrient intake and digestibility | |||||||
| DMI 3, kg/d | 451 | 21.86 | −0.65 | (−0.78, −0.51) | <0.001 | 88.3 | <0.001 |
| CP 4 intake, kg/d | 86 | 3.33 | −0.14 | (−0.19, −0.09) | <0.001 | 99.9 | <0.001 |
| NDF 5 intake, kg/d | 116 | 7.53 | −0.46 | (−0.57, −0.35) | <0.001 | 96.5 | <0.001 |
| DM 6 digestibility, % | 113 | 67.3 | 0.32 | (−0.07, 0.70) | 0.10 | 84.0 | <0.001 |
| CP digestibility, % | 81 | 67.3 | 0.75 | (0.29, 1.21) | <0.01 | 55.2 | <0.001 |
| NDF digestibility, % | 137 | 48.6 | 0.24 | (−0.40, 0.89) | 0.46 | 87.2 | <0.001 |
| Ruminal parameters | |||||||
| Acetate, mol/100 mol | 104 | 62.7 | −0.56 | (−0.92, −0.21) | <0.01 | 83.6 | <0.001 |
| Propionate, mol/100 mol | 104 | 20.4 | 0.50 | (0.18, 0.83) | <0.01 | 86.1 | <0.001 |
| Butyrate, mol/100 mol | 102 | 11.7 | −0.01 | (−0.18, 0.15) | 0.88 | 73.3 | <0.001 |
| Production performance | |||||||
| Milk production, kg/d | 503 | 30.7 | 0.48 | (0.30, 0.65) | <0.001 | 79.9 | <0.001 |
| Feed efficiency, ECM 7/DMI | 417 | 1.42 | 0.04 | (0.02, 0.06) | <0.001 | 26.2 | 0.99 |
| Milk fat, kg/d | 468 | 1.11 | −0.05 | (−0.07, −0.04) | <0.001 | 88.5 | <0.001 |
| Milk protein, kg/d | 458 | 0.98 | −0.004 | (−0.01, 0.003) | 0.25 | 68.7 | <0.001 |
| Milk lactose, kg/d | 363 | 1.48 | 0.02 | (0.01, 0.03) | < 0.01 | 64.0 | <0.001 |
| Milk fat, g/kg | 515 | 36.71 | −2.19 | (−2.58, −1.80) | <0.001 | 98.9 | <0.001 |
| Milk protein, g/kg | 504 | 32.09 | −0.43 | (−0.53, −0.32) | <0.001 | 97.4 | <0.001 |
| Milk lactose, g/kg | 429 | 47.3 | −0.01 | (−0.01, 0.07) | 0.73 | 92.3 | <0.001 |
| Milk fatty acid profile, g/100 g FA | |||||||
| C12:0 | 359 | 3.6 | −0.85 | (−0.92, −0.77) | <0.001 | 98.9 | <0.001 |
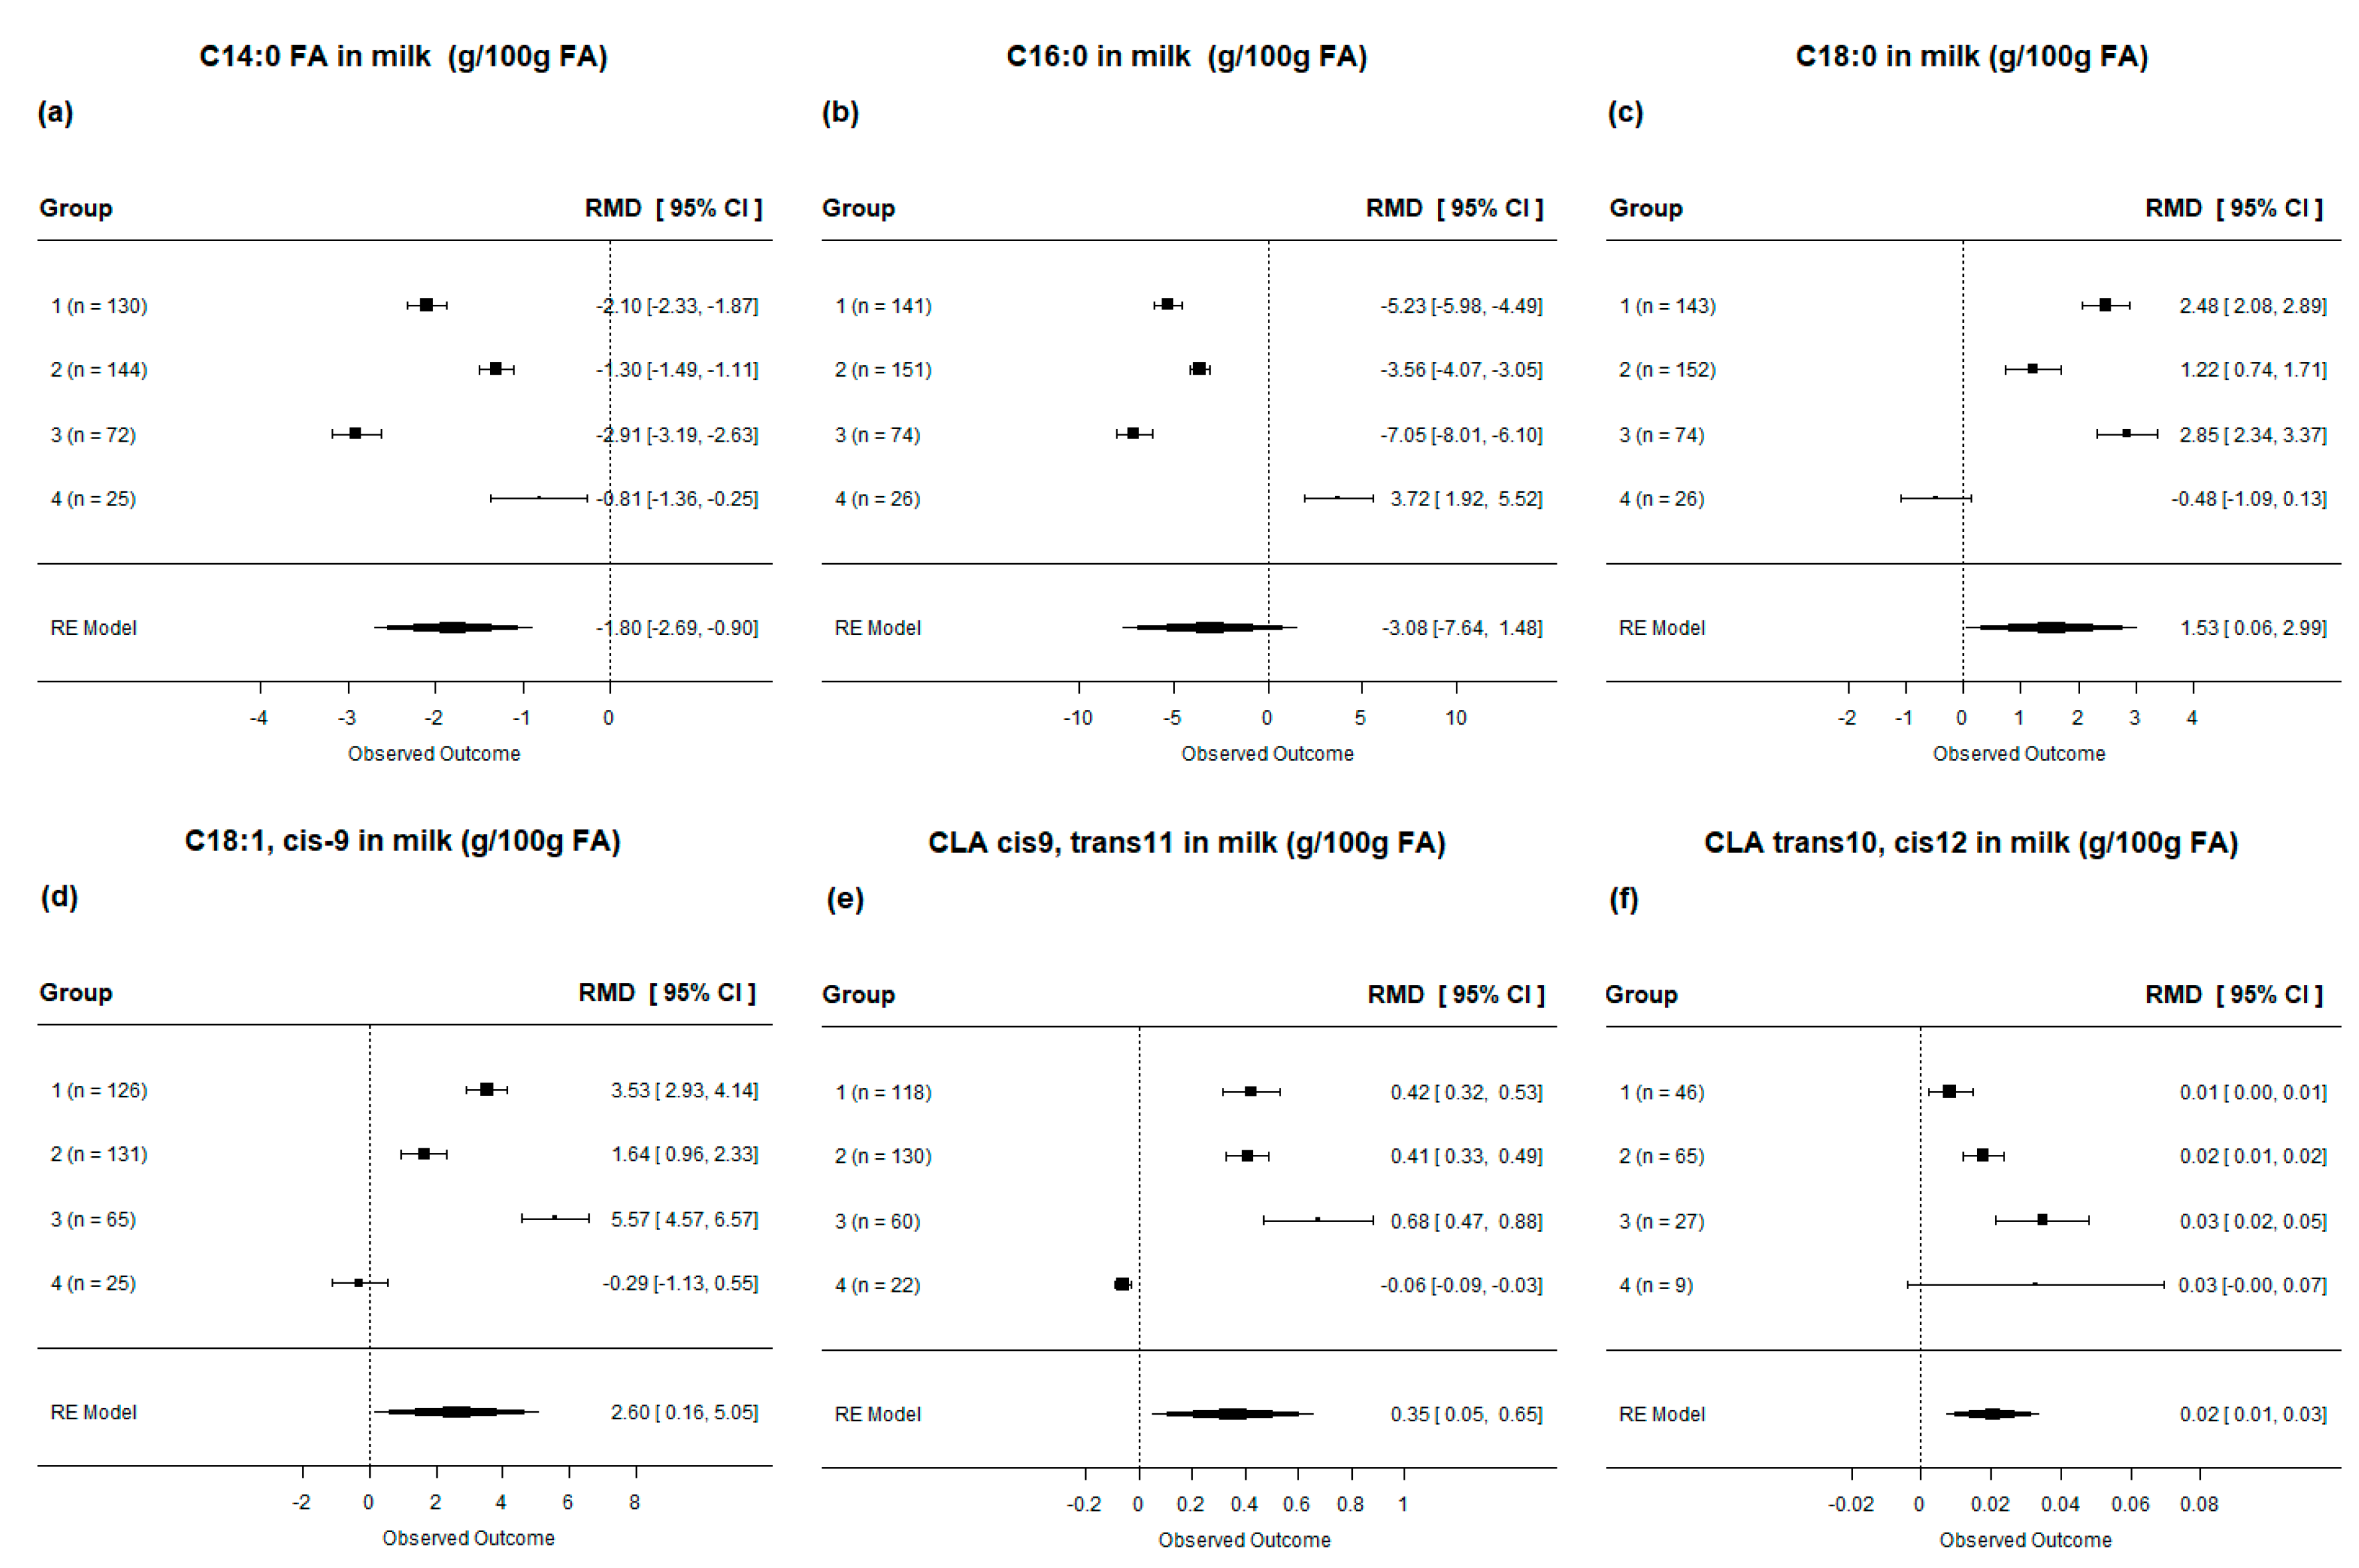
| C14:0 | 371 | 11.7 | −1.84 | (−1.98, −1.69) | <0.001 | 98.4 | <0.001 |
| C16:0 | 392 | 31.15 | −4.32 | (−4.79, −3.86) | <0.001 | 99.7 | <0.001 |
| C18:0 | 395 | 10.1 | 1.87 | (1.59, 2.14) | <0.001 | 99.3 | <0.001 |
| C18:1 | 347 | 18.6 | 2.88 | (2.45, 3.31) | <0.001 | 99.5 | <0.001 |
| C18:2 | 367 | 2.3 | 0.22 | (0.15, 0.29) | <0.001 | 99.2 | <0.001 |
| C18:3 n-3 | 364 | 0.47 | 0.096 | (0.07, 0.12) | <0.001 | 99.6 | <0.001 |
| CLA 8 (cis 9, trans 11) | 330 | 0.55 | 0.43 | (0.37, 0.50) | <0.001 | 99.8 | <0.001 |
| CLA (trans 10, cis 12) | 147 | 0.05 | 0.02 | (0.01, 0.02) | <0.001 | 98.5 | <0.001 |
| SFA | 222 | 67.2 | −6.45 | (−7.22, −5.68) | <0.001 | 99.5 | <0.001 |
| MUFA | 146 | 26.0 | 5.22 | (4.31, 6.13) | <0.001 | 99.9 | <0.001 |
| PUFA | 146 | 3.79 | 1.10 | (0.89, 1.31) | <0.001 | 99.9 | <0.001 |
| de novo | 110 | 25.82 | −3.98 | (−4.61, −3.36) | <0.001 | 94.9 | <0.001 |
| Mixed | 97 | 33.90 | −1.10 | (−2.15, −0.05) | <0.05 | 97.9 | <0.001 |
| Preformed | 94 | 39.65 | 3.91 | (2.44, 5.37) | <0.001 | 97.5 | <0.001 |
| Milk Fat Production Models 1 | Intercept (kg/d) | NDF 2 (g/kg DM) | C14:0 3 (g/kg DM) | MY 4 (kg/day) | PUFA 5 (g/kg DM) | C18:2 6 (g/kg DM) | UFA 7 (g/kg DM) | Evaluation on Data 8 | ||||||
|---|---|---|---|---|---|---|---|---|---|---|---|---|---|---|
| n | AIC | CCC | RMSE | Mean Bias | Slope Bias | |||||||||
| Model 1 | ||||||||||||||
| Estimate | −0.449 | 0.001 | −0.031 | 0.036 | Value | 282 | −260 | 0.97 | 0.07 | −0.0004 | 0.039 | |||
| SE | 0.129 | 0.0003 | 0.009 | 0.002 | % | 6.98 | 0.004 | 2.23 | ||||||
| p-value | <0.001 | <0.001 | <0.001 | <0.001 | p-value | 0.91 | 0.01 | |||||||
| Model 2 | ||||||||||||||
| Estimate | −0.302 | 0.001 | −0.036 | 0.034 | −0.003 | Value | 282 | −257 | 0.97 | 0.07 | −0.0004 | 0.037 | ||
| SE | 0.135 | 0.0003 | 0.009 | 0.002 | 0.001 | % | 6.81 | 0.005 | 2.18 | |||||
| p-value | <0.05 | < 0.001 | <0.001 | <0.001 | <0.001 | p-value | 0.91 | 0.01 | ||||||
| Model 3 | ||||||||||||||
| Estimate | −0.332 | 0.001 | −0.035 | 0.035 | - | −0.03 | Value | 282 | −253 | 0.97 | 0.07 | −0.0005 | 0.038 | |
| SE | 0.139 | 0.0003 | 0.009 | 0.002 | - | 0.001 | % | 6.93 | 0.005 | 2.21 | ||||
| p-value | <0.05 | <0.001 | <0.001 | <0.001 | - | <0.01 | p-value | 0.91 | 0.01 | |||||
| Model 4 | ||||||||||||||
| Estimate | −0.278 | 0.001 | −0.037 | 0.034 | - | - | −0.003 | Value | 282 | −258 | 0.97 | 0.07 | −0.0005 | 0.037 |
| SE | 0.136 | 0.0003 | 0.009 | 0.002 | - | - | 0.0008 | % | 6.82 | 0.005 | 2.18 | |||
| p-value | <0.05 | <0.001 | <0.001 | <0.001 | - | - | <0.001 | p-value | 0.91 | 0.01 | ||||
| Milk Fat Proportion Models 1 | Intercept (g/kg) | NDF 2 (g/kg DM) | UFA 3 (g/kg DM) | Forage (g/kg DM) | C14:0 4 (g/kg DM) | MY 5 (kg/day) | DMI 6 (kg/day) | C16:0 7 (g/kg DM) | Evaluation on Data 8 | ||||||
|---|---|---|---|---|---|---|---|---|---|---|---|---|---|---|---|
| n | AIC | CCC | RMSE | Mean Bias | Slope Bias | ||||||||||
| Model 5 | |||||||||||||||
| Estimate | 22.12 | 0.019 | −0.090 | 0.017 | Value | 409 | 2392 | 0.93 | 2.11 | −0.04 | 0.10 | ||||
| SE | 2.62 | 0.007 | 0.021 | 0.004 | % | 6.14 | 0.04 | 6.39 | |||||||
| p-value | <0.001 | <0.05 | <0.001 | <0.001 | p-value | 0.67 | 0.001 | ||||||||
| Model 6 | |||||||||||||||
| Estimate | 22.36 | 0.025 | −0.105 | 0.014 | −1.209 | Value | 303 | 1782 | 0.93 | 2.16 | −0.02 | 0.10 | |||
| SE | 2.91 | 0.008 | 0.024 | 0.004 | 0.279 | % | 6.37 | 0.006 | 6.33 | ||||||
| p-value | <0.001 | <0.01 | <0.001 | <0.01 | <0.001 | p-value | 0.89 | 0.001 | |||||||
| Model 7 | |||||||||||||||
| Estimate | 17.27 | 0.036 | - | - | - | −0.291 | 0.657 | Value | 378 | 2212 | 0.94 | 2.01 | −0.04 | 0.09 | |
| SE | 3.87 | 0.008 | - | - | - | 0.073 | 0.127 | % | 6.06 | 0.03 | 5.65 | ||||
| p-value | <0.001 | <0.001 | - | - | - | <0.001 | <0.001 | p-value | 0.72 | 0.001 | |||||
| Model 8 | - | ||||||||||||||
| Estimate | 16.08 | 0.036 | - | - | - | −0.333 | 0.718 | 0.133 | Value | 378 | 2212 | 0.94 | 2.06 | −0.03 | 0.09 |
| SE | 3.88 | 0.008 | - | - | - | 0.074 | 0.128 | 0.051 | % | 6.01 | 0.03 | 5.64 | |||
| p-value | <0.001 | <0.001 | - | - | - | <0.001 | <0.001 | <0.05 | p-value | 0.74 | 0.001 | ||||
| De novo FA in Milk Models 1 | Intercept (g/100 g FA) | DMI 2 (kg/day) | FA 3 (g/kg DM) | MY 4 (kg/day) | C18:3 5 (g/kg DM) | C14:0 6 (g/kg DM) | Evaluation on Data 7 | ||||||
|---|---|---|---|---|---|---|---|---|---|---|---|---|---|
| n | AIC | CCC | RMSE | Mean Bias | Slope Bias | ||||||||
| Model 9 | |||||||||||||
| Estimate | 14.20 | 0.546 | −0.11 | Value | 104 | 482 | 0.97 | 1.02 | 0.006 | 0.036 | |||
| SE | 2.46 | 0.08 | 0.03 | % | 4.69 | 0.003 | 1.96 | ||||||
| p-value | <0.001 | <0.001 | <0.001 | p-value | 0.95 | 0.16 | |||||||
| Model 10 | |||||||||||||
| Estimate | 14.76 | 0.803 | −0.119 | −0.170 | Value | 102 | 472 | 0.97 | 1.01 | 0.002 | 0.04 | ||
| SE | 2.41 | 0.13 | 0.027 | 0.071 | % | 4.62 | 0.001 | 1.99 | |||||
| p-value | <0.001 | <0.001 | <0.001 | <0.05 | p-value | 0.98 | 0.16 | ||||||
| Model 11 | |||||||||||||
| Estimate | 13.55 | 0.56 | −0.12 | - | 0.10 | Value | 104 | 482 | 0.97 | 0.99 | 0.005 | 0.04 | |
| SE | 2.41 | 0.079 | 0.026 | - | 0.039 | % | 4.58 | 0.003 | 2.01 | ||||
| p-value | <0.001 | <0.001 | <0.001 | - | <0.05 | p-value | 0.95 | 0.15 | |||||
| Model 12 | |||||||||||||
| Estimate | 12.50 | 0.589 | −0.13 | - | - | 3.99 | Value | 58 | 285 | 0.96 | 1.27 | 0.005 | 0.05 |
| SE | 3.74 | 0.14 | 0.036 | - | - | 1.64 | % | 6.18 | 0.001 | 2.59 | |||
| p-value | <0.01 | <0.001 | <0.001 | - | - | <0.05 | p-value | 0.97 | 0.23 | ||||
| Mixed FA in Milk Models 1 | Intercept (g/100 g FA) | Milk Fat (g/kg) | C16:0 2 (g/kg DM) | C18:2 3 (g/kg DM) | C18:3 4 (g/kg DM) | MUFA 5 (g/kg DM) | Forage (g/kg DM) | Evaluation on Data 6 | ||||||
|---|---|---|---|---|---|---|---|---|---|---|---|---|---|---|
| n | AIC | CCC | RMSE | Mean Bias | Slope Bias | |||||||||
| Model 13 | ||||||||||||||
| Estimate | 44.24 | 0.197 | 0.236 | −0.187 | −0.215 | −0.345 | −0.027 | Value | 78 | 411 | 0.99 | 1.03 | −0.01 | 0.02 |
| SE | 5.01 | 0.075 | 0.076 | 0.066 | 0.092 | 0.091 | 0.011 | % | 3.06 | 0.01 | 1.58 | |||
| p-value | <0.001 | <0.05 | <0.01 | <0.01 | <0.05 | <0.001 | <0.05 | p-value | 0.92 | 0.27 | ||||
| Model 14 | ||||||||||||||
| Estimate | 38.92 | - | 0.284 | −0.241 | −0.235 | −0.354 | Value | 78 | 404 | 0.99 | 1.06 | −0.02 | 0.02 | |
| SE | 1.86 | - | 0.077 | 0.066 | 0.095 | 0.095 | % | 3.14 | 0.02 | 1.99 | ||||
| p-value | <0.001 | - | <0.001 | <0.001 | <0.05 | <0.001 | p-value | 0.89 | 0.22 | |||||
| Preformed FA in Milk Models 1 | Intercept (g/100 g FA) | C18:2 2 (g/kg DM) | DMI 3 (kg/d) | C18:1 4 (g/kg DM) | Milk Fat (g/kg) | Evaluation on Data 5 | ||||||
|---|---|---|---|---|---|---|---|---|---|---|---|---|
| n | AIC | CCC | RMSE | Mean Bias | Slope Bias | |||||||
| Model 15 | ||||||||||||
| Estimate | 53.33 | 0.332 | −0.833 | 0.500 | Value | 90 | 522 | 0.99 | 1.46 | 0.007 | 0.02 | |
| SE | 4.37 | 0.08 | 0.16 | 0.13 | % | 3.33 | 0.002 | 1.85 | ||||
| p-value | <0.001 | <0.001 | <0.001 | <0.001 | p-value | 0.96 | 0.20 | |||||
| Model 16 | ||||||||||||
| Estimate | 64.91 | 0.282 | −0.951 | 0.483 | −0.220 | Value | 90 | 521 | 0.99 | 1.39 | −0.001 | 0.02 |
| SE | 6.24 | 0.08 | 0.16 | 0.12 | 0.09 | % | 3.17 | 0.0004 | 1.59 | |||
| p-value | <0.001 | <0.001 | <0.001 | <0.001 | < 0.05 | p-value | 0.99 | 0.24 | ||||
Disclaimer/Publisher’s Note: The statements, opinions and data contained in all publications are solely those of the individual author(s) and contributor(s) and not of MDPI and/or the editor(s). MDPI and/or the editor(s) disclaim responsibility for any injury to people or property resulting from any ideas, methods, instructions or products referred to in the content. |
© 2023 by the authors. Licensee MDPI, Basel, Switzerland. This article is an open access article distributed under the terms and conditions of the Creative Commons Attribution (CC BY) license (https://creativecommons.org/licenses/by/4.0/).
Share and Cite
Gallardo, W.B.; Teixeira, I.A.M.A. Associations between Dietary Fatty Acid Profile and Milk Fat Production and Fatty Acid Composition in Dairy Cows: A Meta-Analysis. Animals 2023, 13, 2063. https://doi.org/10.3390/ani13132063
Gallardo WB, Teixeira IAMA. Associations between Dietary Fatty Acid Profile and Milk Fat Production and Fatty Acid Composition in Dairy Cows: A Meta-Analysis. Animals. 2023; 13(13):2063. https://doi.org/10.3390/ani13132063
Chicago/Turabian StyleGallardo, Walter B., and Izabelle A. M. A. Teixeira. 2023. "Associations between Dietary Fatty Acid Profile and Milk Fat Production and Fatty Acid Composition in Dairy Cows: A Meta-Analysis" Animals 13, no. 13: 2063. https://doi.org/10.3390/ani13132063
APA StyleGallardo, W. B., & Teixeira, I. A. M. A. (2023). Associations between Dietary Fatty Acid Profile and Milk Fat Production and Fatty Acid Composition in Dairy Cows: A Meta-Analysis. Animals, 13(13), 2063. https://doi.org/10.3390/ani13132063


