
A Step Forward in the Characterization of Primary Brown Trout Hepatocytic Spheroids as Experimental Models


Abstract
:Simple Summary
Abstract
1. Introduction
2. Materials and Methods
2.1. Fish
2.2. Hepatocyte Isolation
2.3. 3D Cultures
2.4. Spheroids Biometric Analysis
2.5. Lactate Dehydrogenase (LDH) Assay
2.6. Resazurin Assay
2.7. Spheroid Morphology
2.8. RNA Extraction and cDNA Synthesis
2.9. Quantitative Real-Time Polymerase Chain Reaction (RT-qPCR)
2.10. Statistical Analyses
3. Results
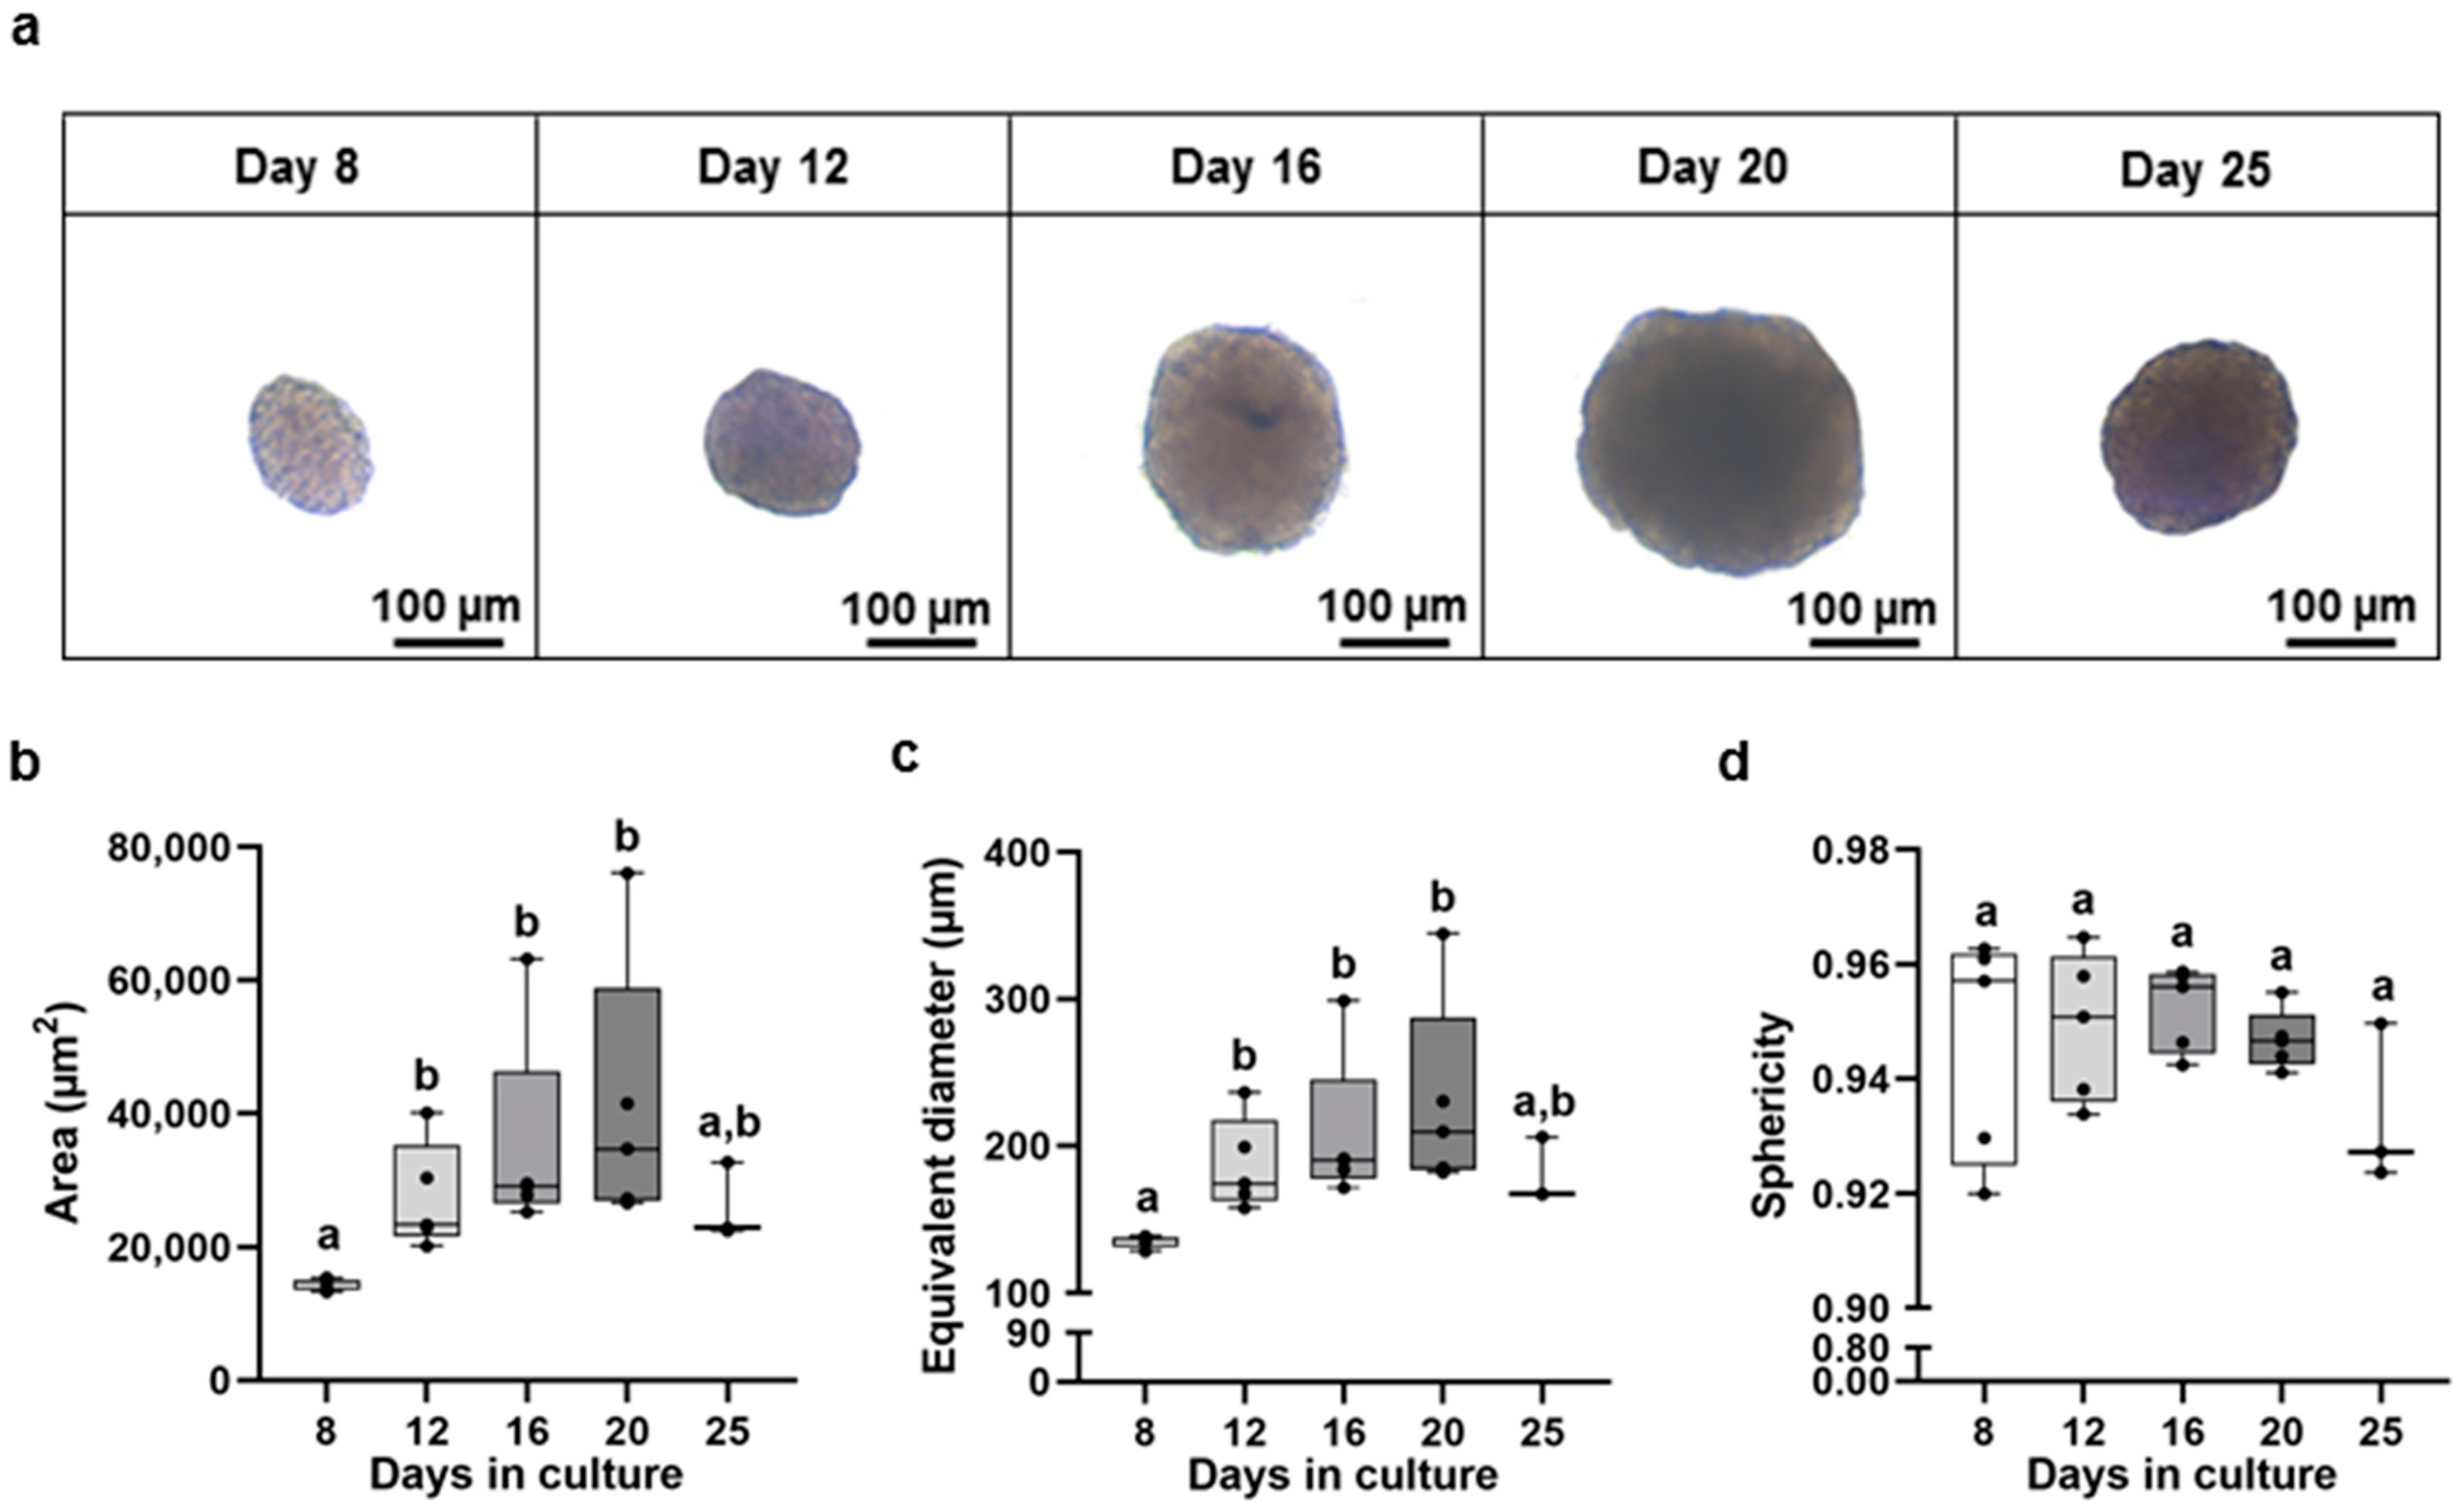
3.1. Biometry
3.2. Viability—LDH and Resazurin Assays
3.3. Morphology
3.4. RT-qPCR
3.5. Expression Levels in Whole Liver Samples vs. Hepatocyte Spheroids
4. Discussion
5. Conclusions
Supplementary Materials
Author Contributions
Funding
Institutional Review Board Statement
Data Availability Statement
Acknowledgments
Conflicts of Interest
References
- Bell, C.C.; Hendriks, D.F.G.; Moro, S.M.L.; Ellis, E.; Walsh, J.; Renblom, A.; Puigvert, L.F.; Dankers, A.C.A.; Jacobs, F.; Snoeys, J.; et al. Characterization of primary human hepatocyte spheroids as a model system for drug-induced liver injury, liver function and disease. Sci. Rep. 2016, 6, 25187. [Google Scholar] [CrossRef] [Green Version]
- Kanebratt, K.P.; Janefeldt, A.; Vilén, L.; Vildhede, A.; Samuelsson, K.; Milton, L.; Björkbom, A.; Persson, M.; Leandersson, C.; Andersson, T.B.; et al. Primary Human Hepatocyte Spheroid Model as a 3D In Vitro Platform for Metabolism Studies. J. Pharm. Sci. 2020, 110, 422–431. [Google Scholar] [CrossRef]
- Baron, M.G.; Purcell, W.M.; Jackson, S.K.; Owen, S.F.; Jha, A.N. Towards a more representative in vitro method for fish ecotoxicology: Morphological and biochemical characterisation of three-dimensional spheroidal hepatocytes. Ecotoxicology 2012, 21, 2419–2429. [Google Scholar] [CrossRef]
- Uchea, C.; Owen, S.F.; Chipman, J.K. Functional xenobiotic metabolism and efflux transporters in trout hepatocyte spheroid cultures. Toxicol. Res. 2015, 4, 494–507. [Google Scholar] [CrossRef] [Green Version]
- Liu, J.; Kuznetsova, L.A.; Edwards, G.O.; Xu, J.; Ma, M.; Purcell, W.M.; Jackson, S.K.; Coakley, W.T. Functional three-dimensional HepG2 aggregate cultures generated from an ultrasound trap: Comparison with HepG2 spheroids. J. Cell. Biochem. 2007, 102, 1180–1189. [Google Scholar] [CrossRef]
- Souza, A.G.; Silva, I.B.B.; Campos-Fernandez, E.; Barcelos, L.S.; Souza, J.B.; Marangoni, K.; Goulart, L.R.; Alonso-Goulart, V. Comparative Assay of 2D and 3D Cell Culture Models: Proliferation, Gene Expression and Anticancer Drug Response. Curr. Pharm. Des. 2018, 24, 1689–1694. [Google Scholar] [CrossRef] [PubMed]
- Park, C.G.; Ryu, C.S.; Sung, B.; Manz, A.; Kong, H.; Kim, Y.J. Transcriptomic and physiological analysis of endocrine disrupting chemicals Impacts on 3D Zebrafish liver cell culture system. Aquat. Toxicol. 2022, 245, 106105. [Google Scholar] [CrossRef] [PubMed]
- Bell, C.C.; A Dankers, A.C.; Lauschke, V.M.; Sison-Young, R.; Jenkins, R.; Rowe, C.; E Goldring, C.; Park, K.; Regan, S.L.; Walker, T.; et al. Comparison of Hepatic 2D Sandwich Cultures and 3D Spheroids for Long-term Toxicity Applications: A Multicenter Study. Toxicol. Sci. 2018, 162, 655–666. [Google Scholar] [CrossRef] [Green Version]
- Foster, A.J.; Chouhan, B.; Regan, S.L.; Rollison, H.; Amberntsson, S.; Andersson, L.C.; Srivastava, A.; Darnell, M.; Cairns, J.; Lazic, S.E.; et al. Integrated in vitro models for hepatic safety and metabolism: Evaluation of a human Liver-Chip and liver spheroid. Arch. Toxicol. 2019, 93, 1021–1037. [Google Scholar] [CrossRef] [PubMed] [Green Version]
- Stebbing, J.; Sánchez Nievas, G.; Falcone, M.; Youhanna, S.; Richardson, P.; Ottaviani, S.; Shen, J.X.; Sommerauer, C.; Tiseo, G.; Ghiadoni, L.; et al. JAK inhibition reduces SARS-CoV-2 liver infectivity and modulates inflammatory responses to reduce morbidity and mortality. Sci. Adv. 2021, 7, eabe4724. [Google Scholar] [CrossRef]
- Vorrink, S.U.; Ullah, S.; Schmidt, S.; Nandania, J.; Velagapudi, V.; Beck, O.; Ingelman-Sundberg, M.; Lauschke, V.M. Endogenous and xenobiotic metabolic stability of primary human hepatocytes in long-term 3D spheroid cultures revealed by a combination of targeted and untargeted metabolomics. FASEB J. 2017, 31, 2696–2708. [Google Scholar] [CrossRef] [PubMed] [Green Version]
- Bell, C.C.; Lauschke, V.M.; Vorrink, S.U.; Palmgren, H.; Duffin, R.; Andersson, T.B.; Ingelman-Sundberg, M. Transcriptional, Functional, and Mechanistic Comparisons of Stem Cell–Derived Hepatocytes, HepaRG Cells, and Three-Dimensional Human Hepatocyte Spheroids as Predictive In Vitro Systems for Drug-Induced Liver Injury. Drug Metab. Dispos. 2017, 45, 419–429. [Google Scholar] [CrossRef] [Green Version]
- Tostões, R.M.; Leite, S.B.; Serra, M.; Jensen, J.; Björquist, P.; Carrondo, M.J.T.; Brito, C.; Alves, P.M. Human liver cell spheroids in extended perfusion bioreactor culture for repeated-dose drug testing. Hepatology 2012, 55, 1227–1236. [Google Scholar] [CrossRef]
- Cuvellier, M.; Rose, S.; Ezan, F.; Jarry, U.; de Oliveira, H.; Bruyère, A.; La Rochelle, C.D.; Legagneux, V.; Langouët, S.; Baffet, G. In vitro long term differentiation and functionality of three-dimensional bioprinted primary human hepatocytes: Application for in vivo engraftment. Biofabrication 2022, 14, 035021. [Google Scholar] [CrossRef] [PubMed]
- Landry, J.; Bernier, D.; Ouellet, C.; Goyette, R.; Marceau, N. Spheroidal aggregate culture of rat liver cells: Histotypic reorganization, biomatrix deposition, and maintenance of functional activities. J. Cell Biol. 1985, 101, 914–923. [Google Scholar] [CrossRef] [Green Version]
- Li, A.P.; Colburn, S.M.; Beck, D.J. A simplified method for the culturing of primary adult rat and human hepatocytes as multicellular spheroids. Vitr. Cell. Dev. Biol. 1992, 28a, 673–677. [Google Scholar] [CrossRef]
- Flouriot, G.; Vaillant, C.; Salbert, G.; Pelissero, C.; Guiraud, J.M.; Valotaire, Y. Monolayer and aggregate cultures of rainbow trout hepatocytes: Long-term and stable liver-specific expression in aggregates. J. Cell Sci. 1993, 105, 407–416. [Google Scholar] [CrossRef]
- Lammel, T.; Tsoukatou, G.; Jellinek, J.; Sturve, J. Development of three-dimensional (3D) spheroid cultures of the continuous rainbow trout liver cell line RTL-W1. Ecotoxicol. Environ. Saf. 2018, 167, 250–258. [Google Scholar] [CrossRef]
- Alves, R.F.; Rocha, E.; Madureira, T.V. Fish hepatocyte spheroids—A powerful (though underexplored) alternative in vitro model to study hepatotoxicity. Comp. Biochem. Physiol. Part C Toxicol. Pharmacol. 2022, 262, 109470. [Google Scholar] [CrossRef]
- Baron, M.G.; Mintram, K.S.; Owen, S.F.; Hetheridge, M.J.; Moody, A.J.; Purcell, W.M.; Jackson, S.K.; Jha, A.N. Pharmaceutical Metabolism in Fish: Using a 3-D Hepatic In Vitro Model to Assess Clearance. PLoS ONE 2017, 12, e0168837. [Google Scholar] [CrossRef] [Green Version]
- Hultman, M.T.; Løken, K.B.; Grung, M.; Reid, M.J.; Lillicrap, A. Performance of Three-Dimensional Rainbow Trout (Oncorhynchus mykiss) Hepatocyte Spheroids for Evaluating Biotransformation of Pyrene. Environ. Toxicol. Chem. 2019, 38, 1738–1747. [Google Scholar] [CrossRef] [Green Version]
- Pereira, I.L.; Lopes, C.; Rocha, E.; Madureira, T.V. Establishing brown trout primary hepatocyte spheroids as a new alternative experimental model—Testing the effects of 5α-dihydrotestosterone on lipid pathways. Aquat. Toxicol. 2022, 253, 106331. [Google Scholar] [CrossRef] [PubMed]
- Madureira, T.V.; Malhão, F.; Pinheiro, I.; Lopes, C.; Ferreira, N.; Urbatzka, R.; Castro, L.F.C.; Rocha, E. Estrogenic and anti-estrogenic influences in cultured brown trout hepatocytes: Focus on the expression of some estrogen and peroxisomal related genes and linked phenotypic anchors. Aquat. Toxicol. 2015, 169, 133–142. [Google Scholar] [CrossRef] [PubMed]
- Madureira, T.V.; Malhão, F.; Simões, T.; Pinheiro, I.; Lopes, C.; Gonçalves, J.F.; Urbatzka, R.; Castro, L.F.C.; Lemos, M.F.L.; Rocha, E. Sex-steroids and hypolipidemic chemicals impacts on brown trout lipid and peroxisome signaling—Molecular, biochemical and morphological insights. Comp. Biochem. Physiol. Part C Toxicol. Pharmacol. 2018, 212, 1–17. [Google Scholar] [CrossRef]
- Lopes, C.; Madureira, T.V.; Gonçalves, J.F.; Rocha, E. Disruption of classical estrogenic targets in brown trout primary hepatocytes by the model androgens testosterone and dihydrotestosterone. Aquat. Toxicol. 2020, 227, 105586. [Google Scholar] [CrossRef]
- Klaunig, J.E.; Ruch, R.J.; Goldblatt, P.J. Trout hepatocyte culture: Isolation and primary culture. In Vitr. Cell. Dev. Biol. Plant 1985, 21, 221–228. [Google Scholar] [CrossRef]
- Blair, J.B.; Miller, M.R.; Pack, D.; Barnes, R.; Teh, S.J.; Hinton, D.E. Isolated trout liver cells: Establishing short-term primary cultures exhibiting cell-to-cell interactions. Vitr. Cell. Dev. Biol. 1990, 26, 237–249. [Google Scholar] [CrossRef] [PubMed]
- Piccinini, F. AnaSP: A software suite for automatic image analysis of multicellular spheroids. Comput. Methods Programs Biomed. 2015, 119, 43–52. [Google Scholar] [CrossRef] [PubMed]
- Erikstein, B.S.; Hagland, H.R.; Nikolaisen, J.; Kulawiec, M.; Singh, K.K.; Gjertsen, B.T.; Tronstad, K.J. Cellular stress induced by resazurin leads to autophagy and cell death via production of reactive oxygen species and mitochondrial impairment. J. Cell. Biochem. 2010, 111, 574–584. [Google Scholar] [CrossRef] [PubMed] [Green Version]
- Koetsier, G.; Cantor, E. A practical guide to analyzing nucleic acid concentration and purity with microvolume spectrophotometers. N. Engl. Biolabs 2019, 1–8. Available online: https://prd-sccd01-international.neb.com/-/media/nebus/files/application-notes/technote_mvs_analysis_of_nucleic_acid_concentration_and_purity.pdf?rev=c24cea043416420d84fb6bf7b554dbbb (accessed on 7 July 2023).
- Pfaffl, M.W. A new mathematical model for relative quantification in real-time RT-PCR. Nucleic Acids Res. 2001, 29, e45. [Google Scholar] [CrossRef] [PubMed]
- Andersen, C.L.; Jensen, J.L.; Ørntoft, T.F. Normalization of Real-Time Quantitative Reverse Transcription-PCR Data: A Model-Based Variance Estimation Approach to Identify Genes Suited for Normalization, Applied to Bladder and Colon Cancer Data Sets. Cancer Res 2004, 64, 5245–5250. [Google Scholar] [CrossRef] [PubMed] [Green Version]
- Batista-Pinto, C. Peroxisomes in Brown Trout (Salmo trutta f. fario): Regulation by Estrogens; Institute of Biomedical Sciences Abel Salazar: Porto, Portugal, 2007; pp. 121–135. [Google Scholar]
- Körner, O.; Kohno, S.; Schönenberger, R.; Suter, M.J.-F.; Knauer, K.; Guillette, L.J., Jr.; Burkhardt-Holm, P. Water temperature and concomitant waterborne ethinylestradiol exposure affects the vitellogenin expression in juvenile brown trout (Salmo trutta). Aquat. Toxicol. 2008, 90, 188–196. [Google Scholar] [CrossRef]
- De Anna, J.S.; Darraz, L.A.; Painefilú, J.C.; Cárcamo, J.G.; Moura-Alves, P.; Venturino, A.; Luquet, C.M. The insecticide chlorpyrifos modifies the expression of genes involved in the PXR and AhR pathways in the rainbow trout, Oncorhynchus mykiss. Pestic. Biochem. Physiol. 2021, 178, 104920. [Google Scholar] [CrossRef]
- Webster, T.M.U.; Shears, J.A.; Moore, K.; Santos, E.M. Identification of conserved hepatic transcriptomic responses to 17β-estradiol using high-throughput sequencing in brown trout. Physiol. Genom. 2015, 47, 420–431. [Google Scholar] [CrossRef]
- Madureira, T.V.; Pinheiro, I.; Freire, R.D.P.; Rocha, E.; Castro, L.F.; Urbatzka, R. Genome specific PPARαB duplicates in salmonids and insights into estrogenic regulation in brown trout. Comp. Biochem. Physiol. Part B Biochem. Mol. Biol. 2017, 208–209, 94–101. [Google Scholar] [CrossRef]
- Madureira, T.V.; Pinheiro, I.; Malhão, F.; Lopes, C.; Urbatzka, R.; Castro, L.F.C.; Rocha, E. Cross-interference of two model peroxisome proliferators in peroxisomal and estrogenic pathways in brown trout hepatocytes. Aquat. Toxicol. 2017, 187, 153–162. [Google Scholar] [CrossRef]
- Hammer, Ø.; Harper, D.A.; Ryan, P.D. PAST: Paleontological statistics software package for education and data analysis. Palaeontol. Electron. 2001, 4, 9. [Google Scholar]
- Hamilton, G.A.; Westmorel, C.; George, A.E. Effects of medium composition on the morphology and function of rat hepatocytes cultured as spheroids and monolayers. Vitr. Cell. Dev. Biol.-Anim. 2001, 37, 656–667. [Google Scholar] [CrossRef]
- Langan, M.; Dodd, N.J.; Owen, S.F.; Purcell, W.M.; Jackson, S.K.; Jha, A.N. Direct measurements of oxygen gradients in spheroid culture system using electron parametric resonance oximetry. PLoS ONE 2016, 11, e0149492. [Google Scholar]
- Zanoni, M.; Piccinini, F.; Arienti, C.; Zamagni, A.; Santi, S.; Polico, R.; Bevilacqua, A.; Tesei, A. 3D tumor spheroid models for in vitro therapeutic screening: A systematic approach to enhance the biological relevance of data obtained. Sci. Rep. 2016, 6, srep19103. [Google Scholar] [CrossRef] [PubMed] [Green Version]
- Malhão, F.; Macedo, A.C.; Ramos, A.A.; Rocha, E. Morphometrical, Morphological, and Immunocytochemical Characterization of a Tool for Cytotoxicity Research: 3D Cultures of Breast Cell Lines Grown in Ultra-Low Attachment Plates. Toxics 2022, 10, 415. [Google Scholar] [CrossRef]
- Anada, T.; Fukuda, J.; Sai, Y.; Suzuki, O. An oxygen-permeable spheroid culture system for the prevention of central hypoxia and necrosis of spheroids. Biomaterials 2012, 33, 8430–8441. [Google Scholar] [CrossRef] [PubMed]
- Sakai, Y.; Yamagami, S.; Nakazawa, K. Comparative Analysis of Gene Expression in Rat Liver Tissue and Monolayer- and Spheroid-Cultured Hepatocytes. Cells Tissues Organs 2009, 191, 281–288. [Google Scholar] [CrossRef] [PubMed]
- Clayton, D.F.; Harrelson, A.L.; Darnell, J.E., Jr. Dependence of liver-specific transcription on tissue organization. Mol. Cell. Biol. 1985, 5, 2623–2632. [Google Scholar] [PubMed] [Green Version]
- Messner, S.; Fredriksson, L.; Lauschke, V.M.; Roessger, K.; Escher, C.; Bober, M.; Kelm, J.M.; Ingelman-Sundberg, M.; Moritz, W. Transcriptomic, Proteomic, and Functional Long-Term Characterization of Multicellular Three-Dimensional Human Liver Microtissues. Appl. Vitr. Toxicol. 2018, 4, 1–12. [Google Scholar] [CrossRef] [Green Version]
- Bell, C.C.; Chouhan, B.; Andersson, L.C.; Andersson, H.; Dear, J.W.; Williams, D.P.; Söderberg, M. Functionality of primary hepatic non-parenchymal cells in a 3D spheroid model and contribution to acetaminophen hepatotoxicity. Arch. Toxicol. 2020, 94, 1251–1263. [Google Scholar] [CrossRef] [Green Version]
- Sunman, J.A.; Hawke, R.L.; LeCluyse, E.L.; Kashuba, A.D.M. Kupffer cell-mediated il-2 suppression of cyp3a activity in human hepatocytes. Drug Metab. Dispos. 2004, 32, 359–363. [Google Scholar] [CrossRef] [Green Version]
- Padgham, C.R.W.; Paine, A.J. Altered expression of cytochrome P-450 mRNAs, and potentially of other transcripts encoding key hepatic functions, are triggered during the isolation of rat hepatocytes. Biochem. J. 1993, 289, 621–624. [Google Scholar] [CrossRef] [Green Version]
- Fischer, S.; Loncar, J.; Zaja, R.; Schnell, S.; Schirmer, K.; Smital, T.; Luckenbach, T. Constitutive mRNA expression and protein activity levels of nine ABC efflux transporters in seven permanent cell lines derived from different tissues of rainbow trout (Oncorhynchus mykiss). Aquat. Toxicol. 2011, 101, 438–446. [Google Scholar] [CrossRef]
- Zaja, R.; Munić, V.; Klobučar, R.S.; Ambriović-Ristov, A.; Smital, T. Cloning and molecular characterization of apical efflux transporters (ABCB1, ABCB11 and ABCC2) in rainbow trout (Oncorhynchus mykiss) hepatocytes. Aquat. Toxicol. 2008, 90, 322–332. [Google Scholar] [CrossRef] [PubMed]
- Lončar, J.; Popović, M.; Zaja, R.; Smital, T. Gene expression analysis of the ABC efflux transporters in rainbow trout (Oncorhynchus mykiss). Comp. Biochem. Physiol. Part C Toxicol. Pharmacol. 2010, 151, 209–215. [Google Scholar] [CrossRef]
- Kubitz, R.; Dröge, C.; Stindt, J.; Weissenberger, K.; Häussinger, D. The bile salt export pump (BSEP) in health and disease. Clin. Res. Hepatol. Gastroenterol. 2012, 36, 536–553. [Google Scholar] [CrossRef]
- Leslie, E.M.; Deeley, R.G.; Cole, S.P. Multidrug resistance proteins: Role of P-glycoprotein, MRP1, MRP2, and BCRP (ABCG2) in tissue defense. Toxicol. Appl. Pharmacol. 2005, 204, 216–237. [Google Scholar] [CrossRef] [PubMed]
- Schofield, C.A.; Walker, T.M.; Taylor, M.A.; Patel, M.; Vlachou, D.F.; Macina, J.M.; Vidgeon-Hart, M.P.; Williams, A.; McGill, P.J.; Newman, C.F.; et al. Evaluation of a Three-Dimensional Primary Human Hepatocyte Spheroid Model: Adoption and Industrialization for the Enhanced Detection of Drug-Induced Liver Injury. Chem. Res. Toxicol. 2021, 34, 2485–2499. [Google Scholar] [CrossRef] [PubMed]


| Gene | Abbreviation | Primers Sequences | AT (°C) | E (%) | References |
|---|---|---|---|---|---|
| Bile salt export pump | BSEP | F: 5′-CCGACCAGGGCAAAGTGATT-3′ R: 5′-CAGAATGGGCTCCTGGGATAC-3′ | 60.0 | 93.5 | [4] |
| Catalase | Cat | F: 5′-CACTGATGAGGGCAACTGGG-3′ R: 5′-CTTGAAGTGGAACTTGCAG-3′ | 58.0 | 91.4 | [33] |
| Cytochrome P450 1A | CYP1A | F: 5′-GATGTCAGTGGCAGCTTTGA-3′ R: 5′-TCCTGGTCATCATGGCTGTA-3′ | 60.0 | 99.9 | [4] |
| Cytochrome P450 3A27 | CYP3A27 | F: 5′-GACGGTGGAGATCAACG-3′ R: 5′-GAGGATCTCGACCATGG-3′ | 60.0 | 96.2 | [4] |
| Estrogen receptor alpha | ERα | F: 5′-GACATGCTCCTGGCCACTGT-3′ R: 5′-TGGCTTTGAGGCACACAAAC-3′ | 61.6 | 91.2 | [34] |
| Glutathione S-transferase | GST | F: 5′-AGCTGCTCCCAGCTGATCC-3′ R: 5′-CAAACCACGGCCACATCATGTAATC-3′ | 60.0 | 92.5 | [35] |
| Multidrug resistance protein 1 | MDR1 | F: 5′-ACGTGCGCTCCCTGAACGTG-3′ R: 5′-GCGTTGGCCTCCCTAGCAGC-3′ | 60.0 | 103.6 | [35] |
| Multidrug resistance-associated protein 2 | MRP2 | F: 5′-CCATTCTGTTCGCTGTCTCA-3′ R: 5′-CTCGTAGCAGGGTCTGGAAG-3′ | 60.0 | 98.5 | [4] |
| UDP–glycosyltransferase | UGT | F: 5′-ATAAGGACCGTCCCATCGAG-3′ R: 5′-ATCCAGTTGAGGTCGTGAGC-3′ | 60.0 | 100.8 | [4] |
| Vitellogenin A | VtgA | F: 5′-AACGGTGCTGAATGTCCATAG-3′ R: 5′-ATTGAGATCCTTGCTCTTGGTC-3′ | 62.9 | 99.0 | [34] |
| Zona pellucida glycoprotein 2.5 | ZP 2.5 | F: 5′-ATCAATAACCACAGCCACAATG-3′ R: 5′-ACCAGGGACAGCCAATATG-3′ | 55.0 | 99.0 | [36] |
| Glyceraldehyde-3-phosphate dehydrogenase | Gapdh | F: 5′-CCACCTATGTAGTTGAGTC-3′ R: 5′-ACCTTGAGGGAGTTATCG-3′ | 55.0 | 92.8 | [37] |
| Ribosomal protein l8 | rpl8 | F: 5′-TCAGCTGAGCTTTCTTGCCAC-3′ R: 5′-AGGACTGAGCTGTTCATTGCG-3′ | 59.0 | 93.8 | [34] |
| β-actin | β-act | F: 5′-TCTGGCATCACACCTTCTAC-3′ R: 5′-TTCTCCCTGTTGGCTTTGG-3′ | 55.0 | 96.1 | [38] |
| Elongation factor-1 alpha | Ef1α | F: 5′-TGCCACACTGCTCACATC-3′ R: 5′-TCTCCAGACTTCAGGAACTTG-3′ | 55.0 | 109.0 | [38] |
Disclaimer/Publisher’s Note: The statements, opinions and data contained in all publications are solely those of the individual author(s) and contributor(s) and not of MDPI and/or the editor(s). MDPI and/or the editor(s) disclaim responsibility for any injury to people or property resulting from any ideas, methods, instructions or products referred to in the content. |
© 2023 by the authors. Licensee MDPI, Basel, Switzerland. This article is an open access article distributed under the terms and conditions of the Creative Commons Attribution (CC BY) license (https://creativecommons.org/licenses/by/4.0/).
Share and Cite
Alves, R.F.; Lopes, C.; Rocha, E.; Madureira, T.V. A Step Forward in the Characterization of Primary Brown Trout Hepatocytic Spheroids as Experimental Models. Animals 2023, 13, 2277. https://doi.org/10.3390/ani13142277
Alves RF, Lopes C, Rocha E, Madureira TV. A Step Forward in the Characterization of Primary Brown Trout Hepatocytic Spheroids as Experimental Models. Animals. 2023; 13(14):2277. https://doi.org/10.3390/ani13142277
Chicago/Turabian StyleAlves, Rodrigo F., Célia Lopes, Eduardo Rocha, and Tânia V. Madureira. 2023. "A Step Forward in the Characterization of Primary Brown Trout Hepatocytic Spheroids as Experimental Models" Animals 13, no. 14: 2277. https://doi.org/10.3390/ani13142277