Article

Genome-Wide Association Study of Body Conformation Traits in a Three-Way Crossbred Commercial Pig Population

1
College of Animal Science and National Engineering Research Center for Breeding Swine Industry, South China Agricultural University, Guangzhou 510642, China
2
Guangdong Provincial Key Laboratory of Agro-Animal Genomics and Molecular Breeding, South China Agricultural University, Guangzhou 510642, China
3
College of Animal Science and Technology, Zhongkai University of Agriculture and Engineering, Guangzhou 510225, China
4
Yunfu Subcenter of Guangdong Laboratory for Lingnan Modern Agriculture, Yunfu 527400, China
*
Authors to whom correspondence should be addressed.
These authors contributed equally to this work.
Animals 2023, 13(15), 2414; https://doi.org/10.3390/ani13152414
Submission received: 24 May 2023 / Revised: 28 June 2023 / Accepted: 5 July 2023 / Published: 26 July 2023
(This article belongs to the Section Animal Genetics and Genomics)

Abstract

:

Simple Summary

In this study, a genome-wide association study (GWAS) was conducted on 1518 Duroc × (Landrace × Yorkshire) commercial pigs to investigate the genetic basis of body conformation traits. The traits analyzed included body length, body height, chest circumference, abdominal circumference, and waist circumference. The researchers used two statistical models, a mixed linear model (MLM) and a fixed and random model circulating probability unification (FarmCPU), to identify significant genetic variants associated with these traits. A total of 60 significant single nucleotide polymorphisms (SNPs) were discovered in the crossbred pigs. Furthermore, the researchers identified a novel significant quantitative trait locus (QTL) on chromosome SSC7 (Sus scrofa chromosome 7) that was specifically associated with waist circumference. These findings contribute to our understanding of the genetic mechanisms underlying body conformation traits in crossbred commercial pigs.

Abstract

Body conformation is the most direct production index, which can fully reflect pig growth status and is closely related to critical economic traits. In this study, we conducted a genome-wide association study (GWAS) on body conformation traits in a population of 1518 Duroc × (Landrace × Yorkshire) commercial pigs. These traits included body length (BL), body height (BH), chest circumference (CC), abdominal circumference (AC), and waist circumference (WC). Both the mixed linear model (MLM) and fixed and random model circulating probability unification (FarmCPU) approaches were employed for the analysis. Our findings revealed 60 significant single nucleotide polymorphisms (SNPs) associated with these body conformation traits in the crossbred pig population. Specifically, sixteen SNPs were significantly associated with BL, three SNPs with BH, thirteen SNPs with CC, twelve SNPs with AC, and sixteen SNPs with WC. Moreover, we identified several promising candidate genes located within the genomic regions associated with body conformation traits. These candidate genes include INTS10, KIRREL3, SOX21, BMP2, MAP4K3, SOD3, FAM160B1, ATL2, SPRED2, SEC16B, and RASAL2. Furthermore, our analysis revealed a novel significant quantitative trait locus (QTL) on SSC7 specifically associated with waist circumference, spanning an 84 kb interval. Overall, the identification of these significant SNPs and potential candidate genes in crossbred commercial pigs enhances our understanding of the genetic basis underlying body conformation traits. Additionally, these findings provide valuable genetic resources for pig breeding programs.

1. Introduction

Body conformation traits are critical indicators of swine breeding objectives that directly reflect physical size, body structure, and development [1,2,3,4,5]. These factors are closely related to their physiological function, production performance, disease resistance, and adaptability to external living conditions. Furthermore, previous studies have revealed positive genetic correlations between body-conformation-related traits and body growth traits [6,7,8].
The pig QTL database (Release 49) currently reports 35,384 QTLs associated with 716 traits, including one hundred and fifty-eight, two hundred and twenty, thirty-five, thirty-seven, and two QTLs related to body height (BH), body length (BL), chest circumference (CC), abdominal circumference (AC), and waist circumference (WC), respectively [9]. Several studies have revealed significant genes and SNPs associated with body conformation traits using GWAS. For example, Li et al. identified 714 significantly associated SNPs located at 39 regions for body traits and seven functionally related candidate genes [10]. Zhou et al. showed that ITGA11, TLE3, and GALC might play a role in the body conformation traits based on single and multi-trait GWASs in two Duroc pig populations [11]. Hong et al. reported that a highly significant SNP (S17_15781294) located on Sus scrofa chromosome 7 (SSC7) explained 9.09% of the genetic variance for body length and 9.57% of the genetic variance for body height in Large White pigs [4]. These findings have provided multiple molecular markers to porcine breeding for body conformation traits.
Based on previous research, most GWAS studies have employed mixed linear models (MLM), a commonly used method for addressing population structure and genetic relatedness when deciphering the genetic architecture of complex traits in livestock [12]. However, this model has limitations in accurately estimating marker effects as most quantitative traits are influenced by multiple loci, leading to confounding issues [13]. The fixed and random model circulating probability unification (FarmCPU) model offers an alternative solution by separating the MLM into a fixed effect model and a random effect model that uses pseudo-quantitative trait nucleotides (QTNs) [13]. This multi-locus model has been proven to be more effective in detecting candidate genes by resolving confounding issues in numerous studies in livestock and plants [13,14,15]. Recently, many researchers have combined the two approaches to reveal more trait-related SNPs and genes [16,17].
This study aimed to detect new genetic variants and identify candidate genes for body conformation traits by utilizing MLM and FarmCPU-based genome-wide association studies in 1518 crossbred commercial pigs. This approach was taken as most previous GWAS analyses of body conformation traits were limited to a single method and only focused on purebred pigs, leading to fewer candidate genes being identified and no causal mutations found. Overall, the findings suggest that genetic factors play a significant role in determining body size and shape traits in pigs, and identifying the associated genes and pathways may contribute to improving pork production and understanding obesity in humans.

2. Materials and Methods

2.1. Ethics Statement

All animals used in this study were handled following the specifications for the care and use of experimental animals established by the Ministry of Agriculture of China. The ethics committee of South China Agricultural University (Guangzhou, China) approved this study especially. The experimental animals were not anesthetized or euthanized in this study.

2.2. Animals and Phenotypic Data

The experimental animals were derived from a commercial crossbred population of pigs. In brief, 84 Duroc males were mated with 397 Landrace × Yorkshire females, resulting in a large cohort of offspring (757 boars and 764 sows). All pigs were maintained under consistent feeding conditions and raised at four farms operated by Wen’s Foodstuffs Group Co., Ltd. in Guangdong, China. After reaching a fattening weight, 1518 pigs born between 2018 and 2019 were processed for phenotype recording with an average body weight of 115 kg in 13 batches. All the pigs were measured on the following traits: BH (body height) was measured from shoulder to ground; BL (body length) was measured from the midpoint of the ear to the tail [4]; the CC (chest circumference), AC (abdominal circumference), and WC (waist circumference) were measured by circling the trailing edge of the scapula, the largest part of the abdomen, and the front edge region of the hind leg in the pigs [11], respectively. All five body conformation trait measurements were performed on the same flat surface and the pig was kept in a natural standing posture during the measurement.

2.3. Genotypes and Quality Control

The genomic DNA of each pig was extracted from ear tissue via a standard phenol/chloroform method and was diluted to 50 ng/μL [18]. The 1518 DLY pigs were genotyped using a GeneSeek Porcine 50K BeadChip (Neogen, Lincoln, NE, USA), containing 50,703 SNPs [19]. The SNP data quality control (QC) was conducted using PLINK v1.90 software [20]. Briefly, animals and SNPs with call rates of >0.90, minor allele frequency > 0.01, and p-value > 10−6 for the Hardy–Weinberg equilibrium test were included. Furthermore, all SNPs located on the sex chromosome and unmapped regions were excluded, following our previous study [19,21,22]. After QC, 1518 pigs and 28,393 SNPs were available for further analysis.

2.4. Pearson’s Correlation Coefficient and Estimation of Genetic Parameters

In this study, we used Pearson’s correlation coefficient to calculate the phenotypic correlation ( r p   ) between the traits [11]. Moreover, we estimated the genetic correlation and heritability using GCTA in bivariate mode. To assess the genetic correlation between two traits, we conducted a bivariate genome-based restricted maximum likelihood (GREML) analysis and calculated the genetic correlation coefficient using the following formula [11,23]:
r g   = σ g 1 g 2 σ g 1 σ g 2
r g   is the genetic correlation coefficient between two traits, the subscripts “1” and “2” denote the two traits, σ g 1 g 2 refers to the genetic covariance, and σ g represents the square root of the genetic variance for the trait (as captured by all SNPs).
The restricted maximum likelihood method was used to estimate the phenotypic variance explained by the significant SNPs for BL, BH, CC, AC, and WC traits using GCTA software (version 1.93.2 beta) [24]. The SNP-based heritability and phenotypic variance explained by the significant SNPs was calculated in the following model [17]:
y = X β + g + ε   with   v a r y = A g σ g 2 + I σ ε 2
where y refers to the vector of phenotypic values; β is a vector of fixed effects; X is an incidence matrix for β ; g represents the vector of the aggregate effect of all the qualified SNPs for the pigs; 𝜀 is a vector of residual effects with   ε ~ N   0 ,   I σ ε 2 ; I is the identity matrix; v a r y is the phenotypic variance explained by the significant SNPs or heritability; A g is the genetic relationship matrix (GRM); σ g 2 corresponds to the additive genetic variance captured by either the selected SNPs or genome-wide SNPs; and σ ε 2 refers to the residual variance.

2.5. Population Structure Analysis

Population stratification is a major confounding factor that can affect the reliability of GWAS. To account for this, we performed a principal component analysis (PCA) using the qualified SNPs to investigate the population structure of DLY pigs and added them as fixed effects in our analysis. A Q–Q plot was generated using the R software to assess the population stratification level.

2.6. Association Analyses

2.6.1. MLM-Based GWAS

In the present study, the MLM was performed by using GEMMA software (version 0.98.5) [25] for five body conformation traits with the command “-lmm 1”. The statistical model is described as follows:
y = W α + X β + u + ε
where y is the vector of phenotypic values in DLY populations; W is the incidence matrix of covariates (fixed effects), including sex, farms, body weight at the time of measurement for the five traits, and the top-five PCAs [19]; α is a vector of the corresponding coefficients including the intercept; X is the vector of all marker genotypes; β represents the corresponding effect of marker size; u refers to an n × 1 vector of random effects, with u ~ M V N n ( 0 , K σ g 2 ); and ε is an vector of errors, with ε ~ M V N n 0 , I σ e 2 . K is a genomic relatedness matrix; σ g 2 is the additive genetic variance; I is the identity matrix; I σ e 2 is the residual variance; n refers to the number of analyzed DLY pigs; and M V N denotes multivariate normal distribution.

2.6.2. FarmCPU-Based GWAS

The GAPIT (version 3.0) R package [26,27] was used to conduct FarmCPU-based GWAS. All parameters were set as default. Briefly, the FarmCPU model consists of two parts: the fixed-effect model (FEM) and the random-effect model (REM), which is evaluated iteratively. The effects in the FEM include the top five principal components, sex, and pseudo-QTNs as follows [13,28]:
y = P b p + M t b t + s j d j + e
where y is a vector of phenotypes of the analyzed trait; b p is a vector of fixed effects including the top-five PCAs, sex, farms, and body weight; b t is a vector of the fixed effects for the pseudo-QTNs; P and M t are the corresponding incidence matrices for b p and b t , respectively; d j is the effect of the j-th candidate SNP; s j is the genotype for the j-th candidate SNP; and e is a vector of the residuals. The REM model updates the pseudo-QTNs using the SUPER (settlement of MLM under progressively exclusive relationship) algorithm as follows:
y = u + e
where y is a vector of phenotypes, u ~ M V N 0 , 2 K σ u 2 with σ u 2 being the unknown genetic variance and K being the kinship matrix computed by the pseudo-QTNs, and e is a vector of the residuals.

2.7. Identification of Significant Single Nucleotide Polymorphisms Associated with Body Conformation Traits

To reduce the number of false negative results, the false discovery rate (FDR) was used to determine the threshold [29,30]. FDR was set as 0.01, and the threshold p-value was defined as P = FDR × N / M , where N is the number of SNPs with p < 0.01 in the GWAS results, and M refers to the total number of qualified SNPs of crossbred pigs.

2.8. Haplotype Block Analysis

The software Plink v1.90 [20] and Haploview4.2 [31] were used for haplotype block analysis. Linkage disequilibrium (LD) blocks were defined using Haploview4.2 based on default parameters according to the criteria of Gabriel et al. [32].

2.9. Candidate Gene Search and Functional Annotation

According to our previous findings, the LD in DLY pigs is typically low, with an R-squared value of 0.2 and a genetic distance of around 200 kb [19]. However, this distance is not enough to find a candidate gene. We retrieved genes within 0.5 Mb on either side of the significant SNPs using the gene annotation information of pig reference genome Sus scrofa 11.1 from the Ensemble genome database, accessed in October 2022 [33]. To gain insight into potential candidate genes, we performed further Gene Ontology (GO) term annotation, and Kyoto Encyclopedia of Genes and Genomes (KEGG) pathway analysis in KOBAS v3.0 [34]. Enriched terms with corrected p-values < 0.05, as determined by Fisher’s exact test and Benjamini–Hochberg correction, were selected for further exploration of genes involved in biological pathways and processes.

3. Results and Discussion

3.1. Phenotype Statistics and Correlations among the Traits

Table 1 presents the summary statistics of the phenotypic traits. The DLY population showed an average body length (BL) of 123.68 cm, body height (BH) of 64.61 cm, chest circumference (CC) of 112.82 cm, abdominal circumference (AC) of 121.32 cm, and waist circumference (WC) of 110.43 cm. As shown in Figure S1, our normality test results demonstrated that all phenotypic values were normally distributed. The DLY population exhibited large phenotypic diversity, with body length ranging from 101 to 145 cm and chest circumference ranging from 88 to 140 cm (Table 1). The coefficients of variation for BL, BH, CC, AC, and WC were 5.78%, 5.64%, 7.26%, 7.07%, and 7.95%, respectively (Table 1). The heritability of BL, BH, CC, AC, and WC ranged from 0.21 to 0.35, indicating moderate heritability and potential for genetic improvement. Among these traits, BL, BH, and CC showed higher heritability compared to Chinese native pigs and Large White pigs [4,5]. Moreover, the higher heritability of CC, AC, and WC compared to Duroc pigs suggested that breed-specific heritability variations may exist [11]. Figure 1 shows the genetic and phenotypic correlation coefficients among the traits. The results showed a high phenotypic and genetic correlation of CC, AC, and WC ( r g > 0.90 ,   r p > 0.90 ). This correlation was higher than that observed in our previous study on Duroc pigs ( r g > 0.77 ) [11], suggesting that these traits can be simultaneously improved in pig breeding. Interestingly, BH was negatively genetically correlated with CC ( r g = 0.49 ), WC ( r g = 0.63 ), and AC ( r g = 0.57 ). In breeding, negative genetic correlation between traits means that selection for improvement in one trait is likely to result in a decrease in the other trait. This trade-off can be managed by setting breeding goals that prioritize which traits are most important for the specific breeding objective, and using selection indices that balance the relative weights of the traits in the breeding program. Body height and the three circumference traits show a negative genetic correlation, which means that selecting individuals with higher body height for breeding tends to result in individuals with smaller circumference traits being selected. This may be because individuals that grow faster during development tend to allocate more growth resources, resulting in slower growth in other areas [35,36].

3.2. Genome-Wide Association Studies for Body Conformation Traits

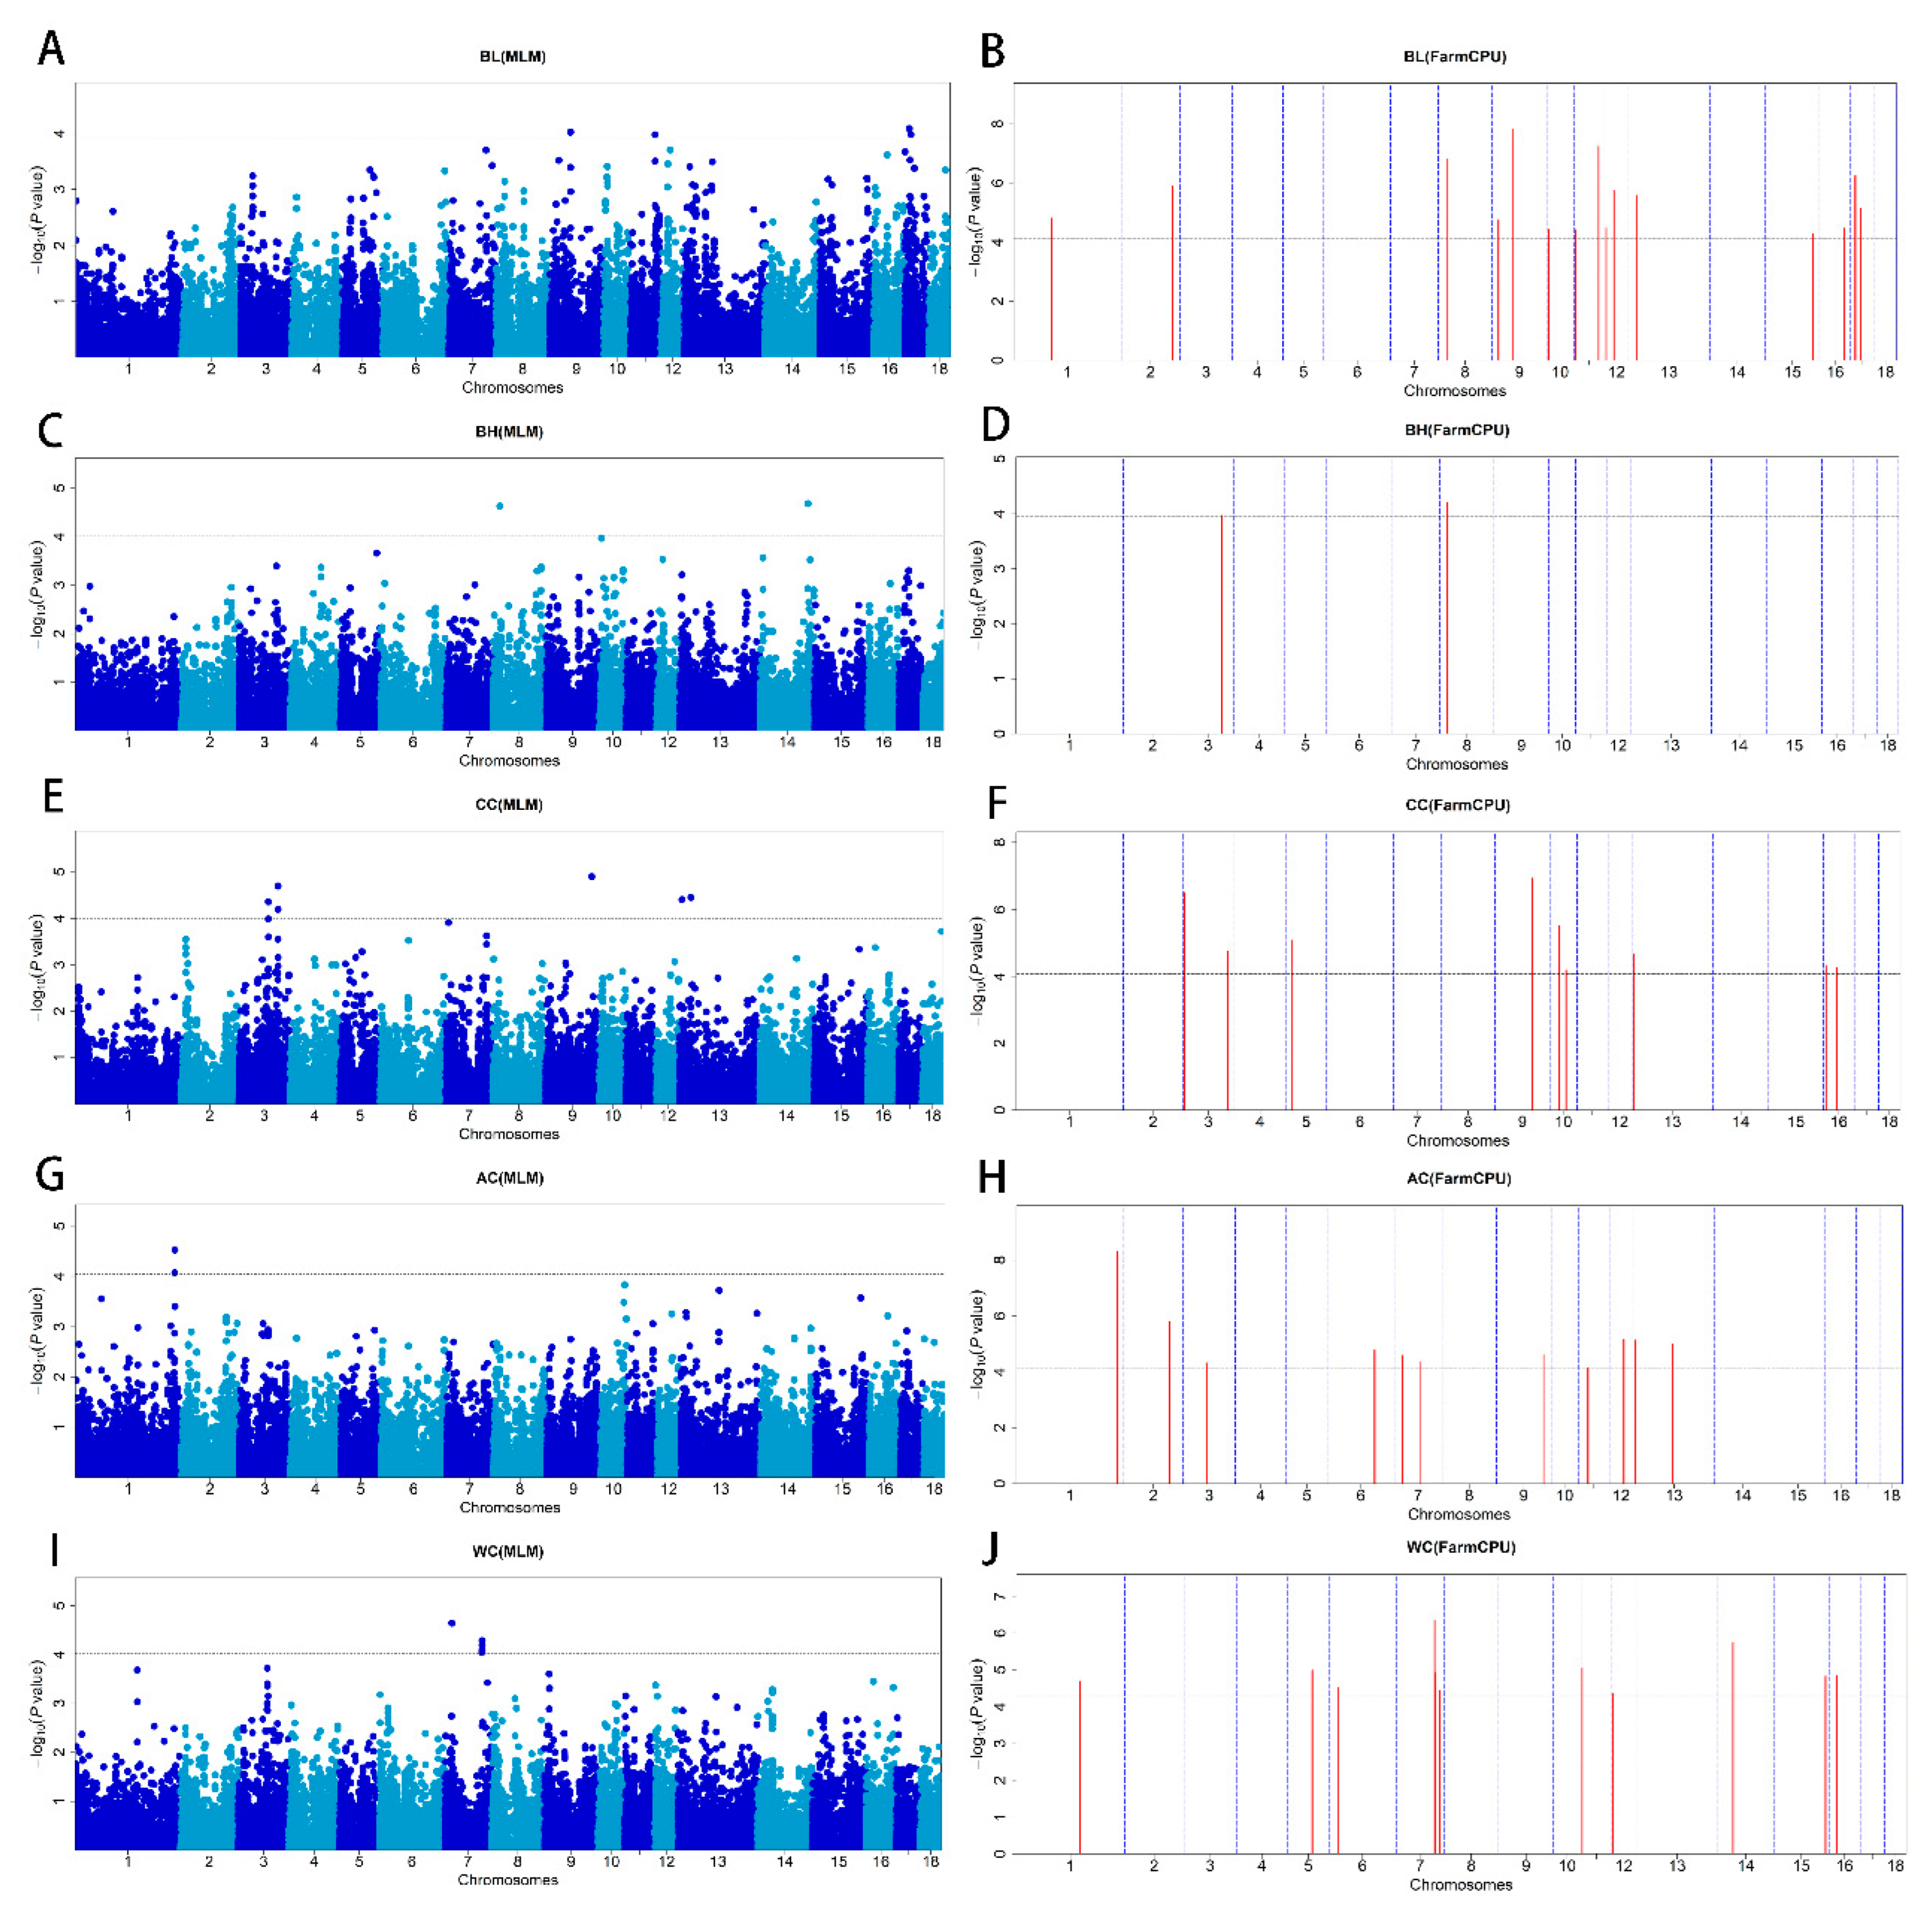
In our results, the Q–Q plot with genomic inflation factors (λ) showed no systematic inflation of test statistics for both methods of GWAS (Figure S2). A total of 60 SNPs surpassed the FDR threshold of 0.01 in the MLM and FarmCPU-based GWAS methods. Manhattan plots were generated to visualize the GWAS results for the five conformation traits (Figure 2A–J). Of these SNPs, sixteen were significantly associated with BL, three with BH, thirteen with CC, twelve with AC, and sixteen with WC. The MLM-based GWAS detected 20 significant SNPs, the FarmCPU-based GWAS detected 52 significant SNPs, and both methods identified 12. FarmCPU-based GWAS detected additional SNPs and confirmed most of the significant SNPs in the MLM-based GWAS, suggesting it can increase statistical power and complement MLM-based GWAS results [16]. In this study, 278 functional genes were located within 500 kb of the significant SNPs. Furthermore, we utilized the 278 functional genes to perform gene function enrichment analysis in order to identify pathways and biological processes that are associated with the five conformation traits in pigs. As a result, 11 genes were selected as promising candidate genes for body conformation traits after querying the literature for information about the association between all candidate genes’ nearest peak SNPs and the analyzed body conformation traits. These candidate genes warrant further investigation to understand the genetic architecture of these traits better.
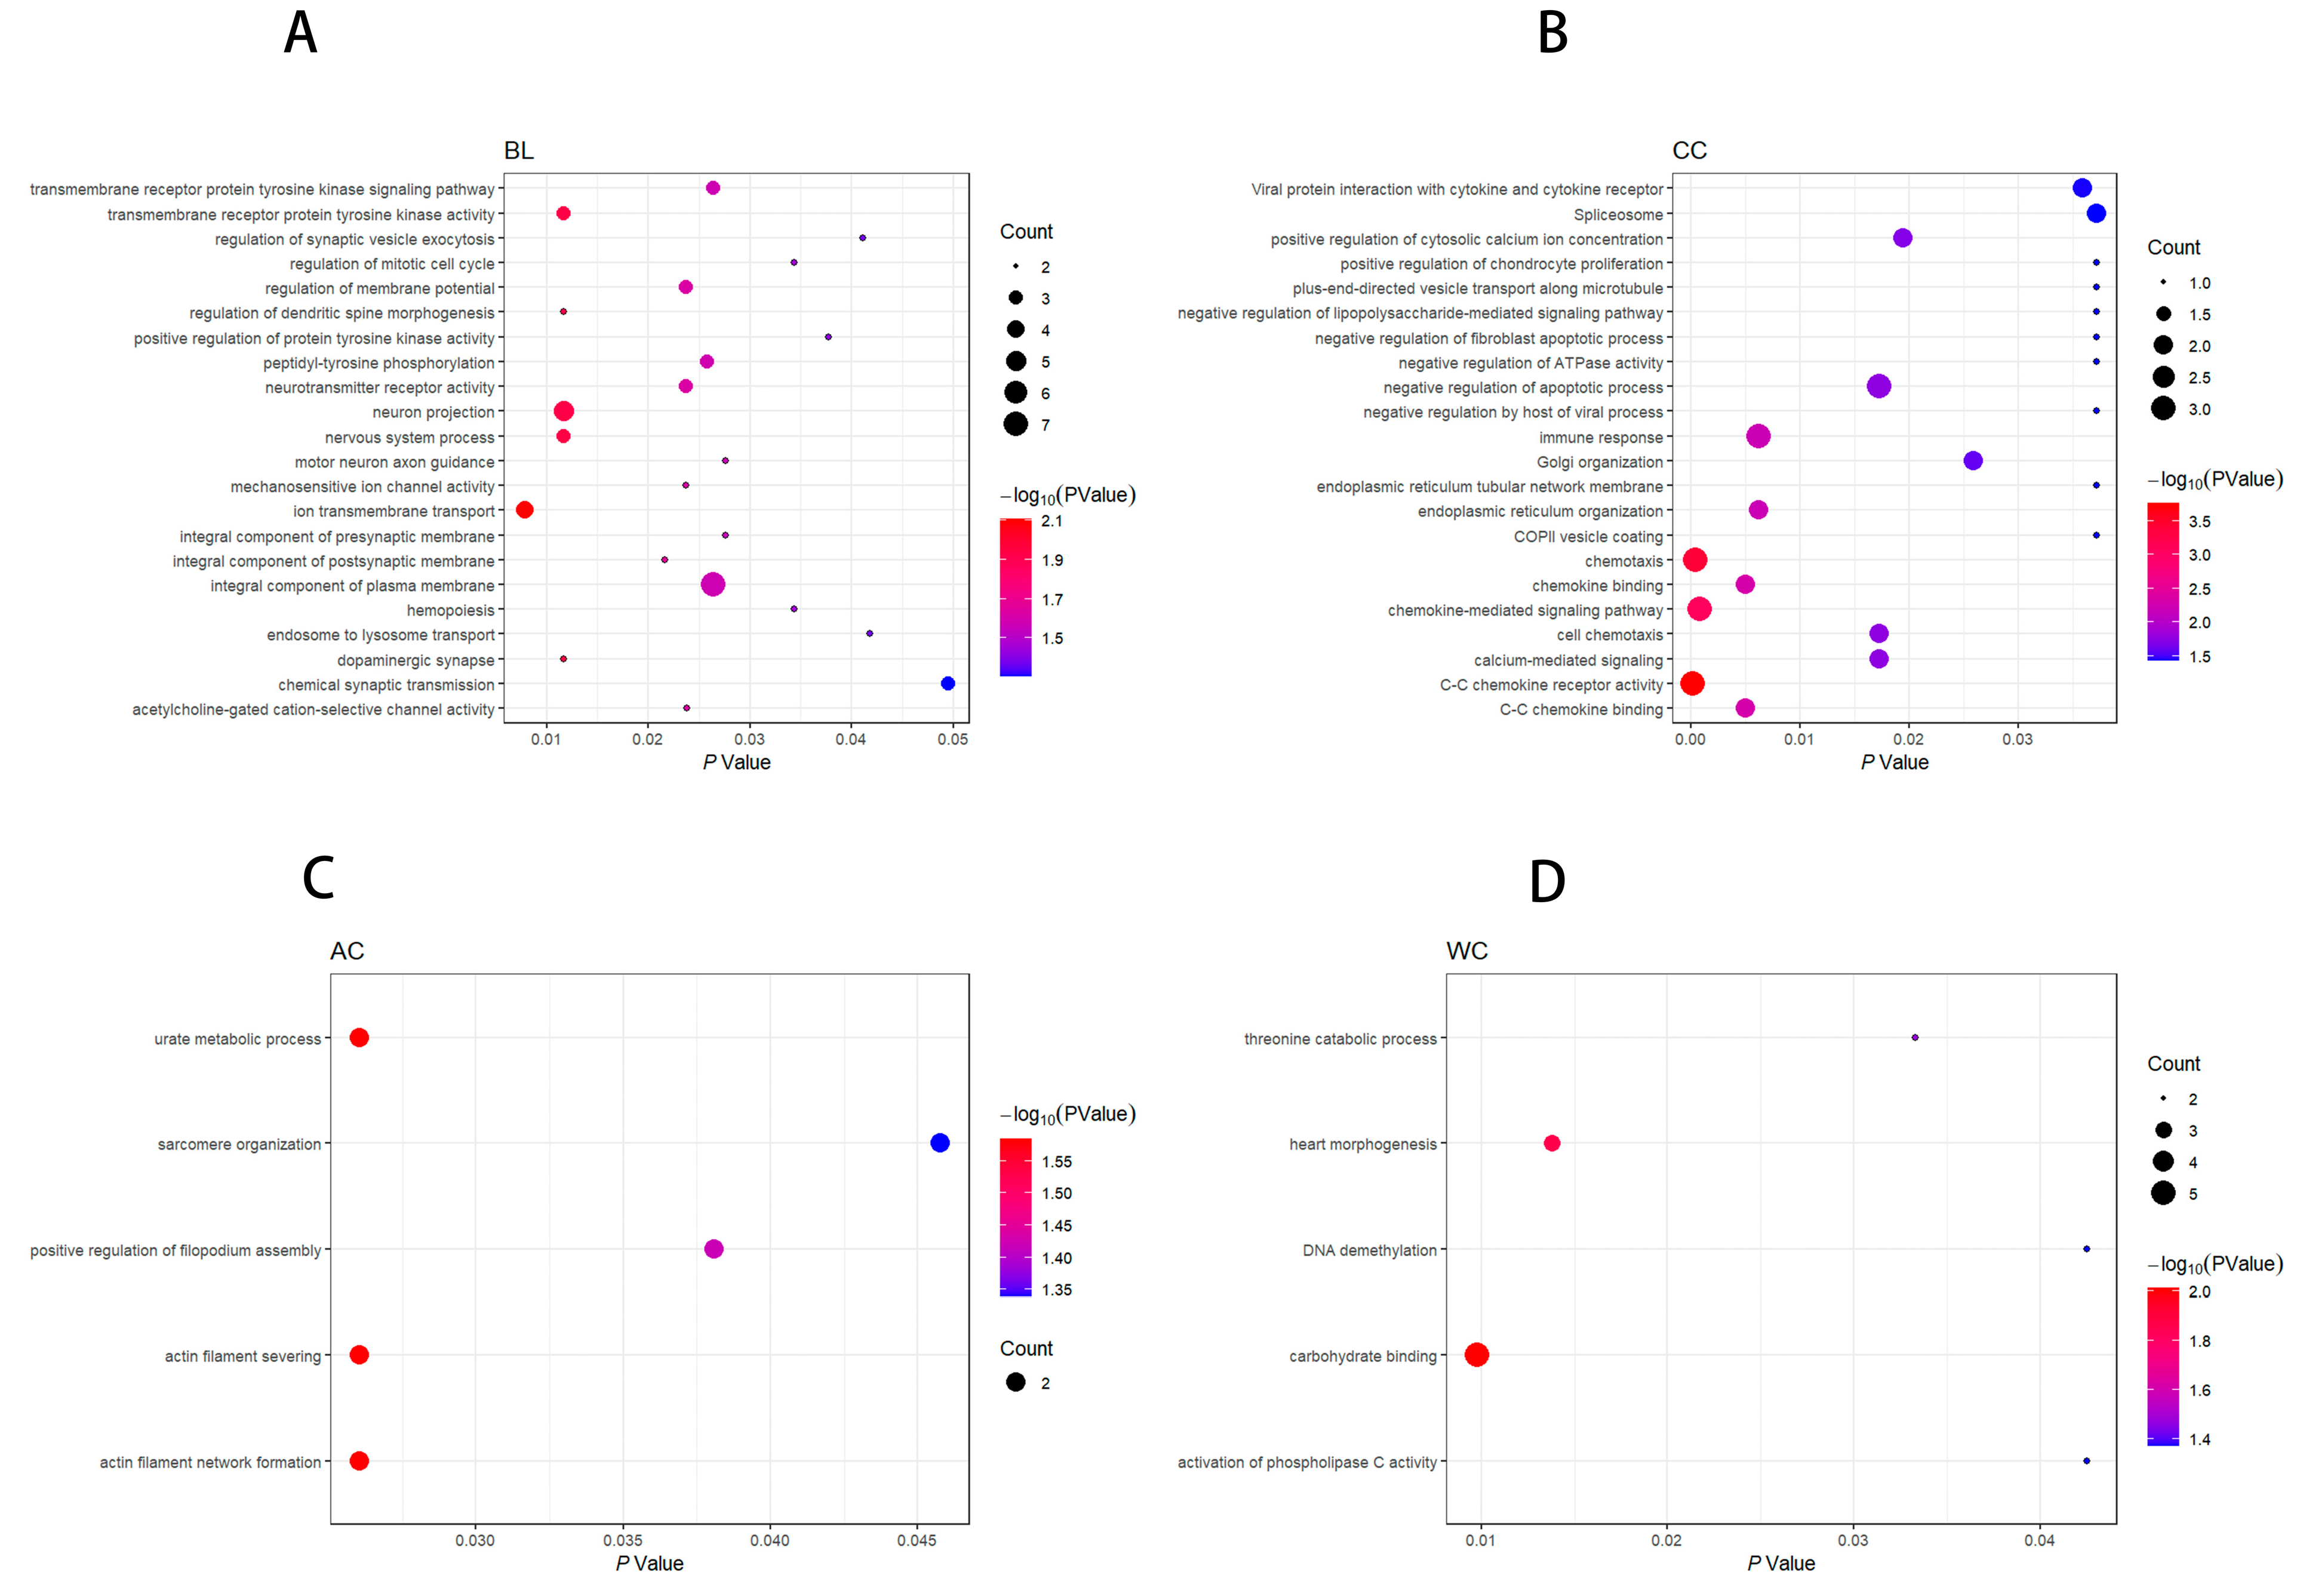
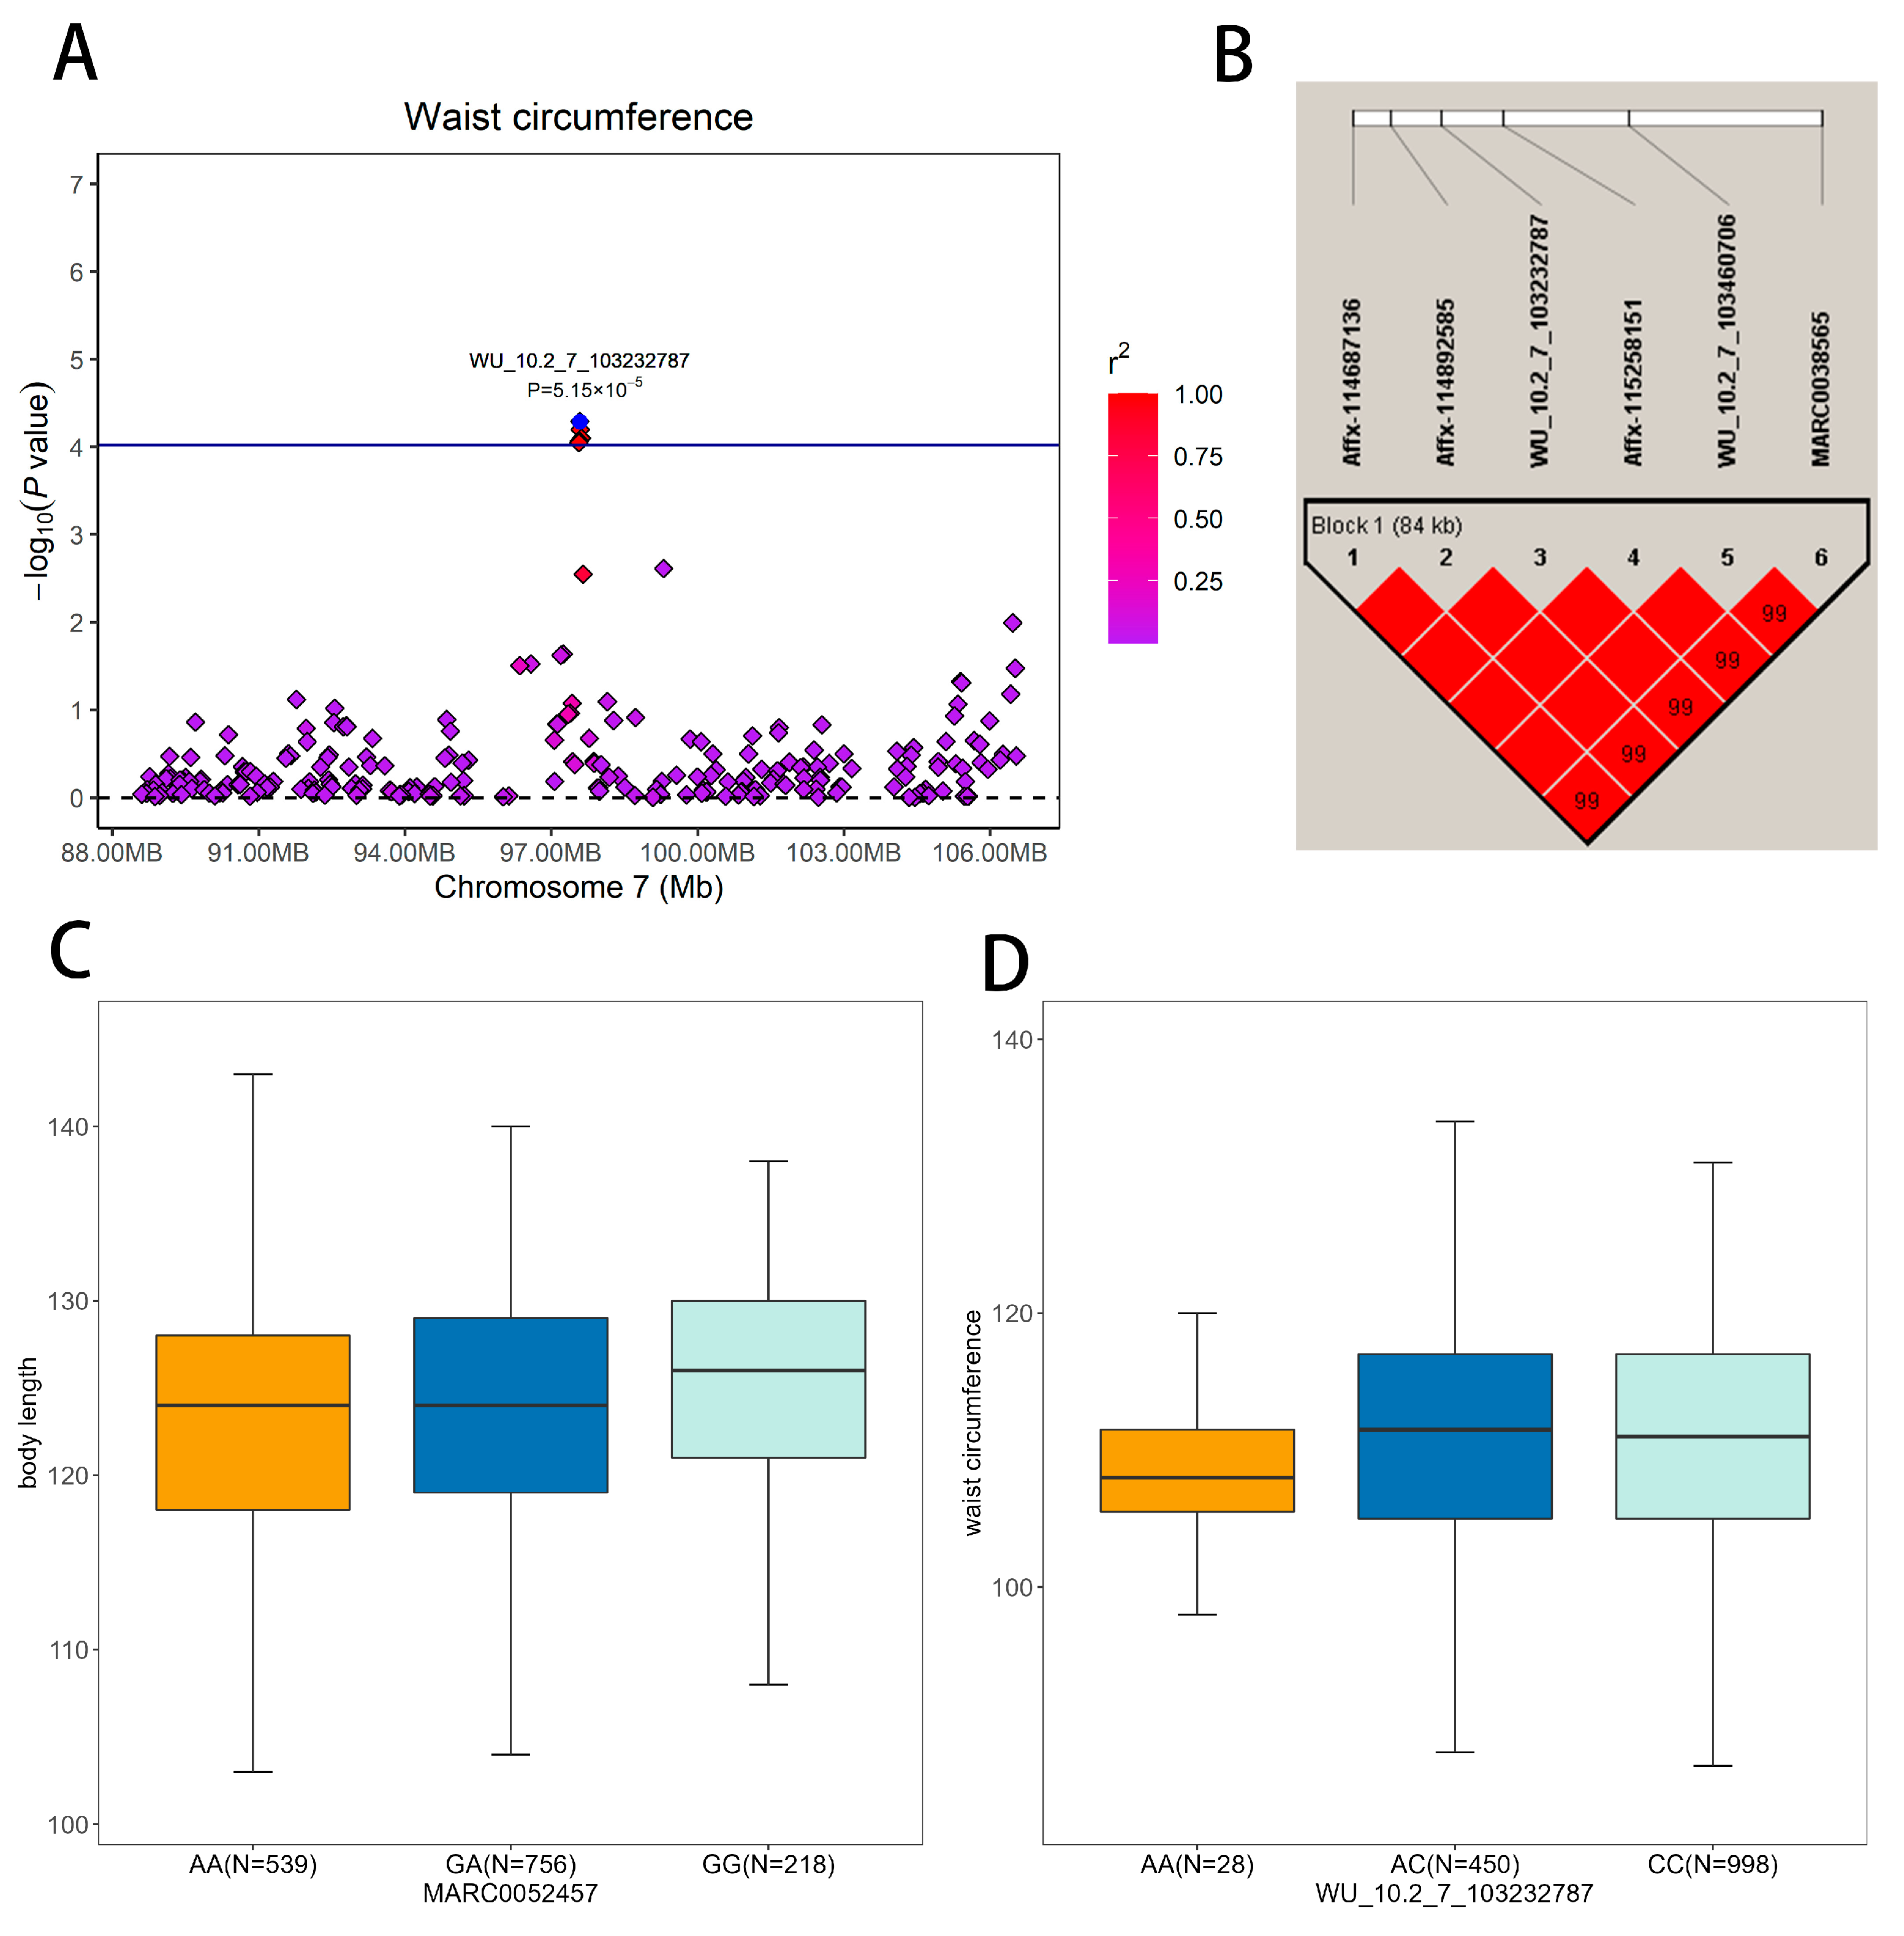
Body length and height are typically not prioritized as target breeding traits for pigs; nevertheless, these morphological features may significantly impact the value of a sow during purchase [4]. We detected sixteen SNPs significantly associated with body length, three by MLM-based GWAS and fifteen by FarmCPU-based GWAS (Figure 2A,B and Table 2). Gene set enrichment analysis revealed many terms that might be relevant to body length, including regulation of the mitotic cell cycle, dopaminergic synapse, and other related pathways (Figure 3A and Table S1). These pathways play important roles in cell division and differentiation, which are essential for growth and development [37]. Three SNPs (MARC0030380, ALGA0105578, and MARC0052457), located near INTS10, KIRREL3, and SOX21, were identified by both GWAS methods. The most significant SNP was MARC0052457 (p = 5.75 × 10⁻⁸) on SSC11 upstream of SOX21, explaining 1.3% of the phenotypic variance for body length. Moreover, individuals with genotype GG had a 2.51 cm increase in body length compared to individuals with genotype AA (Figure 4C). Recently, Wang et al. identified SOX21 as a candidate gene for growth-related traits by selection signal analysis (runs of homozygosity, EigenGWAS) in 150 Laiwu pigs [38]. Mice lacking SOX21 have reduced growth and increased energy expenditure. Moreover, further research and investigations are needed to elucidate the role of SOX21 and its potential impact on height regulation. BMP2 (bone morphogenetic protein 2), another candidate gene for body length, has also been identified as a promising candidate gene for carcass length in pigs [39]. Zhou et al. and Hong et al. reported that BMP2 plays a role in bone development and is associated with body length [4,40]. Li et al. firmed the relationship of the genotype of the GWAS lead SNP rs80965549 with the expression of the BMP gene by transcriptomic profile analysis of porcine cartilage tissues [41]. BMP2 can induce chondrogenic differentiation, osteogenic differentiation, and endochondral ossification in stem cells [42]. BMP2 also regulates early myogenesis and could inhibit proliferation or induce presumptive muscle cells to undergo apoptosis, thereby inhibiting muscle development [43]. Our results, combined with the functional studies from previous work on BMP2, confirm that this gene is likely to be the causal gene for body length in pigs.
Using both MLM and FarmCPU-based GWAS methods, we identified three SNPs associated with body height: DIAS0000802 on SSC 3, WU_10.2_8_18963576 on SSC 8, and ALGA0081919 on SSC 14. Nearby the significant SNPs, we identified potential candidate genes MAP4K3, SOD3, and FAM160B1, as shown in Figure 2C,D and Table 2. One of the SNPs (DIAS0000802) was detected by both methods. MAP4K3 mutants display phenotypes of low nutrient availability, such as reduced growth rate, small body size, and low lipid reserve [44]. SOD3 was considered a potential candidate gene for BMI in Yorkshire pigs [45].
Chest, waist, and abdominal circumference are highly genetically correlated traits that determine animal body size and serve as indicators of fatness and leanness. For chest circumference, 13 SNPs reached the significant threshold, and these 13 significant SNPs were found to be in close proximity to 11 protein-coding genes. The MLM-based GWAS detected seven significant SNPs, and the FarmCPU-based GWAS detected ten (Figure 2E,F and Table 2). Interestingly, four of these significant SNPs were detected by both methods, suggesting their robust association with the trait, including three essential candidate genes: ATL2, SPRED2, and SEC16B. KEGG pathways and GO terms were enriched for candidate genes related to calcium signaling, such as positive regulation of cytosolic calcium ion concentration and calcium-mediated signaling (Figure 3B and Table S1). Calcium signaling plays an essential role in various physiological processes [46], including growth and development. Zhou et al. found SPRED2 was significantly associated with chest and cannon circumference [40]. SPRED2 was mainly expressed at the leading edges of further outgrowing structures and in folds of newly forming grooves. Therefore, SPRED2 is likely to regulate dynamic developmental processes [47]. SPRED2-knocked mice exhibited reduced growth and body weight, and shorter tibia length, consistent with previous studies linking body length to circumference traits. Additionally, they showed narrower growth plates compared to wild-type mice [48]. The gene SEC16B, which encodes for both long SEC16L and short SEC16B proteins required to transport secretory molecules from the endoplasmic reticulum (ER) to the Golgi apparatus, is closely associated with growth and obesity [49]. Many studies have reported its strong association with obesity in humans, making it a promising candidate gene for obesity-related traits [50,51,52].
Abdominal circumference is an indicator of obesity, as it reflects excessive fat accumulation in the abdominal area, resulting in abdominal obesity. In our study, 13 significant SNPs were found distributed on nine chromosomes (Figure 2G,H and Table 2). The most significant SNP detected by FarmCPU is WU_10.2_9_131985977 (p-value = 2.42 × 10⁻⁵), which explained 0.3% of the phenotypic variance of AC. GO terms were enriched for candidate genes involved in urate metabolic processes and actin filament network formation (Figure 3C and Table S1). The Pearson correlation between CC and AC reached 0.91, and the genetic correlation was as high as 0.96, indicating that the significant SNPs may jointly influence multiple body conformation traits. RASAL2 is located 110 kb away from SEC16B on SSC 1 mentioned above. The close physical proximity of these two genes suggests that they are likely to co-regulate each other, thereby influencing abdominal circumference and chest circumference. In a combined analysis of Mexican-mestizo children and adults, RASAL2 was significantly associated with waist circumference [53] and positively associated with body mass index in a genome-wide association study in humans [54]. RASAL2 mutant mice showed a drastic decrease in RASAL2 expression and a lean phenotype, displaying decreased adiposity and resistance to high-fat diet-induced metabolic disorders [55].
We identified 16 SNPs that were significantly associated with waist circumference. Only six of these SNPs were identified by the MLM-based GWAS, while eleven were detected by the FarmCPU-based GWAS (Figure 2I,J and Table 2). The most significant SNP, detected by MLM and FarmCPU, was ASGA0062816 (p = 2.42 × 10⁻⁵) on SSC9, which explained 1.63% of the phenotypic variance of WC. These significant SNPs were annotated to 12 coding genes, including three promising candidate genes: CAB39, GRP, and ABCD4. The enriched GO terms included activation of phospholipase C activity and threonine catabolic processes (Figure 3D and Table S1). These pathways involve various biological processes, including lipid metabolism and energy homeostasis [56], which have been linked to obesity in humans and other animals. In humans, individuals who carry minor allele (A) of the Ca binding protein 39 (CAB39) rs6722579 have a higher risk of abdominal obesity (defined as waist circumference >90 cm and 80 cm in males and females, respectively) than those who do not carry the SNP [57]. GRP stimulates the release of gastrin and other gastrointestinal hormones, which affect food intake and may lead to anorexia, bulimia, and obesity if the gene is lacking [58]. In this study, four SNPs associated with waist circumference are located in a QTL region on SSC7 between 97.57 and 97.65 Mb (Sscofa 11.1). Figure 4A,B is a region plot of this QTL and shows the LD pattern between the GWAS peak (WU_10.2_7_103232787) and other significant SNPs, together with the most promising candidate gene ABCD4. This region contained six SNPs, four of which were located within ABCD4, and the other two SNPs were located upstream or downstream of ABCD4. The top site of the haplotype block explained the largest variance of phenotypic variation in SNPs, reaching up to 1.8%. Moreover, individuals with genotype CC had a 2.51 cm increase in waist circumference compared to individuals who carry genotype AA (Figure 4D). Numerous studies have shown that this gene is associated with rib number and total teat number traits [4,59,60].

4. Conclusions

This study performed two GWAS methods for five conformation traits in crossbred commercial pigs. As a result, we identified 60 SNPs significantly associated with five body conformation traits. Furthermore, INTS10, KIRREL3, SOX21, BMP2, MAP4K3, SOD3, FAM160B1, ATL2, SPRED2, SEC16B, RASAL2, CAB39, GRP, and ABCD4 might be promising candidate genes that compose the underlying genetic architecture of porcine body conformation traits. Additionally, a novel significant quantitative trait locus (QTL) for waist circumference was detected on SSC7 within an 84 kb interval. We expect these findings can help scholars understand the genetic basis of porcine body conformation traits and could be applied in pig breeding programs.

Supplementary Materials

The following supporting information can be downloaded at: https://www.mdpi.com/article/10.3390/ani13152414/s1, Figure S1: Five traits’ phenotype normal distribution density. The x-axis is the phenotypic score, and the y-axis is the density. Figure S2: Q–Q plot for five conformation traits. The Q–Q plot is plotted with the x-axis representing the actual measured value of −log10 (p-value) and the y-axis representing the observed value of −log10 (p-value). Table S1: GO and KEGG enrichment results.

Author Contributions

Conceptualization, S.D., Y.Q. and M.Y.; Data curation, C.X.; Formal analysis, E.Z. and J.Y.; Funding acquisition, Z.W.; Investigation, Z.Z., J.W., G.C., J.Y. and S.H.; Methodology, Y.Q. and E.Z.; Software, S.D.; Supervision, Z.Z.; Validation, J.W. and D.R.; Visualization, X.L.; Writing—original draft, S.D.; Writing—review and editing, Y.Q., X.L., D.R. and C.X. All authors have read and agreed to the published version of the manuscript.

Funding

This research was supported by the Key Technologies R&D Program of Guangdong Province project (2022B0202090002) and the Project of Swine Innovation Team in Guangdong Modern Agricultural Research System (2022KJ126).

Institutional Review Board Statement

All animals used in this study were treated in accordance with the guidelines for the use of laboratory animals of the Ministry of Agriculture of China and with the approval of South China Agricultural University (Guangzhou, China), No. 2018F089.

Informed Consent Statement

Not applicable.

Data Availability Statement

The data that support the findings of this study are available from the corresponding author upon reasonable request.

Conflicts of Interest

The authors declare no conflict of interest. The funders had no role in the design of the study; in the collection, analyses, or interpretation of data; in the writing of the manuscript; or in the decision to publish the results.

References

  1. Tan, C.; Wu, Z.; Ren, J.; Huang, Z.; Liu, D.; He, X.; Prakapenka, D.; Zhang, R.; Li, N.; Da, Y.; et al. Genome-wide association study and accuracy of genomic prediction for teat number in Duroc pigs using genotyping-by-sequencing. Genet. Sel. Evol. 2017, 49, 35. [Google Scholar] [CrossRef] [Green Version]
  2. Huang, D.W.; Sherman, B.T.; Lempicki, R.A. Systematic and integrative analysis of large gene lists using DAVID bioinformatics resources. Nat. Protoc. 2009, 4, 44–57. [Google Scholar] [CrossRef] [PubMed]
  3. Sherman, B.T.; Hao, M.; Qiu, J.; Jiao, X.; Baseler, M.W.; Lane, H.C.; Imamichi, T.; Chang, W. DAVID: A web server for functional enrichment analysis and functional annotation of gene lists (2021 update). Nucleic Acids Res. 2022, 50, W216–W221. [Google Scholar] [CrossRef] [PubMed]
  4. Hong, Y.; Ye, J.; Dong, L.; Li, Y.; Yan, L.; Cai, G.; Liu, D.; Tan, C.; Wu, Z. Genome-Wide Association Study for Body Length, Body Height, and Total Teat Number in Large White Pigs. Front. Genet. 2021, 12, 650370. [Google Scholar] [CrossRef] [PubMed]
  5. Zhou, L.; Ji, J.; Peng, S.; Zhang, Z.; Fang, S.; Li, L.; Zhu, Y.; Huang, L.; Chen, C.; Ma, J. A GWA study reveals genetic loci for body conformation traits in Chinese Laiwu pigs and its implications for human BMI. Mamm. Genome 2016, 27, 610–621. [Google Scholar] [CrossRef] [PubMed]
  6. Hoge, M.D.; Bates, R.O. Developmental factors that influence sow longevity. J. Anim. Sci. 2011, 89, 1238–1245. [Google Scholar] [CrossRef] [PubMed]
  7. Le, T.H.; Madsen, P.; Lundeheim, N.; Nilsson, K.; Norberg, E. Genetic association between leg conformation in young pigs and sow longevity. J. Anim. Breed. Genet. 2016, 133, 283–290. [Google Scholar] [CrossRef]
  8. Nikkilä, M.T.; Stalder, K.J.; Mote, B.E.; Rothschild, M.F.; Gunsett, F.C.; Johnson, A.K.; Karriker, L.A.; Boggess, M.V.; Serenius, T.V. Genetic associations for gilt growth, compositional, and structural soundness traits with sow longevity and lifetime reproductive performance. J. Anim. Sci. 2013, 91, 1570–1579. [Google Scholar] [CrossRef] [Green Version]
  9. Hu, Z.L.; Park, C.A.; Reecy, J.M. Bringing the Animal QTLdb and CorrDB into the future: Meeting new challenges and providing updated services. Nucleic Acids Res. 2022, 50, D956–D961. [Google Scholar] [CrossRef]
  10. Li, C.; Duan, D.; Xue, Y.; Han, X.; Wang, K.; Qiao, R.; Li, X.L.; Li, X.J. An association study on imputed whole-genome resequencing from high-throughput sequencing data for body traits in crossbred pigs. Anim. Genet. 2022, 53, 212–219. [Google Scholar] [CrossRef]
  11. Zhou, S.; Ding, R.; Zhuang, Z.; Zeng, H.; Wen, S.; Ruan, D.; Wu, J.; Qiu, Y.; Zheng, E.; Cai, G.; et al. Genome-Wide Association Analysis Reveals Genetic Loci and Candidate Genes for Chest, Abdominal, and Waist Circumferences in Two Duroc Pig Populations. Front. Vet. Sci. 2021, 8, 807003. [Google Scholar] [CrossRef] [PubMed]
  12. Sanchez, M.P.; Tribout, T.; Iannuccelli, N.; Bouffaud, M.; Servin, B.; Tenghe, A.; Dehais, P.; Muller, N.; Del Schneider, M.P.; Mercat, M.J.; et al. A genome-wide association study of production traits in a commercial population of Large White pigs: Evidence of haplotypes affecting meat quality. Genet. Sel. Evol. 2014, 46, 12. [Google Scholar] [CrossRef] [PubMed] [Green Version]
  13. Liu, X.; Huang, M.; Fan, B.; Buckler, E.S.; Zhang, Z. Iterative Usage of Fixed and Random Effect Models for Powerful and Efficient Genome-Wide Association Studies. PLoS Genet. 2016, 12, e1005767. [Google Scholar] [CrossRef]
  14. Kaler, A.S.; Ray, J.D.; Schapaugh, W.T.; King, C.A.; Purcell, L.C. Genome-wide association mapping of canopy wilting in diverse soybean genotypes. Theor. Appl. Genet. 2017, 130, 2203–2217. [Google Scholar] [CrossRef] [PubMed]
  15. Wang, Y.Y.; Li, Y.Q.; Wu, H.Y.; Hu, B.; Zheng, J.J.; Zhai, H.; Lv, S.X.; Liu, X.L.; Chen, X.; Qiu, H.M.; et al. Genotyping of Soybean Cultivars with Medium-Density Array Reveals the Population Structure and QTNs Underlying Maturity and Seed Traits. Front. Plant Sci. 2018, 9, 610. [Google Scholar] [CrossRef] [Green Version]
  16. Zhang, H.; Zhuang, Z.; Yang, M.; Ding, R.; Quan, J.; Zhou, S.; Gu, T.; Xu, Z.; Zheng, E.; Cai, G.; et al. Genome-Wide Detection of Genetic Loci and Candidate Genes for Body Conformation Traits in Duroc × Landrace × Yorkshire Crossbred Pigs. Front. Genet. 2021, 12, 664343. [Google Scholar] [CrossRef]
  17. Zhuang, Z.; Ding, R.; Peng, L.; Wu, J.; Ye, Y.; Zhou, S.; Wang, X.; Quan, J.; Zheng, E.; Cai, G.; et al. Genome-wide association analyses identify known and novel loci for teat number in Duroc pigs using single-locus and multi-locus models. BMC Genom. 2020, 21, 344. [Google Scholar] [CrossRef]
  18. Özşensoy, Y.; Şahin, S. Comparison of different DNA isolation methods and use of dodecyle trimethyl ammonium bromide (DTAB) for the isolation of DNA from meat products. J. Adv. Vet. Anim. Res. 2016, 3, 368–374. [Google Scholar] [CrossRef]
  19. Zhuang, Z.; Wu, J.; Xu, C.; Ruan, D.; Qiu, Y.; Zhou, S.; Ding, R.; Quan, J.; Yang, M.; Zheng, E.; et al. The Genetic Architecture of Meat Quality Traits in a Crossbred Commercial Pig Population. Foods 2022, 11, 3143. [Google Scholar] [CrossRef]
  20. Chang, C.C.; Chow, C.C.; Tellier, L.C.; Vattikuti, S.; Purcell, S.M.; Lee, J.J. Second-generation PLINK: Rising to the challenge of larger and richer datasets. Gigascience 2015, 4, 7. [Google Scholar] [CrossRef]
  21. Li, H.; Xu, C.; Meng, F.; Yao, Z.; Fan, Z.; Yang, Y.; Meng, X.; Zhan, Y.; Sun, Y.; Ma, F.; et al. Genome-Wide Association Studies for Flesh Color and Intramuscular Fat in (Duroc × Landrace × Large White) Crossbred Commercial Pigs. Genes 2022, 13, 2131. [Google Scholar] [CrossRef] [PubMed]
  22. Luan, M.; Ruan, D.; Meng, F.; Qiu, Y.; Ye, Y.; Zhou, S.; Yang, J.; Sun, Y.; Ma, F.; Wu, Z.; et al. Genome-wide association study for loin muscle area of commercial crossbred pigs. Anim. Biosci. 2023, 36, 861–868. [Google Scholar] [CrossRef] [PubMed]
  23. Zhou, S.; Ding, R.; Meng, F.; Wang, X.; Zhuang, Z.; Quan, J.; Geng, Q.; Wu, J.; Zheng, E.; Wu, Z.; et al. A meta-analysis of genome-wide association studies for average daily gain and lean meat percentage in two Duroc pig populations. BMC Genom. 2021, 22, 12. [Google Scholar] [CrossRef] [PubMed]
  24. Yang, J.; Lee, S.H.; Goddard, M.E.; Visscher, P.M. GCTA: A tool for genome-wide complex trait analysis. Am. J. Hum. Genet. 2011, 88, 76–82. [Google Scholar] [CrossRef] [Green Version]
  25. Zhou, X.; Stephens, M. Genome-wide efficient mixed-model analysis for association studies. Nat. Genet. 2012, 44, 821–824. [Google Scholar] [CrossRef] [Green Version]
  26. Lipka, A.E.; Tian, F.; Wang, Q.; Peiffer, J.; Li, M.; Bradbury, P.J.; Gore, M.A.; Buckler, E.S.; Zhang, Z. GAPIT: Genome association and prediction integrated tool. Bioinformatics 2012, 28, 2397–2399. [Google Scholar] [CrossRef] [Green Version]
  27. Wang, J.; Zhang, Z. GAPIT Version 3: Boosting Power and Accuracy for Genomic Association and Prediction. Genom. Proteom. Bioinform. 2021, 19, 629–640. [Google Scholar] [CrossRef]
  28. Zhao, H.; Zhu, S.; Guo, T.; Han, M.; Chen, B.; Qiao, G.; Wu, Y.; Yuan, C.; Liu, J.; Lu, Z.; et al. Whole-genome re-sequencing association study on yearling wool traits in Chinese fine-wool sheep. J. Anim. Sci. 2021, 99, skab210. [Google Scholar] [CrossRef]
  29. Glickman, M.E.; Rao, S.R.; Schultz, M.R. False discovery rate control is a recommended alternative to Bonferroni-type adjustments in health studies. J. Clin. Epidemiol. 2014, 67, 850–857. [Google Scholar] [CrossRef]
  30. Wang, Y.; Ding, X.; Tan, Z.; Ning, C.; Xing, K.; Yang, T.; Pan, Y.; Sun, D.; Wang, C. Genome-Wide Association Study of Piglet Uniformity and Farrowing Interval. Front. Genet. 2017, 8, 194. [Google Scholar] [CrossRef] [Green Version]
  31. Barrett, J.C.; Fry, B.; Maller, J.; Daly, M.J. Haploview: Analysis and visualization of LD and haplotype maps. Bioinformatics 2005, 21, 263–265. [Google Scholar] [CrossRef] [PubMed] [Green Version]
  32. Gabriel, S.B.; Schaffner, S.F.; Nguyen, H.; Moore, J.M.; Roy, J.; Blumenstiel, B.; Higgins, J.; DeFelice, M.; Lochner, A.; Faggart, M. The structure of haplotype blocks in the human genome. Science 2002, 296, 2225–2229. [Google Scholar] [CrossRef] [PubMed] [Green Version]
  33. Cunningham, F.; Allen, J.E.; Allen, J.; Alvarez-Jarreta, J.; Amode, M.R.; Armean, I.M.; Austine-Orimoloye, O.; Azov, A.G.; Barnes, I.; Bennett, R.; et al. Ensembl 2022. Nucleic Acids Res. 2022, 50, D988–D995. [Google Scholar] [CrossRef] [PubMed]
  34. Bu, D.; Luo, H.; Huo, P.; Wang, Z.; Zhang, S.; He, Z.; Wu, Y.; Zhao, L.; Liu, J.; Guo, J.; et al. KOBAS-i: Intelligent prioritization and exploratory visualization of biological functions for gene enrichment analysis. Nucleic Acids Res. 2021, 49, W317–W325. [Google Scholar] [CrossRef]
  35. Bergsma, R.; Mathur, P.K.; Kanis, E.; Verstegen, M.W.; Knol, E.F.; Van Arendonk, J.A. Genetic correlations between lactation performance and growing-finishing traits in pigs. J. Anim. Sci. 2013, 91, 3601–3611. [Google Scholar] [CrossRef]
  36. Zhang, Y.; Zhang, J.; Gong, H.; Cui, L.; Zhang, W.; Ma, J.; Chen, C.; Ai, H.; Xiao, S.; Huang, L.; et al. Genetic correlation of fatty acid composition with growth, carcass, fat deposition and meat quality traits based on GWAS data in six pig populations. Meat Sci. 2019, 150, 47–55. [Google Scholar] [CrossRef]
  37. Cuyàs, E.; Corominas-Faja, B.; Joven, J.; Menendez, J.A. Cell cycle regulation by the nutrient-sensing mammalian target of rapamycin (mTOR) pathway. Methods Mol. Biol. 2014, 1170, 113–144. [Google Scholar]
  38. Wang, X.; Zhang, H.; Huang, M.; Tang, J.; Yang, L.; Yu, Z.; Li, D.; Li, G.; Jiang, Y.; Sun, Y.; et al. Whole-genome SNP markers reveal conservation status, signatures of selection, and introgression in Chinese Laiwu pigs. Evol. Appl. 2021, 14, 383–398. [Google Scholar] [CrossRef]
  39. Falker-Gieske, C.; Blaj, I.; Preuß, S.; Bennewitz, J.; Thaller, G.; Tetens, J. GWAS for Meat and Carcass Traits Using Imputed Sequence Level Genotypes in Pooled F2-Designs in Pigs. G3 Genes Genomes Genet. 2019, 9, 2823–2834. [Google Scholar] [CrossRef] [Green Version]
  40. Zhou, L.; Zhao, W.; Fu, Y.; Fang, X.; Ren, S.; Ren, J. Genome-wide detection of genetic loci and candidate genes for teat number and body conformation traits at birth in Chinese Sushan pigs. Anim. Genet. 2019, 50, 753–756. [Google Scholar] [CrossRef]
  41. Li, J.; Peng, S.; Zhong, L.; Zhou, L.; Yan, G.; Xiao, S.; Ma, J.; Huang, L. Identification and validation of a regulatory mutation upstream of the BMP2 gene associated with carcass length in pigs. Genet. Sel. Evol. 2021, 53, 94. [Google Scholar] [CrossRef]
  42. Zhou, N.; Li, Q.; Lin, X.; Hu, N.; Liao, J.Y.; Lin, L.B.; Zhao, C.; Hu, Z.M.; Liang, X.; Xu, W.; et al. BMP2 induces chondrogenic differentiation, osteogenic differentiation and endochondral ossification in stem cells. Cell Tissue Res. 2016, 366, 101–111. [Google Scholar] [CrossRef]
  43. Fan, B.; Onteru, S.K.; Du, Z.Q.; Garrick, D.J.; Stalder, K.J.; Rothschild, M.F. Genome-wide association study identifies Loci for body composition and structural soundness traits in pigs. PLoS ONE 2011, 6, e14726. [Google Scholar] [CrossRef] [PubMed] [Green Version]
  44. Bryk, B.; Hahn, K.; Cohen, S.M.; Teleman, A.A. MAP4K3 regulates body size and metabolism in Drosophila. Dev. Biol. 2010, 344, 150–157. [Google Scholar] [CrossRef] [PubMed] [Green Version]
  45. Vahedi, S.M.; Salek Ardestani, S.; Karimi, K.; Banabazi, M.H. Weighted Single-Step GWAS for Body Mass Index and Scans for Recent Signatures of Selection in Yorkshire Pigs. J. Hered. 2022, 113, 325–335. [Google Scholar] [CrossRef] [PubMed]
  46. Uhlén, P.; Fritz, N.; Smedler, E.; Malmersjö, S.; Kanatani, S. Calcium signaling in neocortical development. Dev. Neurobiol. 2015, 75, 360–368. [Google Scholar] [CrossRef] [PubMed]
  47. Tuduce, I.L.; Schuh, K.; Bundschu, K. Spred2 expression during mouse development. Dev. Dyn. 2010, 239, 3072–3085. [Google Scholar] [CrossRef]
  48. Bundschu, K.; Knobeloch, K.P.; Ullrich, M.; Schinke, T.; Amling, M.; Engelhardt, C.M.; Renné, T.; Walter, U.; Schuh, K. Gene disruption of Spred-2 causes dwarfism. J. Biol. Chem. 2005, 280, 28572–28580. [Google Scholar] [CrossRef] [Green Version]
  49. Budnik, A.; Heesom, K.J.; Stephens, D.J. Characterization of human Sec16B: Indications of specialized, non-redundant functions. Sci. Rep. 2011, 1, 77. [Google Scholar] [CrossRef] [Green Version]
  50. Bradfield, J.P.; Vogelezang, S.; Felix, J.F.; Chesi, A.; Helgeland, Ø.; Horikoshi, M.; Karhunen, V.; Lowry, E.; Cousminer, D.L.; Ahluwalia, T.S.; et al. A trans-ancestral meta-analysis of genome-wide association studies reveals loci associated with childhood obesity. Hum. Mol. Genet. 2019, 28, 3327–3338. [Google Scholar] [CrossRef]
  51. Jiménez-Osorio, A.S.; Aguilar-Lucio, A.O.; Cárdenas-Hernández, H.; Musalem-Younes, C.; Solares-Tlapechco, J.; Costa-Urrutia, P.; Medina-Contreras, O.; Granados, J.; Rodríguez-Arellano, M.E. Polymorphisms in Adipokines in Mexican Children with Obesity. Int. J. Endocrinol. 2019, 2019, 4764751. [Google Scholar] [CrossRef] [Green Version]
  52. Williams, M.J.; Almén, M.S.; Fredriksson, R.; Schiöth, H.B. What model organisms and interactomics can reveal about the genetics of human obesity. Cell Mol. Life Sci. 2012, 69, 3819–3834. [Google Scholar] [CrossRef]
  53. León-Mimila, P.; Villamil-Ramírez, H.; Villalobos-Comparán, M.; Villarreal-Molina, T.; Romero-Hidalgo, S.; López-Contreras, B.; Gutiérrez-Vidal, R.; Vega-Badillo, J.; Jacobo-Albavera, L.; Posadas-Romeros, C.; et al. Contribution of common genetic variants to obesity and obesity-related traits in mexican children and adults. PLoS ONE 2013, 8, e70640. [Google Scholar]
  54. Thorleifsson, G.; Walters, G.B.; Gudbjartsson, D.F.; Steinthorsdottir, V.; Sulem, P.; Helgadottir, A.; Styrkarsdottir, U.; Gretarsdottir, S.; Thorlacius, S.; Jonsdottir, I.; et al. Genome-wide association yields new sequence variants at seven loci that associate with measures of obesity. Nat. Genet. 2009, 41, 18–24. [Google Scholar] [CrossRef] [PubMed]
  55. Zhu, X.; Xie, S.; Xu, T.; Wu, X.; Han, M. Rasal2 deficiency reduces adipogenesis and occurrence of obesity-related disorders. Mol. Metab. 2017, 6, 494–502. [Google Scholar] [CrossRef]
  56. Mouillac, B.; Ibarrondo, J.; Guillon, G. Calcium regulation of hormonal-sensitive phospholipase C. Z. Kardiol. 1991, 80 (Suppl. S7), 79–81. [Google Scholar]
  57. Kwon, Y.J.; Park, D.H.; Choi, J.E.; Lee, D.; Hong, K.W.; Lee, J.W. Identification of the interactions between specific genetic polymorphisms and nutrient intake associated with general and abdominal obesity in middle-aged adults. Clin. Nutr. 2022, 41, 543–551. [Google Scholar] [CrossRef]
  58. Merali, Z.; McIntosh, J.; Anisman, H. Role of bombesin-related peptides in the control of food intake. Neuropeptides 1999, 33, 376–386. [Google Scholar] [CrossRef]
  59. Niu, N.; Liu, Q.; Hou, X.; Liu, X.; Wang, L.; Zhao, F.; Gao, H.; Shi, L.; Wang, L.; Zhang, L. Genome-wide association study revealed ABCD4 on SSC7 and GREB1L and MIB1 on SSC6 as crucial candidate genes for rib number in Beijing Black pigs. Anim. Genet. 2022, 53, 690–695. [Google Scholar] [CrossRef] [PubMed]
  60. Yang, R.; Guo, X.; Zhu, D.; Tan, C.; Bian, C.; Ren, J.; Huang, Z.; Zhao, Y.; Cai, G.; Liu, D.; et al. Accelerated deciphering of the genetic architecture of agricultural economic traits in pigs using a low-coverage whole-genome sequencing strategy. Gigascience 2021, 10, giab048. [Google Scholar] [CrossRef]
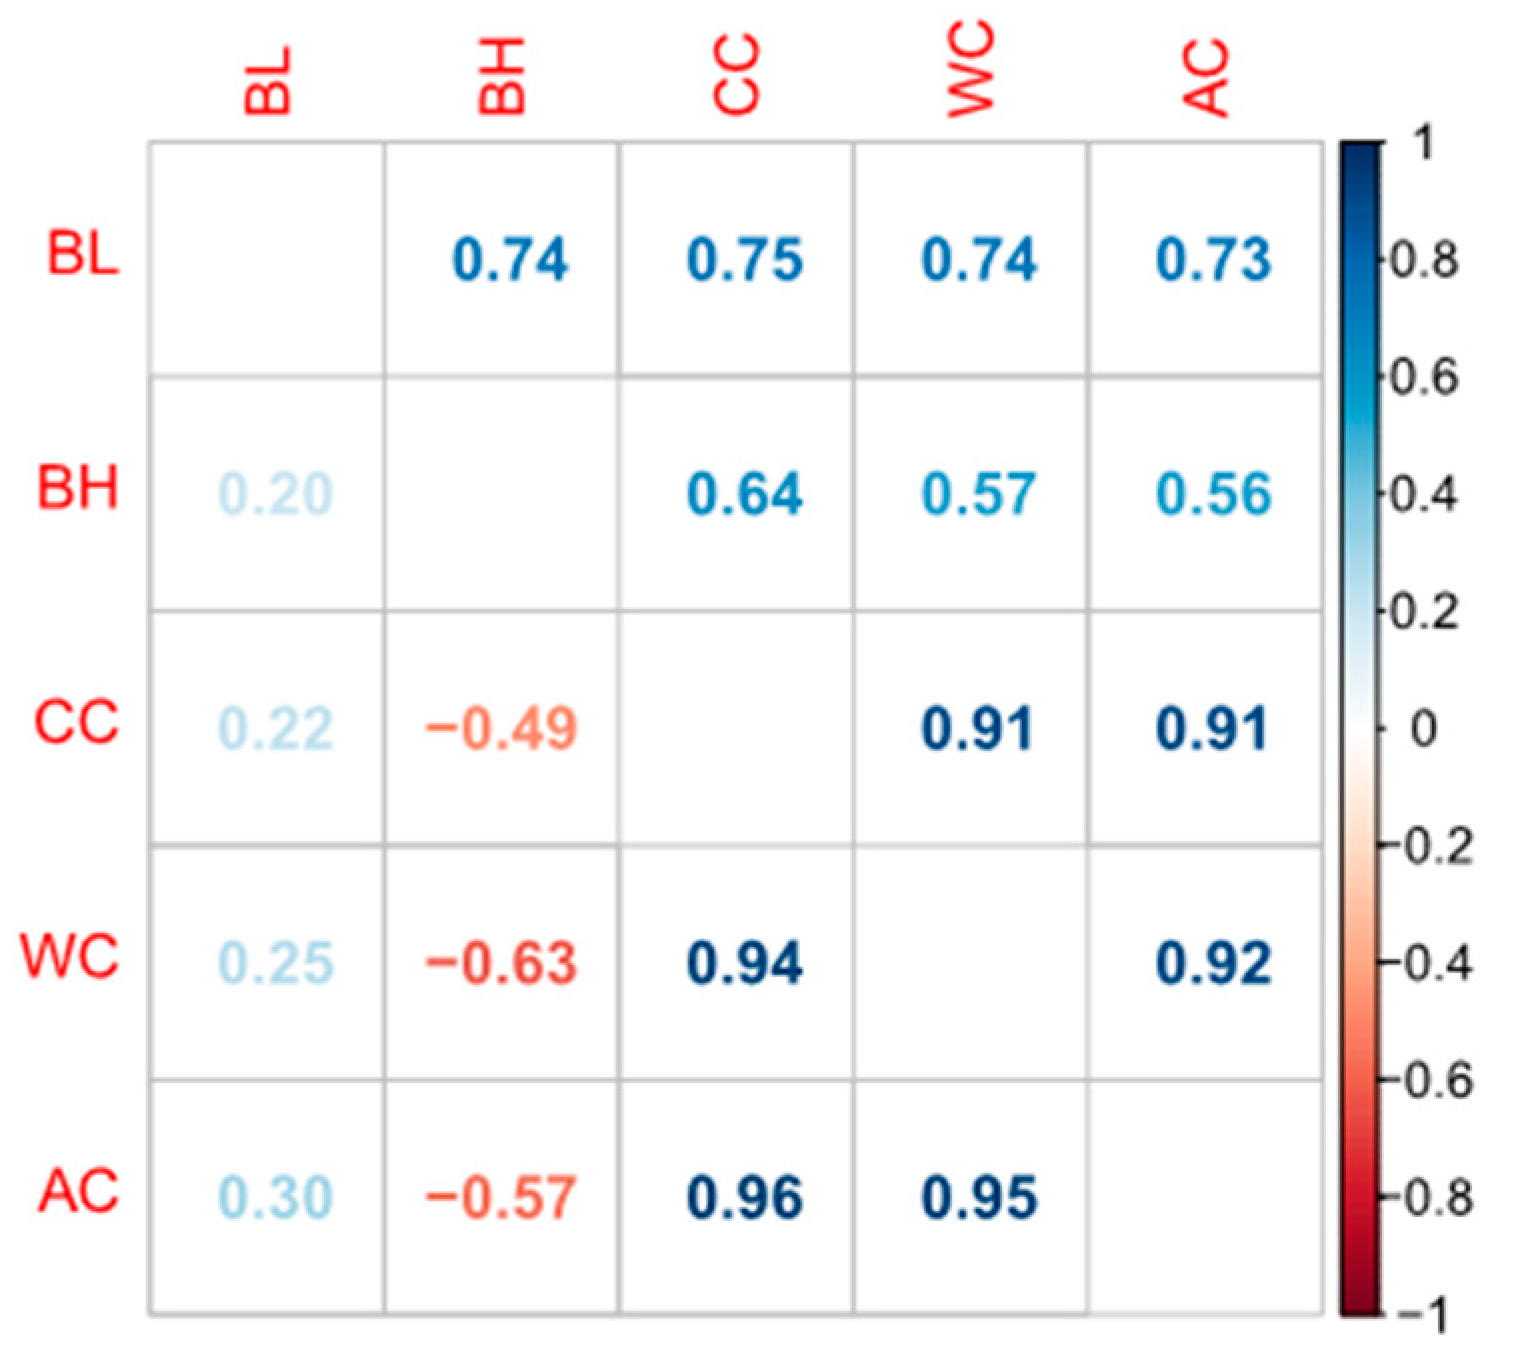
Figure 1. Phenotypic (above diagonal) and genetic (below diagonal) correlations between the body length, body height, chest, abdominal, and waist circumference traits in the DYL pig population.
Animals 13 02414 g001
Figure 2. Manhattan plots illustrating the GWAS results for body length (BL), body height (BH), chest circumference (CC), abdominal circumference (AC), and waist circumference (WC) in DLY pigs, using both the MLM and FarmCPU methods. (A,B) represent the GWAS results conducted by MLM-based GWAS (threshold: p = 1.20 × 10⁻⁴) and FarmCPU-based GWAS (threshold: p = 7.71 × 10⁻⁵) for BL, respectively. (C,D) represent the GWAS results conducted by MLM-based GWAS (threshold: p = 9.4427 × 10⁻⁵) and FarmCPU-based GWAS (threshold: p = 1.13 × 10⁻⁴) for BH, respectively. (E,F) represent the GWAS results conducted by MLM-based GWAS (threshold: p = 8.44 × 10⁻⁵) and FarmCPU-based GWAS (threshold: p = 1.14 × 10⁻⁴) for CC, respectively. (G,H) represent the GWAS results conducted by MLM-based GWAS (threshold: p = 9.12 × 10⁻⁵) and FarmCPU-based GWAS (threshold: p = 7.08 × 10⁻⁵) for AC, respectively. (I,J) represent the GWAS results conducted by MLM-based GWAS (threshold: p = 9.55 × 10⁻⁵) and FarmCPU-based GWAS (threshold: p = 5.18 × 10⁻⁵) for WC, respectively. The x-axis represents the chromosomes, and the y-axis represents the log 10   p value .
Animals 13 02414 g002
Figure 3. (AD) are the bubble charts of the Gene Ontology (GO) terms and Kyoto Encyclopedia of Genes and Genomes (KEGG) pathways of the candidate genes associated with BL, CC, AC, and WC traits, respectively.
Animals 13 02414 g003
Figure 4. (A) Regional plots were constructed for the WU_10.2_7_103232787 SNP located at 88.00–106.00 Mb on SSC7 in DLY pigs. The plot displays the association signals and linkage disequilibrium (LD) between the SNP and waist circumference. (B) The plot indicated an 84 kb linkage disequilibrium block in the significant region on SSC7. (C) A boxplot was used to demonstrate the differences in body length among the three genotypes of the (MARC0052457) identified in the GWAS analysis. (D) A boxplot was used to demonstrate the differences in waist circumference among the three genotypes of the top SNP (WU_10.2_7_103232787).
Animals 13 02414 g004
Table 1. Summary statistics of body conformation traits in DLY pigs.
Traits 1Mean ± SD 2Min 3Max 4CV 5 %h² ± SE 6
BL123.68 ± 7.151011455.780.35 ± 0.04
BH64.61 ± 3.6451785.640.31 ± 0.05
CC112.82 ± 24.24881407.260.34 ± 0.04
AC121.32 ± 8.58941507.070.26 ± 0.04
WC110.43 ± 8.78841407.950.21 ± 0.04
1 Five body conformation traits. 2 Mean ± standard deviation. 3 Minimum (Min). 4 Maximum (Max). 5 Coefficient of variation. 6 Heritability ± standard error.
Table 2. Description of SNPs significantly associated with BL, BH, CC, AC, and WC in DLY pigs.
TraitSSC 1SNPLocationp-Valuep-ValueR² (%) 3Distance (bp)Nearest Gene
(bp) 2(MLM)(FarmCPU)
BL17MARC003038012,149,1458.19 × 10−55.77 × 10−71.9161,261INTS10
9ALGA010557854,113,4999.50 × 10−51.54 × 10−81.4250,019KIRREL3
17WU_10.2_17_1747900915,827,4541.05 × 10−4 1.1866,239BMP2
11MARC005245764,090,4481.06 × 10−45.75 × 10−81.36263,981SOX21
8H3GA002452222,446,465 1.51 × 10−70.57NANA
2ALGA0118729131,130,527 1.31 × 10−61.42114,097SLC12A2
12WU_10.2_12_2389689824,026,238 1.77 × 10−61.1433,694OSBPL7
13WU_10.2_13_2249814120,661,904 2.71 × 10−61.51272,967ARPP21
17DRGA001666924,960,133 7.09 × 10−61.73276,584MACROD2
1H3GA000235095,927,556 1.53 × 10−51.1523,858RNF165
9H3GA002670716,164,242 1.71 × 10−50.72NANA
12WU_10.2_12_40715304,324,076 3.37 × 10−50.03WithinSEPTIN9
16WU_10.2_16_6781795262,516,694 3.47 × 10−51.1653,119ATP10B
10MARC00415695,298,516 3.78 × 10−50.92455,315KCTD3
11WU_10.2_11_55703505,881,250 3.88 × 10−51.4172,493POMP
15WU_10.2_15_136877153123,439,329 5.39 × 10−51.1963,812EPHA4
BH14ALGA0081919125,132,8252.08 × 10−5 1.1325,823FAM160B1
8WU_10.2_8_1896357618,731,6752.36 × 10−56.32 × 10−51.8864,961SOD3
3DIAS0000802101,049,8611.08 × 10−4 1.93WithinMAP4K3
CC9H3GA0028170119,852,7131.27 × 10−59.09 × 10−71.239783SEC16B
3H3GA0010240102,073,6092.03 × 10−5 2.1543,940ATL2
13ALGA011930229,363,1453.50 × 10−57.21 × 10−61.7520,158CCR5
13ASGA00557806,014,8223.90 × 10−51.95 × 10−60.8189,715KCNH8
3MARC000448376,624,9514.32 × 10−5 2.06WithinSPRED2
3ASGA001518576,651,3634.32 × 10−5 2.061713SPRED2
3WU_10.2_3_108307418102,136,8056.36 × 10−55.43 × 10−62.0758,936CYP1B1
10WU_10.2_10_6700593961,139,023 1.33 × 10−60.31NANA
5INRA001928240,871,511 2.18 × 10−60.69772SYT10
18ALGA009877550,846,238 3.65 × 10−61.8115,228CAMK2B
1WU_10.2_1_179575045161,987,727 3.74 × 10−60.72555ZNF532
1ASGA000141816,903,857 4.07 × 10−50.263,327UST
2WU_10.2_2_2112401919,419,332 4.28 × 10−51.3425,106API5
AC1ALGA0009765258,153,5342.98 × 10−5 1.26412,557ASTN2
1WU_10.2_1_289532755257,687,1548.53 × 10−55.04 × 10−91.73WithinASTN2
2MARC0066799115,758,230 1.59 × 10−61.7176,874WDR36
12MARC011553737,253,607 6.72 × 10−61.34430,372C17orf64
13ALGA00676025,297,429 7.42 × 10−61.7716,929SATB1
13MARC002152499,647,029 1.02 × 10−50.88278,346C3orf80
6MARC0000035120,909,790 1.63 × 10−50.78WithinKIAA1328
9WU_10.2_9_131985977120,299,004 2.42 × 10−50.33WithinRASAL2
7DRGA000731620,219,344 2.58 × 10−50.41WithinCARMIL1
7MARC003368664,847,978 4.51 × 10−50.1319,104SRP54
3ASGA001485959,618,741 4.74 × 10−50.67WithinKCMF1
11ALGA012454925,293,190 6.91 × 10−51.59WithinVWA8
WC7ALGA003914018,645,2442.25 × 10−5 1.58362,537NRSN1
7WU_10.2_7_10323278797,584,2875.15 × 10−5 1.84WithinABCD4
7Affx-11525815197,595,5736.36 × 10−54.58 × 10−71.639894ABCD4
7WU_10.2_7_10346070697,617,9077.98 × 10−5 1.6232,228ABCD4
7Affx-11489258597,575,0688.58 × 10−5 1.61WithinABCD4
7Affx-11468713697,568,2848.99 × 10−5 1.62WithinABCD4
14ASGA006281638,090,626 1.79 × 10−61.63WithinRBM19
11ASGA00492513,324,036 9.00 × 10−61.12WithinATP8A2
5WU_10.2_5_6514906962,312,551 1.03 × 10−50.3254,860KLRB1
7WU_10.2_7_10534881399,303,783 1.22 × 10−51.7121,786GPATCH2L
16ASGA007251519,669,219 1.42 × 10−50.82WithinADAMTS12
15ALGA0088031131,517,298 1.47 × 10−50.6924,648CAB39
1DIAS0002061161,757,996 2.05 × 10−52.236,214GRP
6WU_10.2_6_2122080122,691,873 3.09 × 10−51.02231,267CDH8
7WU_10.2_7_118076533111,437,802 3.68 × 10−52.48WithinFOXN3
12ALGA00643322,354,756 4.46 × 10−51.13WithinCCDC40
Genes nearest the significant SNPs are italicized. 1 Sus scrofa chromosome. 2 The positions of the associated SNPs on the Sus scrofa Build 11.1 assembly. 3 Proportion of total phenotypic variation explained by each SNP.
Disclaimer/Publisher’s Note: The statements, opinions and data contained in all publications are solely those of the individual author(s) and contributor(s) and not of MDPI and/or the editor(s). MDPI and/or the editor(s) disclaim responsibility for any injury to people or property resulting from any ideas, methods, instructions or products referred to in the content.