Article

Investigating the Mechanism of Low-Salinity Environmental Adaptation in Sepia esculenta Larvae through Transcriptome Profiling

1
School of Agriculture, Ludong University, Yantai 264025, China
2
College of Life Sciences, Yantai University, Yantai 264005, China
*
Authors to whom correspondence should be addressed.
The authors contributed equally to this work.
Animals 2023, 13(19), 3139; https://doi.org/10.3390/ani13193139
Submission received: 17 July 2023 / Revised: 4 October 2023 / Accepted: 5 October 2023 / Published: 8 October 2023
(This article belongs to the Section Animal Genetics and Genomics)

Abstract

:

Simple Summary

The cuttlefish, Sepia esculenta, is both a valuable economic resource and a creature of scientific interest. Our study investigated how changes in ocean salinity, a factor subject to environmental shifts, affect young, more responsive cuttlefish. We examined the gene expression of cuttlefish when exposed to lower levels of salinity. Using transcriptomic and enrichment analysis, we identified over a thousand genes that were differentially expressed under these circumstances. The images created from the results of these analyses can be used to visualize the content of the analyses. Interestingly, we discovered that low salinity could trigger harmful cell proliferation in juvenile cuttlefish, thus disrupting their normal functions. This information is valuable as it can inform potential measures to reduce the mortality rate of hatchling cuttlefish in artificially controlled conditions.

Abstract

Sepia esculenta is an economically important mollusk distributed in the coastal waters of China. Juveniles are more susceptible to stimulation by the external environment than mature individuals. The ocean salinity fluctuates due to environmental changes. However, there is a lack of research on the salinity adaptations of S. esculenta. Therefore, in this study, we investigated the differential expression of genes in S. esculenta larvae after stimulation by low salinity. RNA samples were sequenced and 1039 differentially expressed genes (DEGs) were identified. Then, enrichment analysis was performed using the Gene Ontology (GO) and Kyoto Encyclopedia of Genes and Genomes (KEGG) databases. Finally, a protein–protein interaction network (PPI) was constructed, and the functions of key genes in S. esculenta larvae after low-salinity stimulation were explored. We suggest that low salinity leads to an excess proliferation of cells in S. esculenta larvae that, in turn, affects normal physiological activities. The results of this study can aid in the artificial incubation of S. esculenta and reduce the mortality of larvae.

1. Introduction

For aquaculture, a stable and suitable marine environment can facilitate the development of the aquaculture industry [1,2]. Global warming has led to accelerated glacier melting in recent years [3,4]. More melting of glaciers will dilute the salt in the ocean and reduce its salinity. The decrease in ocean salinity will have a great impact on the life activities of marine mollusks [5]. In a previous study, Knowles et al. explored hemolymph chemistry and histopathological changes in Pacific oysters (Crassostrea gigas) under low salt stress [6]. They found significant vacuolization in the cytoplasm of the summer Pacific oyster when stimulated by low salt concentrations, leaching of blood cells from the lining of the digestive tract, and significant tissue lesions. Ren et al. sequenced and analyzed Sepia pharaonis larvae and found that low salinity had significant negative impacts on life processes such as fatty acid metabolism, ion transport, and osmotic pressure regulation [7].
High-throughput transcriptome sequencing is a technology that has developed relatively rapidly. The analysis of organism activities has become more accurate and efficient using this technology [8,9,10]. Previous studies have used this technique to examine biological processes in mollusks. For example, using transcriptome analysis, Boamah et al. found that heat shock protein 90 (HSP90) was significantly up-regulated and tumor necrosis factor (TNF) was significantly down-regulated in Haliotis discus hannai in response to low salt stimulation and that immune responses were activated [11]. Transcriptome profiling of Amphioctopus fangsiao at different time points by Bao et al. revealed the presence of an immune response mechanism for the protection of eggs [12]. Therefore, transcriptome sequencing technology was utilized in the present study to probe the biological processes that function in a mollusk following low-salinity stimulation.
Sepia esculenta is a species of cuttlefish with high nutritional value and commercial significance. The species is distributed in the waters of Eastern China, Korea, and Japan [13]. S. esculenta can be affected by fluctuations in salinity during its growth and development. The larvae have a lower ability to withstand environmental stresses compared with the adults [14]. It also exhibits higher mortality rates when subjected to extreme environmental stresses, which is extremely detrimental to the aquaculture industry. Therefore, larvae after the completion of incubation were used as experimental samples in this study to better understand the effects of low salinity on mollusks.
In this study, sequencing was used to investigate the biological processes of S. esculenta stimulated by low salinity. S. esculenta exposed to low salinity were sampled and sequenced at 0, 4, and 24 h, and the data were mapped to the reference genome. Differentially expressed genes (DEGs) were screened and analyzed using DESeq2. The DEGs were then used for GO and KEGG enrichment analyses, and protein–protein interaction networks (PPI) were constructed. The results of PPI and KEGG enrichment analyses were used in a combined analysis to explore the expression of DEGs in S. esculenta larvae after low-salinity stimulation. Finally, quantitative RT-PCR was used to validate the quality of the sequencing results. The results of this study reveal the effects of low-salinity stimulation on the growth and development process of S. esculenta larvae, which can be helpful for further investigating the resistance mechanism of larvae in extremely unfavorable environments. Meanwhile, it can also support researchers who need to conduct larval breeding in response to changes in the marine environment.

2. Materials and Methods

2.1. Experimental Samples and Procedures

Adult cuttlefish from the sea in the Qingdao area were used in this study. The adults obtained were placed in a saltwater tank for short-term culture to ensure normal growth in the saltwater tank environment. The water temperature of the temporary breeding pool was 21.5 ± 1 °C. Attachment nets were placed in the pools, and the eggs were collected daily and placed in pots with small holes. The eggs were oval in shape, 6.5 ± 0.5 mm in diameter, and translucent. Fertilized eggs were incubated at 21.5 ± 1 °C and the membranes were successively removed and hatched out after 26 d. The basin with the eggs was placed in the pool to ensure the flow of seawater and provide sufficient oxygen. We ensured that the chemical properties of the water such as pH, temperature, and dissolved oxygen were the same as in the mother saltwater tank (Table S1).
The experiment was conducted using two buckets, each with a capacity of 120 L and containing 100 L of water. Larval samples were immediately transferred to prepared experimental buckets half an hour after the completion of incubation. The salinity before transfer was 30 ppt. In previous studies, mollusks in a 20 ppt salinity environment produced significant immune defenses [15]. Therefore, the salinity of the treatment group was set to 20 ppt, and the salinity of the control group remained unchanged at 30 ppt. In the experiment, 100 S. esculenta larvae were placed in each bucket and sampled at 4 and 24 h, with the 0 h sample being obtained separately. Nine larvae were randomly selected at each time point and every third larva was mixed to form three replicates. All samples obtained were placed in tubes and frozen in liquid nitrogen for storage.

2.2. Detection of Sample RNA

The RNA extraction and RNA-Seq were performed by Novogene. RNA was extracted from whole individual hatchlings using the TRIzol method and subjected to stringent quality control utilizing an Agilent 2100 bioanalyzer [16]. A NEBNext® Ultra™ Directional RNA Library Prep Kit was used for library construction. The nine larvae were randomly selected from the 4 h and 24 h low-salinity and control groups and three larvae were randomly pooled to form three replicates. An Illumina NovaSeq 6000 was used for sequencing.

2.3. Analysis of DEGs

The quality of the sequencing results was assessed using FastQC software (version 0.12.0) [17]. We filtered the raw reads to remove reads with adapter, to remove reads with a proportion of N greater than 10%, and to remove low-quality reads (those with a quality value Qphred ≤ 20 where the number of bases accounted for more than 50% of the whole reads). We calculated the average score for Q20 and Q30. The quality control clean reads were mapped to the reference genome by HISAT2 software (version 2.2.1) [18]. The reference genome of S. esculenta is currently presented as unpublished. DEGs were screened out using the DESeq2 package for R as a negative binomial distribution model. First of all, data were imported for building the ddsmodel, and then, the DESeq function was used to estimate the dispersion of the samples. Afterwards, the difference in gene expressions was analyzed by this package. DEGs with |Log2 Fold Change| ≥ 1 and p-value ≤ 0.01 were screened [19].
This study utilizes volcano plots, heat maps, and Venn diagrams to demonstrate the expression of DEGs. The distribution of gene expression is demonstrated by a volcano plot. The significance of the difference between the two groups of samples was shown by assigning different colors to the points with significant differences using the multiplicity of differences between the groups, with the logarithm of the base of 10 as the horizontal coordinate and the significance of the differences with the p-value of the test of significance taking the logarithm of the base of 10 as the vertical coordinate. The expression patterns of DEGs in different treatment groups are demonstrated by clustered heat maps. The FPKM data of DEGs were normalized using Z-score and selected for horizontal clustering. The FPKM values are the average expression of three biological replicates for each case. The clustering of the samples was achieved by calculating the Euclidean distances between the samples using pheatmap package of R [20]. The intersection of the number of genes expressed at different time points is illustrated by a Venn plot.
The DAVID v6.8 online site was used for functional enrichment analyses using the GO and KEGG databases [21]. The default parameters of the site were used for functional enrichment analysis of genes. The gene codes we uploaded were used in the background gene set for DAVID analysis, combined with previous studies, to identify signaling pathways that were significantly enriched to assume key responsibilities after low-salinity stress. The enrichment of DEGs into the GO term and KEGG signaling pathways enabled clarification of the mode of action of genes under low salt stress.
The STRING v11.5 online site was used for the construction of a PPI network [22]. The gene sequences of all DEGs were uploaded to STRING for homologous sequence comparison, and the highest scoring sequences were used for STRING analysis. The minimum interaction score was set to 0.150 and the other parameters were left at default. The functions of key DEGs in S. esculenta after low salt stress were analyzed according to the number of PPIs involved and the number of KEGG signaling pathways.

2.4. qRT-PCR Validation

The 16 genes identified as playing key roles following low-salinity stress in larvae were used to validate the accuracy of the sequencing results. The relative quantities of the low-salinity group (SAL20_4h) and the control group (C_4h) were compared to derive the value of fold change for 4 h. The same comparison method yielded the value of fold change for 24 h. These similar expression trends of the gene in RNA-Seq and qRT-PCR prove that the sequencing results are accurate. First, Primer Premier 5.0 [23] was used to design the gene-specific primers of key genes. To ensure the accuracy of the experiment, we compared the expression levels of three reference genes including β-actin, 18S, and GAPDH in S. esculenta larvae before experiment, and β-actin was selected because of its stable expression. Then, quantitative RT-PCR was performed in a 20 µL solution containing 10 ng of template cDNA and SYBR Premix Ex Taq II (TaKaRa) by using a LightCycler 480 at 95 °C for 5 min pre-incubation, followed by 45 cycles of 95 °C for 15 s and 60 °C for 45 s. Finally, the melting curve was analyzed to detect single amplification. Fluorescent signal accumulation was recorded at the 60 °C 45 s phase during each cycle by using LightCycler 480. The 2−ΔΔCt comparative Ct method was used to calculate the relative quantities of the target genes expressed as fold variation over β-actin (Table S2) [24].

3. Results

3.1. Sequencing Results

In this study, transcriptome technology was used to analyze and probe the low-salinity response in S. esculenta. An analysis of the results obtained from sequencing showed that the Q20 scores were all above 95%, and the average score for Q30 was 91.94% (Table S2). This indicated that the sequencing results were satisfactory.

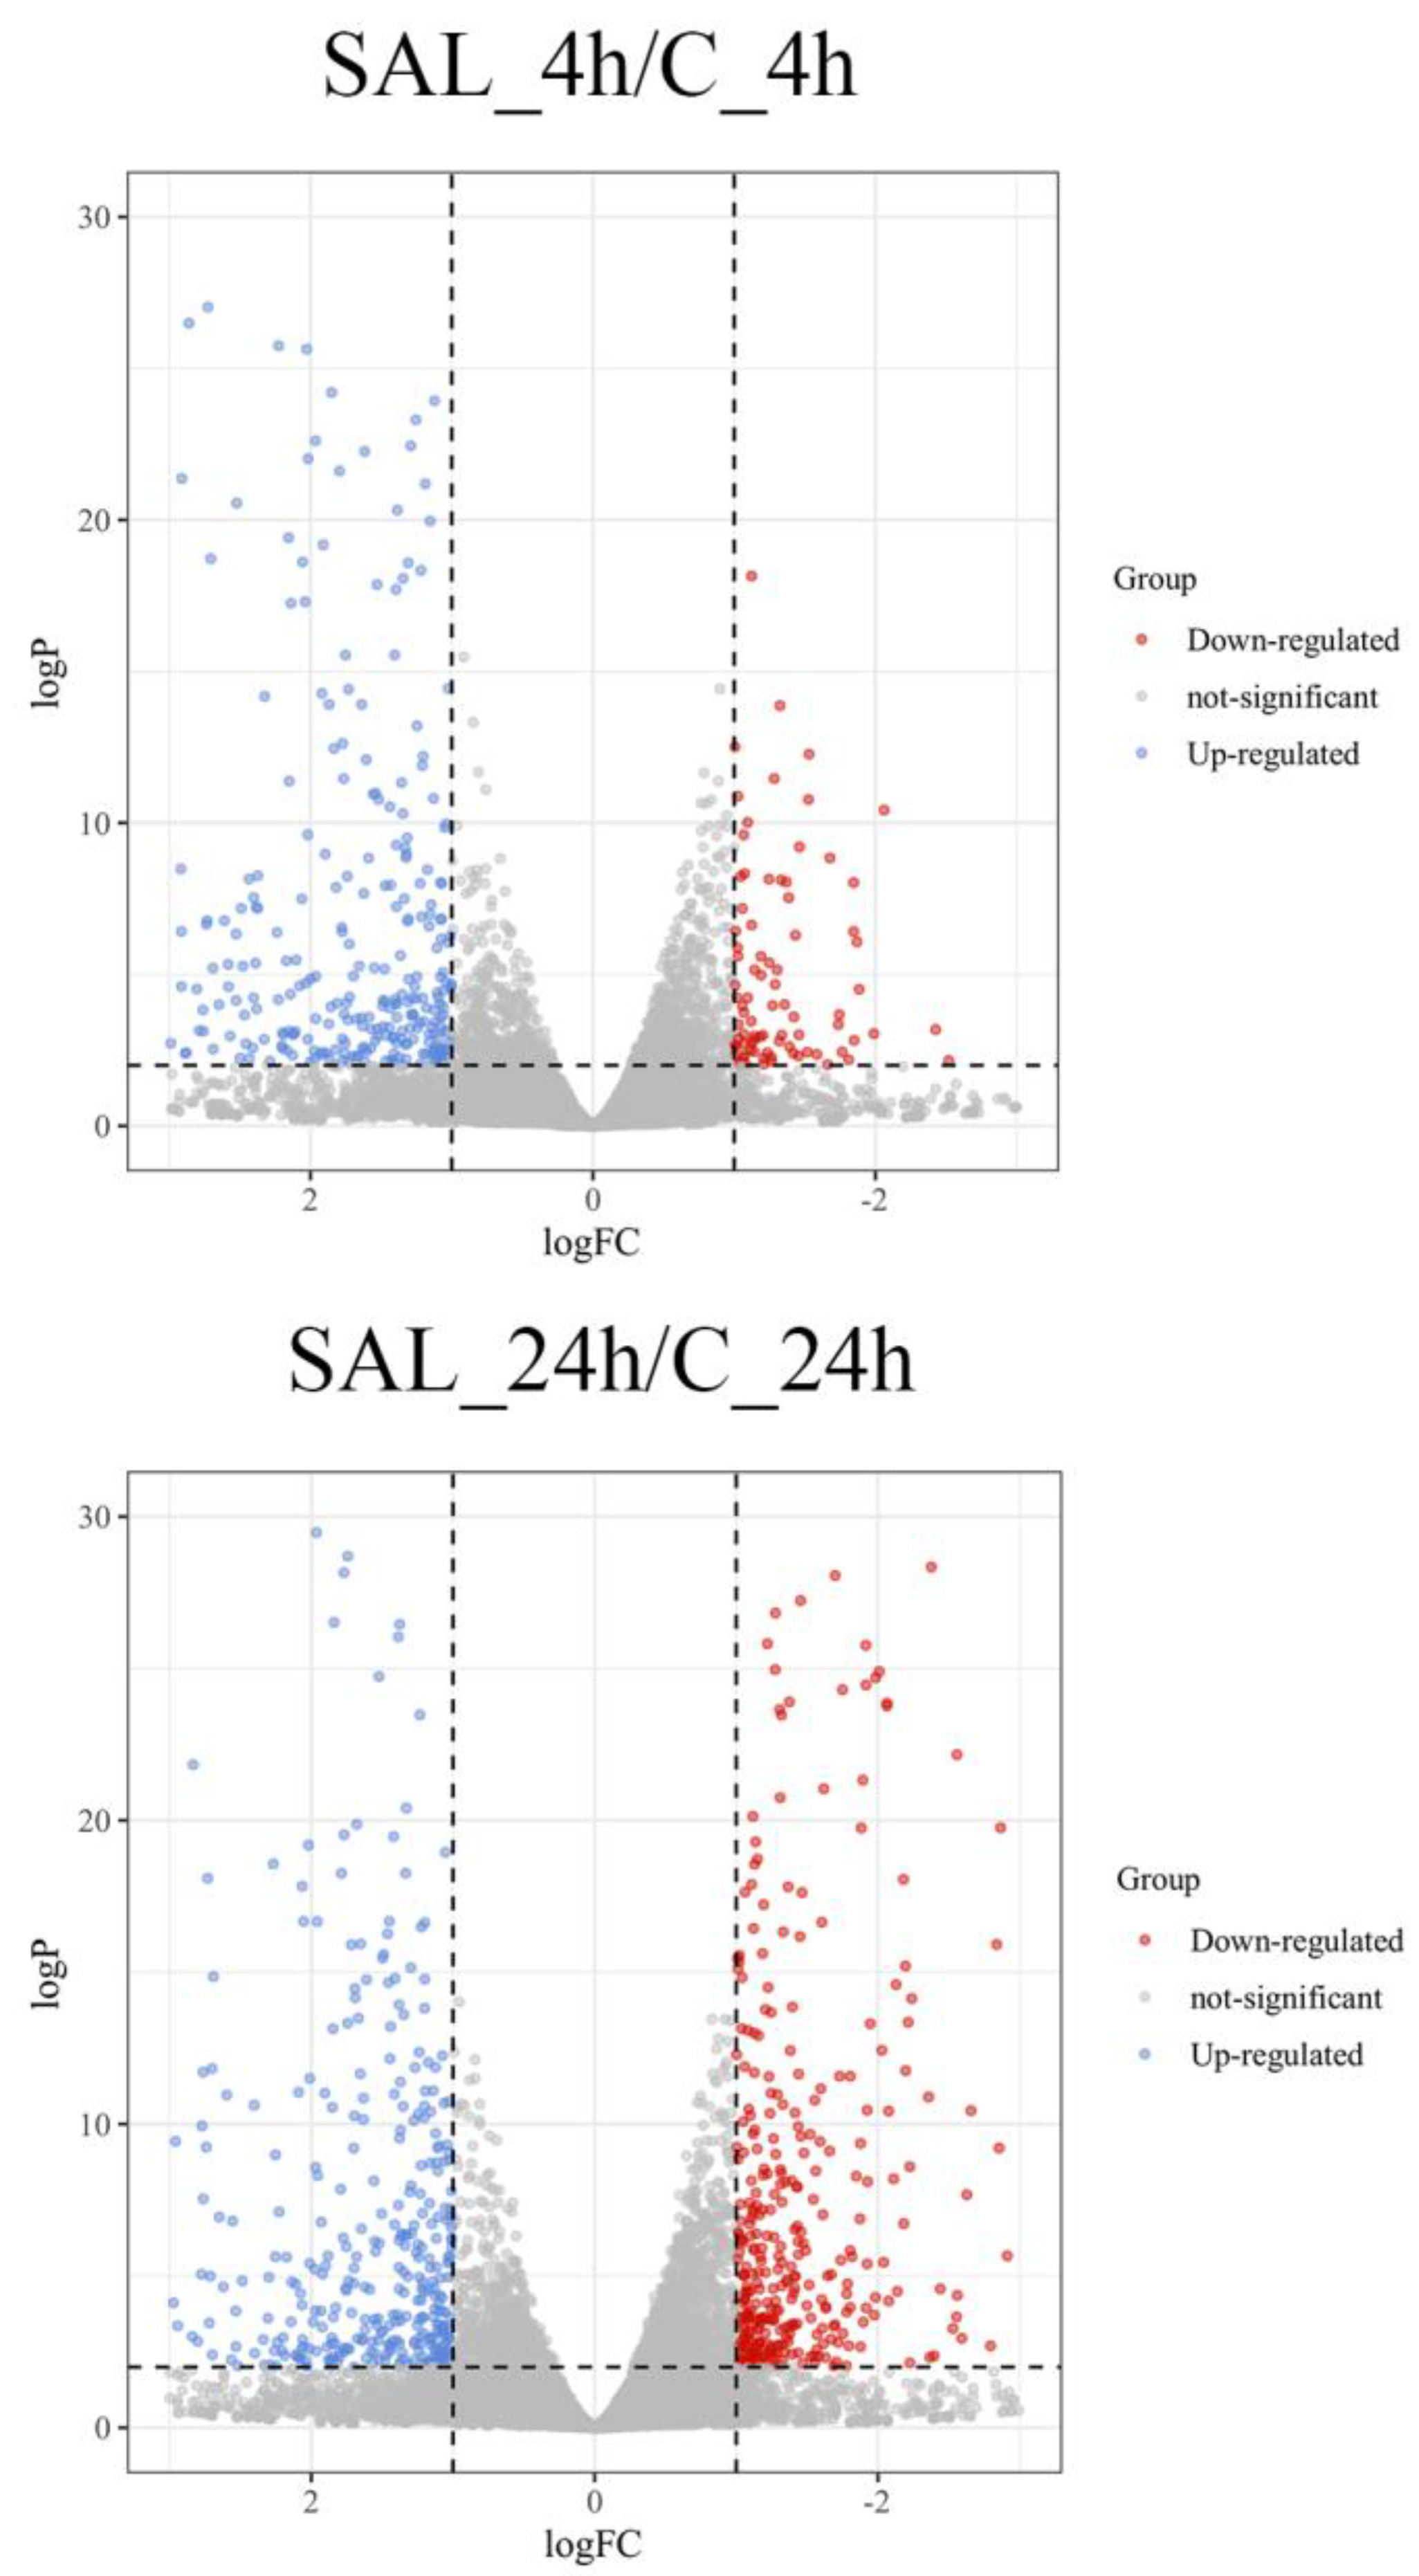
3.2. Analysis of DEGs

In this study, our DEG results are presented using volcano plots, clustered heat maps, and Venn plots. The volcano map results showed that 433 DEGs were identified in the 4 h exposure samples. Among all differentially expressed genes, 342 were up-regulated, and 91 genes were down-regulated. Among the 24 h exposure time samples, 764 genes were significantly differentially expressed; 422 DEGs were up-regulated, and 342 DEGs were down-regulated (Figure 1).
The clustering heat map reflected the overall expression of the sample. The results showed that the expression profiles of the three control groups were essentially the same (C_0h, C_4h, and C_24h). The expression patterns of the two experimental groups (SAL20_4h and SAL20_24h) showed significant differences compared with the control group with the same exposure time (Figure 2).
The Venn plot showed that 764 genes were significantly differentially expressed at 24 h of exposure time, and 433 genes were significantly differentially expressed at 4 h of exposure time. There were 158 DEGs that showed significant differential expression at both 4 and 24 h (Figure 3).

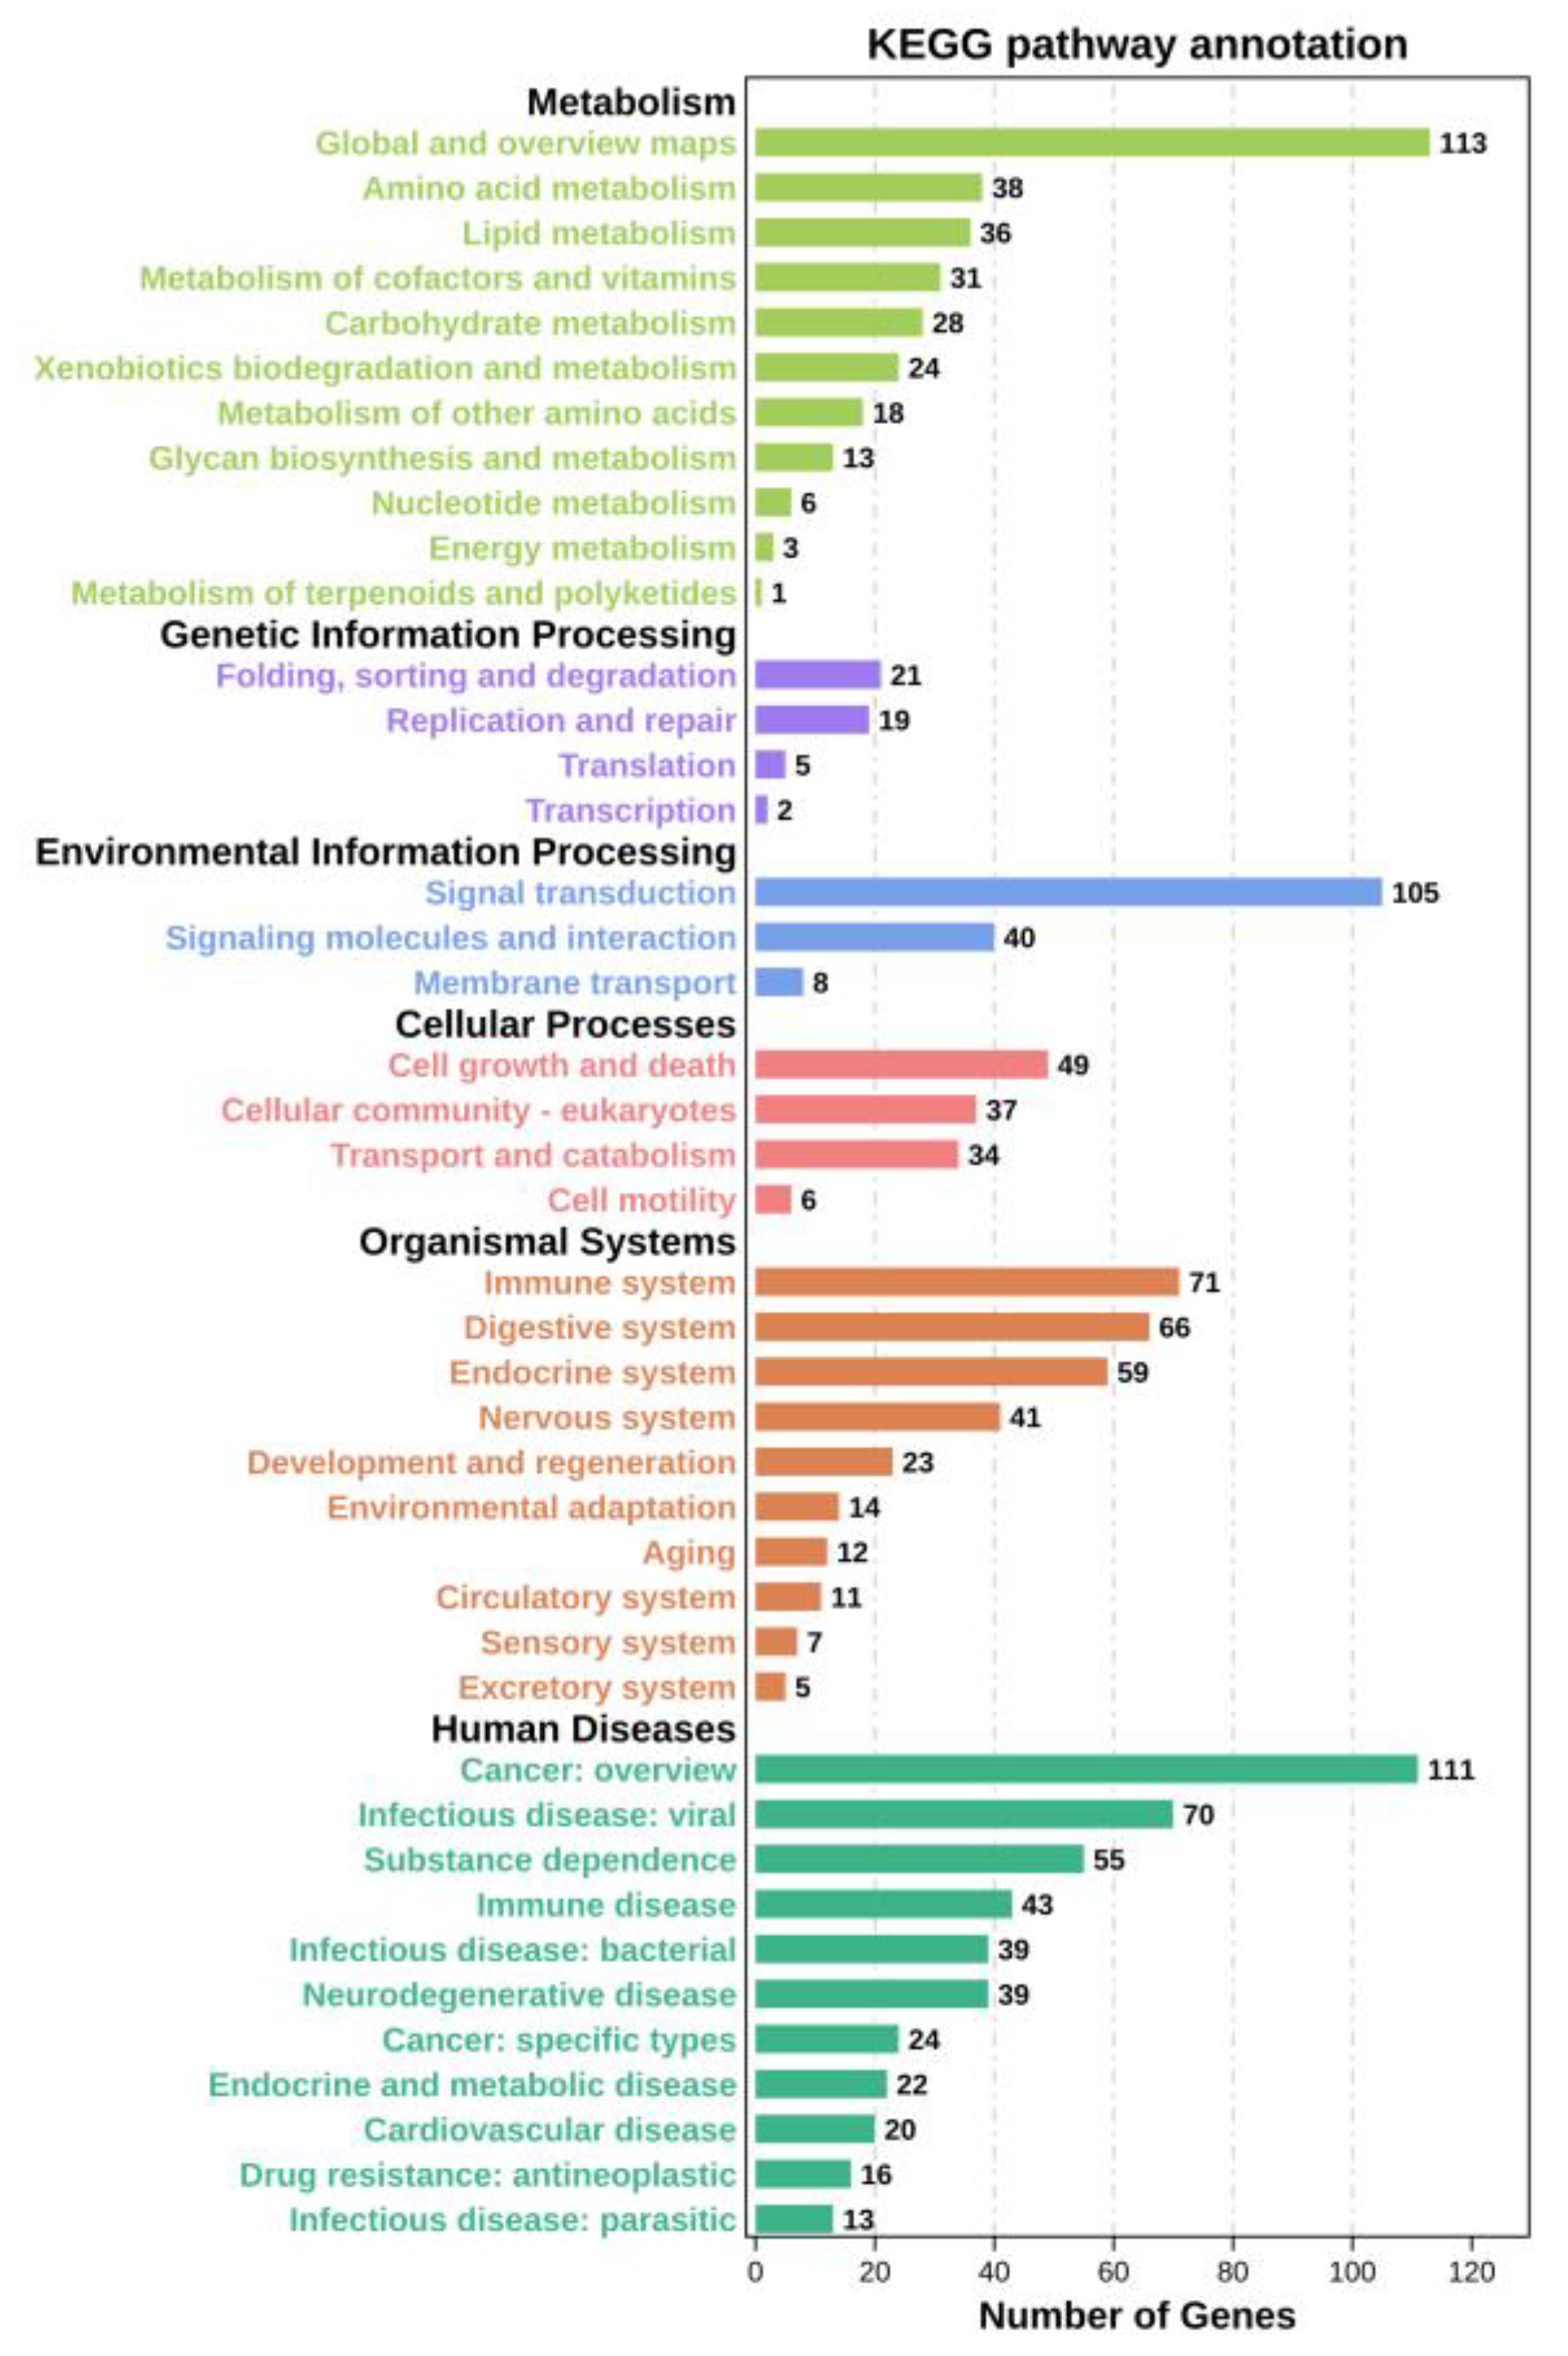
3.3. Analysis Using GO and KEGG

DEGs were enriched in three categories in the GO: biological processes, cellular components, and molecular functions. The top 20 terms for biological processes and cellular components and the top 10 terms for molecular functions were selected (p ≤ 0.01) (Figure 4). In the first 20 terms of biological processes, processes such as “transmembrane transport” and “ion transport” were related to the transfer and transport of substances.
The analysis of the KEGG results revealed that most of the signaling pathways were related to intercellular substance transport (Figure 5). Sixteen of the signaling pathways that were significantly enriched after low-salinity exposure were screened (Table 1).

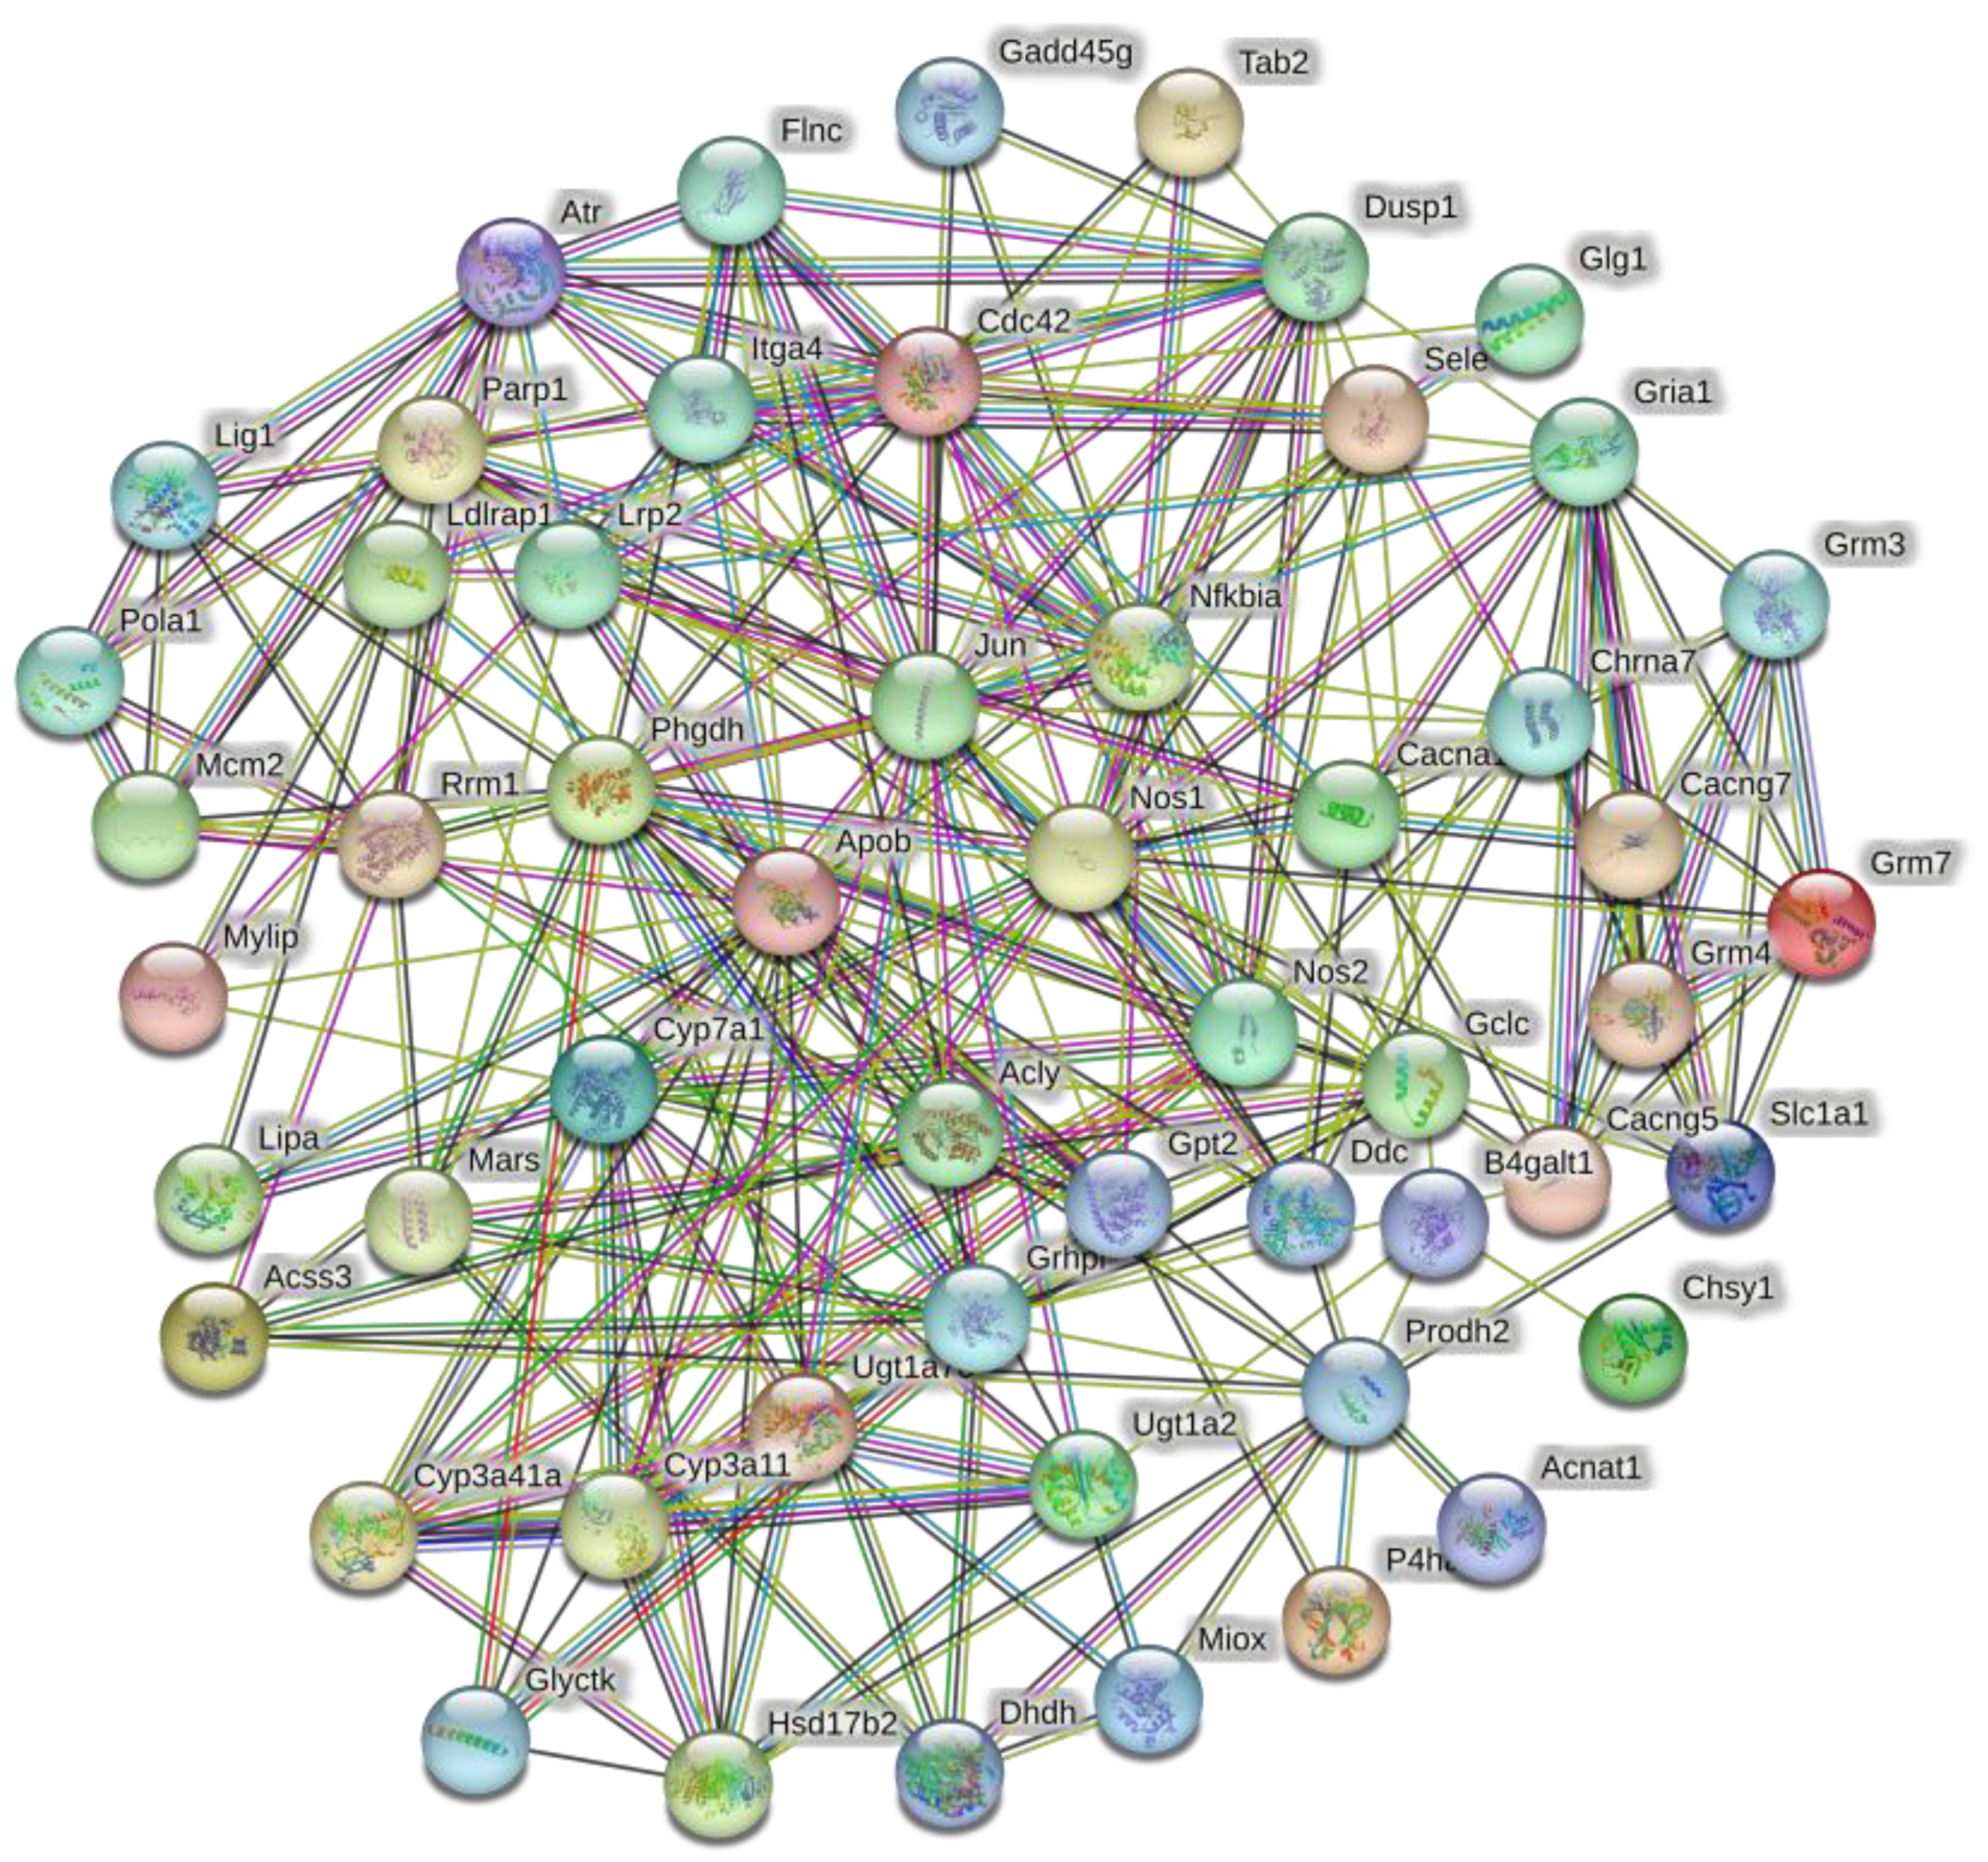
3.4. Analysis of PPI Network Results

Sixty-one DEGs from 19 signaling pathways that were enriched after low salt exposure were used to construct the PPI network (Figure 6). The relevant parameters for the PPI network were calculated (Table 2). The data related to PPI parameters indicated robust interrelationships between DEGs.
The number of genes involved in interactions with PPIs was used as the primary reference factor, and the number enriched to the KEGG signaling pathway was used as a secondary reference factor to identify key genes that function after low-salinity stress. Sixteen key DEGs were finally identified. Table 3 lists the 16 identified key DEGs and the corresponding numbers from the PPI and KEGG analyses.

3.5. Analysis by qRT-PCR

The expression of the identified key genes was verified by qRT-PCR. Analysis of the qRT-PCR results indicated that the expression trends of the genes sequenced at different time points were consistent with those of the quantitative validation, suggesting that the sequencing results were reliable (Figure 7).

4. Discussion

4.1. Enrichment Analysis of DEGs

Too-low salinity can be fatal to mollusks [5]. In the present study, 1039 significantly differentially expressed DEGs were screened in S. esculenta stimulated by low-salinity seawater. The results illustrated in the volcano and Venn diagrams demonstrate a significant increase in differentially expressed genes with increasing exposure time, suggesting that the low salinity had severe effects on S. esculenta larvae. The clustering heat map results indicated that the 4 h exposure group (SAL20_4h) and the 24 h exposure group (SAL20_24h) showed significant differential expression patterns compared with the control group (C_4h, C_24h) with the same exposure time.
In this study, 1039 DEGs showing significant differential expression were used for GO and KEGG functional enrichment analyses. The GO enrichment analysis revealed that most of the 20 terms identified in the biological processes are related to the transportation of substances. The significant enrichment of “transmembrane transport” in the classification of biological processes can significantly enhance the exchange of substances between cells and tissues, effectively reducing the stimulation of organisms in response to environmental changes and maintaining cellular homeostasis [25,26,27,28]. “Ion transport” is a very common biological process in the growth and metabolism of mollusks. Through this process, mollusks can regulate the osmotic pressure of their body, and abnormal osmotic pressure can lead to the death of the organism [29,30,31]. This process was significantly enriched in the GO analysis, suggesting that low salinity can lead to abnormal osmotic pressure in S. esculenta larvae [15]. Of the 16 signaling pathways significantly enriched in the KEGG functional analysis, many were significantly associated with metabolic and immune responses. The MAPK signaling pathway and the Toll-like receptor signaling pathway are important in the immune response of mollusks [32,33,34,35]. Cholesterol metabolism can significantly affect the growth and development of mollusks [36,37]. The GO and KEGG enrichment analyses revealed that low-salinity seawater has the potential to affect the growth and development of S. esculenta larvae. These results can be applied to the artificial breeding of S. esculenta in response to environmental changes such as rainfall-induced reductions in salinity.

4.2. Combined Analysis of KEGG and PPI

The growth, development, reproduction, and other life activities of living organisms are supported by proteins [38,39,40]. In this study, 61 genes significantly enriched in 16 KEGG signaling pathways were used to construct a PPI network for S. esculenta larvae experiencing low-salinity stress. Analysis of the PPI results demonstrated a highly significant interaction between differentially expressed proteins. For example, the number of protein interactions between JUN (Jun proto-oncogene, AP-1 transcription factor subunit) and APOB (apolipoprotein B) was greater than 20. By analyzing the PPI results, we conclude that the abovementioned proteins play important roles in the response of S. esculenta larvae to low salinity. The specific functions assumed by the differentially expressed proteins during low-salinity stimulation need to be further analyzed and explored. By synthesizing the results of PPI and KEGG analyses, 16 genes that play a significant role were identified in S. esculenta stimulated by low salinity.

4.2.1. Analysis of Inflammatory and Immune Responses

Unlike vertebrates, mollusks do not have acquired immunity and rely only on innate immunity to protect themselves from external stimuli [41,42]. Therefore, the activated immune response in invertebrates is particularly important when stimulated by environmental factors. The immune system is made up of cells and proteins responsible for immune defense in living organisms, and their coordinated responses to non-self-substances are called immune responses [43,44]. When the organism is stimulated by the external environment, it will produce an immune response, and at the same time, an inflammatory response will also occur [45,46,47]. An inflammatory response is a typical phenomenon in which an organism reacts to a biological, chemical, or physical stimulus [48]. The occurrence of inflammation in organisms means that damaged tissues and cells begin to be cleared and homeostasis is restored in the body [49,50]. Previous studies have pointed out that external stimuli can cause the NF-kappa B signaling pathway, NOD-like receptor signaling pathway, and other classical signaling pathways in Haliotis discus hannai to be significantly activated [51]. In our study, DUSP1 and NFKBIA were significantly enriched for involvement in the immune response. DUSP1 is an enzyme that removes phosphate groups from phosphatases and is able to regulate a variety of immune-related signaling pathways [52,53]. NFKBIA belongs to the NF-kappa B family and has a central role in coordinating various immune and inflammatory responses [54]. In our results, the expression levels of DUSP1 and NFKBIA were significantly up-regulated after low-salinity stimulation. Based on these results, we can speculate that low-salinity stimulation significantly activates the immune defense of larvae. However, the immune response mechanism of S. esculenta has not been fully investigated and needs to be further explored.

4.2.2. Abnormalities in Metabolism

Metabolic processes are important biological processes in organisms that provide energy for cellular functioning. Abnormalities in metabolism may lead to irreversible damage to cells and tissues [55,56,57]. Lipid metabolites can also be regulators of protein function and cellular signal transduction [58]. In this study, five key DEGs were identified as having a strong correlation with metabolism, namely CYP7A1, CYP3A11, APOB, PHGDH, and PRODH2. Abnormal expression of CYP7A1 leads to a disruption of cholesterol metabolism that, in turn, leads to cellular damage [59]. Overexpression of PHGDH can regulate the synthesis of nicotinamide to maintain lipid homeostasis [60]. This gene was significantly down-regulated in the present study, suggesting that abnormal lipid metabolism occurred in our young larvae after stimulation. In this study, the above genes were significantly differentially expressed, suggesting that low salinity led to abnormal metabolism in S. esculenta larvae.

4.2.3. Signal Transduction was Enhanced by Low Salinity

Almost all biological processes require the participation of signal transduction [61,62]. In the present study, four DEGs, CHRNA7, NOS1, NOS2 and GRIA1, were identified as significantly enhanced signal transduction-related genes. The α7 neuronal nicotinic acetylcholine receptor gene (CHRNA7) and glutamate ionotropic receptor AMPA type subunit 1 (GRIA1) have complex regulatory mechanisms and are commonly expressed in organisms [61,62]. NOS1 and NOS2 belong to the nitric oxide synthase family and play a role in several biological processes, including neurotransmission and signal transduction [63]. NOS2 enhances the immune response of an organism [64]. The expression level of this gene was significantly up-regulated, which suggested that immune defense was activated in juveniles after being stimulated by low salinity. Analysis of these results demonstrates that biological processes such as immune defenses may be significantly activated in larvae when stimulated by low salinity to defend themselves against damage caused by external stimuli.

4.3. Analysis of Two Hub Genes

In this study, two genes, APOB and JUN, were identified as pivotal genes that play critical roles in S. esculenta when stimulated by low salinity. Apolipoprotein B is the main structural protein of low-density lipoprotein (LDL-C), whose main function is to bind and transport lipids to various parts of the organism for metabolism and other biological processes [65]. JUN is a highly conserved proto-oncogene that is under-expressed or not expressed when the organism is functioning normally. When activated by foreign substances or environmental stimuli, it becomes highly expressed, leading to abnormal cell proliferation [66,67]. In our results, these two genes have the most PPI interactions. We hypothesize that the effects of low salinity on larvae are dramatic, activating immune defenses and generating inflammation, leading to abnormalities in metabolic homeostasis.

4.4. Exploring the Functions of Other Key DEGs

There were also genes bearing important responsibilities that were identified as key genes after low-salinity stress. GCLC promotes the synthesis of glutathione that in turn enhances the antioxidant defense of cells and regulates cell proliferation [68]. PARP1 is a marker of immune status that responds to the inflammation status in the organism [69]. The fact that these genes showed significant differential expression also suggests that S. esculenta larvae have enhanced antioxidant defenses and develop an inflammatory response when stimulated by low salinity, demonstrating that the effect of low salinity on the larvae is dramatic.

5. Conclusions

In this study, we explored the differential expression of genes in S. esculenta larvae after low-salinity stimulation using transcriptome sequencing. APOB is closely related to significant differences in the level of gene expression, suggesting that in larvae under low salinity, material transfer is significantly enhanced. Combined with the analysis of immune signaling pathways, which may be immune defense of the larvae, it was found that significantly enhanced material transport strengthened the immune response. The differential expression of genes involved in metabolism and signal transduction suggested that metabolism was accelerated in larvae when stimulated by low salinity, which may also play a role in enhancing immune defense. Taking all the results together, we hypothesized that low-salinity stimulation would lead to significant immune defense in juveniles, and at the same time, metabolically related signaling pathways were enhanced to provide assistance for the immune response. Therefore, it is necessary to pay attention to the damage caused by extreme environmental stimuli to larvae during the artificial breeding period.

Supplementary Materials

The following supporting information can be downloaded at: https://www.mdpi.com/article/10.3390/ani13193139/s1, Table S1: Experimental seawater parameter; Table S2: Primers used for qRT-PCR; Table S3: RNA-Seq sequencing results and quality analysis.

Author Contributions

Conceptualization, Z.L. and J.Y.; methodology, Z.L., Y.W., X.L., W.W., G.S., X.X. and Y.F.; writing—original draft preparation, Y.W.; writing—review and editing, J.Y. and Z.L.; supervision, Z.L.; project administration, Z.L. and J.Y.; funding acquisition, J.Y. All authors have read and agreed to the published version of the manuscript.

Funding

This research was funded by the Ministry of Agriculture of the People’s Republic of China under grant number CARS-49.

Institutional Review Board Statement

This research was conducted in accordance with the protocols of the Institutional Animal Care and Use Committee of Ludong University (protocol number LDU-IRB20210308NXY) and the China Government Principles for the Utilization and Care of Invertebrate Animals Used in Testing, Research, and Training (State Science and Technology Commission of the People’s Republic of China for No. 2, 31 October 1988).

Informed Consent Statement

Not applicable.

Data Availability Statement

We have uploaded and published our raw data in the Sequence Read Archive database on NCBI. The SRA accession numbers are SRR23936169, SRR23936170, SRR23936171, SRR23936172, SRR23936173, SRR23936174, SRR23936175, SRR23936181, SRR23936182, SRR25097168, SRR25097169, SRR25097170, SRR25097171, SRR25097172, and SRR25097173. The specific website for querying these data is: https://www.ncbi.nlm.nih.gov/Traces/study/?acc=PRJNA947123&o=library_name_s%3Aa%3Bacc_s%3Aa (accessed on 25 September 2023).

Conflicts of Interest

The authors declare no conflict of interest.

References

  1. Aura, C.M.; Saitoh, S.I.; Liu, Y.; Hirawake, T.; Baba, K.; Yoshida, T. Implications of marine environment change on Japanese scallop (Mizuhopecten yessoensis) aquaculture suitability: A comparative study in Funka and Mutsu Bays, Japan. Aquac. Res. 2016, 47, 2164–2182. [Google Scholar] [CrossRef]
  2. Zhou, C.; Wong, K.; Tsou, J.Y.; Zhang, Y. Detection and Statistics of Offshore Aquaculture Rafts in Coastal Waters. J. Mar. Sci. Eng. 2022, 10, 781. [Google Scholar] [CrossRef]
  3. Hunt, J.D.; Byers, E. Reducing sea level rise with submerged barriers and dams in Greenland. Mitig. Adapt. Strateg. Glob. Chang. 2019, 24, 779–794. [Google Scholar] [CrossRef]
  4. Gregory, J.; Oerlemans, J. Simulated future sea-level rise due to glacier melt based on regionally and seasonally resolved temperature changes. Nature 1998, 391, 474–476. [Google Scholar] [CrossRef]
  5. Maynard, A.; Bible, J.M.; Pespeni, M.H.; Sanford, E.; Evans, T.G. Transcriptomic responses to extreme low salinity among locally adapted populations of Olympia oyster (Ostrea lurida). Mol. Ecol. 2018, 27, 4225–4240. [Google Scholar] [CrossRef]
  6. Knowles, G.; Handlinger, J.; Jones, B.; Moltschaniwskyj, N. Hemolymph chemistry and histopathological changes in Pacific oysters (Crassostrea gigas) in response to low salinity stress. J. Invertebr. Pathol. 2014, 121, 78–84. [Google Scholar] [CrossRef]
  7. Ren, Z.; Zhao, Y.; Song, W.; Wang, C.; Mu, C.; Li, R. Transcriptome analysis of the Sepia pharaonis: Identification of low salinity stress-related information and microsatellite markers. Comp. Biochem. Physiol. Part D Genom. Proteom. 2020, 35, 100705. [Google Scholar] [CrossRef]
  8. Morozova, O.; Hirst, M.; Marra, M.A. Applications of new sequencing technologies for transcriptome analysis. Annu. Rev. Genom. Hum. Genet. 2009, 10, 135–151. [Google Scholar] [CrossRef]
  9. Qian, X.; Ba, Y.; Zhuang, Q.; Zhong, G. RNA-Seq technology and its application in fish transcriptomics. OMICS 2014, 18, 98–110. [Google Scholar] [CrossRef]
  10. Bao, X.; Wang, W.; Chen, X.; Feng, Y.; Xu, X.; Sun, G.; Li, B.; Liu, X.; Li, Z.; Yang, J. Exploration of immune response mechanisms in cadmium and copper co-exposed juvenile golden cuttlefish (Sepia esculenta) based on transcriptome profiling. Front. Immunol. 2022, 13, 963931. [Google Scholar] [CrossRef]
  11. Boamah, G.A.; Huang, Z.; Shen, Y.; Lu, Y.; Wang, Z.; Su, Y.; Xu, C.; Luo, X.; Ke, C.; You, W. Transcriptome analysis reveals fluid shear stress (FSS) and atherosclerosis pathway as a candidate molecular mechanism of short-term low salinity stress tolerance in abalone. BMC Genom. 2022, 23, 392. [Google Scholar] [CrossRef]
  12. Bao, X.; Wang, W.; Yuan, T.; Li, Y.; Chen, X.; Liu, X.; Xu, X.; Sun, G.; Li, B.; Yang, J.; et al. Transcriptome profiling based on larvae at different time points after hatching provides a core set of gene resource for understanding the immune response mechanisms of the egg-protecting behavior against Vibrio anguillarum infection in Amphioctopus fangsiao. Fish Shellfish Immunol. 2022, 124, 430–441. [Google Scholar] [CrossRef] [PubMed]
  13. Guo, H.; Zhang, D.; Wang, L.; Li, W.; He, P.; Näslund, J.; Zhang, X. Sperm competition in golden cuttlefish Sepia esculenta: The impact of mating order and male size. Aquaculture 2021, 530, 735929. [Google Scholar] [CrossRef]
  14. Wang, Y.; Bao, X.; Wang, W.; Xu, X.; Liu, X.; Li, Z.; Yang, J.; Yuan, T. Exploration of anti-stress mechanisms in high temperature exposed juvenile golden cuttlefish (Sepia esculenta) based on transcriptome profiling. Front. Physiol. 2023, 14, 1189375. [Google Scholar] [CrossRef]
  15. Gong, J.; Li, Q.; Yu, H.; Liu, S.; Kong, L. Effects of low salinity on hemolymph osmolality and transcriptome of the Iwagaki oyster, Crassostrea nippona. Fish Shellfish Immunol. 2022, 126, 211–216. [Google Scholar] [CrossRef]
  16. Masotti, A.; Preckel, T. Analysis of small RNAs with the Agilent 2100 Bioanalyzer. Nat. Methods 2006, 3, 658. [Google Scholar] [CrossRef]
  17. de Sena Brandine, G.; Smith, A.D. Falco: High-speed FastQC emulation for quality control of sequencing data. F1000Res 2019, 8, 1874. [Google Scholar] [CrossRef]
  18. Kim, D.; Paggi, J.M.; Park, C.; Bennett, C.; Salzberg, S.L. Graph-based genome alignment and genotyping with HISAT2 and HISAT-genotype. Nat. Biotechnol. 2019, 37, 907–915. [Google Scholar] [CrossRef]
  19. Love, M.I.; Huber, W.; Anders, S. Moderated estimation of fold change and dispersion for RNA-seq data with DESeq2. Genome Biol. 2014, 15, 550. [Google Scholar] [CrossRef]
  20. Zheng, X.; Ma, Y.; Bai, Y.; Huang, T.; Lv, X.; Deng, J.; Wang, Z.; Lian, W.; Tong, Y.; Zhang, X.; et al. Identification and validation of immunotherapy for four novel clusters of colorectal cancer based on the tumor microenvironment. Front. Immunol. 2022, 13, 984480. [Google Scholar] [CrossRef]
  21. Jiao, X.; Sherman, B.T.; Huang, D.W.; Stephens, R.; Baseler, M.W.; Lane, H.C.; Lempicki, R.A. DAVID-WS: A stateful web service to facilitate gene/protein list analysis. Bioinformatics 2012, 28, 1805–1806. [Google Scholar] [CrossRef] [PubMed]
  22. Szklarczyk, D.; Gable, A.L.; Lyon, D.; Junge, A.; Wyder, S.; Huerta-Cepas, J.; Simonovic, M.; Doncheva, N.T.; Morris, J.H.; Bork, P.; et al. STRING v11: Protein-protein association networks with increased coverage, supporting functional discovery in genome-wide experimental datasets. Nucleic Acids Res. 2019, 47, D607–D613. [Google Scholar] [CrossRef] [PubMed]
  23. Ren, L.; Zhu, B.; Zhang, Y.; Wang, H.; Li, C.; Su, Y.; Ba, C. The research of applying primer premier 5.0 to design PCR primer. J. Jinzhou. Med. Coll. 2004, 25, 43–46. [Google Scholar] [CrossRef]
  24. Eker, Ç.; İnan, H.C.; Çelebi, A.; Gözen, E.D.; Karaman, E. Investigation of Toll-like Receptor-2, -3 and -4 Gene Expressions in Larynx Squamous Cell Carcinoma. Turk. Arch. Otorhinolaryngol. 2022, 60, 121–127. [Google Scholar] [CrossRef] [PubMed]
  25. Jones, H.R.; Johnson, K.M.; Kelly, M.W. Synergistic Effects of Temperature and Salinity on the Gene Expression and Physiology of Crassostrea virginica. Integr. Comp. Biol. 2019, 59, 306–319. [Google Scholar] [CrossRef]
  26. Ming, Z.; Pang, Y.; Liu, J. Mechanical Deformation Mediated Transmembrane Transport. Macromol. Rapid Commun. 2020, 41, e1900518. [Google Scholar] [CrossRef]
  27. Schendzielorz, A.B.; Bragoszewski, P.; Naumenko, N.; Gomkale, R.; Schulz, C.; Guiard, B.; Chacinska, A.; Rehling, P. Motor recruitment to the TIM23 channel’s lateral gate restricts polypeptide release into the inner membrane. Nat. Commun. 2018, 9, 4028. [Google Scholar] [CrossRef]
  28. Zhong, J.; Zhao, X. Transcriptomic Analysis of Viable but Non-Culturable Escherichia coli O157:H7 Formation Induced by Low Temperature. Microorganisms 2019, 7, 634. [Google Scholar] [CrossRef]
  29. McNamara, J.C.; Freire, C.A. Strategies of Invertebrate Osmoregulation: An Evolutionary Blueprint for Transmuting into Fresh Water from the Sea. Integr. Comp. Biol. 2022, 62, 376–387. [Google Scholar] [CrossRef]
  30. Wright-LaGreca, M.; Mackenzie, C.; Green, T.J. Ocean Acidification Alters Developmental Timing and Gene Expression of Ion Transport Proteins during Larval Development in Resilient and Susceptible Lineages of the Pacific Oyster (Crassostrea gigas). Mar Biotechnol. 2022, 24, 116–124. [Google Scholar] [CrossRef]
  31. Hu, M.Y.; Sucré, E.; Charmantier-Daures, M.; Charmantier, G.; Lucassen, M.; Himmerkus, N.; Melzner, F. Localization of ion-regulatory epithelia in embryos and hatchlings of two cephalopods. Cell Tissue Res. 2010, 339, 571–583. [Google Scholar] [CrossRef] [PubMed]
  32. Ren, Y.; Liu, H.; Fu, S.; Dong, W.; Pan, B.; Bu, W. Transcriptome-wide identification and characterization of toll-like receptors response to Vibrio anguillarum infection in Manila clam (Ruditapes philippinarum). Fish Shellfish Immunol. 2021, 111, 49–58. [Google Scholar] [CrossRef] [PubMed]
  33. Zou, Y.; Xu, X.; Xiao, X.; Wang, Y.; Yang, H.; Zhang, Z. Genome-wide identification and characterization of Toll-like receptors (TLR) genes in Haliotis discus hannai, H. rufescens, and H. laevigata. Fish Shellfish Immunol. 2023, 137, 108728. [Google Scholar] [CrossRef]
  34. Dong, X.; Kim, Y.S.; Kim, E.K.; Shin, W.B.; Park, J.S.; Kim, S.J.; Go, E.A.; Park, P.J.; Kwon, S.C. Scallop Extracts Inhibited LPS-Induced Inflammation by Suppressing MAPK and NF-κB Activation in RAW264.7 Macrophages. Adv. Exp. Med. Biol. 2019, 1155, 1069–1081. [Google Scholar] [CrossRef] [PubMed]
  35. Portillo-López, A.; Gould, M.C.; Stephano, J.L. MAPK is involved in metaphase I arrest in oyster and mussel oocytes. Biol. Cell. 2003, 95, 275–282. [Google Scholar] [CrossRef]
  36. Hatano, K.; Yoshida, M.A.; Hirayama, J.; Kitani, Y.; Hattori, A.; Ogiso, S.; Watabe, Y.; Sekiguchi, T.; Tabuchi, Y.; Urata, M.; et al. Deep ocean water alters the cholesterol and mineral metabolism of squid Todarodes pacificus and suppresses its weight loss. Sci. Rep. 2023, 13, 7591. [Google Scholar] [CrossRef]
  37. Fiorini, R.; Ventrella, V.; Trombetti, F.; Fabbri, M.; Pagliarani, A.; Nesci, S. Lipid-protein interactions in mitochondrial membranes from bivalve mollusks: Molecular strategies in different species. Comp. Biochem. Physiol. B Biochem. Mol. Biol. 2019, 227, 12–20. [Google Scholar] [CrossRef]
  38. Ahmad, I.; Ahmed, I.; Fatma, S.; Peres, H. Role of branched-chain amino acids on growth, physiology and metabolism of different fish species: A review. Aquacult. Nutr. 2021, 27, 1270–1289. [Google Scholar] [CrossRef]
  39. Chandhini, S.; Trumboo, B.; Jose, S.; Varghese, T.; Rajesh, M.; Kumar, V.J.R. Insulin-like growth factor signalling and its significance as a biomarker in fish and shellfish research. Fish. Physiol. Biochem. 2021, 47, 1011–1031. [Google Scholar] [CrossRef]
  40. Li, Z.; Bao, X.; Liu, X.; Li, Y.; Cui, M.; Liu, X.; Li, B.; Feng, Y.; Xu, X.; Sun, G.; et al. Transcriptome profiling based on protein-protein interaction networks provides a set of core genes for understanding the immune response mechanisms of the egg-protecting behavior in Octopus ocellatus. Fish Shellfish Immunol. 2021, 117, 113–123. [Google Scholar] [CrossRef]
  41. Wu, Y.; Si, X.; Qiu, L.; Chen, X.; Fu, P.; Buttino, I.; Guo, B.; Liao, Z.; Yan, X.; Qi, P. Regulation of innate immunity in marine mussel Mytilus coruscus: MicroRNA Mc-novel_miR_196 targets McTLR-like1 molecule to inhibit inflammatory response and apoptosis. Fish Shellfish Immunol. 2023, 138, 108868. [Google Scholar] [CrossRef] [PubMed]
  42. Canesi, L.; Auguste, M.; Balbi, T.; Prochazkova, P. Soluble mediators of innate immunity in annelids and bivalve mollusks: A mini-review. Front. Immunol. 2022, 13, 1051155. [Google Scholar] [CrossRef] [PubMed]
  43. Tomar, N.; De, R.K. A brief outline of the immune system. Methods Mol. Biol. 2014, 1184, 3–12. [Google Scholar] [CrossRef]
  44. Parkin, J.; Cohen, B. An overview of the immune system. Lancet 2001, 357, 1777–1789. [Google Scholar] [CrossRef] [PubMed]
  45. Hotamisligil, G.S. Inflammation, metaflammation and immunometabolic disorders. Nature 2017, 542, 177–185. [Google Scholar] [CrossRef]
  46. Shastri, A.; Bonifati, D.M.; Kishore, U. Innate immunity and neuroinflammation. Mediat. Inflamm. 2013, 2013, 342931. [Google Scholar] [CrossRef]
  47. Rahtes, A.; Geng, S.; Lee, C.; Li, L. Cellular and molecular mechanisms involved in the resolution of innate leukocyte inflammation. J. Leukoc. Biol. 2018, 104, 535–541. [Google Scholar] [CrossRef]
  48. Germolec, D.R.; Shipkowski, K.A.; Frawley, R.P.; Evans, E. Markers of Inflammation. Methods Mol. Biol. 2018, 1803, 57–79. [Google Scholar] [CrossRef]
  49. Ottaviani, E.; Franchini, A.; Malagoli, D. Inflammatory response in molluscs: Cross-taxa and evolutionary considerations. Curr. Pharm. Des. 2010, 16, 4160–4165. [Google Scholar] [CrossRef]
  50. Jiravanichpaisal, P.; Söderhäll, K.; Söderhäll, I. Inflammation in arthropods. Curr. Pharm. Des. 2010, 16, 4166–4174. [Google Scholar] [CrossRef]
  51. Zhang, X.; Guo, M.; Sun, Y.; Wang, Y.; Zhang, Z. Transcriptomic analysis and discovery of genes involving in enhanced immune protection of Pacific abalone (Haliotis discus hannai) in response to the re-infection of Vibrio parahaemolyticus. Fish Shellfish Immunol. 2022, 125, 128–140. [Google Scholar] [CrossRef] [PubMed]
  52. Li, S.; Hao, G.; Li, J.; Peng, W.; Geng, X.; Sun, J. Comparative analysis of dual specificity protein phosphatase genes 1, 2 and 5 in response to immune challenges in Japanese flounder Paralichthys olivaceus. Fish Shellfish Immunol. 2017, 68, 368–376. [Google Scholar] [CrossRef]
  53. Sun, Y.; Chu, Q.; Zhao, X.; Zhou, Z.; Bi, D.; Xu, T. microRNA-375 modulates the NF-κB pathway in miiuy croaker by targeting DUSP1 gene. Dev. Comp. Immunol. 2018, 86, 196–202. [Google Scholar] [CrossRef]
  54. Li, Q.; Verma, I.M. NF-kappaB regulation in the immune system. Nat. Rev. Immunol. 2002, 2, 725–734. [Google Scholar] [CrossRef] [PubMed]
  55. Chakravarti, B.; Akhtar Siddiqui, J.; Anthony Sinha, R.; Raza, S. Targeting autophagy and lipid metabolism in cancer stem cells. Biochem. Pharmacol. 2023, 212, 115550. [Google Scholar] [CrossRef]
  56. Qu, M.; Zhou, X.; Wang, X.; Li, H. Lipid-induced S-palmitoylation as a Vital Regulator of Cell Signaling and Disease Development. Int. J. Biol. Sci. 2021, 17, 4223–4237. [Google Scholar] [CrossRef]
  57. Zhang, J.M.; Wang, X.H.; Hao, L.H.; Wang, H.; Zhang, X.Y.; Muhammad, I.; Qi, Y.; Li, G.L.; Sun, X.Q. Nrf2 is crucial for the down-regulation of Cyp7a1 induced by arachidonic acid in Hepg2 cells. Environ. Toxicol. Pharmacol. 2017, 52, 21–26. [Google Scholar] [CrossRef]
  58. Iqbal, J.; Sun, L.; Zaidi, M. Complexity in signal transduction. Ann. N. Y. Acad. Sci. 2010, 1192, 238–244. [Google Scholar] [CrossRef]
  59. Lafrenie, R.M.; Yamada, K.M. Integrin-dependent signal transduction. J. Cell Biochem. 1996, 61, 543–553. [Google Scholar] [CrossRef]
  60. Kang, Y.P.; Falzone, A.; Liu, M.; González-Sánchez, P.; Choi, B.H.; Coloff, J.L.; Saller, J.J.; Karreth, F.A.; DeNicola, G.M. PHGDH supports liver ceramide synthesis and sustains lipid homeostasis. Cancer Metab. 2020, 8, 6. [Google Scholar] [CrossRef]
  61. Sinkus, M.L.; Graw, S.; Freedman, R.; Ross, R.G.; Lester, H.A.; Leonard, S. The human CHRNA7 and CHRFAM7A genes: A review of the genetics, regulation, and function. Neuropharmacology 2015, 96 Pt B, 274–288. [Google Scholar] [CrossRef]
  62. Zhang, S.; Xue, R.; Geng, Y.; Wang, H.; Li, W. Fisetin Prevents HT22 Cells from High Glucose-Induced Neurotoxicity via PI3K/Akt/CREB Signaling Pathway. Front. Neurosci. 2020, 14, 241. [Google Scholar] [CrossRef] [PubMed]
  63. Alderton, W.K.; Cooper, C.E.; Knowles, R.G. Nitric oxide synthases: Structure, function and inhibition. Biochem. J. 2001, 357 Pt 3, 593–615. [Google Scholar] [CrossRef] [PubMed]
  64. Wu, H.; Yin, X.; Zhao, X.; Wu, Z.; Xiao, Y.; Di, Q.; Sun, P.; Tang, H.; Quan, J.; Chen, W. HDAC11 negatively regulates antifungal immunity by inhibiting Nos2 expression via binding with transcriptional repressor STAT3. Redox Biol. 2022, 56, 102461. [Google Scholar] [CrossRef]
  65. Alaupovic, P. Apolipoprotein composition as the basis for classifying plasma lipoproteins. Characterization of ApoA- and ApoB-containing lipoprotein families. Prog. Lipid Res. 1991, 30, 105–138. [Google Scholar] [CrossRef] [PubMed]
  66. Shaulian, E. AP-1—The Jun proteins: Oncogenes or tumor suppressors in disguise? Cell Signal. 2010, 22, 894–899. [Google Scholar] [CrossRef] [PubMed]
  67. Hartl, M.; Bader, A.G.; Bister, K. Molecular targets of the oncogenic transcription factor jun. Curr. Cancer Drug Targets 2003, 3, 41–55. [Google Scholar] [CrossRef] [PubMed]
  68. Lu, S.C. Regulation of glutathione synthesis. Mol. Aspects Med. 2009, 30, 42–59. [Google Scholar] [CrossRef]
  69. Zhang, X.; Wang, Y.; Gari, A.; Qu, C.; Chen, J. Pan-Cancer Analysis of PARP1 Alterations as Biomarkers in the Prediction of Immunotherapeutic Effects and the Association of Its Expression Levels and Immunotherapy Signatures. Front. Immunol. 2021, 12, 721030. [Google Scholar] [CrossRef]
Figure 1. Volcano plot of the distribution of the expression levels of genes. Each dot represents a gene. Red dots indicate differentially down-regulated genes; blue dots indicate genes that were differentially up-regulated; and gray dots indicate genes that were not significantly different.
Animals 13 03139 g001
Figure 2. Hierarchical clustering heat map of DEGs. The color ranges from red to blue, indicating differential expression levels from high to low. Each column represents a different treatment group. Each row represents a gene. The clustering tree shows all significantly differentially expressed genes.
Animals 13 03139 g002
Figure 3. Venn diagram of DEGs. Blue and orange colors indicate the numbers of differentially expressed genes at 4 and 24 h, respectively. The number of co-expressed genes is indicated by the dark-brown area.
Animals 13 03139 g003
Figure 4. GO analysis of DEGs. The different colors represent the different categories from the GO database.
Animals 13 03139 g004
Figure 5. Significant enrichment of related signaling pathways in Level-2.
Animals 13 03139 g005
Figure 6. Low-salt-stress-related PPI network. Each node represents a gene, and the number of edges between genes represents the number of interacting relationships.
Animals 13 03139 g006
Figure 7. Quantitative validation of key genes.
Animals 13 03139 g007
Table 1. Sixteen KEGG signaling pathways.
PathwayNumber of DEGs
Apoptosis4
Arginine and proline metabolism3
Arginine biosynthesis2
Ascorbate and aldarate metabolism3
Cell adhesion molecules3
Cell cycle5
Cholesterol metabolism6
Cholinergic synapse2
DNA replication6
Focal adhesion2
Glutamatergic synapse6
Glycine, serine, and threonine metabolism3
MAPK signaling pathway8
Metabolic pathways27
NOD-like receptor signaling pathway3
Toll-like receptor signaling pathway2
Table 2. Statistics of low-salt-stress-response-related PPI network parameters.
Stats
Number of nodes 54
Number of edges 245
Average nodes9.07
Clustering coefficient0.558
Number of expected edges 164
p-value1.83 × 10−9
Table 3. Key DEGs and the results from the PPI and KEGG analyses.
GeneGene NameNumber of PPINumber of KEGG
APOBapolipoprotein B233
ATRATR serine/threonine kinase111
CDC42cell division cycle 42174
CHRNA7cholinergic receptor nicotinic alpha 7 subunit121
CYP3A11cytochrome P450, family 3, subfamily a, polypeptide 11115
CYP7A1cytochrome P450 family 7 subfamily A member 1152
DUSP1dual specificity phosphatase 1152
GCLCglutamate-cysteine ligase catalytic subunit132
GRIA1glutamate ionotropic receptor AMPA type subunit 1142
JUNJun proto-oncogene, AP-1 transcription factor subunit266
NFKBIANFKB inhibitor alpha175
NOS1nitric oxide synthase 1184
NOS2nitric oxide synthase 2144
PARP1poly(ADP-ribose) polymerase 1121
PHGDHphosphoglycerate dehydrogenase182
PRODH2proline dehydrogenase 2121
Disclaimer/Publisher’s Note: The statements, opinions and data contained in all publications are solely those of the individual author(s) and contributor(s) and not of MDPI and/or the editor(s). MDPI and/or the editor(s) disclaim responsibility for any injury to people or property resulting from any ideas, methods, instructions or products referred to in the content.

