Article

NCAPG Regulates Myogenesis in Sheep, and SNPs Located in Its Putative Promoter Region Are Associated with Growth and Development Traits

1
Joint International Research Laboratory of Agriculture and Agri-Product Safety of Ministry of Education of China, Yangzhou University, Yangzhou 225009, China
2
International Joint Research Laboratory in Universities of Jiangsu Province of China for Domestic Animal Germplasm Resources and Genetic Improvement, Yangzhou University, Yangzhou 225009, China
3
College of Animal Science and Technology, Yangzhou University, Yangzhou 225009, China
4
International Centre for Agricultural Research in the Dry Areas, Addis Ababa 999047, Ethiopia
5
“Innovative China” “Belt and Road” International Agricultural Technology Innovation Institute for Evaluation, Protection, and Improvement on Sheep Genetic Resource, Yangzhou 225009, China
*
Author to whom correspondence should be addressed.
Animals 2023, 13(20), 3173; https://doi.org/10.3390/ani13203173
Submission received: 13 September 2023 / Revised: 2 October 2023 / Accepted: 7 October 2023 / Published: 11 October 2023
(This article belongs to the Collection Small Ruminant Genetics and Breeding)

Abstract

:

Simple Summary

Screening for polymorphisms in the promoter region of a functional gene is an effective way to identify useful markers for improving sheep growth and development. Non-SMC condensin I complex subunit G (NCAPG) is a candidate gene linked with sheep growth and development. Its explicit role in muscle development is still unclear, and markers in NCAPG’s promoter region have not been explored yet. The goal of this study was to investigate the direct role of NCAPG in regulating myogenic development and the differentiation of myoblasts and explore potential markers in its promoter region in relation to sheep growth and development traits. To achieve this goal, cell proliferation and differentiation after RNA interference with NCAPG were investigated in embryonic myoblasts. In addition, the genetic markers in the promoter region of NCAPG were scanned, and association analysis between the markers and sheep growth and development traits was carried out. The results suggest that interfering with NCAPG inhibits the proliferation and differentiation of myoblasts. Five variants detected in the promoter region of NCAPG were significantly (p < 0.05) associated with sheep growth and development traits. These results provide direct evidence of NCAPG regulating myogenesis and provide useful genetic markers to increase the efficacy of the selection of sheep growth and development traits.

Abstract

Previously, NCAPG was identified as a candidate gene associated with sheep growth traits. This study aimed to investigate the direct role of NCAPG in regulating myogenesis in embryonic myoblast cells and to investigate the association between single-nucleotide polymorphisms (SNPs) in its promoter region and sheep growth traits. The function of NCAPG in myoblast proliferation and differentiation was detected after small interfering RNAs (siRNAs) knocked down the expression of NCAPG. Cell proliferation was detected using CCK-8 assay, EdU proliferation assay, and flow cytometry cell cycle analysis. Cell differentiation was detected via cell immunofluorescence and the quantification of myogenic regulatory factors (MRFs). SNPs in the promoter region were detected using Sanger sequencing and genotyped using the improved multiplex ligation detection reaction (iMLDR®) technique. As a result, a notable decrease (p < 0.01) in the percentage of EdU-positive cells in the siRNA-694-treated group was observed. A significant decrease (p < 0.01) in cell viability after treatment with siRNA-694 for 48 h and 72 h was detected using the CCK-8 method. The quantity of S-phase cells in the siRNA-694 treatment group was significantly decreased (p < 0.01). After interfering with NCAPG in myoblasts during induced differentiation, the relative expression levels of MRFs were markedly (p < 0.05 or p < 0.01) reduced compared with the control group on days 5–7. The myoblast differentiation in the siRNA-694 treatment group was obviously suppressed compared with the control group. SNP1, SNP2, SNP3, and SNP4 were significantly (p < 0.05) associated with all traits except body weight measured at birth and one month of age. SNP5 was significantly (p < 0.05) associated with body weight, body height, and body length in six-month-old sheep. In conclusion, interfering with NCAPG can inhibit the proliferation and differentiation of ovine embryonic myoblasts. SNPs in its promoter region can serve as potential useful markers for selecting sheep growth traits.

1. Introduction

Sheep are well adapted to diverse environments and are raised principally for their meat, milk, and fiber. These products could meet global needs for meat and essential nutrients for an increasing population around the world, especially in developing countries or regions. Growth and development traits, including body weight, body length, and body height, have economic importance in sheep production because these traits reflect production efficiency. Therefore, improving sheep growth and development traits is important for increasing the economic returns for farmers and the meat supply for customers. Genomic selection is one of the most effective ways to improve economic traits [1]. However, the economic returns of sheep genomic selection are still limited. The costs of genotyping and computation are still unaffordable for large-scale sheep populations in developing countries [2]. Marker-assisted selection is an alternative way to increase the rate of genetic improvement, which could reduce the time required to improve sheep growth at an acceptable cost. Thus, finding key candidate genes and then designing genetic markers for the genetic improvement of growth and development traits is essential for the sheep industry.
By utilizing the advancements in high-throughput sequencing and genotyping, researchers have effectively employed genome-wide association analysis (GWAS) using single-nucleotide polymorphisms (SNPs) across the whole genome to discover SNPs and important genes associated with growth and development traits in sheep populations from various backgrounds [3,4,5,6,7,8,9,10,11,12,13,14,15,16,17,18,19,20,21,22,23,24]. These studies provide an important theoretical basis for further investigating functional genes and designing genetic markers for the genetic improvement of growth and development traits. Among these GWAS studies, several studies with relatively large population sizes have identified a striking candidate gene called non-SMC condensin I complex subunit G (NCAPG) on ovine chromosome 6 associated with sheep growth and development traits [4,7,8]. Beef cattle GWAS results suggest that NCAPG is linked with an average daily gain [25]. A meta-analysis of GWAS for cattle stature identified that NCAPG may regulate body size in mammals [26]. In beef research, the expression of NCAPG in the fetal longissimus muscle was significantly greater than that in adults [27], and the abundance of NCAPG was significantly correlated with the average daily gain trait [25]. Recently, a study in cattle revealed that NCAPG could regulate myogenesis in the fetal stage [28]. Nevertheless, explicit evidence of NCAPG regulating sheep growth and development is still scarce, especially in muscle development.
The development of skeletal muscles is a crucial indicator of a sheep’s growth and development characteristics since it has been estimated using computerized tomography (CT) scans that muscles make up more than 60% of a sheep’s body weight [19]. Muscle development can usually be classified into two stages, namely the prenatal and postnatal stages. Muscle development during the prenatal period is crucial as it determines the number of muscle fibers, which scarcely increases after birth [29,30,31]. Myoblast proliferation, differentiation, and fusion determine prenatal myogenesis [32,33]. To date, the role of NCAPG in the myogenesis of sheep myoblasts is still largely unknown.
When a gene’s function is determined, the genetic markers linked with economic traits in the gene’s regulatory regions, e.g., its promoter region, can be explored. For example, in Romney sheep, SNPs in the promoter region of the myostatin (MSTN) were significantly related to growth and carcass traits [34]. Similarly, in Hu sheep, SNPs in the promoter region of the melanocortin-4 receptor (MC4R) were linked with body conformation traits [35]. Despite the importance of the SNPs in the promoter region of a functional gene, no studies investigating the association between SNPs in NCAPG’s promoter region and growth and development traits in sheep have been implemented.
The goal of this study was to investigate the direct role of NCAPG in regulating myogenic development and differentiation of myoblasts and explore potential SNPs in its promoter region in relation to sheep growth and development traits. To achieve this goal, cell proliferation and differentiation after RNA interference with NCAPG were investigated in myoblasts derived from fetal ovine muscle tissue. In addition, SNPs in the promoter region of NCAPG (from transcription start site to upstream 2000 bp of transcription start site) were detected by Sanger sequencing and genotyped by the improved multiplex ligation detection reaction (iMLDR®) method. The association analysis between SNPs and sheep growth and development traits was implemented. This study could provide direct evidence on NCAPG in regulating myogenesis and provide useful genetic markers in NCAPG’s promoter region to increase the selection efficacy for sheep growth and development traits.

2. Materials and Methods

2.1. Ethical Statement

Animal experiments in the current study underwent censorship and received approval from Yangzhou University’s Experimental Animal Ethical Committee (approval number 202103279, approval date 8 March 2021).

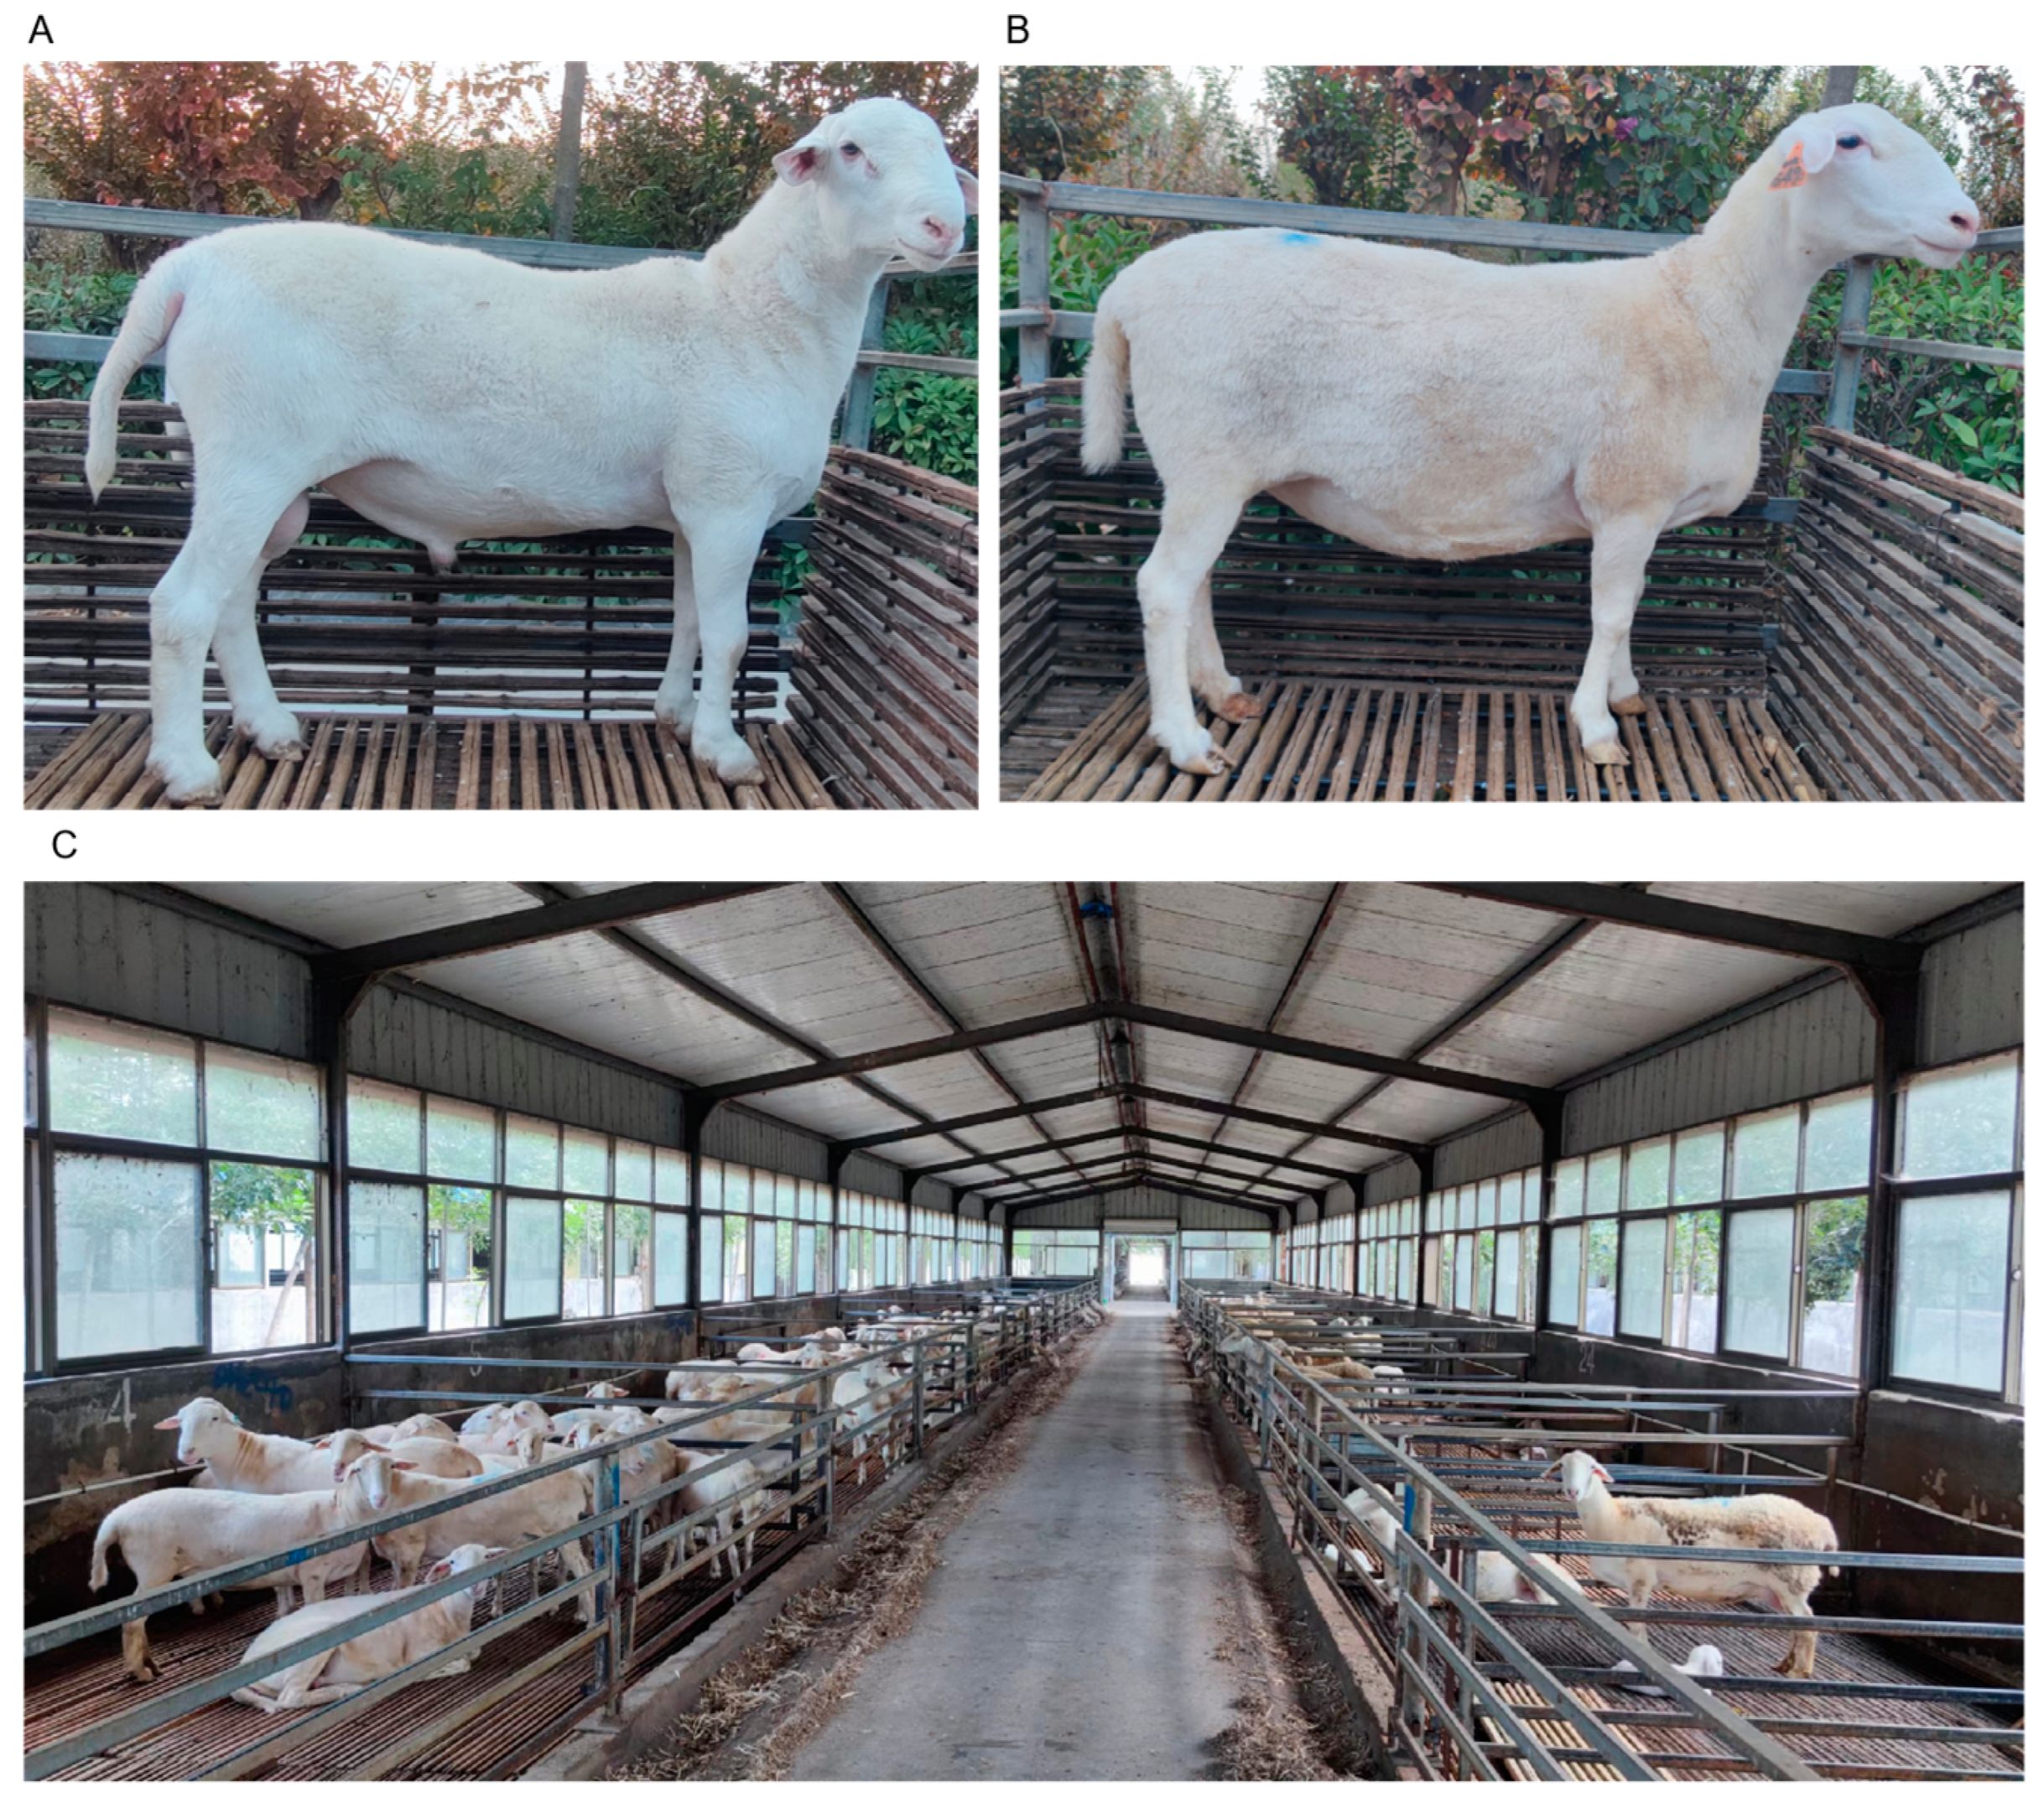
2.2. Sample and Phenotypic Data Collection

One experimental pregnant ewe of Hu sheep used for the primary embryonic myoblasts’ isolation was provided by Suzhou Taihu Dongshan Sheep Industry Development Co., Ltd. (Suzhou 215000, Jiangsu Province, China). The pregnant ewe was slaughtered, and the fetal longissimus dorsi muscle was obtained from its descendants. Then, the fetal longissimus dorsi muscle was conserved in an insulated bucket and brought back to the laboratory for the subsequent isolation of cells.
Suhu meat sheep (Figure 1) is a breeding population that was constructed by our group. It derives from the selective breeding of white Dorper and Hu sheep. All Suhu meat sheep were raised under the same management conditions in Xuzhou Suyang Sheep Industry Co., Ltd. (Xuzhou 215000, Jiangsu Province, China). Six types of tissue samples, namely longissimus dorsi muscle, heart, liver, spleen, lung, and kidney, were collected from Suhu sheep. In total, three fetuses (around day 85) from two pregnant ewes, three five-day-old male newborn lambs, and three one-year-old male sheep were used for tissue sample collection. All tissue samples were collected within 30 min with three triplicates after the sheep were slaughtered. Samples were placed in liquid nitrogen and stored in a refrigerator set at −80 °C for long-term preservation.
In the current study, the 2nd generation of Suhu meat sheep (Figure 1) was used for phenotypic data collection. Four traits, namely body weight, body height, body length, and shin circumference, representing sheep growth and development were measured at born, one month, two months, three months, and six months following a published protocol [36]. A total of 539 blood samples with phenotypic data were collected, including 190 male and 349 female lambs. Genomic DNA was extracted from blood using a conventional phenol-chloroform method. Double-distilled water was used to dissolve the DNA samples, which were then stored in a refrigerator at a temperature of −20 °C.

2.3. Isolation of Sheep Embryonic Myoblasts

Primary embryonic myoblasts were successfully isolated in our previous study [37]. Briefly, embryonic myoblasts were obtained following three steps: (1) primary embryonic myoblast isolation, (2) primary embryonic myoblast purification, and (3) embryonic myoblast identification. Firstly, primary embryonic myoblasts were isolated from the fetal longissimus dorsi tissue by using the collagenase and trypsin combined digestion differential adhesion methods [38]. Secondly, embryonic myoblasts were purified by using the cell suspension method [37]. Thirdly, primary embryonic myoblasts were identified by using quantitative analysis of myogenic regulatory factors (MRFs) after inducing differentiation. Finally, 0.25% trypsin was used to digest myoblasts, and then they were frozen in liquid nitrogen for further experiments. The cells were cultured in a growth medium (GM) with a temperature of 37 °C and 5% CO2.

2.4. Plasmid Construction and Small Interfering RNA Synthesis

The coding sequence (CDS) of NCAPG was amplified from embryonic myoblasts’ complementary DNA (cDNA). Primers of CDS used for plasmid construction designed using the CE Design online tools (http://www.vazyme.com, accessed on 2 October 2023) and Primer Premier 5 [39] are documented in Table 1. The pcDNA3.1(+) plasmid was digested using Hind III and BamH I restriction enzymes, resulting in linearization. Next, the PCR product was inserted into the linearized vector according to the guidelines provided by the ClonExpress® II One Step Cloning Kit (Vazyme Biotech Co., Ltd., Nanjing 210000, Jiangsu Province, China). Finally, the constructed recombinant plasmid was named pcDNA3.1(+)-NCAPG. To confirm pcDNA3.1(+)-NCAPG, Sanger sequencing was performed by a commercial sequencing provider (Tsingke Biotechnology Co., Ltd., Nanjing 210000, Jiangsu Province, China).
Small interfering RNAs (siRNAs) specifically targeting ovine NCAPG were designed and synthesized by a commercial service provider (GenePharma Pharmaceutical Technology Co., Ltd., Suzhou 215000, Jiangsu Province, China). Meanwhile, a negative control (NC) was also synthesized. All the synthesized siRNA sequences were documented in Table 2.

2.5. Cell Transfection and Induction of Differentiation

The procedures of cell transfection and induction of differentiation followed our previous work [37]. In short, once the cells reached a confluence level of 50–60%, the transfection was carried out by using the jetPRIME transfection reagent (Polyplus transfection, Strasbourg, Illkirch, France). Following transfection for 24–48 h, embryonic myoblasts were induced to differentiate in vitro when GM was changed into a differential medium (DM, consisting of 98% high-glucose Dulbecco’s Modified Eagle Medium (DMEM) and 2% horse serum). Afterward, the cells were gathered for additional RNA extraction.

2.6. Total RNA Extraction, Reverse Transcription, and RT-PCR

TRIzol reagent (TIANGEN, Beijing, China) was used to extract total RNA from tissues and cells. A NanoReady spectrophotometer (Life Real, Hangzhou, China) was used to measure RNA concentration. In addition, 1% agarose gels were used to detect RNA integrity and contamination. All total RNA samples were stored in a −80 °C refrigerator until use.
FastKing gDNA Dispelling RT Super Mix (TIANGEN, Beijing, China) was utilized for reverse transcription according to the guidelines provided by the manufacturer. RT-PCR was conducted on the CFX96 Connect™ Real-Time System (BIO-RAD, Hercules, CA, USA) using 2 × TSINGKE Master qPCR Mix (SYBR Green I) (Tsingke, Beijing, China) following the manufacturer’s guidelines. To normalize the gene expression, the abundance of the housekeeping gene GAPDH was utilized. The commonly used 2−∆∆Ct method was used to calculate gene abundance [40]. The primers were designed by Primer Premier 5 [39] and are displayed in Table 3.

2.7. Cell Proliferation Detection

In the current study, cell proliferation after interference with NCAPG was detected by Cell Counting Kit-8 (CCK-8) assay, 5-Ethynyl-20 -deoxyuridine (EdU) proliferation assay, and flow cytometry for cell cycle analysis.

2.7.1. CCK-8 Assay

The CCK-8 assay was performed using a CCK-8 kit (Vazyme, Nanjing, China) according to the instructions provided by the manufacturer. In short, embryonic myoblasts were seeded into the 96-well plates and were cultured in GM. Subsequently, cells were transfected using the methods documented in Section 2.5 for a duration of 24 h. Afterward, 10 µL of cck-8 solution was gently added into each well. Cells were incubated at 37 °C in darkness for 2–3 h. Finally, the optical density (OD) value at 450 nm representing the relative cellular activity at 0 h, 24 h, 48 h, and 72 h was detected by using a microplate reader (Tecan, Männedorf, Switzerland).

2.7.2. EdU Proliferation Assay

The EdU cell proliferation kit (RIBOBIO, Guangzhou, China) was utilized to carry out the EdU proliferation assay. Initially, embryonic myoblasts were transfected for 24–48 h. Then, the EdU staining assay was carried out following the manufacturer’s guidelines, and an inverted fluorescence microscope (Nikon, Minato, Tokyo, Japan) was used to take fluorescent photos. Finally, cell numbers in each image were counted using Image J (National Institutes of Health, Bethesda, MD, USA). The calculation involved using a formula to determine the percentage of EdU-positive cells, which was obtained by dividing the number of EdU-stained cells by the number of Hoechst-stained cells and multiplying the result by 100%.

2.7.3. Flow Cytometry for Cell Cycle Analysis

Flow cytometry was performed using a Cell Cycle kit (Beyotime, Shanghai, China). In short, trypsin was employed for cell digestion. After embryonic myoblasts were transfected for 24–48 h, the cells were gathered in a centrifuge tube with a capacity of 1.5 mL. Subsequently, 70% ethanol, which had been pre-cooled at 4 °C, was added into the centrifuge tube to preserve the cells for a duration of 12 h. Afterward, propidium (PI) staining was employed to color the cell samples in a dark environment at a temperature of 37 °C for 30 min. In the end, the DNA content of the cells was detected using Modfit (Version 3.1) (Topsham, ME, USA) on a BD LSRFortessa flow cytometer (BD, Franklin Lakes, NJ, USA).

2.8. Cell Differentiation Detection

Cell differentiation was detected in the present study using cell immunofluorescence and quantification of myogenic regulatory factors (MRFs).

2.8.1. Cell Immunofluorescence Staining

The detailed immunofluorescence staining procedure can be found in a previous study [37]. The main experimental steps were as follows:
(1)
Discard the cell culture medium; rinse 1–2 times with 1 × PBS on a destaining shaker; add 500 μL cell fixative to each well and incubate at room temperature for 15–30 min;
(2)
Discard the fixative and rinse with 1 × PBS destaining shaker 3–4 times, 5 min/time; add 500 μL of 0.5% Triton X-100 to each well, and incubate with destaining shaker for 20–30 min to enhance cell membrane permeability;
(3)
Discard the permeabilization solution and rinse with 1 × PBS decolorizing shaker 3–4 times, 5 min/time; add 500 μL of freshly prepared 10% goat serum working solution to each well, and incubate at 37 °C in the dark for 60 min;
(4)
Discard the blocking solution, add 300 μL of freshly prepared primary antibody working solution (MyHC, 1:200) to each well, and incubate overnight at 4 °C in the dark;
(5)
Discard the primary antibody working solution, and rinse with 1 × PBS decolorizing shaker 3–4 times, 5 min/time; add 300 μL of freshly prepared secondary antibody working solution (Goat Anti-Rabbit IgG (H + L)) to each well, 1:1000), incubate at 37 °C in the dark for 60 min;
(6)
Discard the secondary antibody working solution and rinse with 1 × PBS destaining shaker 3–4 times, 5 min/time;
(7)
Add 300 μL of DAPI working solution to each well, and incubate at room temperature in the dark for 3–5 min; rinse with 1 × PBS decolorizing shaker 3–4 times, 5 min each time, and immediately place it under an inverted fluorescence microscope to take pictures and observe.

2.8.2. MRF Quantification

Given that myogenesis is primarily controlled by MRFs, which include Myogenic Differentiation 1 (MYOD), Myogenic Factor 5 (MYF5), Myogenin (MYOG), and Myogenic factor 6 (MYF6, also referred to as MRF4), in the present investigation, all of these MRFs were measured using RT-qPCR according to the procedure outlined in Section 2.6. The primers used to quantify MRFs were adopted from a previous study [37].

2.9. Sequencing and Genotyping of Putative NCAPG Promoter Region

Five pairs of primers used to amplify putative NCAPG promoter region were designed using Primer Premier 5 [39] (Table 4). This region spans from the transcription start site to 2000 bp upstream of the transcription start site. Fifty individuals were mixed as a DNA pool with each genomic DNA 50 ng/μL. A total of 11 DNA pools were constructed. Then, PCR was conducted using DNA pools as templates. The detailed PCR protocol can be found in a previous study [37]. The PCR products were sequenced by Sanger sequencing on an ABI3730 (Tsingke Biotechnology Co., Ltd., Beijing, China). Sanger sequencing results were analyzed to find putative SNPs using Chromas software (Technelysium Pty Ltd., Helensville, Australia). Potential SNPs of each individual were genotyped using iMLDR (Genesky Biotechnologies Inc., Shanghai, China), which is an improved ligase-based multiplex SNP genotyping system. The detailed procedures can be found in a previous study [41]. The ability of SNPs to change the binding affinity of transcription factors to their binding sites was predicted using a web interface (https://azifi.tz.agrar.uni-goettingen.de/agreg-snpdb, accessed on 2 October 2023).

2.10. Statistical Analysis

The significance of RT-qPCR results was tested using a t-test (between two groups) or one-way analysis of variance (ANOVA, more than two groups) in SPSS 25.0 (SPSS, Inc., Chicago, IL, USA).
Population genetic parameters, including allele frequencies, minor allele frequency (MAF), expected heterozygosity (He), observed heterozygosity (Ho), polymorphic information content (PIC), and Hardy–Weinberg equilibrium statistic of all SNPs, were calculated using the snpReady R package [42]. The formulas to calculate these parameters are documented in the manual of snpReady [42].
Association analysis between SNPs and phenotypes was implemented by using SPSS 25.0 (SPSS, Inc., Chicago, IL, USA) to fit a linear model. The model was as follows:
Phe = µ + Gnt + Gnd + err
where Phe is the individual phenotype value, µ is the population mean value, Gnt is the genotype effect, Gnd is the gender effect, and err is the random error. Differences in mean phenotypes among the three genotypes were present in the least square mean value and were tested by using the LSD test. p < 0.05 denotes significance. p < 0.01 denotes high significance.

3. Results

3.1. NCAPG Was Highly Expressed in Embryonic Sheep Muscle

To investigate the temporal and cellular expression of NCAPG at different growth and development stages, the RT-qPCR method was used to detect its relative expression levels in the heart, liver, spleen, lungs, kidney, and longissimus dorsi tissues of 120-day-old fetal sheep, 5-day-old newborn lambs, and 6-month-old Suhu sheep. The results indicated that the abundance of NCAPG in the longissimus dorsi muscle, heart, lung, and kidney tissues of embryotic sheep was significantly higher than that in 5-day-old sheep and 6-month-old sheep (p < 0.05) (Figure 2A). In the embryotic sheep longissimus dorsi muscle, the average abundance of NCAPG was nearly 1300 times higher than that in 5-day-old sheep and 6-month-old sheep. Moreover, the extensive analysis of time-series detection at the cellular level indicated that NCAPG exhibited a progressively decreased expression pattern at various time points (p < 0.05) following the initiation of myoblast differentiation (Figure 2B). The findings reveal that the abundance of NCAPG could have a crucial impact on the growth and development of embryonic sheep muscle.

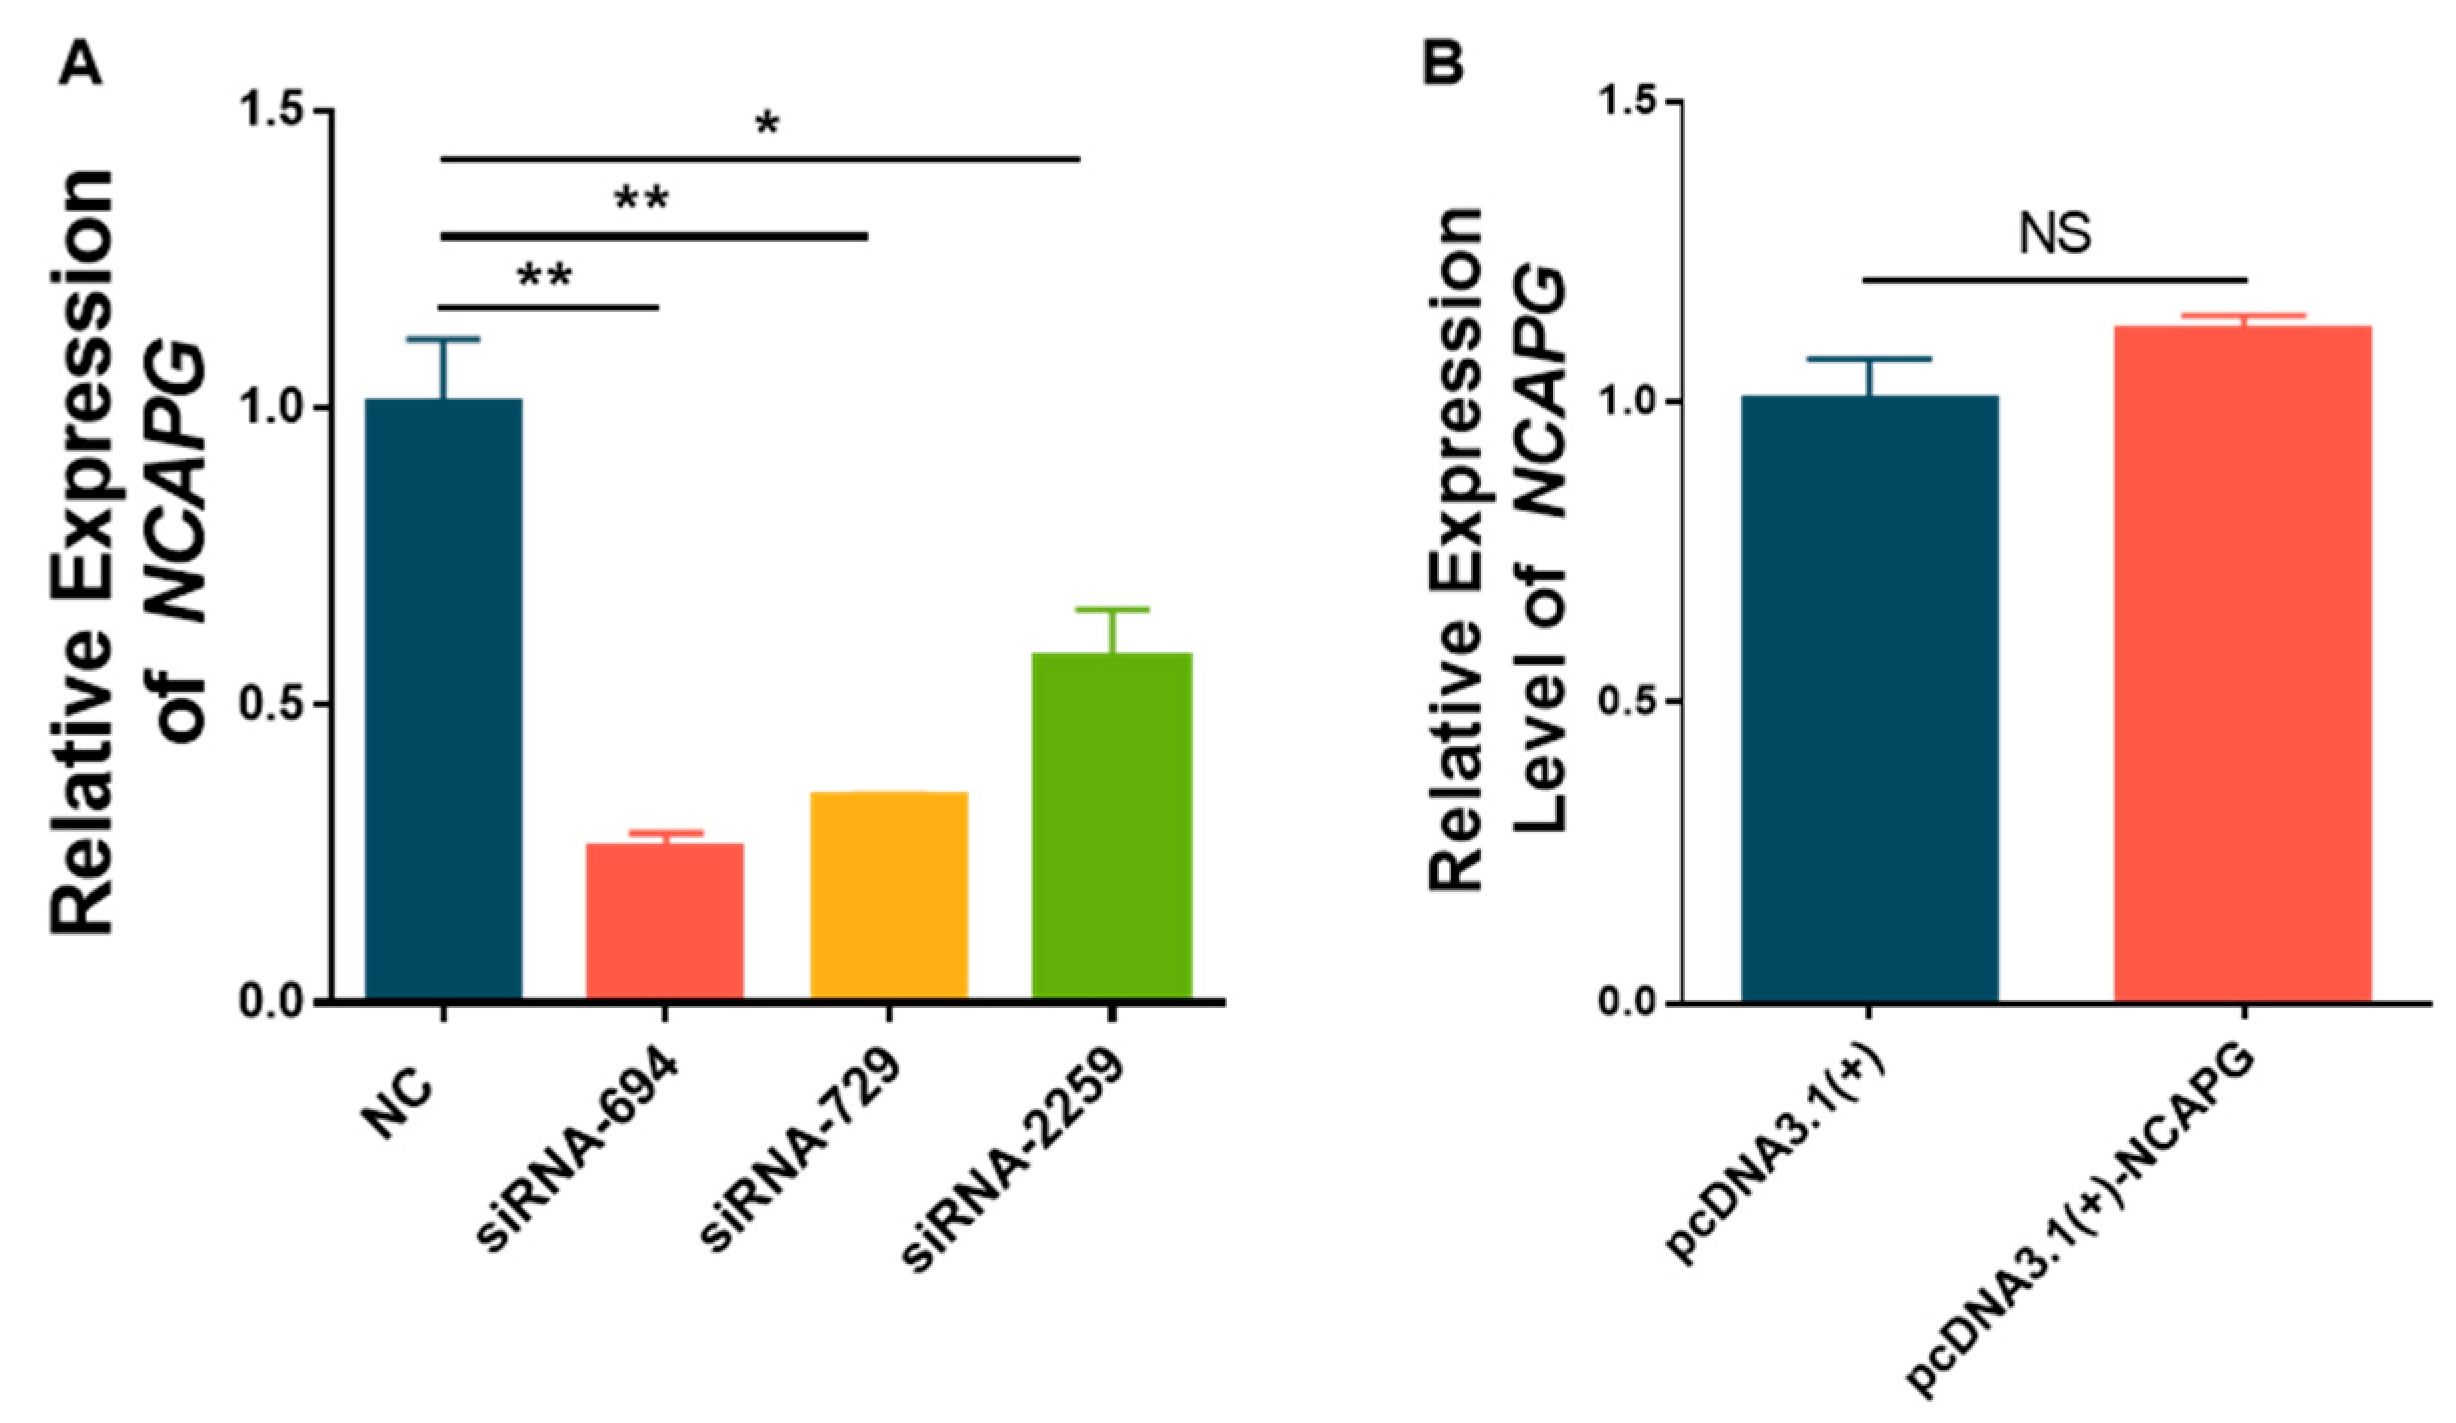
3.2. The Expression of NCAPG Was Reduced by siRNA Knockdown

To elucidate the regulating role of NCAPG in proliferation and differentiation in sheep embryonic myoblasts, small interfering RNA (siRNA) was synthesized and overexpression recombinant plasmids were constructed to change the abundance of NCAPG at the cellular level. Firstly, siRNA targeting NCAPG was transfected into fetal sheep myoblasts to detect the relative expression of NCAPG. The results showed that siRNA-694, siRNA729, and siRNA-2259 significantly reduced the relative expression level of NCAPG (p < 0.01) (Figure 3A), and the interference efficiency exceeded 70%, so siRNA-694, siRNA729, and siRNA-2259 could be used in subsequent experiments. Considering that the interference efficiency of siRNA-694 was higher than that of the other two siRNAs, siRNA-694 was used for further experiments. Then, the recombinant plasmid targeting NCAPG was transfected into fetal sheep myoblasts, and the results showed that the relative expression levels of NCAPG in the pcDNA3.1(+) and pcDNA3.1(+)-NCAPG groups were similar (Figure 3B). Thus, the subsequent functional verification experiment of NCAPG was implemented using RNA interference.

3.3. Interfering with NCAPG Inhibits the Proliferation of Sheep Fetal Myoblasts

To further investigate whether the abundance of NCAPG affects the proliferation of fetal sheep myoblasts, siRNA-694 was transfected into cells, followed by conducting EdU staining, the CCK-8 assay, and flow cytometry analysis to examine cell cycle distribution. The EdU staining findings indicated a notable decrease in the percentage of EdU-positive cells in the siRNA-694 treated group compared to the control group (p < 0.01) (Figure 4A,B). The CCK-8 method revealed a significant decrease (p < 0.01) in cell viability, as indicated by the reduced OD values (Figure 4C), after treatment with siRNA-694 for 48 h and 72 h, suggesting that interference with NCAPG weakened cell viability. The findings from the detection of the cell cycle indicated a significant decrease (p < 0.01) in the quantity of S-phase cells in the siRNA-694 treatment group compared to the control group (Figure 4D,F). This suggests that interference with NCAPG greatly impeded the cellular proliferation process.

3.4. Interfering with NCAPG Hinders the Differentiation of Sheep Fetal Myoblasts

To investigate whether interference with NCAPG also impacts the differentiation of fetal sheep myoblasts, siRNA-694 was transferred into myoblast cells. Interfering with NCAPG in induced-differentiation myoblasts on days 5–7 was found to markedly reduce the relative expression levels of MYOD1, MYOG, MYF5, and MRF4 (p < 0.05 or p < 0.01) (Figure 5A–D). The findings from MyHC indirect immunofluorescence analysis on the 7th day of differentiation induction (Figure 5E) indicate that the myoblast differentiation of the siRNA-694 treatment group was considerably suppressed compared to that of the control group. Moreover, there was a decrease in the number of fused myotubes, and a lower level of differentiation was observed in the siRNA-694 treatment group, suggesting that interference with NCAPG inhibits myoblast differentiation. Based on the above results, the expression changes of NCAPG can significantly affect the proliferation and differentiation of fetal sheep myoblasts.

3.5. Five SNPs in the Putative Promoter Region of NCAPG

Pooled Sanger sequencing was used to search for the potential SNPs in the NCAPG promoter region. The sequencing peak map showed that a total of five SNPs were detected in the 2000 bp of the NCAPG promoter region (Figure 6 and Table S1). After the quality assessment of the five SNPs by Genesky Biotechnologies Inc. (Shanghai, China), the genotyping results of the five SNPs were subjected to negative control quality control and repeated quality control. The results showed that the negative control had no signal. The results of repeated samples were consistent, indicating that the genotyping results were reliable. Finally, five SNPs were successfully genotyped (Table 5). The results suggest that three genotypes were detected at each SNP. All five SNPs deviate from Hardy–Weinberg equilibrium (p < 0.05). The polymorphic information content values of these five SNPs were 0.36, 0.36, 0.36, 0.36, and 0.33, respectively. All five SNPs have moderate polymorphism (Table 5). Further, the functional prediction of five SNPs suggests that SNP3, SNP4, and SNP5 may change the binding affinity of transcription factors to their binding sites (Table S1).

3.6. SNPs in NCAPG Promoter Region Associated with Sheep Growth and Developmental Traits

The associations between the five SNPs and four traits at four development stages were detected. SNP1, SNP2, SNP3, and SNP4 were significantly associated with all traits except body weight measured at birth and one month of age (Table 6 and Table S2). SNP5 was significantly (p < 0.05) associated with body weight, body height, and body length in six-month-old sheep. For SNP1, individuals carrying the AA genotype were characterized by the highest values of investigated traits. For SNP2, individuals carrying the TT genotype were characterized by the highest values of investigated traits. For SNP3, individuals carrying the CC genotype were characterized by the highest values of investigated traits. For SNP4, individuals carrying the TT genotype were characterized by the highest values of investigated traits. For SNP5, individuals carrying the AA genotype were characterized by the highest values of investigated traits.

4. Discussion

Several GWAS studies of sheep with a relatively large population size have found that NCAPG can be used as a candidate gene for sheep growth and development traits such as body weight and body size [4,7,8]. An expression quantitative trait loci (eQTL) study in sheep detected a very low expression level of NCAPG in the liver and muscle in a 7- to 8-month-old sheep population [43]. This suggests the expression level of NCAPG was tissue- or (and) time-specific. Thus, the NCAPT expression levels in six tissues and three development stages were analyzed, and it was found that NCAPG is highly expressed in embryotic sheep muscle (Figure 2A). This is consistent with the results in beef research where the expression level of NCAPG in the longissimus dorsi muscle tissue of 135-day-old fetal muscle was significantly higher than the relative expression level of NCAPG in adult muscle [25]. Further, the time-series detection analysis of abundance at the cellular level revealed that NCAPG showed a gradually downregulated expression pattern at different time points after the induction of myoblast differentiation (Figure 2B). The protein level of NCAPG found in cattle research [28] showed a similar expression pattern to our result. All these pieces of evidence suggest that NCAPG plays different roles in the different stages of the muscle cell development process.
Cell proliferation occurs as a result of the combination of cell growth with regular “G1-S-M-G2” cell cycles to produce many diploid cell progeny. RNA interference at the cellular level was implemented to investigate the role of NCAPG in myoblast proliferation. In the current study, the results suggest that knocking down NCAPG expression could inhibit cell proliferation (Figure 4). This is consistent with the result in cattle research where NCAPG knockdown prolonged the procession of myoblast mitosis [28]. In human research, NCAPG could promote the proliferation of many types of cells, such as hepatocellular carcinoma cells [44,45], colorectal cancer cells [46], and pulmonary artery smooth muscle cells [47]. All these pieces of evidence suggest that NCAPG could increase proliferation in various types of cells. Previous research suggests that NCAPG as a mitosis-associated chromosomal condensation protein plays an important role in the appropriate separation of sister chromatids [48]. In the current study, the number of cells in the S phase was significantly increased and the number of cells in the M phase was increased (not significantly) when NCAPG was inhibited (Figure 4). In cattle, NCAPG inhibition prolonged the prometaphase and metaphase of proliferating myoblasts [28]. Considering the function conservation of NCAPG in growth and development traits across mammals [26], we confidently speculate that NCAPG regulates proliferation through prometaphase and metaphase. All these pieces of evidence suggest that NCAPG could increase differentiation in various types of cells.
Differentiation is different from proliferation [37,38]. In the current study, two pieces of evidence support the inhibition of NCAPG inhibiting myogenic differentiation in myoblasts (Figure 5). A human cancer meta-analysis suggests that NCAPG has a relationship with cell differentiation [49]. In cattle, NCAPG inhibited myogenic differentiation in myoblasts [28]. All these pieces of evidence suggest that NCAPG could increase proliferation in various types of cells. Previous studies suggest that chromatin accessibility could regulate embryonic muscle development in pigs [50] and cattle [51]. In cattle research, it was found that NCAPG may adjust chromatin accessibility [28]. Thus, we speculate that NCAPG regulates myogenic differentiation by regulating chromatin accessibility.
Screening for SNPs in the putative promoter region of functional genes is an effective way to identify useful genetic markers for animal breeding. In this study, all identified SNPs in the promoter region of NCAPG were associated with at least one growth and development trait (Table 6 and Table S2). Consistent with the results in sheep research, a number of effects of SNPs located in the promoter regions on growth [35,52], carcass [34,53], meat quality [34,53], and reproductive traits [54,55] were reported. Our finding is also consistent with the results from other livestock species showing that SNPs found in the promoter region are significantly associated with economically important traits [56,57,58,59]. SNPs in the promoter region may influence promoter activity, transcription factor binding, DNA methylation, and histone modifications [60]. For example, an SNP in the NR5A2 promoter region could regulate litter size in Hu sheep by increasing the promoter activity [55]. Similar research has reported that a novel SNP in the IGF1 promoter region could regulate the litter size of Yunshang black goats by increasing transcription-promoting activity [59]. Thus, these five SNPs may regulate the expression of NCAPG and influence sheep growth and development by adjusting the activity of the promoter.

5. Conclusions

In summary, the results of the current study have revealed that interfering with NCAPG inhibits the proliferation of sheep fetal myoblasts and differentiation. Five SNPs in the promoter region of NCAPG were significantly associated with sheep growth and development traits. Considering the functional prediction of SNPs and the p-value of association analyses, SNP3 might be the most important mutation for selecting sheep growth and development traits. These results could provide direct evidence of NCAPG regulating the proliferation and differentiation of embryonic myoblasts and provide useful genetic markers to increase the efficacy of the selection of sheep growth and development traits.

Supplementary Materials

The following supporting information can be downloaded at: https://www.mdpi.com/article/10.3390/ani13203173/s1, Table S1: Summarized information and functional prediction of five detected mutations; Table S2: Association analysis between SNPs in NCAPG promoter region and growth and development traits.

Author Contributions

Conceptualization, W.S., Z.Y., L.G., T.G., J.M.M. and A.H.; methodology, L.G., Z.Y., P.S., Y.G., W.C., X.C., S.W., X.L., T.G., J.M.M., A.H. and W.S.; software, L.G., Z.Y., P.S., Y.G., W.C., X.C., S.W. and X.L.; validation, Z.Y., L.G. and P.S.; formal analysis, L.G., Z.Y. and P.S.; investigation, L.G., Z.Y., P.S., Y.G., W.C., X.C., S.W. and X.L.; resources, T.G., J.M.M., A.H. and W.S.; data curation, Z.Y., L.G., P.S., Y.G., W.C., X.C., S.W. and X.L.; writing—original draft preparation, Z.Y.; writing—review and editing, L.G., W.S., X.C., S.W. and X.L.; visualization, L.G. and Z.Y.; supervision, W.S., T.G., J.M.M. and A.H.; project administration, W.S., T.G., J.M.M. and A.H.; funding acquisition, W.S. All authors have read and agreed to the published version of the manuscript.

Funding

This work was supported by the National Natural Science Foundation of China (31872333, 32172689, 32202624); National Natural Science Foundation of China-CGIAR (32061143036); Natural Science Foundation of Jiangsu Province (BK20210811); Major New Varieties of Agricultural Projects in Jiangsu Province (PZCZ201739); Natural Science Foundation of the Jiangsu Higher Education Institutions of China (22KJA230001); Major Project of Natural Science Foundation of Xinjiang Uyghur Autonomous Region (2022D01D47); Jiangsu 333 Distinguished Talents Project Foundation ((2022) 2-323); Jiangsu Agricultural Science and Technology Innovation Fund (CX (23)1036); Distinguished Talents Project Foundation of Yangzhou University, High-end Foreign Expert Introduction Project (G2022014148L); and Open Project Program of Joint International Research Laboratory of Agriculture and Agri-Product Safety, the Ministry of Education of China, Yangzhou University (JILAR-KF202206).

Institutional Review Board Statement

The animal study protocol was approved by the Experimental Animal Ethical Committee of Yangzhou University’s (approval number 202103279, approval date 8 March 2021).

Informed Consent Statement

Not applicable.

Data Availability Statement

No new data were created or analyzed in this study.

Conflicts of Interest

The authors declare no conflict of interest.

References

  1. Meuwissen, T.; Hayes, B.; Goddard, M. Genomic selection: A paradigm shift in animal breeding. Anim. Front. 2016, 6, 6–14. [Google Scholar] [CrossRef]
  2. Ducrocq, V.; Laloe, D.; Swaminathan, M.; Rognon, X.; Tixier-Boichard, M.; Zerjal, T. Genomics for Ruminants in Developing Countries: From Principles to Practice. Front. Genet. 2018, 9, 251. [Google Scholar] [CrossRef] [PubMed]
  3. Zhang, L.; Liu, J.; Zhao, F.; Ren, H.; Xu, L.; Lu, J.; Zhang, S.; Zhang, X.; Wei, C.; Lu, G.; et al. Genome-Wide Association Studies for Growth and Meat Production Traits in Sheep. PLoS ONE 2013, 8, e66569. [Google Scholar] [CrossRef] [PubMed]
  4. Al-Mamun, H.A.; Kwan, P.; Clark, S.A.; Ferdosi, M.H.; Tellam, R.; Gondro, C. Genome-wide association study of body weight in Australian Merino sheep reveals an orthologous region on OAR6 to human and bovine genomic regions affecting height and weight. Genet. Sel. Evol. 2015, 47, 66. [Google Scholar] [CrossRef] [PubMed]
  5. Gholizadeh, M.; Rahimi-Mianji, G.; Nejati-Javaremi, A. Genomewide association study of body weight traits in Baluchi sheep. J. Genet. 2015, 94, 143–146. [Google Scholar] [CrossRef] [PubMed]
  6. Bolormaa, S.; Hayes, B.J.; van der Werf, J.H.J.; Pethick, D.; Goddard, M.E.; Daetwyler, H.D. Detailed phenotyping identifies genes with pleiotropic effects on body composition. BMC Genom. 2016, 17, 224. [Google Scholar] [CrossRef] [PubMed]
  7. Matika, O.; Riggio, V.; Anselme-Moizan, M.; Law, A.S.; Pong-Wong, R.; Archibald, A.L.; Bishop, S.C. Genome-wide association reveals QTL for growth, bone and in vivo carcass traits as assessed by computed tomography in Scottish Blackface lambs. Genet. Sel. Evol. 2016, 48, 11. [Google Scholar] [CrossRef]
  8. Kominakis, A.; Hager-Theodorides, A.L.; Zoidis, E.; Saridaki, A.; Antonakos, G.; Tsiamis, G. Combined GWAS and ‘guilt by association’-based prioritization analysis identifies functional candidate genes for body size in sheep. Genet. Sel. Evol. 2017, 49, 41. [Google Scholar] [CrossRef]
  9. Ghasemi, M.; Zamani, P.; Vatankhah, M.; Abdoli, R. Genome-wide association study of birth weight in sheep. Animal 2019, 13, 1797–1803. [Google Scholar] [CrossRef]
  10. Almasi, M.; Zamani, P.; Mirhoseini, S.Z.; Moradi, M.H. Genome-Wide Association Study of Weaning Traits in Lori-Bakhtiari Sheep. Ann. Anim. Sci. 2020, 20, 811–824. [Google Scholar] [CrossRef]
  11. Cao, Y.; Song, X.; Shan, H.; Jiang, J.; Xiong, P.; Wu, J.; Shi, F.; Jiang, Y. Genome-Wide Association Study of Body Weights in Hu Sheep and Population Verification of Related Single-Nucleotide Polymorphisms. Front. Genet. 2020, 11, 588. [Google Scholar] [CrossRef] [PubMed]
  12. Lu, Z.; Yue, Y.; Yuan, C.; Liu, J.; Chen, Z.; Niu, C.; Sun, X.; Zhu, S.; Zhao, H.; Guo, T.; et al. Genome-Wide Association Study of Body Weight Traits in Chinese Fine-Wool Sheep. Animals 2020, 10, 170. [Google Scholar] [CrossRef] [PubMed]
  13. Pasandideh, M.; Gholizadeh, M.; Rahimi-Mianji, G. Identification of two novel SNPs affecting lambing traits in sheep by using a 50K SNP-Chip. Small Rumin. Res. 2020, 191, 106193. [Google Scholar] [CrossRef]
  14. Pasandideh, M.; Gholizadeh, M.; Rahimiimianji, G. A genome-wide association study revealed five SNPs affecting 8-month weight in sheep. Anim. Genet. 2020, 51, 973–976. [Google Scholar] [CrossRef] [PubMed]
  15. Tao, L.; He, X.Y.; Pan, L.X.; Wang, J.W.; Gan, S.Q.; Chu, M.X.; Genomeiimianji, G. Genome-wide association study of body weight and conformation traits in neonatal sheep. Anim. Genet. 2020, 51, 336–340. [Google Scholar] [CrossRef] [PubMed]
  16. Almasi, M.; Zamani, P.; Mirhoseini, S.Z.; Moradi, M.H. Genome-wide association study for postweaning weight traits in Lori-Bakhtiari sheep. Trop. Anim. Health Prod. 2021, 53, 163. [Google Scholar] [CrossRef]
  17. Jiang, J.; Cao, Y.; Shan, H.; Wu, J.; Song, X.; Jiang, Y. The GWAS Analysis of Body Size and Population Verification of Related SNPs in Hu Sheep. Front. Genet. 2021, 12, 642552. [Google Scholar] [CrossRef]
  18. Krivoruchko, A.; Yatsyk, O.; Kanibolockaya, A.; Kulintsev, V. Genome-wide association study (GWAS) of high productivity classes in the Karachaevsky sheep breed. J. Cent. Eur. Agric. 2021, 22, 669–677. [Google Scholar] [CrossRef]
  19. McLaren, A.; Kaseja, K.; McLean, K.A.; Boon, S.; Lambe, N.R. Genetic analyses of novel traits derived from CT scanning for implementation in terminal sire sheep breeding programmes. Livest. Sci. 2021, 250, 104555. [Google Scholar] [CrossRef]
  20. Tao, L.; Liu, Y.F.; Zhang, H.; Li, H.Z.; Zhao, F.P.; Wang, F.Y.; Zhang, R.S.; Di, R.; Chu, M.X. Genomeomem CT scanning for implementation in terminal sirn body size traits in Qira black sheep (Ovis aries). Anim. Genet. 2021, 52, 560–564. [Google Scholar] [CrossRef]
  21. Yilmaz, O.; Kizilaslan, M.; Arzik, Y.; Behrem, S.; Ata, N.; Karaca, O.; Elmaci, C.; Cemal, I. Genomeomemem CT scanning for implementation ingrowth and in vivo carcass composition traits in Esme sheep. J. Anim. Breed. Genet. 2021, 139, 26–39. [Google Scholar] [CrossRef]
  22. Kizilaslan, M.; Arzik, Y.; White, S.N.; Piel, L.M.W.; Cinar, M.U. Genetic Parameters and Genomic Regions Underlying Growth and Linear Type Traits in Akkaraman Sheep. Genes 2022, 13, 1414. [Google Scholar] [CrossRef] [PubMed]
  23. Krivoruchko, A.; Likhovid, A.; Kanibolotskaya, A.; Saprikina, T.; Safaryan, E.; Yatsyk, O. Genome-Wide Search for Associations with Meat Production Parameters in Karachaevsky Sheep Breed Using the Illumina BeadChip 600 K. Genes 2023, 14, 1288. [Google Scholar] [CrossRef] [PubMed]
  24. Tuersuntuoheti, M.; Zhang, J.; Zhou, W.; Zhang, C.-L.; Liu, C.; Chang, Q.; Liu, S. Exploring the growth trait molecular markers in two sheep breeds based on Genome-wide association analysis. PLoS ONE 2023, 18, e0283383. [Google Scholar] [CrossRef] [PubMed]
  25. Zhang, W.; Li, J.; Guo, Y.; Zhang, L.; Xu, L.; Gao, X.; Zhu, B.; Gao, H.; Ni, H.; Chen, Y. Multi-strategy genome-wide association studies identify the DCAF16-NCAPG region as a susceptibility locus for average daily gain in cattle. Sci. Rep. 2016, 6, 38073. [Google Scholar] [CrossRef] [PubMed]
  26. Bouwman, A.C.; Daetwyler, H.D.; Chamberlain, A.J.; Ponce, C.H.; Sargolzaei, M.; Schenkel, F.S.; Sahana, G.; Govignon-Gion, A.; Boitard, S.; Dolezal, M.; et al. Meta-analysis of genome-wide association studies for cattle stature identifies common genes that regulate body size in mammals. Nat. Genet. 2018, 50, 362–367. [Google Scholar] [CrossRef] [PubMed]
  27. Liu, Y.; Duan, X.; Chen, S.; He, H.; Liu, X. NCAPG is differentially expressed during longissimus muscle development and is associated with growth traits in Chinese Qinchuan beef cattle. Genet. Mol. Biol. 2015, 38, 450–456. [Google Scholar] [CrossRef]
  28. Hu, X.; Xing, Y.; Fu, X.; Yang, Q.; Ren, L.; Wang, Y.; Li, Q.; Li, J.; Zhang, L. NCAPG Dynamically Coordinates the Myogenesis of Fetal Bovine Tissue by Adjusting Chromatin Accessibility. Int. J. Mol. Sci. 2020, 21, 1248. [Google Scholar] [CrossRef]
  29. Rehfeldt, C.; Kuhn, G. Consequences of birth weight for postnatal growth performance and carcass quality in pigs as related to myogenesis1. J. Anim. Sci. 2006, 84, E113–E123. [Google Scholar] [CrossRef]
  30. Du, M.; Tong, J.; Zhao, J.; Underwood, K.R.; Zhu, M.; Ford, S.P.; Nathanielsz, P.W. Fetal programming of skeletal muscle development in ruminant animals1. J. Anim. Sci. 2010, 88, E51–E60. [Google Scholar] [CrossRef]
  31. Du, M.; Zhao, J.X.; Yan, X.; Huang, Y.; Nicodemus, L.V.; Yue, W.; McCormick, R.J.; Zhu, M.J. Fetal muscle development, mesenchymal multipotent cell differentiation, and associated signaling pathways. J. Anim. Sci. 2011, 89, 583–590. [Google Scholar] [CrossRef] [PubMed]
  32. Buckingham, M.; Bajard, L.; Chang, T.; Daubas, P.; Hadchouel, J.; Meilhac, S.; Montarras, D.; Rocancourt, D.; Relaix, F. The formation of skeletal muscle: From somite to limb. J. Anat. 2003, 202, 59–68. [Google Scholar] [CrossRef] [PubMed]
  33. Du, M.; Wang, B.; Fu, X.; Yang, Q.; Zhu, M.-J. Fetal programming in meat production. Meat Sci. 2015, 109, 40–47. [Google Scholar] [CrossRef] [PubMed]
  34. Wang, J.; Zhou, H.; Hu, J.; Li, S.; Luo, Y.; Hickford, J.G.H. Two single nucleotide polymorphisms in the promoter of the ovine myostatin gene (MSTN) and their effect on growth and carcass muscle traits in New Zealand Romney sheep. J. Anim. Breed. Genet. 2016, 133, 219–226. [Google Scholar] [CrossRef] [PubMed]
  35. Shishay, G.; Liu, G.; Jiang, X.; Yu, Y.; Teketay, W.; Du, D.; Jing, H.; Liu, C. Variation in the Promoter Region of the MC4R Gene Elucidates the Association of Body Measurement Traits in Hu Sheep. Int. J. Mol. Sci. 2019, 20, 240. [Google Scholar] [CrossRef]
  36. Maylinda, S.; Busono, W. The accuracy of body weight estimation in Fat Tailed Sheep based on linear body measurements and tail circumference. J. Ilmu-Ilmu Peternak. 2019, 29, 193–199. [Google Scholar] [CrossRef]
  37. Ge, L.; Su, P.; Wang, S.; Gu, Y.; Cao, X.; Lv, X.; Wang, S.; Getachew, T.; Mwacharo, J.M.; Haile, A.; et al. New Insight into the Role of the Leucine Aminopeptidase 3 (LAP3) in Cell Proliferation and Myogenic Differentiation in Sheep Embryonic Myoblasts. Genes 2022, 13, 1438. [Google Scholar] [CrossRef]
  38. Han, Y.; Guo, W.; Su, R.; Zhang, Y.; Yang, L.; Borjigin, G.; Duan, Y. Effects of sheep slaughter age on myogenic characteristics in skeletal muscle satellite cells. Anim. Biosci. 2022, 35, 614–623. [Google Scholar] [CrossRef]
  39. Lalitha, S. Primer Premier 5. Biotech Softw. Internet Rep. 2000, 1, 270–272. [Google Scholar] [CrossRef]
  40. Livak, K.J.; Schmittgen, T.D. Analysis of Relative Gene Expression Data Using Real-Time Quantitative PCR and the 2−ΔΔCT Method. Methods 2001, 25, 402–408. [Google Scholar] [CrossRef]
  41. Al-Aama, J.Y.; Liu, Y.; Hu, C.; Liu, C.; Liu, D.; Mei, L.; He, C.; Jiang, L.; Wu, H.; Chen, H.; et al. A rapid improved multiplex ligation detection reaction method for the identification of gene mutations in hereditary hearing loss. PLoS ONE 2019, 14, e0215212. [Google Scholar] [CrossRef]
  42. Granato, I.S.C.; Galli, G.; de Oliveira Couto, E.G.; e Souza, M.B.; Mendonça, L.F.; Fritsche-Neto, R. snpReady: A tool to assist breeders in genomic analysis. Mol. Breed. 2018, 38, 102. [Google Scholar] [CrossRef]
  43. Yuan, Z.; Sunduimijid, B.; Xiang, R.; Behrendt, R.; Knight, M.I.; Mason, B.A.; Reich, C.M.; Prowse-Wilkins, C.; Vander Jagt, C.J.; Chamberlain, A.J.; et al. Expression quantitative trait loci in sheep liver and muscle contribute to variations in meat traits. Genet. Sel. Evol. 2021, 53, 8. [Google Scholar] [CrossRef]
  44. Liu, K.; Li, Y.; Yu, B.; Wang, F.; Mi, T.; Zhao, Y. Silencing non-SMC chromosome-associated polypeptide G inhibits proliferation and induces apoptosis in hepatocellular carcinoma cells. Can. J. Physiol. Pharmacol. 2018, 96, 1246–1254. [Google Scholar] [CrossRef] [PubMed]
  45. Zhang, R.; Ai, J.; Wang, J.; Sun, C.; Lu, H.; He, A.; Li, M.; Liao, Y.; Lei, J.; Zhou, F.; et al. NCAPG promotes the proliferation of hepatocellular carcinoma through the CKII-dependent regulation of PTEN. J. Transl. Med. 2022, 20, 325. [Google Scholar] [CrossRef] [PubMed]
  46. Shi, Y.; Ge, C.; Fang, D.; Wei, W.; Li, L.; Wei, Q.; Yu, H. NCAPG facilitates colorectal cancer cell proliferation, migration, invasion and epithelial–mesenchymal transition by activating the Wnt/β-catenin signaling pathway. Cancer Cell Int. 2022, 22, 119. [Google Scholar] [CrossRef] [PubMed]
  47. Fu, B.; Li, Y.; Shi, X.; Liu, P.; Zhang, Y.; Tian, H. NCAPG Promotes Pulmonary Artery Smooth Muscle Cell Proliferation as a Promising Therapeutic Target of Idiopathic Pulmonary Hypertension: Bioinformatics Analysis and Experiment Verification. Int. J. Mol. Sci. 2022, 23, 11762. [Google Scholar] [CrossRef]
  48. Pang, D.; Yu, S.; Yang, X. A mini-review of the role of condensin in human nervous system diseases. Front. Mol. Neurosci. 2022, 15, 889796. [Google Scholar] [CrossRef]
  49. Lin, J.; Li, G.; Bai, Y.; Xie, Y. NCAPG as a novel prognostic biomarker in numerous cancers: A meta-analysis and bioinformatics analysis. Aging 2023, 15, 2503–2524. [Google Scholar] [CrossRef]
  50. Yue, J.; Hou, X.; Liu, X.; Wang, L.; Gao, H.; Zhao, F.; Shi, L.; Shi, L.; Yan, H.; Deng, T.; et al. The landscape of chromatin accessibility in skeletal muscle during embryonic development in pigs. J. Anim. Sci. Biotechnol. 2021, 12, 56. [Google Scholar] [CrossRef]
  51. Li, Q.; Wang, Y.; Hu, X.; Zhang, Y.; Li, H.; Zhang, Q.; Cai, W.; Wang, Z.; Zhu, B.; Xu, L.; et al. Transcriptional states and chromatin accessibility during bovine myoblasts proliferation and myogenic differentiation. Cell Prolif. 2022, 55, e13219. [Google Scholar] [CrossRef] [PubMed]
  52. Gan, S.; Du, Z.; Liu, S.; Yang, Y.; Shen, M.; Wang, X.; Yin, J.; Hu, X.; Fei, J.; Fan, J.J.; et al. Association of SNP haplotypes at the myostatin gene with muscular hypertrophy in sheep. Asian-Australas. J. Anim. Sci. 2008, 21, 928–935. [Google Scholar] [CrossRef]
  53. Kijas, J.W.; McCulloch, R.; Edwards, J.E.H.; Oddy, V.H.; Lee, S.H.; van der Werf, J. Evidence for multiple alleles effecting muscling and fatness at the Ovine GDF8 locus. BMC Genet. 2007, 8, 80. [Google Scholar] [CrossRef] [PubMed]
  54. Wang, Y.; Chi, Z.; Jia, S.; Zhao, S.; Cao, G.; Purev, C.; Cang, M.; Yu, H.; Li, X.; Bao, S.J.T. Effects of novel variants in BMP15 gene on litter size in Mongolia and Ujimqin sheep breeds. Theriogenology 2023, 198, 1–11. [Google Scholar] [CrossRef]
  55. Li, Y.; Zhang, J.; Qian, Y.; Meng, C.; Wang, H.; Zhong, J.; Cao, S. A T > G Mutation in the NR5A2 Gene Is Associated with Litter Size in Hu Sheep through Upregulation of Promoter Activity by Transcription Factor MTF-1. Front. Genet. 2019, 10, 1011. [Google Scholar] [CrossRef] [PubMed]
  56. Nkrumah, J.D.; Li, C.; Yu, J.; Hansen, C.; Keisler, D.H.; Moore, S.S. Polymorphisms in the bovine leptin promoter associated with serum leptin concentration, growth, feed intake, feeding behavior, and measures of carcass merit. J. Anim. Sci. 2005, 83, 20–28. [Google Scholar] [CrossRef]
  57. Wu, S.; Wang, Y.; Ning, Y.; Guo, H.; Wang, X.; Zhang, L.; Khan, R.; Cheng, G.; Wang, H.; Zan, L. Genetic Variants in STAT3 Promoter Regions and Their Application in Molecular Breeding for Body Size Traits in Qinchuan Cattle. Int. J. Mol. Sci. 2018, 19, 1035. [Google Scholar] [CrossRef]
  58. Guo, H.; Raza, S.H.A.; Schreurs, N.M.; Khan, R.; Wei, D.; Wang, L.; Zhang, S.; Zhang, L.; Wu, S.; Ullah, I.; et al. Genetic variants in the promoter region of the KLF3 gene associated with fat deposition in Qinchuan cattle. Gene 2018, 672, 50–55. [Google Scholar] [CrossRef]
  59. Li, K.; Liu, Y.; He, X.; Tao, L.; Jiang, Y.; Lan, R.; Hong, Q.; Chu, M. A Novel SNP in the Promoter Region of IGF1 Associated with Yunshang Black Goat Kidding Number via Promoting Transcription Activity by SP1. Front. Cell Dev. Biol. 2022, 10, 873095. [Google Scholar] [CrossRef]
  60. Deng, N.; Zhou, H.; Fan, H.; Yuan, Y. Single nucleotide polymorphisms and cancer susceptibility. Oncotarget 2017, 8, 110635–110649. [Google Scholar] [CrossRef]
Figure 1. Suhu meat sheep. (A) Male; (B) female; (C) population.
Animals 13 03173 g001
Figure 2. The expression of NCAPG was quantified in six different tissues during three growth stages, as well as in fetal sheep myoblasts across four stages of differentiation. (A) The relative expression levels of NCAPG were detected in six tissues of 120-day-old fetal sheep, 5-day-old newborn lambs, and 6-month-old sheep using RT-qPCR. (B) The relative expression levels of NCAPG were detected in fetal sheep myoblasts at proliferation (P) and on the 1st, 3rd, 5th, and 7th days (D1, D3, D5, and D7) of differentiation. Mean values with different letters denote significance (p < 0.05).
Animals 13 03173 g002
Figure 3. Validation of the efficiency of siRNA and recombinant plasmid targeting NCAPG. (A) The efficiency of siRNA targeting NCAPG was detected in fetal sheep myoblasts by RT-qPCR. (B) The efficiency of pcDNA3.1(+)-NCAPG targeting NCAPG was detected in fetal sheep myoblasts by RT-qPCR. * p < 0.05, ** p < 0.01, NS p > 0.05.
Animals 13 03173 g003
Figure 4. Functional validation of the effect of NCAPG interference on the proliferation of fetal sheep myoblasts. (A) Results of EdU staining of fetal sheep myoblasts transfected with siRNA-694 (100×). (B) Proliferation rate of fetal sheep myoblasts transfected with siRNA-694. (C) The OD values of fetal sheep myoblasts transfected with siRNA-694 at 0 h, 24 h, 48 h, and 72 h were detected by CCK-8. (D) The distribution of fetal sheep myoblasts transfected with a negative control at different stages was detected by flow cytometry. (E) The distribution of fetal sheep myoblasts transfected with siRNA-694 at different stages was detected by flow cytometry. (F) Proportion of the number of fetal sheep myoblasts transfected with siRNA-694 at different stages of the cell cycle. ** p < 0.01, *** p < 0.001, NS p > 0.05, n = 6 biological replicates.
Animals 13 03173 g004
Figure 5. Functional analysis of the effect of NCAPG interference on differentiation of fetal sheep myoblasts. A-D: The relative expression levels of four MRFs detected in fetal sheep myoblasts after siRNA-694 treatment on the 1st (A), 3rd (B), 5th (C), and 7th (D) days (D1, D3, D5, and D7) of differentiation. (E) MyHC immunofluorescence staining was observed in fetal sheep myoblasts transfected with siRNA-694 using a fluorescence inverted microscope (100×). * p < 0.05, ** p < 0.01, NS p > 0.05, n = 3 biological replicates.
Animals 13 03173 g005
Figure 6. Potential SNPs in the promoter region of NCAPG.
Animals 13 03173 g006
Table 1. Primers used in plasmid construction.
Primer NameSequence (5′-3′)Product Length
NCAPG-FGggagaccc1aagct2ggctagcATGGGGAAGGAGAAGAGACTGC3054 bp
NCAPG-RagtggatccgagctcggtaccCTAACTTGTATCTTCATTGAGAAATTGTG
1 The lowercase letters at the 5′-end of the primer sequence indicate the 15 bp sequence at the end of the linearized pcDNA3.1(+) vector. 2 The lowercase underlined letters indicate the restriction sites, and the uppercase letters indicate the insertion fragment sequences.
Table 2. Sequence information for small interfering RNAs (siRNAs) targeting ovine NCAPG and negative control (NC).
NamePrimer NameSequence (5′-3′)
NCAPGsiRNA-694F: GCGCCAUCAGCAAAGACUUTT
R: AAGUCUUUGCUGAUGGCGCTT
siRNA-729F:GCGCACCAAGGAUGUGAAATT
R: UUUCACAUCCUUGGUGCGCTT
siRNA-2259F:GGUCAGCAGCAGGAUUCUUTT
R:AAGAAUCCUGCUGCUGACCTT
NCF:UUCUCCGAACGUGUCACGUTT
R:ACGUGACACGUUCGGAGAATT
Table 3. Specific primers used for RT-qPCR.
NamePrimer NameSequence (5′-3′)GenBank Accession
NCAPGNCAPG-FAGAGACTGCTGCCGATTAAGGXM_027970895.2
NCAPG-RACCTGTTTTGTCATCCACCGAG
GAPDHGAPDH-FTCTCAAGGGCATTCTAGGCTACNM_001190390.1
GAPDH-RGCCGAATTCATTGTCGTACCAG
Table 4. Specific primers used to amplify the promoter regions.
Primer NameSequence (5′-3′)Amplified RegionProduct Length
NCAPG-FCAAGCATATTTCATGTACTCTTAAR1880 bp
NCAPG-RTATTGTTTTCATGTTCTAAGGTTAT
NCAPG-FAGTTATGGGAAAAAGCAGCTTCCR2360 bp
NCAPG-RTGTTTTCAACAAAGGAGAACACAGA
NCAPG-FGGCTGTAATTATGGAGATGTTGATTR3480 bp
NCAPG-RTCTAATTACTTAAACCTCTCCCCAC
NCAPG-FCAGACTCTTCACCAGCAATTTCACTR4370 bp
NCAPG-RAGTGAGTACCCTGTGGAGATTCG
NCAPG-FAGTCCCTGTTCTCACCCATGGR5435 bp
NCAPG-RACGAAGCCTGTTCACGTTCG
Table 5. Population genetic parameters and Hardy–Weinberg equilibrium test of SNPs.
SNPMAF 1He 2Ho 3PIC 4Chisq Valuep 5
SNP10.390.480.590.3629.3576.02 × 108
SNP20.380.470.570.3623.9151.01 × 106
SNP30.390.470.580.3624.5627.20 × 107
SNP40.380.470.570.3623.9151.01 × 106
SNP50.290.420.480.3312.2564.64 × 104
1 MAF: minor allele frequency; 2 He: expected heterozygosity; 3 Ho: observed heterozygosity; 4 PIC: polymorphic information content; 5 p value of Hardy–Weinberg equilibrium test.
Table 6. Overall p values of association analysis between SNPs and phenotypes.
AgeTraitsSNP1SNP2SNP3SNP4SNP5
BirthBody weight0.3290.3500.3710.3500.365
Body height0.0050.0050.0050.0050.646
Body length0.0380.0380.0390.0380.498
Shin circumference0.0180.0190.0200.0190.540
One monthBody weight0.3060.3100.3080.3100.296
Body height0.0040.0040.0050.0040.598
Body length0.0110.0110.0120.0110.547
Shin circumference0.0080.0090.0100.0090.533
Two monthsBody weight0.0200.0250.0250.0250.947
Body height0.0040.0040.0040.0040.985
Body length0.0040.0050.0050.0050.984
Shin circumference0.0060.0060.0070.0060.898
Three monthsBody weight0.0100.0130.0140.0130.853
Body height0.0020.0020.0020.0020.802
Body length0.0010.0020.0020.0020.895
Shin circumference0.0070.0090.0090.0090.637
Six monthsBody weight0.0070.0150.0160.0150.041
Body height0.0010.0020.0020.0020.014
Body length0.0010.0030.0030.0030.032
Shin circumference0.0010.0030.0030.0030.056
Disclaimer/Publisher’s Note: The statements, opinions and data contained in all publications are solely those of the individual author(s) and contributor(s) and not of MDPI and/or the editor(s). MDPI and/or the editor(s) disclaim responsibility for any injury to people or property resulting from any ideas, methods, instructions or products referred to in the content.

