Article

Genomic Selection for Live Weight in the 14th Month in Alpine Merino Sheep Combining GWAS Information

1
Key Laboratory of Animal Genetics and Breeding on Tibetan Plateau, Ministry of Agriculture and Rural Affairs, Lanzhou Institute of Husbandry and Pharmaceutical Sciences, Chinese Academy of Agricultural Sciences, Lanzhou 730050, China
2
Sheep Breeding Engineering Technology Research Center of Chinese Academy of Agricultural Sciences, Lanzhou 730050, China
*
Authors to whom correspondence should be addressed.
Animals 2023, 13(22), 3516; https://doi.org/10.3390/ani13223516
Submission received: 29 August 2023 / Revised: 25 October 2023 / Accepted: 7 November 2023 / Published: 14 November 2023
(This article belongs to the Section Animal Genetics and Genomics)

Abstract

:

Simple Summary

The weight features of Alpine Merino Sheep, particularly their live weight in the 14th month (WT), are crucial in production and breeding, as they live at high altitudes and in highland areas where oxygen is scarce. Genome selection (GS) offers the advantages of minimizing breeding costs and generational intervals, and the main objective of genome selection breeding is the accuracy of GS. Genome-wide association studies (GWASs) were used in this study to extract the variation information related to the 14-month-old body weight trait of Alpine Merino Sheep, identify candidate genes associated with this trait, and employ GWAS results as prior information to conduct GS research on the trait to determine the most suitable GS breeding model for the target trait.

Abstract

Alpine Merino Sheep is a novel breed reared from Australian Merino Sheep as the father and Gansu Alpine Fine-Wool Sheep as the mother, living all year in cold and arid alpine areas with exceptional wool quality and meat performance. Body weight is an important economic trait of the Alpine Merino Sheep, but there is limited research on identifying the genes associated with live weight in the 14th month for improving the accuracy of the genomic prediction of this trait. Therefore, this study’s sample comprised 1310 Alpine Merino Sheep ewes, and the Fine Wool Sheep 50K Panel was used for genome-wide association study (GWAS) analysis to identify candidate genes. Moreover, the trial population (1310 ewes) in this study was randomly divided into two groups. One group was used as the population for GWAS analysis and screened for the most significant top 5%, top 10%, top 15%, and top 20% SNPs to obtain prior marker information. The other group was used to estimate the genetic parameters based on the weight assigned by heritability combined with different prior marker information. The aim of this study was to compare the accuracy of genomic breeding value estimation when combined with prior marker information from GWAS analysis with the optimal linear unbiased prediction method for genome selection (GBLUP) for the breeding value of target traits. Finally, the accuracy was evaluated using the five-fold cross-validation method. This research provides theoretical and technical support to improve the accuracy of sheep genome selection and better guide breeding. The results demonstrated that eight candidate genes were associated with GWAS analysis, and the gene function query and literature search results suggested that FAM184B, NCAPG, MACF1, ANKRD44, DCAF16, FUK, LCORL, and SYN3 were candidate genes affecting live weight in the 14th month (WT), which regulated the growth of muscle and bone in sheep. In genome selection analysis, the heritability of GBLUP to calculate the WT was 0.335–0.374, the accuracy after five-fold cross-verification was 0.154–0.190, and after assigning different weights to the top 5%, top 10%, top 15%, and top 20% of the GWAS results in accordance with previous information to construct the G matrix, the accuracy of the WT in the GBLUP model was improved by 2.59–7.79%.

1. Introduction

Genomic selection (GS), a novel method for selective breeding using high-density markers covering the whole genome, was initially proposed by Meuwissen in 2001 [1]. Particularly for traits with low heritability and difficulty in measurement, GS offers the advantages of shortening the generation interval, achieving early selection, reducing breeding cost [2,3,4], and improving the estimated accuracy of the genomic estimated breeding value (GEBV) [5]. It partially resolves the issues with marker-assisted selection and completes the task of using genome technology to direct breeding practice. The direct method represented by genomic best linear unbiased prediction (GBLUP) and the indirect method represented by the Bayesian method are the two primary GS methods [1]. Despite having the advantage of high calculation accuracy, the indirect method’s application in production is hampered by the issues of having a long calculation time and large consumption of computing resources; meanwhile, GBLUP offers the benefits of rapid computation and user-friendly implementation. It has been employed in the breeding of pigs [6,7], cattle [8], sheep [9], chickens [10], and other poultry. Recently, GS has been extensively used to study the quantitative traits of livestock, which has been attributed to the decreasing cost of high-throughput sequencing. Studies on important economic traits of livestock and poultry report that integrating previous data of GWAS can improve GS accuracy to some extent [11].
Genome-wide association analysis (GWAS) is a method of identifying potential variants associated with target traits and the candidate genes associated with them, and it provides evidence-based breeding production theories. N. Risch and K. Merikangas first proposed GWAS while researching the genetics of complicated diseases. Various software packages and models are available to conduct GWAS, including the most commonly used general linear model (GLM), mixed linear model (MLM), FarmCPU model, etc. Each model has its advantages and disadvantages. In this study, the FarmCPU model in the rMVP package (https://github.com/xiaolei-lab/rMVP (accessed on 15 May 2023)) was used for analysis, which combines the advantages of the MLM and GLM and, through iteration, uses them to overcome their shortcomings. Eliminating the confusion between relatives and target trait genes in MLMs can reduce errors more effectively.
Alpine Merino Sheep is a novel breed that was successfully developed with modern breeding technology using Australian Merino Sheep as the father and Gansu Alpine Fine Wool Sheep as the mother. The successful development of this breed not only improved the structure of China’s native sheep breed resources but also significantly boosted the local economy in the cold, arid mountain regions. Body weight is an important growth and development indicator in sheep breeding, which, to some extent, can affect the production of wool and meat [12]. Currently, GS and GWAS are relatively mature for guiding animal breeding. Some researchers have used the GWAS method to identify a series of candidate genes related to the growth, weight, and body size of sheep [13,14,15,16], providing theoretical and methodological support for related work on sheep breeding. Previous studies on human complex traits [17], important economic traits in livestock [18,19,20], and simulation studies [18] have shown that integrating prior GWAS information can improve the accuracy of genomic selection (GS). However, despite several methods based on GS accuracy for important economic traits in sheep existing, only a few studies have used the results of GWAS analysis as prior information in GS to predict accuracy. Meanwhile, given some differences in weight traits between Alpine Merino Sheep and Australian Merino Sheep, this study used the body weight trait of Alpine Merino Sheep at 14 months of age as the target trait and performed GWAS analysis on it, screened out candidate genes related to it, and sorted them by p-value significance according to the GWAS analysis results. It further selected the results of top 5%, top 10%, top 15%, and top 20% SNPs as prior information to construct a G matrix in GS to evaluate the accuracy of breeding values to identify candidate genes associated with the 14-month-old weight trait of Alpine Merino Sheep and compare the accuracy of genomic breeding value estimation combined with the prior GWAS marker information and method for the breeding value estimation of 14-month-old merino sheep. This research can to some extent accelerate the selection and breeding of Alpine Merino Sheep while also providing theoretical support for subsequent sheep breeding.

2. Materials and Methods

2.1. Phenotype and Genotype Data

The experimental animals in this study were chosen from the Gansu Sheep Breeding Technology Promotion Station in Huangcheng Town, Sunan Yugu Autonomous County, Zhangye City, Gansu Province. The station maintains a strictly standardized breeding and management system to ensure that all animals receive consistent feeding and care. All the experimental animals in this study were born in the same year and month, and they have the same gender but come from different flocks. The age of each participant was restricted to 14 months to ensure the uniformity of the sample. To prevent inaccuracies, after 12 h of fasting in their natural conditions, we measured the weight of each sheep by placing them on an automated weighing scale. The measurement unit is kilograms. The results were rounded to one decimal place for precision, and outliers (extreme values) were excluded from the analysis. The outcomes were systematically archived according to the documentation by proficient and experienced technicians. Outliers and extreme values were removed using the three standard deviations method, and all 1310 ewes had complete records of their phenotypic data. The entire population followed a the normal distribution. In this study, the weight phenotype was divided into two parts: (1) to identify candidate genes associated with live weight at 14 months, a total of 1310 Alpine Merino ewes were used for GWAS analysis. (2) To compare the genomic prediction accuracy between the GBLUP model and the GBLUP model incorporating GWAS information, the phenotypes of 1310 ewes were randomly divided into two groups, each containing 655 ewes, using the RAND function. These two groups were considered control groups for each other.
Blood samples (of at least 3 mL) were collected from each sheep by puncturing the jugular vein. The sample were then immediately transferred to vacuum sampling vessel with ethylenediaminetetraacetic acid (EDTA) added (Yuli Medical Equipment Co., Ltd., Taizhou, China). Afterward, blood samples were stored in the onboard refrigerator at 4 °C for subsequent DNA extraction. Genotyping was conducted using the Fine Wool Sheep 50K Panel (MolBreeding Biotech Ltd., Shijiazhuang, China). The reference genome used was the Oar v4.0 (GCF 000298735.2) version of sheep, as published on the NCBI. The PLINK (version: v1.9b4) conducted quality control on all SNPs. For SNP sites, the deletion rate was >10%, the test p-value (HWE) of the Hardy–Weinberg balance was <10−6, and all the markers with a minor allele frequency (MAF) of <5% were eliminated. For sample individuals, all samples with an undetected rate > 10% were eliminated. To sum up, this study’s quality control criteria were as follows: SNP Call rate > 90%, MAF > 5%, HWE_p-value > 10−6, and Individual Call Rate > 90%. Beagle software (version 5.0) performs the self-filling of genotype data, since some models do not allow the presence of NA in genotype data. A total of 41,987 autosomal SNPs were isolated from the Fine Wool Sheep 50 K, and all 1310 samples passed the quality control criteria; then, they were retained for further GWAS and GS analysis following quality control and genotype data filling.

2.2. GWAS Model Analysis Methods

This study utilized the FarmCPU model in rMVP software (version 1.0.7) (https://github.com/xiaolei-lab/rMVP, accessed on 15 May 2023) to perform GWAS analysis for live weight at 14 months. To eliminate the ambiguity of determining whether a relevant marker is in linkage disequilibrium (LD) with a detection marker, the FarmCPU model addresses kinship confusion by adopting a fixed-effect model. The approach removes the need to collect kinship information from all markers or related labels. Alternatively, the related marker is selected using the maximum likelihood approach based on kinship derived from the related marker. This method overfits the stepwise regression model. The FarmCPU model iterations utilize both a fixed-effect model and a random-effects model. In summary, the FarmCPU model is not only a statistically powerful method but also a computationally efficient GWAS approach [21]. The model is represented as follows:
y i = M i 1 b 1 + M i 2 b 2 + + M i n b n + Z i j u j + e i
y i = V i + e i
In Equations (1) and (2), Equation (1) is a fixed-effect model, Equation (2) is a random-effects model, y i represents the phenotypic observation of the i th individual, M i n represents the classification result of a total of n potential correlation sites included in the model, b n indicates the effect value corresponding to the site, Z i j indicates the classification result of the j th marker of the i th individual, u j is the effect value of Z i j , V i represents the total genetic effect of the i th individual, and e i is the residual vector, subject to e ~ N 0 , I σ e 2 . When executing the FarmCPU model, styles (1) and (2) are alternate operations.
The principal component analysis (PCA) results were evaluated using the BLINK model in the GAPIT software (version 3), and the FarmCPU model integrates both kinship relationships and population structure. The results of the GWAS analysis were corrected using the Bonferroni [22] correction method, which strictly controls the occurrence of false positives. The significance threshold for the genome was set at 1/Nsnp, where Nsnp represents the number of SNPs remaining after quality control. The gene annotation used in this study was based on the reference genome of sheep Oar v4.0 (GCF 000298735.2) published on the National Center for Biotechnology Information Website, and the gene annotation software was the BEDTOOLS software (version 2.30.0). The p-value of each SNP was obtained using a significance test, utilizing each SNP as a fixed factor for regression analysis. SNPs with smaller p-values were then selected and weighted according to their heritability as prior marker information for the subsequent GS analysis.

2.3. GS Model Analysis Method

In this study, the GBLUP [23] model in ASReml [24] software (version 4.1.0.176) was used for analysis, and the GBLUP model is a representative of the direct method in GS analysis, which takes individuals as random effects, constructs a kinship matrix as a variance–covariance matrix concerning the genetic information of the population and the predicted population, estimates the variance component by an iterative method, and further solves the mixed model to obtain the estimated breeding value of the individual to be predicted. In this study, the genome was included as a random factor, while birth type and flock were included as fixed factors in the model for analysis. The GBLUP model is as follows:
y = X b + Z u + e
In Equation (3), y represents the corrected tabular vector of the individual, b represents the fixed effect vector (including the overall mean), u represents the random effects vector, i.e., the random additive genetic effect, X and Z represent the association matrix corresponding to b and u , respectively, e represents the random residual, and its variance distribution is e ~ N 0 , I σ e 2 , where lie the identity matrix and the covariance matrix of the additive effects V a r u = G σ e 2 . Thus, it is necessary to construct a matrix, which is the genomic relationship matrix between individuals, based on the method proposed by VanRaden [23], which is as follows:
G = σ σ T 2 k = 1 m p k 1 p k    
In Equation (4), σ is the additive genetic effect marker matrix, and its dimension is the sum of the number of individuals ( n ) and the number of the loci ( m ), σ T is the transpose matrix of σ , and p k is the minor allele frequency (MAF) value of the gene seat ( k ).
The kinship matrix construction method used by GS combined with GWAS prior information is as follows. The kinship matrix G 1 was constructed using the significance prior marker information in the GWAS results, and the kinship matrix G 2 was constructed from the remaining SNP sites, the genetic variance of G 1 and G 2 for WT trait interpretation was calculated individually, and the kinship matrix G 3 was fitted with the proportion of explanatory genetic variance as the weight. The G 3 matrix equation is as follows:
G 3 = γ G 1 + 1 γ G 2
In Equation (5), γ = σ G 1 2 σ G 1 2 + σ G 2 2 , σ G 1 2 is the genetic variance of the G 1 matrix, and σ G 2 2 is the genetic variance of the G 2 matrix. GS analysis was performed using kinship matrix G and kinship matrix G 3 combining different prior marker information, and genetic parameters and the prediction accuracy of the WT trait were compared between different methods.

2.4. Calculation Method of GS Accuracy

The accuracy of genomic predictions was assessed using five-fold cross-validation [25]. The 1310 datasets were randomly divided into two groups, each containing 655 ewes. Five-fold cross-validation was performed, with 655 ewes were divided into five subsets of approximately equal numbers, with each subset containing 131 individuals. Four of these groups were considered as training sets (reference populations) for each five-fold cross-validation to evaluate genetic parameters and genomic breeding values. The remaining subset was considered as a validation population (candidate population) to ensure accuracy and predict the breeding value of the validation population. To ensure the randomness of the validation population, the cross-validation mentioned above was conducted ten times. Subsequently, the average of the five-fold cross-validations was calculated and recorded as the final prediction accuracy. Currently, in genomic prediction selection, accuracy is mainly obtained by calculating the Pearson correlation coefficient between GEBV and TBV, the computational method was proposed by Meuwissen in 2001 [1],and the accuracy is calculated as follows:
R = Cov G E B V , T B V V a r G E B V × V a r T B V
In Equation (6), Cov G E B V , T B V represents the covariance of G E B V and T B V , whereas V a r G E B V and V a r T B V represent the variance of G E B V and T B V , respectively. Since this calculation applies to populations whose true values are known, our study is entirely relevant.

3. Results

3.1. Statistics and Distribution of Phenotypic Data

In this study, the weight traits of 1310 Alpine Merino Sheep ewes were recorded at 14 months of age by professional and experienced staff. As indicated by the pink line, most of the records were concentrated between 40 and 50 kg, as depicted in Figure S1. Live weight in the 14th month was assessed using the debug function in the psych package of the R language. The descriptive statistical results are shown in Table 1 (includes overall phenotype and grouped phenotype).

3.2. Call Rate and Distribution of Genotype Data

After quality control and genotype filling of the Fine Wool Sheep 50K data, a total of 41,987 SNPs were utilized for genome-wide association analysis and genomic selection. The p-values from the GWAS analysis were sorted in descending order, and the top 5%, top 10%, top 15%, and top 20% of SNPs were selected as prior marker information. The top 5% contained 1908 SNPs, leaving 36,568 SNPs in the remaining 95%. The top 10% contained 3835 SNPs, leaving 34,642 SNPs in the remaining 90%. The top 15% contained 5726 SNPs, leaving 32,750 SNPs in the remaining 85%. The top 20% contained 7666 SNPs, leaving 30,810 SNPs in the remaining 80%. All of these SNPs were distributed across each chromosome.
All the trial populations used in this study came from five different core breeding farms. After quality control, a total of 41,987 autosomal SNPs were used for principal component analysis (PCA), The PCA diagram is exhibited in Figure 1a, indicating stratification in the experimental population. PCA was included in the GWAS model for correction therefore. Linkage disequilibrium analysis was conducted on Alpine Merino Sheep, and the results are shown in Figure 1b. When the distance reached 100 kb, LD began to exhibit a trend toward stability, suggesting that genes within 100 kb of the significant SNPs could be potential candidates. The 100 kb region upstream and downstream of significant SNPs was selected to annotate candidate genes in this study.

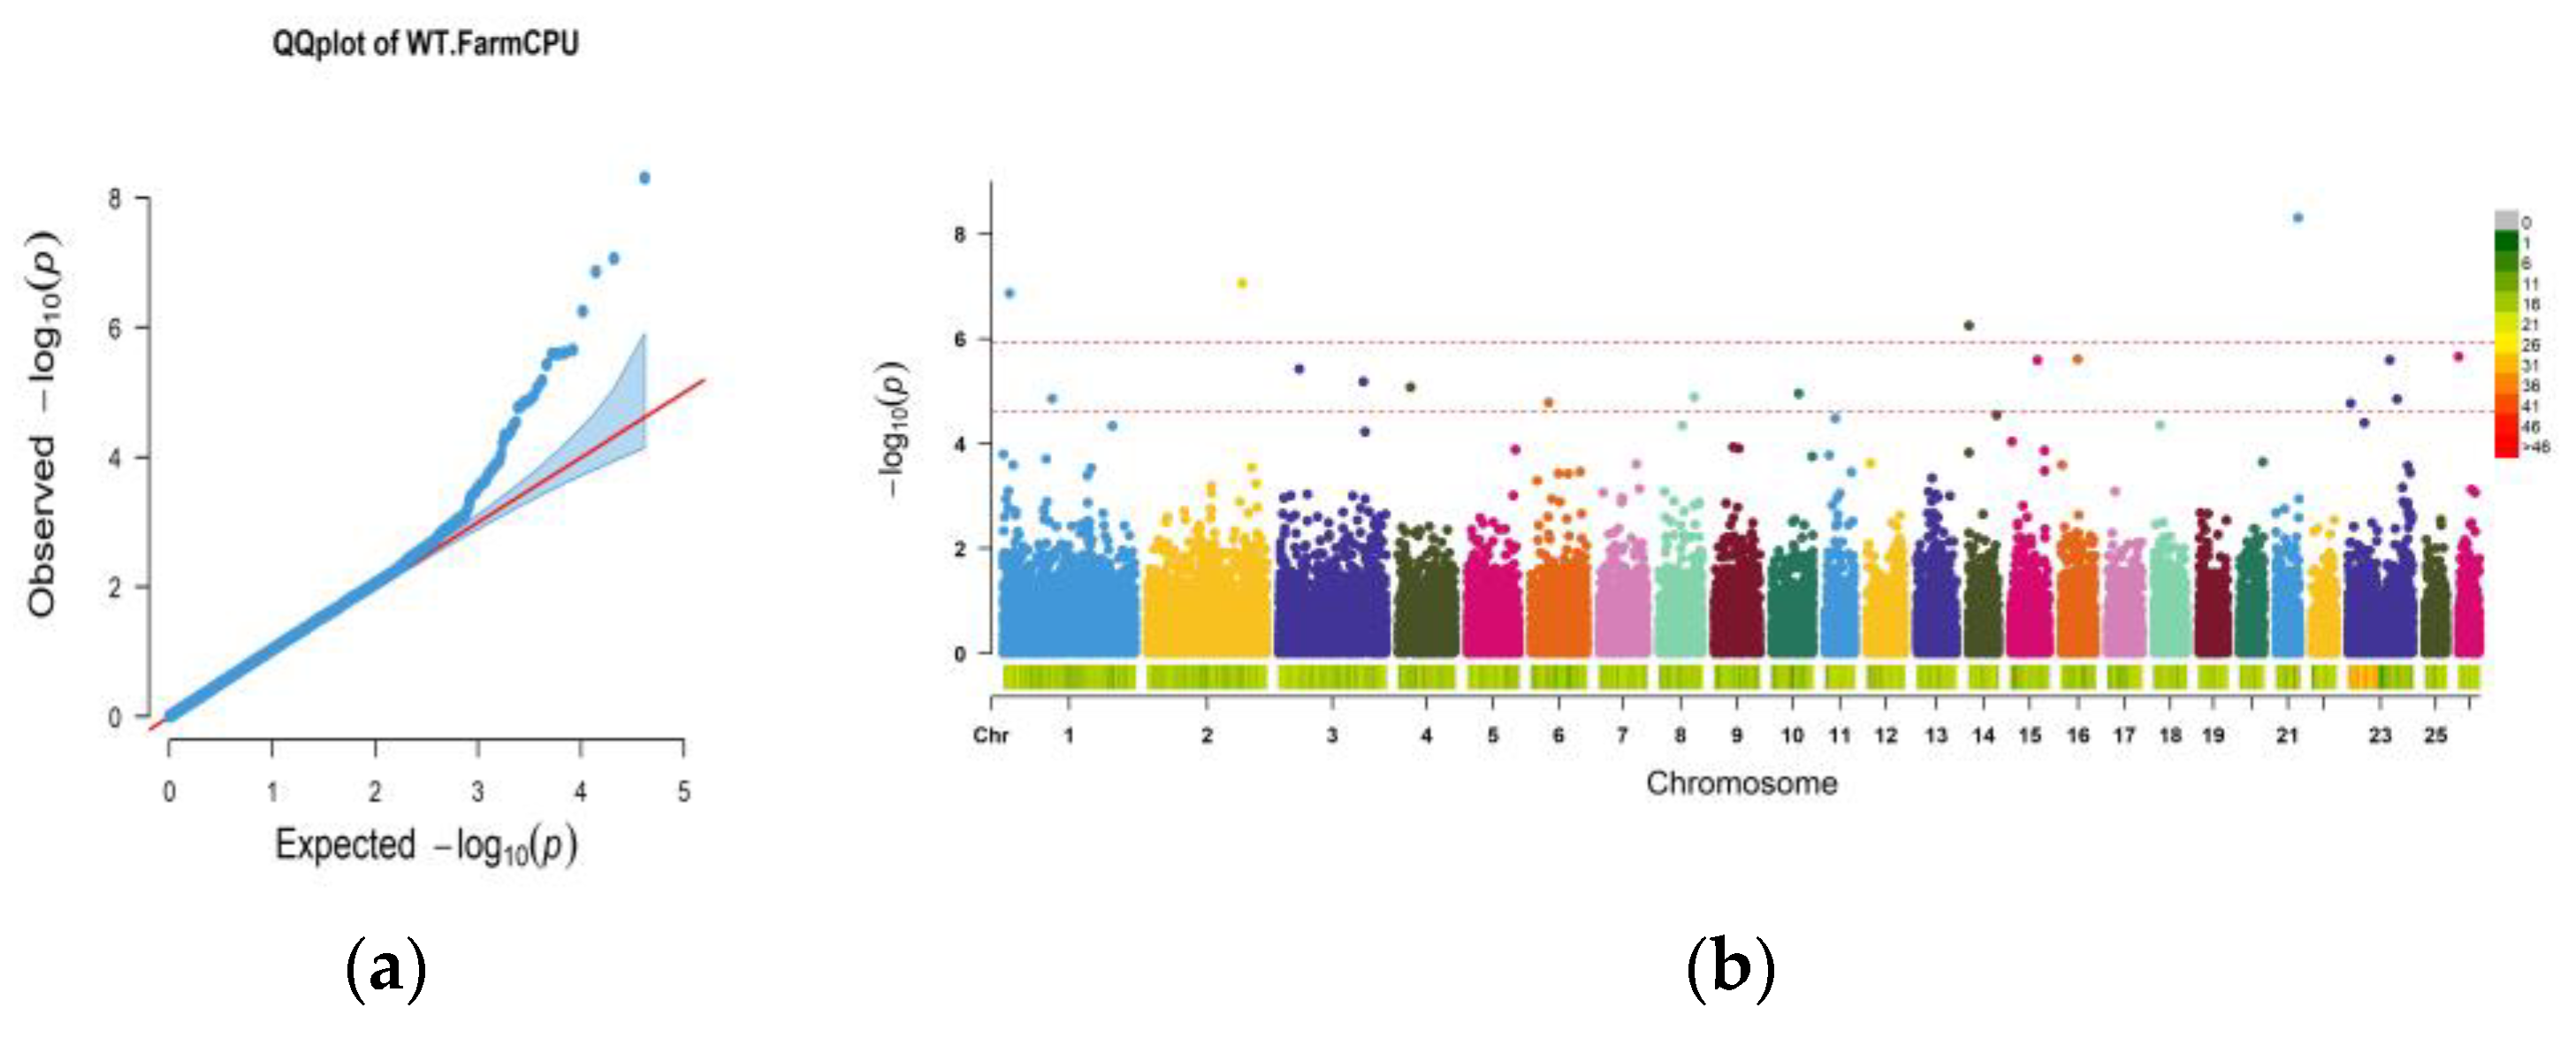
3.3. GWAS Analysis Results

The FarmCPU model was used to perform correlation analysis of the 14-month-old weight trait. The results of the Manhattan plot and QQ plot are shown in Figure 2, the two threshold lines of the Manhattan plot were set to 0.05 (0.05/Nsnp) and 1 (1/Nsnp), and the p-value in the GWAS result was corrected by the Bonferroni method. A total of 17 significant sites were associated with a significance threshold of 1, and the upstream and downstream 100 kb intervals of those associated significant loci were extracted to annotate the genes. The annotation tool used was the BEDTOOLS software, which offers a powerful genomic algorithm toolset satisfying the study’s gene annotation requirements, and the results of this study were annotated to a total of 22 adjacent genes (Table 2). In contrast, the SNP loci associated with weight at 14 months were located on chromosomes 1,2, 3, 6, and 14. By querying gene function through online databases and extensively reviewing the literature, a total of eight candidate genes related to live weight in the 14th month were identified. The candidate genes were ANKRD44 (ankyrin repeat domain 44), MACF1 (microtubule actin crosslinking factor 1), SYN3 (synapsin III), DCAF16 (DDB1 and CUL4-associated factor 16), FAM184B (family with sequence similarity 184 member B), NCAPG (non-SMC condensing I complex subunit G), LCORL (ligand-dependent nuclear receptor corepressor like), and FUK (fucose kinase).

3.4. GS Analysis Results

The GBLUP model is a representative of the direct method in GS prediction methods, which assumes that all SNPS have an effect. However, this assumption is obviously unreasonable. In this study, group 1 and group 2 were combined to verify the population. When the GBLUP model calculation was not based on the GWAS results, the genetic variance and environmental variance calculated by the G matrix were 5.427~6.176, 10.351 and 10.751, respectively. The heritability was estimated to be between 0.335 and 0.774, and the prediction accuracy, as assessed by five-fold cross-validation, ranged from 0.154 to 0.190. The genetic parameters for group 1 are presented in Table 3, while those for group 2 are shown in Table 4.
The GWAS results from trial group 2 were utilized as prior information to construct a G matrix, which was then used to validate trial group 1 and compare the accuracy of genome prediction. The most significant SNPs (top 5%) were selected to construct the kinship matrix G1. The genetic variance and environmental variance obtained were 2.702 and 13.308, respectively. The heritability was 0.169. The remaining 95% of SNPs were used to construct matrix G2. The genetic variance was 5.418 and environmental variance was 10.764. The heritability was 0.335, and the weighted values of G1 and G2 were 0.333 and 0.667, respectively. The G3 matrix was constructed with genetic variance and environmental variance of 4.840 and 11.229, respectively. The heritability was 0.158, and the prediction accuracy was 0.630, representing a 2.59% improvement in accuracy. The most significant SNPs (top 10%) were selected to construct the kinship matrix G1. The genetic variance and environmental variance obtained were 4.035 and 12.013, respectively. The heritability was 0.251. The remaining 90% of SNPs were used to construct the matrix G2. The genetic variance was 5.256 and the environmental variance was 10.915, resulting in a heritability of 0.325. The weighted values of G1 and G2 were 0.434 and 0.566, respectively. Additionally, the genetic variance was 5.331, the environmental variance was 10.767, the heritability was 0.331, and the prediction accuracy was 0.165, representing a 7.14% improvement in accuracy.
The most significant SNPs (top 15%) were selected to construct the affinity matrix G1. The genetic variance and environmental variance obtained were 4.052 and 11.992, respectively. The heritability was 0.253, and the remaining 85% of the SNPs were used to construct matrix G2. The genetic variance and environmental variance were 5.236 and 10.93, respectively. The heritability was 0.324. The weighted values of G1 and G2 were 0.436 and 0.564, respectively. Additionally, the genetic variance and environmental variance were 5.301 and 10.800, respectively. The heritability was 0.329, and the prediction accuracy was 0.164, representing an improvement accuracy by 6.49%. The most significant SNPs (top 20%) were selected to construct a kinship matrix G1. The genetic variance and environmental variance obtained were 4.786 and 11.319, respectively, resulting in a heritability of 0.297. The remaining 80% of SNPs were used to construct matrix G2. The genetic variance and environmental variance were 5.129 and 11.033, respectively. The heritability was 0.317. The weighted values of G1 and G2 were 0.483 and 0.517, respectively. The G3 matrix was constructed with genetic variance and environmental variance of 5.493 and 10.626, respectively. The heritability was 0.341, and the prediction accuracy was 0.166, representing a 7.79% improvement in accuracy.
The GWAS results from trial group 1 were utilized as prior information to construct a G matrix. This matrix was subsequently employed to validate trial group 2 and assess the accuracy of genome prediction. The most significant SNPs (top 5%) were selected to construct matrix G1. The genetic variance and environmental variance were 4.463 and 11.960, respectively, resulting in a heritability of 0.272. The remaining 95% SNPs were used to create matrix G2, which yielded a genetic variance of 5.968, an environmental variance of 10.542, and a heritability of 0.361. The weights of G1 and G2 were 0.428 and 0.572, respectively, which led to the construction of matrix G3. The genetic variance and environmental variance for G3 were 6.296 and 10.174, respectively, resulting in a heritability of 0.382. The prediction accuracy was 0.201, indicating a 5.79% improvement in accuracy. Furthermore, the most significant SNPs (top 10%) were selected to construct the matrix G1, resulting in a genetic variance of 4.688 and an environmental variance of 11.740. The heritability was estimated to be 0.285. The remaining 90% of SNPs were used to construct matrix G2, which had a genetic variance of 6.012, an environmental variance of 10.503, and a heritability of 0.364. The weights of G1 and G2 were 0.438 and 0.562, respectively. The genetic variance and environmental variance for matrix G3 were 6.057 and 10.340, respectively, resulting in a heritability of 0.368. The prediction accuracy was 0.188, representing a decrease in accuracy of 1.05%.
The most significant SNPs (top 15%) were selected to construct matrix G1. The resulting genetic variance and environmental variance were 4.969 and 11.475, respectively, with a heritability of 0.302. The remaining 85% of SNPs were used to construct matrix G2, which had a genetic variance of 6.027, an environmental variance of 10.489, and a heritability of 0.365. The weights of G1 and G2 were 0.452 and 0.548, respectively. The genetic variance and environmental variance for G3 were 6.060 and 10.396, respectively, resulting in a heritability of 0.368. The prediction accuracy was 0.184, resulting in a decrease in accuracy of 3.15%. Similarly, the most significant SNPs (top 20%) were selected to construct matrix G1, resulting in a genetic variance of 5.288 and an environmental variance of 11.194. The heritability was estimated to be 0.321. The remaining 80% of SNPs were used to construct matrix G2, which had a genetic variance of 5.986, an environmental variance of 10.523, and a heritability of 0.363. The weights of G1 and G2 were 0.469 and 0.531, respectively. The G3 matrix was constructed with a genetic variance of 6.139 and an environmental variance of 10.330. The heritability was calculated to be 0.373. The prediction accuracy was 0.185, resulting in a decrease in accuracy by 2.63%.

4. Discussion

4.1. Animals and Data

Alpine Merino Sheep is a new breed of Chinese sheep with exceptionally high-quality wool and great meat quality. These sheep thrive in cold, arid alpine areas throughout the year. Improving the breeding of Alpine Merino Sheep can have a positive impact on the local economy. Therefore, this study used the 14-month-old body weight trait of 1310 Alpine Merino ewes from the core breeding station of Huangcheng Sheep Breeding Extension Station in Gansu Province as the target trait for GWAS and GS analysis. The aim was to identify candidate genes associated with the target trait and determine the most suitable genomic prediction model for the trait. These phenotypic data were clean, well-documented, and free from outliers for research analysis. The genotype data used in this study was the Fine Wool Sheep 50K Panel data of the experimental animal for GWAS analysis. Following model correction, the Q-Q plot of GWAS results showed a good fit. The GBLUP model used in the GS analysis demonstrated a prediction accuracy ranging from 0.154 to 0.190. This was not significantly different from the results of genomic prediction accuracy studies on the carcass weight of the pig [26], the carcass traits of sheep [27], and the one-year weight of Hanwoo beef cattle [28]. The findings of this study were reliable.

4.2. GWAS and Candidate Genes

Body weight traits are typical quantitative traits regulated by micro-efficacious polygenes, and GWAS is a powerful tool for identifying the genes underlying such traits. Many researchers have previously conducted GWAS analyses on livestock with a particular emphasis on body weight traits. For example, CAPN6, which is associated with the birth weight of Hu Sheep, was identified using GWAS analysis [29]. Additionally, 84 genes (including BMPR1B, HSD17B3, and TMEM63C) related to sheep production traits were identified [30]. Furthermore, important candidate genes related to body size [31], body weight [32], and muscle growth and development [33] in goats were identified, playing a significant role in promoting genetic improvement. The GWAS analysis results of this study also provided annotations for some genes previously reported in other papers, such as ANKRD44, MACF1, SYN3, DCAF16, FAM184B, NCAPG, LCORL, and FUK.
The FAM184B gene is located on sheep chromosome 6, and studies have demonstrated that it is not only associated with sheep meat quality, weight, and body shape traits [34] but also with fat metabolism, skeletal system development, and meat quality traits [35]. Additionally, the FAM184B gene has been identified as a gene strongly associated with body size and weight traits in livestock and poultry, including donkeys [36], chickens [37,38], and Red Angus cattle [39]. The NCAPG gene is located on sheep chromosome 6. Posbergh determined that this gene was associated with sheep size [40], and Al-Mamun reported that it was not only related to sheep weight but also related to cattle growth, carcass size, and human height [41,42]. Liu [43] demonstrated that the NCAPG gene was abundant in the muscles of Qinchuan cattle. The analysis also identified that this gene plays a role in muscle growth and development. The NCAPG–LCORL loci were found to be significantly associated with feed intake and weight gain phenotypes in beef cattle [44]. Additionally, in related studies on other livestock species such as horses [45,46], deer [47], and Korean cattle [48], the association of the NCAPG gene with body weight and height has also been validated. It has been discovered that multiple quantitative trait loci found on chromosome 6 of sheep impact the fat area, fat density, fat weight, and muscle density [49]. The LCORL gene is associated with weight traits and embryo development in Hu sheep [8]. It is also related to height [41] in humans and cattle as well as growth and feed intake in sheep [15]. NCAPG/LCORL has been identified as being associated with body size in Chinese Merino sheep [50]. The MACF1 gene is essential for regulating the actin and microtubule cytoskeleton network. The knockout function of mouse models revealed that MACF1 is associated with skin integrity and bone formation [51]. This gene was identified as a candidate gene related to spine curvature in Chinese indigenous pigs [52]. The SYN3 gene has been implicated in the body length asymmetry of goats and in the extracellular matrix of neuroregulatory processes [53]. The ANKRD44 gene has been found to have a significant association with birth weight in pigs. Additionally, it has been validated to be significantly associated with bone mineral density and whole-body lean mass [54,55]. This gene has also been found to be significantly associated with low birth weight and postprandial triglyceride concentration in pigs, which can have an impact on early-life metabolism [54]. The DCAF16 gene is significantly associated with the average daily gain of cattle, and the DCAF16-NCAPG region is a susceptible site for this trait [56]. The studies have shown that the growth traits and fertility of dairy cows were strongly correlated with the expression of the FUK gene [57]. These results indicate that the genes FAM184B, NCAPG, MACF1, SYN3, ANKRD44, DCAF16, FUK, and LCORL may be associated with body weight, body size, and muscle development in Alpine Merino Sheep. These genes and can be considered as potential candidates for target traits.
In addition to FAM184B, NCAPG, MACF1, SYN3, ANKRD44, DCAF16, FUK, and LCORL genes, which have been reported as relevant genes in the body weight and body shape of sheep, cows and other domestic animals in many articles, the other genes reported in this study, SPRR4, ACTR2, SPRED2, TRNAC, TAB2, SF3B3, COG4, ST3GAL2, DDX19A, AARS, BDNF, FYB, CCND1, and DLGAP2, are considered to be equally important. These genes are potential genes for sheep growth and body weight. Specifically, the DDX19A, TAB2, ST3GAL2, and CCND1 genes are of particular interest. DDX19A is highly expressed in several mammalian tissues, including the brain smooth muscle, skeletal muscle, placenta, and fetal heart, with the highest expression observed in skeletal muscle [58]. This indicates that DDX19A plays an important role in regulating skeletal muscle growth. The studies have found that the mutation of the TAB2 gene is related to human developmental delay [59]. The ST3GAL2 gene is associated with late-onset obesity in mice [60], and the CCND1 gene regulates muscle growth in fish by controlling the expression of related genes [61]. When miR-21-5p is highly expressed in the skeletal muscle of chickens, it is accompanied by an increase in CCND1 expression [62]. This indicates that CCND1 plays a regulatory role in the growth of chicken skeletal muscle.

4.3. Comparative Analysis of the Accuracy of Different Models of Genome Selection

In this study, the prediction accuracy of the GBLUP model for the two groups ranged from 0.154 to 0.190. However, when the G matrix was constructed by combining the results of GWAS as prior information, the prediction accuracy of genomic selection ranged from 0.158 to 0.201. We used the GWAS results from group 1 to predict GS in group 2 and vice versa, which helped prevent overfitting. The construction of the G matrix with GWAS results as prior information in GS is different from other genome selection prediction models. This is because GWAS analysis has already identified SNP loci that are associated with target traits, and these loci will have higher heritability when constructing the G matrix. The higher the heritability, the greater the prediction accuracy. However the prediction accuracy does not continue to increase with higher heritability. There is a limit to the increase, which is consistent with the hypothesis and findings of this study. However, in this study, when the GWAS results of group 2 were used as prior information to predict the genome prediction accuracy of group 1, there were varying degrees of improvement, specifically for the top 5%, top 10%, top 15%, and top 20%, respectively. On the other hand, when the GWAS results of group 1 were used as prior information to predict group 2, only the accuracy of the top 5% SNPs improved, while the other parts showed a decline. It could be due to the following reasons: (1) the site effect screened by group 2 is larger than that of group 1, and (2) the sample size of this study is relatively small. Despite the interference of other factors, the accuracy of genome prediction is improved by constructing a G matrix based on GWAS prior information compared to traditional breeding methods. This improvement has a positive impact on enhancing the accuracy of genome prediction. It is unreasonable to assume that all SNPs in the GBLUP model have the same effect and follow the same distribution. Some researchers have integrated the GS model with prior information and made various advancements, including the use of genomic feature BLUP [63] and Bayes RC [64]. Zhang [65] proposed a method called TABLUP, which optimizes the genome relationship matrix and constructs a trait-specific relationship matrix. TABLUP assigns different weights to all markers based on the best linear unbiased prediction methods, namely indirect Bayes and ridge regression. This method shows a significant improvement over GBLUP in terms of prediction accuracy. However, the Bayes model has a long calculation time, high complexity, and large memory consumption, making it unsuitable for big data analysis. Therefore, based on the results of GWAS analysis, the SNP sites were sorted by p-value. The SNPs with a significant impact on their phenotype were compared to traditional breeding methods. This improved the G matrix. SNPs associated with the target traits have been partially screened out, and as a result, the study finding are consistent with expectations. Compared to the GBLUP model, this method can significantly enhance prediction accuracy.

5. Conclusions

In this study, Alpine Merino Sheep ewes were used as the research group, and the target trait was initially analyzed using a GWAS at 14 months of age. Subsequently, the accuracy of estimating genomic breeding values, when combined with prior information from GWASs, was compared to the GBLUP model for estimating the breeding values of target traits. The GWAS analysis using the FarmCPU model identified eight candidate genes for the target trait: FAM184B, NCAPG, MACF1, ANKRD44, DCAF16, FUK, LCORL, and SYN3. Additionally, SNPs representing the top 5% to top 20% based on the p-value in the GWAS analysis were selected as prior information. The G matrix was then constructed using the GBLUP model in GS analysis. The results of genetic parameter estimation and prediction accuracy analysis for the WT trait demonstrated that the accuracy of breeding values improved by 7.79% when the top 20% SNPs were used as prior information. Consequently, based on the results of the GWAS analysis used as prior information, the accuracy of genomic prediction achieved by constructing the G matrix in GS analysis was higher than that of the GBLUP model. This suggests that this method is suitable for selecting weight traits at 14 months of age in this population.

Supplementary Materials

The following supporting information can be downloaded at https://www.mdpi.com/article/10.3390/ani13223516/s1, Figure S1: Histogram of weight distribution at 14 months of age with the pink line representing the fitted normal distribution.

Author Contributions

Conceptualization, C.L., Y.Y. and T.G.; methodology, C.L. and J.L.; software, C.L. and C.Y.; validation, C.L., X.A. and R.Z.; formal analysis, C.L. and H.W. investigation, C.L. and H.W.; resources, J.L.; data curation, C.L. and Y.Y.; writing—original draft preparation, C.L. and X.A.; writing—review and editing, C.L. and X.A.; visualization, C.L. and J.L.; supervision, C.Y. and J.L.; project administration, Y.Y.; funding acquisition, Y.Y. and T.G. All authors have read and agreed to the published version of the manuscript.

Funding

National Key R&D Program “Research and Development of Key Technologies for Efficient Sheep Breeding and Reproduction” (2021YFD1300901); the major scientific research task of Science and Technology Innovation Project of Chinese Academy of Agricultural Sciences “The cultivation and industrialization of new breeds of high-quality and efficient mutton Sheep” (CAAS-ZDRW202106); National Wool Sheep Industry Technology System Breeding Technology and Method Post (CARS-39-02); Natural Science Foundation Gansu province (21JR7RA033).

Institutional Review Board Statement

All experimental protocols and procedures were approved by the Institutional Animal Care and Use Committee of Lanzhou Institute of Husbandry and Pharmaceutical Science of Chinese Academy of Agricultural Sciences (Approval No. NKMYD201805; Approval Date: 18 October 2018). Additionally, we collected and analyzed the blood samples of the studied animals in strict accordance with the People’s Republic of “China’s Guidelines for the Care and Use of Laboratory Animals”.

Informed Consent Statement

Not applicable.

Data Availability Statement

Data will be available upon request from the corresponding author.

Acknowledgments

The Gansu Breeding Technology Extension Station Sheep in Huangcheng, Sunan Yugur Autonomous County, Zhangye City, Gansu Province, which provided a batch of Alpine Merino Sheep ewes for unified feeding and management, is primarily responsible for the success of this experiment.

Conflicts of Interest

The authors declare no conflict of interest.

References

  1. Meuwissen, T.H.; Hayes, B.J.; Goddard, M.E. Prediction of total genetic value using genome-wide dense marker maps. Genetics 2001, 157, 1819–1829. [Google Scholar] [CrossRef] [PubMed]
  2. Hayes, B.J.; Visscher, P.M.; Goddard, M.E. Increased accuracy of artificial selection by using the realized relationship matrix. Genet. Res. 2009, 91, 47–60. [Google Scholar] [CrossRef]
  3. Habier, D.; Tetens, J.; Seefried, F.R.; Lichtner, P.; Thaller, G. The impact of genetic relationship information on genomic breeding values in German Holstein cattle. Genet. Sel. Evol. 2010, 42, 5. [Google Scholar] [CrossRef] [PubMed]
  4. Schaeffer, L.R. Strategy for applying genome-wide selection in dairy cattle. J. Anim. Breed. Genet. 2006, 123, 218–223. [Google Scholar] [CrossRef] [PubMed]
  5. Goddard, M.E.; Hayes, B.J. Genomic selection. J. Anim. Breed. Genet. 2007, 124, 323–330. [Google Scholar] [CrossRef] [PubMed]
  6. Esfandyari, H.; Sørensen, A.C.; Bijma, P. A crossbred reference population can improve the response to genomic selection for crossbred performance. Genet. Sel. Evol. 2015, 47, 76. [Google Scholar] [CrossRef]
  7. Song, H.; Ye, S.; Jiang, Y.; Zhang, Z.; Zhang, Q.; Ding, X. Using imputation-based whole-genome sequencing data to improve the accuracy of genomic prediction for combined populations in pigs. Genet. Sel. Evol. 2019, 51, 58. [Google Scholar] [CrossRef]
  8. Lourenco, D.A.; Tsuruta, S.; Fragomeni, B.O.; Masuda, Y.; Aguilar, I.; Legarra, A.; Bertrand, J.K.; Amen, T.S.; Wang, L.; Moser, D.W.; et al. Genetic evaluation using single-step genomic best linear unbiased predictor in American Angus. J. Anim. Sci. 2015, 93, 2653–2662. [Google Scholar] [CrossRef]
  9. Zhao, Z.D.; Zhang, L. Applications of genome selection in sheep breeding. Yi Chuan 2019, 41, 293–303. [Google Scholar]
  10. Wolc, A.; Zhao, H.H.; Arango, J.; Settar, P.; Fulton, J.E.; O’Sullivan, N.P.; Preisinger, R.; Stricker, C.; Habier, D.; Fernando, R.L.; et al. Response and inbreeding from a genomic selection experiment in layer chickens. Genet. Sel. Evol. 2015, 47, 59. [Google Scholar] [CrossRef]
  11. Lopes, M.S.; Bovenhuis, H.; van Son, M.; Nordbø, Ø.; Grindflek, E.H.; Knol, E.F.; Bastiaansen, J.W. Using markers with large effect in genetic and genomic predictions. J. Anim. Sci. 2017, 95, 59–71. [Google Scholar] [CrossRef] [PubMed]
  12. Wei, C.; Liu, C. Encyclopedia of Modern Sheep Production Technology; Agriculture Press: Beijing, China, 2014. [Google Scholar]
  13. Zhang, L.; Liu, J.; Zhao, F.; Ren, H.; Xu, L.; Lu, J.; Zhang, S.; Zhang, X.; Wei, C.; Lu, G.; et al. Genome-wide association studies for growth and meat production traits in sheep. PLoS ONE 2013, 8, e66569. [Google Scholar] [CrossRef] [PubMed]
  14. Kominakis, A.; Hager-Theodorides, A.L.; Zoidis, E.; Saridaki, A.; Antonakos, G.; Tsiamis, G. Combined GWAS and ‘guilt by association’-based prioritization analysis identifies functional candidate genes for body size in sheep. Genet. Sel. Evol. 2017, 49, 41. [Google Scholar] [CrossRef] [PubMed]
  15. Yurchenko, A.A.; Deniskova, T.E.; Yudin, N.S.; Dotsev, A.V.; Khamiruev, T.N.; Selionova, M.I.; Egorov, S.V.; Reyer, H.; Wimmers, K.; Brem, G.; et al. High-density genotyping reveals signatures of selection related to acclimation and economically important traits in 15 local sheep breeds from Russia. BMC Genom. 2019, 20, 294. [Google Scholar] [CrossRef] [PubMed]
  16. Ghasemi, M.; Zamani, P.; Vatankhah, M.; Abdoli, R. Genome-wide association study of birth weight in sheep. Animal 2019, 13, 1797–1803. [Google Scholar] [CrossRef]
  17. de Los Campos, G.; Vazquez, A.I.; Fernando, R.; Klimentidis, Y.C.; Sorensen, D. Prediction of complex human traits using the genomic best linear unbiased predictor. PLoS Genet. 2013, 9, e1003608. [Google Scholar] [CrossRef]
  18. Zhang, Z.; Ober, U.; Erbe, M.; Zhang, H.; Gao, N.; He, J.; Li, J.; Simianer, H. Improving the accuracy of whole genome prediction for complex traits using the results of genome wide association studies. PLoS ONE 2014, 9, e93017. [Google Scholar] [CrossRef]
  19. Gao, N.; Li, J.; He, J.; Xiao, G.; Luo, Y.; Zhang, H.; Chen, Z.; Zhang, Z. Improving accuracy of genomic prediction by genetic architecture based priors in a Bayesian model. BMC Genet. 2015, 16, 120. [Google Scholar] [CrossRef]
  20. Moghaddar, N.; Khansefid, M.; van der Werf, J.H.J.; Bolormaa, S.; Duijvesteijn, N.; Clark, S.A.; Swan, A.A.; Daetwyler, H.D.; MacLeod, I.M. Genomic prediction based on selected variants from imputed whole-genome sequence data in Australian sheep populations. Genet. Sel. Evol. 2019, 51, 72. [Google Scholar] [CrossRef]
  21. Liu, X.; Huang, M.; Fan, B.; Buckler, E.S.; Zhang, Z. Iterative Usage of Fixed and Random Effect Models for Powerful and Efficient Genome-Wide Association Studies. PLoS Genet. 2016, 12, e1005767. [Google Scholar] [CrossRef]
  22. Bland, J.M.; Altman, D.G. Multiple significance tests: The Bonferroni method. BMJ 1995, 310, 170. [Google Scholar] [CrossRef]
  23. VanRaden, P.M. Efficient methods to compute genomic predictions. J. Dairy. Sci. 2008, 91, 4414–4423. [Google Scholar] [CrossRef] [PubMed]
  24. Butler, D.; Cullis, B.; Gilmour, A.; Gogel, B.; Thompson, R. ASReml-R Reference Manual Version 4; VSN International Ltd.: Hemel Hempstead, UK, 2017. [Google Scholar]
  25. Browne, M.W. Cross-Validation Methods. J. Math. Psychol. 2000, 44, 108–132. [Google Scholar] [CrossRef] [PubMed]
  26. Iqbal, A.; Choi, T.J.; Kim, Y.S.; Lee, Y.M.; Zahangir Alam, M.; Jung, J.H.; Choe, H.S.; Kim, J.J. Comparison of genomic predictions for carcass and reproduction traits in Berkshire, Duroc and Yorkshire populations in Korea. Asian-Australas. J. Anim. Sci. 2019, 32, 1657–1663. [Google Scholar] [CrossRef] [PubMed]
  27. Bolormaa, S.; Gore, K.; van der Werf, J.H.; Hayes, B.J.; Daetwyler, H.D. Design of a low-density SNP chip for the main Australian sheep breeds and its effect on imputation and genomic prediction accuracy. Anim. Genet. 2015, 46, 544–556. [Google Scholar] [CrossRef] [PubMed]
  28. Naserkheil, M.; Lee, D.H.; Mehrban, H. Improving the accuracy of genomic evaluation for linear body measurement traits using single-step genomic best linear unbiased prediction in Hanwoo beef cattle. BMC Genet. 2020, 21, 144. [Google Scholar] [CrossRef]
  29. Cao, Y.; Song, X.; Shan, H.; Jiang, J.; Xiong, P.; Wu, J.; Shi, F.; Jiang, Y. Genome-Wide Association Study of Body Weights in Hu Sheep and Population Verification of Related Single-Nucleotide Polymorphisms. Front. Genet. 2020, 11, 588. [Google Scholar] [CrossRef]
  30. Tuersuntuoheti, M.; Zhang, J.; Zhou, W.; Zhang, C.L.; Liu, C.; Chang, Q.; Liu, S. Exploring the growth trait molecular markers in two sheep breeds based on Genome-wide association analysis. PLoS ONE 2023, 18, e0283383. [Google Scholar] [CrossRef]
  31. Moaeen-Ud-Din, M.; Danish Muner, R.; Khan, M.S. Genome wide association study identifies novel candidate genes for growth and body conformation traits in goats. Sci. Rep. 2022, 12, 9891. [Google Scholar] [CrossRef]
  32. Easa, A.A.; Selionova, M.; Aibazov, M.; Mamontova, T.; Sermyagin, A.; Belous, A.; Abdelmanova, A.; Deniskova, T.; Zinovieva, N. Identification of Genomic Regions and Candidate Genes Associated with Body Weight and Body Conformation Traits in Karachai Goats. Genes 2022, 13, 1773. [Google Scholar] [CrossRef]
  33. Zhang, L.; Wang, F.; Gao, G.; Yan, X.; Liu, H.; Liu, Z.; Wang, Z.; He, L.; Lv, Q.; Wang, Z.; et al. Genome-Wide Association Study of Body Weight Traits in Inner Mongolia Cashmere Goats. Front. Vet. Sci. 2021, 8, 752746. [Google Scholar] [CrossRef] [PubMed]
  34. Liu, Z.; Bai, C.; Shi, L.; He, Y.; Hu, M.; Sun, H.; Peng, H.; Lai, W.; Jiao, S.; Zhao, Z.; et al. Detection of selection signatures in South African Mutton Merino sheep using whole-genome sequencing data. Anim. Genet. 2022, 53, 224–229. [Google Scholar] [CrossRef] [PubMed]
  35. Mohammadi, H.; Raffat, A.; Moradi, H.; Shoja, J.; Moradi, M.H. Estimation of linkage disequilibrium and whole-genome scan for detection of loci under selection associated with body weight in Zandi sheep breed. Agric. Biotechnol. J. 2018, 9, 151–172. [Google Scholar]
  36. Liu, Y.; Li, H.; Wang, M.; Zhang, X.; Yang, L.; Zhao, C.; Wu, C. Genetic architectures and selection signatures of body height in Chinese indigenous donkeys revealed by next-generation sequencing. Anim. Genet. 2022, 53, 487–497. [Google Scholar] [CrossRef] [PubMed]
  37. Zhang, G.X.; Fan, Q.C.; Wang, J.Y.; Zhang, T.; Xue, Q.; Shi, H.Q. Genome-wide association study on reproductive traits in Jinghai Yellow Chicken. Anim. Reprod. Sci. 2015, 163, 30–34. [Google Scholar] [CrossRef] [PubMed]
  38. Jin, C.F.; Chen, Y.J.; Yang, Z.Q.; Shi, K.; Chen, C.K. A genome-wide association study of growth trait-related single nucleotide polymorphisms in Chinese Yancheng chickens. Genet. Mol. Res. 2015, 14, 15783–15792. [Google Scholar] [CrossRef]
  39. Smith, J.L.; Wilson, M.L.; Nilson, S.M.; Rowan, T.N.; Schnabel, R.D.; Decker, J.E.; Seabury, C.M. Genome-wide association and genotype by environment interactions for growth traits in U.S. Red Angus cattle. BMC Genom. 2022, 23, 517. [Google Scholar] [CrossRef]
  40. Posbergh, C.J.; Huson, H.J. All sheeps and sizes: A genetic investigation of mature body size across sheep breeds reveals a polygenic nature. Anim. Genet. 2021, 52, 99–107. [Google Scholar] [CrossRef]
  41. Al-Mamun, H.A.; Kwan, P.; Clark, S.A.; Ferdosi, M.H.; Tellam, R.; Gondro, C. Genome-wide association study of body weight in Australian Merino sheep reveals an orthologous region on OAR6 to human and bovine genomic regions affecting height and weight. Genet. Sel. Evol. 2015, 47, 66. [Google Scholar] [CrossRef]
  42. Xia, J.; Fan, H.; Chang, T.; Xu, L.; Zhang, W.; Song, Y.; Zhu, B.; Zhang, L.; Gao, X.; Chen, Y.; et al. Searching for new loci and candidate genes for economically important traits through gene-based association analysis of Simmental cattle. Sci. Rep. 2017, 7, 42048. [Google Scholar] [CrossRef]
  43. Liu, Y.; Duan, X.; Chen, S.; He, H.; Liu, X. NCAPG is differentially expressed during longissimus muscle development and is associated with growth traits in Chinese Qinchuan beef cattle. Genet. Mol. Biol. 2015, 38, 450–456. [Google Scholar] [CrossRef] [PubMed]
  44. Lindholm-Perry, A.K.; Sexten, A.K.; Kuehn, L.A.; Smith, T.P.; King, D.A.; Shackelford, S.D.; Wheeler, T.L.; Ferrell, C.L.; Jenkins, T.G.; Snelling, W.M.; et al. Association, effects and validation of polymorphisms within the NCAPG-LCORL locus located on BTA6 with feed intake, gain, meat and carcass traits in beef cattle. BMC Genet. 2011, 12, 103. [Google Scholar] [CrossRef] [PubMed]
  45. Staiger, E.A.; Al Abri, M.A.; Pflug, K.M.; Kalla, S.E.; Ainsworth, D.M.; Miller, D.; Raudsepp, T.; Sutter, N.B.; Brooks, S.A. Skeletal variation in Tennessee Walking Horses maps to the LCORL/NCAPG gene region. Physiol. Genom. 2016, 48, 325–335. [Google Scholar] [CrossRef] [PubMed]
  46. Tetens, J.; Widmann, P.; Kühn, C.; Thaller, G. A genome-wide association study indicates LCORL/NCAPG as a candidate locus for withers height in German Warmblood horses. Anim. Genet. 2013, 44, 467–471. [Google Scholar] [CrossRef]
  47. Hoshiba, H.; Setoguchi, K.; Watanabe, T.; Kinoshita, A.; Mizoshita, K.; Sugimoto, Y.; Takasuga, A. Comparison of the effects explained by variations in the bovine PLAG1 and NCAPG genes on daily body weight gain, linear skeletal measurements and carcass traits in Japanese Black steers from a progeny testing program. Anim. Sci. J. 2013, 84, 529–534. [Google Scholar] [CrossRef]
  48. Naserkheil, M.; Manzari, Z.; Dang, C.G.; Lee, S.S.; Park, M.N. Exploring and Identifying Candidate Genes and Genomic Regions Related to Economically Important Traits in Hanwoo Cattle. Curr. Issues Mol. Biol. 2022, 44, 6075–6092. [Google Scholar] [CrossRef]
  49. Matika, O.; Riggio, V.; Anselme-Moizan, M.; Law, A.S.; Pong-Wong, R.; Archibald, A.L.; Bishop, S.C. Genome-wide association reveals QTL for growth, bone and in vivo carcass traits as assessed by computed tomography in Scottish Blackface lambs. Genet. Sel. Evol. 2016, 48, 11. [Google Scholar] [CrossRef]
  50. He, S.; Di, J.; Han, B.; Chen, L.; Liu, M.; Li, W. Genome-Wide Scan for Runs of Homozygosity Identifies Candidate Genes Related to Economically Important Traits in Chinese Merino. Animals 2020, 10, 524. [Google Scholar] [CrossRef]
  51. Hu, L.; Xiao, Y.; Xiong, Z.; Zhao, F.; Yin, C.; Zhang, Y.; Su, P.; Li, D.; Chen, Z.; Ma, X.; et al. MACF1, versatility in tissue-specific function and in human disease. Semin. Cell Dev. Biol. 2017, 69, 3–8. [Google Scholar] [CrossRef]
  52. Jiayuan, M.; Yujie, L.; Kuirong, C.; Siran, Z.; Wenjing, Q.; Lingli, F.; Xiaoxiao, L.; Liang, L.; Ganqiu, L.; Jing, L. Identifying selection signatures and runs of homozygosity for spine curvature in Chinese indigenous pigs. Anim. Genet. 2022, 53, 513–517. [Google Scholar] [CrossRef]
  53. Selionova, M.; Aibazov, M.; Mamontova, T.; Malorodov, V.; Sermyagin, A.; Zinovyeva, N.; Easa, A.A. Genome-wide association study of live body weight and body conformation traits in young Karachai goats. Small Rumin. Res. 2022, 216, 106836. [Google Scholar] [CrossRef]
  54. Xiao, P.; Goodarzi, P.; Pezeshki, A.; Hagen, D.E. RNA-seq reveals insights into molecular mechanisms of metabolic restoration via tryptophan supplementation in low birth weight piglet model. J. Anim. Sci. 2022, 100, 106836. [Google Scholar] [CrossRef] [PubMed]
  55. Tan, L.J.; Li, X.H.; Li, G.G.; Hu, Y.; Chen, X.D.; Deng, H.W. Identification of novel pleiotropic gene for bone mineral density and lean mass using the cFDR method. Ann. Hum. Genet. 2021, 85, 201–212. [Google Scholar] [CrossRef] [PubMed]
  56. Zhang, W.; Li, J.; Guo, Y.; Zhang, L.; Xu, L.; Gao, X.; Zhu, B.; Gao, H.; Ni, H.; Chen, Y. Multi-strategy genome-wide association studies identify the DCAF16-NCAPG region as a susceptibility locus for average daily gain in cattle. Sci. Rep. 2016, 6, 38073. [Google Scholar] [CrossRef]
  57. van den Berg, I.; Hayes, B.J.; Chamberlain, A.J.; Goddard, M.E. Overlap between eQTL and QTL associated with production traits and fertility in dairy cattle. BMC Genom. 2019, 20, 291. [Google Scholar] [CrossRef]
  58. Carson, A.R.; Scherer, S.W. Identifying concerted evolution and gene conversion in mammalian gene pairs lasting over 100 million years. BMC Evol. Biol. 2009, 9, 156. [Google Scholar] [CrossRef]
  59. Hanson, J.; Brezavar, D.; Hughes, S.; Amudhavalli, S.; Fleming, E.; Zhou, D.; Alaimo, J.T.; Bonnen, P.E. TAB2 variants cause cardiovascular heart disease, connective tissue disorder, and developmental delay. Clin. Genet. 2022, 101, 214–220. [Google Scholar] [CrossRef]
  60. Lopez, P.H.; Aja, S.; Aoki, K.; Seldin, M.M.; Lei, X.; Ronnett, G.V.; Wong, G.W.; Schnaar, R.L. Mice lacking sialyltransferase ST3Gal-II develop late-onset obesity and insulin resistance. Glycobiology 2017, 27, 129–139. [Google Scholar] [CrossRef]
  61. Perez, É.S.; Cury, S.S.; Zanella, B.T.T.; Carvalho, R.F.; Duran, B.O.S.; Dal-Pai-Silva, M. Identification of Novel Genes Associated with Fish Skeletal Muscle Adaptation during Fasting and Refeeding Based on a Meta-Analysis. Genes 2022, 13, 2378. [Google Scholar] [CrossRef]
  62. Zhang, D.; Ran, J.; Li, J.; Yu, C.; Cui, Z.; Amevor, F.K.; Wang, Y.; Jiang, X.; Qiu, M.; Du, H.; et al. miR-21-5p Regulates the Proliferation and Differentiation of Skeletal Muscle Satellite Cells by Targeting KLF3 in Chicken. Genes 2021, 12, 814. [Google Scholar] [CrossRef]
  63. Edwards, S.M.; Sørensen, I.F.; Sarup, P.; Mackay, T.F.; Sørensen, P. Genomic Prediction for Quantitative Traits Is Improved by Mapping Variants to Gene Ontology Categories in Drosophila melanogaster. Genetics 2016, 203, 1871–1883. [Google Scholar] [CrossRef] [PubMed]
  64. MacLeod, I.M.; Bowman, P.J.; Vander Jagt, C.J.; Haile-Mariam, M.; Kemper, K.E.; Chamberlain, A.J.; Schrooten, C.; Hayes, B.J.; Goddard, M.E. Exploiting biological priors and sequence variants enhances QTL discovery and genomic prediction of complex traits. BMC Genom. 2016, 17, 144. [Google Scholar] [CrossRef] [PubMed]
  65. Zhang, Z.; Liu, J.; Ding, X.; Bijma, P.; de Koning, D.J.; Zhang, Q. Best linear unbiased prediction of genomic breeding values using a trait-specific marker-derived relationship matrix. PLoS ONE 2010, 5, e12648. [Google Scholar] [CrossRef] [PubMed]
Figure 1. (a) Figure indicates that there may be stratification in the population; (b) Figure indicates that LD gradually flattens out when the linkage disequilibrium is equal to 100 kb.
Animals 13 03516 g001
Figure 2. (a) represents the Manhattan plot in the genome-wide association studies (GWAS) results, and the starting point in the figure is around 10−3; (b) represents the QQ plot in the GWAS result, which sets the two threshold lines (red lines) of 0.05 and 1, respectively.
Animals 13 03516 g002
Table 1. Descriptive statistics of WT.
ItemNumberMeanSdMedianTrimmedMadMinMaxSe
All131044.794.3544.444.664.1532.658.60.12
Group 165544.724.3844.444.634.4533.457.80.17
Group 265544.864.3144.444.694.1532.658.60.17
Table 2. Gene list of single nucleotide polymorphisms (SNPs) associated with live weight in the 14th month.
TraitChrSNP NamePositionp-ValueGene NameGene Position
WT11_1370598213,705,9821.38 × 10−7MACF113,541,086–13,881,011
11_101812709101,812,7091.39 × 10−5SPRR4101,734,532–101,736,907
22_198504883198,504,8838.74 × 10−8ANKRD44198,238,519–198,479,012
33_4277318842,773,1883.76 × 10−6ACTR242,872,405–42,911,004
33_4277318842,773,1883.76 × 10−6SPRED242,708,519–42,827,598
33_176412255176,412,2556.67 × 10−6TRNAC176,470,024–176,470,095
33_176412255176,412,2556.67 × 10−6SYN3175,963,647–176,440,791
66_3721154637,211,5461.65 × 10−5DCAF1637,199,219–37,211,835
66_3721154637,211,5461.65 × 10−5FAM184B37,061,089–37,179,847
66_3721154637,211,5461.65 × 10−5NCAPG37,179,188–37,257,373
66_3721154637,211,5461.65 × 10−5LCORL37,274,935–37,426,290
88_7335484773,354,8471.29 × 10−5TAB273,362,589–73,448,254
1414_10788881,078,8885.70 × 10−7SF3B3957,834–996,615
1414_10788881,078,8885.70 × 10−7COG4996,835–1,022,199
1414_10788881,078,8885.70 × 10−7FUK1,022,451–1,036,935
1414_10788881,078,8885.70 × 10−7ST3GAL21,052,461–1,101,237
1414_10788881,078,8885.70 × 10−7DDX19A1,110,280–1,128,800
1414_10788881,078,8885.70 × 10−7AARS1,165,135–1,185,981
1515_5654478256,544,7822.56 × 10−6BDNF56,424,495–56,488,905
1616_3520731235,207,3122.49 × 10−6FYB35,105,425–35,282,410
2121_4598053745,980,5372.96 × 10−9CCND146,064,385–46,074,757
2626_499128499,1282.22 × 10−6DLGAP2279,898–905,775
Table 3. Genetic parameters of group 1.
Prior Marker InformationMatrixGenetic VarianceEnvironmental
Variance
HeritabilityWeightPrediction
Accuracy
Promotion
-G5.42710.7510.335-0.154 (0.03)-
Top 5%G12.70213.3080.1690.333--
G25.41810.7640.3350.667--
G34.84011.2290.301-0.158 (0.03)+2.59%
Top 10%G14.03512.0130.2510.434--
G25.25610.9150.3250.566--
G35.33110.7670.331-0.165 (0.02)+7.14%
Top 15%G14.05211.9920.2530.436--
G25.23610.9330.3240.564--
G35.30110.8000.329-0.164 (0.03)+6.49%
Top 20%G14.78611.3190.2970.483--
G25.12911.0330.3170.517--
G35.49310.6260.341-0.166 (0.03)+7.79%
Table 4. Genetic parameters of group 2.
Prior Marker InformationMatrixGenetic VarianceEnvironmental
Variance
HeritabilityWeightPrediction
Accuracy
Promotion
-G6.17610.3510.374-0.190 (0.02)-
Top 5%G14.46311.9600.2720.428--
G25.96810.5420.3610.572--
G36.29610.1740.382-0.201 (0.02)+5.79%
Top 10%G14.68811.7400.2850.438--
G26.01210.5030.3640.562--
G36.05710.3400.368-0.188 (0.02)−1.05%
Top 15%G14.96911.4750.3020.452--
G26.02710.4890.3650.548--
G36.06010.3960.368-0.184 (0.02)−3.15%
Top 20%G15.28811.1940.3210.469--
G25.98610.5230.3630.531--
G36.13910.3300.373-0.185 (0.02)−2.63%
Disclaimer/Publisher’s Note: The statements, opinions and data contained in all publications are solely those of the individual author(s) and contributor(s) and not of MDPI and/or the editor(s). MDPI and/or the editor(s) disclaim responsibility for any injury to people or property resulting from any ideas, methods, instructions or products referred to in the content.

