Simple Summary
Skeletal muscle satellite cells can be induced to differentiate into various cells under different conditions. The manipulation of adipogenesis during the stage critical for intramuscular adipocyte formation is expected to enhance marbling. However, oleic acid is a crucial player in regulating lipid metabolism and the formation of intramuscular marbling. In this study, the effects of different oleic acid concentrations on adipogenesis-induced differentiation of skeletal muscle satellite cells in vitro were selected. The results showed that oleic acid treatment could induce lipid droplet formation in the Yanbian bovine satellite cells. The expression of genes related to adipogenesis and fatty acid metabolism was upregulated, whereas that of genes related to muscle formation was downregulated. Oleic acid can induce Yanbian bovine star cells and promote cell lipid transdifferentiation.
Abstract
Skeletal muscle satellite cells have the ability to differentiate into various cells under different conditions. This study aimed to investigate the effects of different concentrations of oleic acid (50, 100, and 200 µmol/L) on the process of lipogenic transdifferentiation in Yanbian bovine satellite cells, as well as its molecular regulatory mechanism. After inducing differentiation with oleic acid for 96 h, it was observed that the addition of oleic acid resulted in the formation of lipid droplets in the bovine satellite cells, and the triglyceride content showed a dose-dependent relationship with the concentration of OA. qPCR results demonstrated a significant downregulation of myogenesis-related factors (Pax3 and MyoD) and upregulation of lipogenesis-related factors (C/EBP-β and PPARγ) (p < 0.05). Fatty acid metabolism-related factors, SCD and PLIN2, were also significantly upregulated (p < 0.05). These finding were consistent with the results obtained from Western blotting. Transcriptome sequencing analysis identified 278 differentially expressed genes between the control group and the groups treated with OA. KEGG enrichment analysis showed that differentially expressed genes were mainly concentrated in the adenosine monophosphate-activated protein kinase signaling pathway and fatty acid metabolic pathway. Our study presents that the OA induction of Yanbian bovine skeletal muscle satellite cells can promote cellular lipid transdifferentiation and reveals the potential genes and pathways related to OA induction of these satellite cells.
1. Introduction
In recent years, high-end marbled beef has been increasingly recognized by the public. The increase in intramuscular fat content results in beef with a snowflake-like appearance, enhancing the taste by making the beef tender and juicy. Intramuscular fat deposition (marbling) is a trait regulated by multiple factors, and genes play a decisive role in the composition distribution of the beef [1]. Therefore, the study of the molecular mechanisms of intramuscular fat deposition in beef has become a hot topic. Skeletal muscle satellite cells, as multipotent stem cells, can be induced to differentiate into various cells under different conditions. Studies have shown that skeletal muscle and adipose tissue development often have reciprocal relationships, where muscle satellite cells can be induced to transdifferentiate into mature adipocytes through the ectopic expression of adipogenic differentiation factors [2]. Oleic acid (C18:1 n-9, OA) is the most representative monounsaturated fatty acid in beef. OA is a critical regulator of lipid metabolism and intramuscular marbling formation. OA also regulates lipid metabolism, is integrated in the membrane structure, and is directly involved in the fatty acid composition of membrane phospholipids. It regulates the structural properties of phosphatidylethanolamine (PE) membranes differently than its counterparts trans-monoenoate (18:1 trans-∆9) and stearate (18:0) [3]. OA influences the transport and receptor activity of many enzymes, and the desaturation of essential fatty acids. OA can increase adipocyte intracellular fat content and fatty acid synthase activity and promote lipoprotein lipase expression [4,5,6]. Smith et al. reported [7] that intramuscular fat content is closely and positively correlated with OA content, but the exact action mechanism is unknown. that is, higher OA content is associated with higher intramuscular fat content in beef adipose tissue. Studies in our laboratory have found that OA promotes lipid droplet formation in skeletal muscle satellite cells and precursor adipocytes of Yanbian cattle. Therefore, we here used the established Yanbian bovine skeletal muscle satellite cells as a model to investigate the effect of OA on the lipogenic differentiation of these satellite cells. Meanwhile, lipogenic differentiation pathway-related genes in the satellite cells were screened and analyzed through bioinformatics by using transcriptome sequencing. These DEGs were annotated and enriched to provide a molecular theoretical basis for investigating the molecular regulation mechanism of the OA-induced lipogenic differentiation pathway in Yanbian bovine skeletal muscle satellite cells and to further elucidate the molecular mechanism of the PLIN2 gene in lipogenesis.
2. Materials and Methods
2.1. Induction of Differentiation of Yanbian Bovine Skeletal Muscle Satellite Cells
This experiment used the Yanbian bovine skeletal muscle satellite cells that had been identified and preserved by the Engineering Research Center of the Ministry of Education for Science and Technology Innovation of Beef Cattle in the Northeast Cold Region of Yanbian University. The liquid-nitrogen-preserved cells were revived, inoculated in cell culture flasks, and incubated at 37 °C with 5% CO2 in an incubator. The cell basal culture medium was changed every 24 h. After the growth density of the cells reached 80%, they were digested with 0.25% trypsin and added to eight 6-well plates, divided into four groups. Complete culture medium was added to each well to continue the culture. When the density of the 6-well plates reached 90%, the culture medium was aspirated. The cells were washed twice with PBS containing 1% PS. The differentiation medium containing different OA concentrations, prepared in advance, was added to induce lipogenic differentiation. The cultures were washed twice with PBS containing 1% PS. A blank control group (CON, 2% HS), a 50 µM OA treatment group (OAL, 2% HS + 50 µM OA), a 100 µM OA treatment group (OAM, 2% HS + 100 µM OA), and a 200 µM OA treatment group (OAH, 2% HS + 200 µM OA) were established. The differentiation medium was changed every 48 h in two 6-well plates for each treatment. After 96 h of differentiation, the cells and culture medium were collected for subsequent experiments.
This experiment was initially designed to culture bovine satellite cells (BSCs) for 6 days. At 6 days, most BSCs were filled with lipid droplets after OA induction. However, the culture medium had to be changed very carefully and gently after 4 days. This is because most cells containing lipid droplets become fragile and the droplets easily break the cell membrane, come out of the cells, and float on the surface of the culture wells, thereby making it difficult to collect intact cells containing lipid droplets for oil red O staining. Therefore, we harvested the BSCs on day 4 for Oil Red O staining and the subsequent experiments.
2.2. Measurement Index and Method
Following the induction of differentiation of the satellite cells for 96 h, cell size and viability determination, oil red O staining, lipid droplet area analysis, triglyceride content determination, and the related gene expression assay were performed, and three replicates were established for each index to be measured.
2.3. Cell Size and Viability
The effect of OA on the satellite cells was evaluated by measuring cell size and viability by using the Taipan blue staining method. Oil red O staining and lipid droplet area analysis were performed to determine whether the cells were differentiated in the direction of lipogenesis. These two analyses were performed according to the instructions of the oil red O staining kit.
2.4. Triglyceride Concentration Measurement
The concentration of triacylglycerol (TAG) was measured using a TAG Quantitative Assay Kit (Applygen, Beijing, China) according to the manufacturer’s instructions. After 96 h of differentiation, the BSCs were washed with PBS to remove the medium, and the cells were lysed with Radio-ImmunoPrecipitation Assay lysis solution at ambient temperature for 10 min. Lipase decomposes TAG in cell lipid droplets to release glycerol, and the amount of glycerol released is measured through spectrophotometric detection at 570 nm.
2.5. Determination of Lipocalin (ADP) Content
ADP (Adiponectin) is an endogenous bioactive peptide or protein secreted by adipocytes. ADP content can be used as an index for identifying lipogenic differentiation. After 96 h of differentiation of the satellite cells, ADP content was determined using an Millibo bovine lipocalin enzyme-linked immunoassay kit and by referring to Li et al.’s method [8]. A standard curve was plotted to calculate the sample content, and GraphPad Prism 6.07 software was used for the analysis and for creating the graph.
2.6. Quantitative Testing of Related Myogenic Lipogenic Genes
After 96 h of the OA-induced differentiation of BSCs, relevant myogenic lipogenic genes were quantified through real-time fluorescence quantitative PCR to observe the effect of OA on lipogenic differentiation of the Yanbian cattle satellite cells at the molecular level. GAPDH was used as an internal reference gene. Table 1 presents the relevant specific primers used.

Table 1.
Primer information.
2.7. Protein Immunoblotting (Western Blotting)
After 96 h of OA-induced differentiation, the culture fluid was aspirated. The cells were rinsed three times with PBS pre-cooled to 4 °C in advance. An appropriate amount of protein-efficient lysis solution containing PMSF was added to each well, and the cells were lysed at 4 °C for 5 min. The cells were scraped. Lysates were collected and shaken at 4 °C for 30 min to fully release proteins. The proteins were extracted from the supernatant after centrifugation at 4 °C, 12,000 r/min, for 10 min. The protein concentration was determined according to Themor’s kit instructions. Finally, electrophoresis, membrane transfer, antibody incubation, and immunoreactivity steps in the Azure 600 multifunctional imaging system were followed to obtain photos and perform the analysis.
2.8. Transcriptomic Sequencing (RNA-Seq) Analysis
In this experiment, to determine the differentially expressed genes (DEGs) of the satellite cells involved in OA-induced lipid transdifferentiation, the skeletal muscle satellite cells were induced with different OA concentrations for 96 h. The DEGs of the transcriptome before and after OA induction were compared to those of the control group through RNA-seq analysis. This comparison helped to find PLIN2 gene-related differentially expressed transcriptome information. This information will provide a theoretical basis for further analyzing the regulatory mechanism of the PLIN2 gene and the effect of OA on lipid droplet formation in the skeletal muscle satellite cells of Yanbian yellow cattle. High-throughput sequencing was performed, and the obtained results were analyzed by Aimer Genetics. The main steps included in the technical process of the RNA-seq analysis were mRNA library construction and sequencing. Total RNA was isolated and purified using TRIzol reagent (Invitrogen, Carlsbad, CA, USA) following the manufacturer’s procedure. The RNA amount and purity of each sample was quantified using a NanoDrop ND-1000 (NanoDrop, Wilmington, DE, USA). The RNA integrity was assessed using an Bioanalyzer2100 (Agilent, Santa Clara, CA, USA) with RIN number >7.0 and confirmed by electrophoresis with denaturing agarose gel. Poly (A) RNA is purified from 1 μg total RNA using Dynabeads Oligo (dT)25-61005 (Thermo Fisher, Waltham, CA, USA) using two rounds of purification. Then, the poly(A) RNA was fragmented into small pieces using the MagnesiumRNA Fragmentation Module (NEB, cat.e6150, Ipswich, MA, USA) under 94 °C 5–7 min. Then, the cleaved RNA fragments were reverse-transcribed to create the cDNA by SuperScript™II Reverse Transcriptase (Invitrogen, cat.1896649, Waltham, CA, USA), which were next used to synthesise U-labeled stranded DNAs with E. coli DNA polymerase I (NEB, cat.m0209, Ipswich, MA, USA), RNase H (NEB, cat.m0297, Ipswich, MA, USA), and dUTP Solution (Thermo Fisher, cat.R0133, Waltham, CA, USA). An A-base is then added to the blunt ends of each strand, preparing them for ligation to the indexed adapters. Each adapter contains a T-base overhang for ligating the adapter to the A-tailed fragmented DNA. Single- or dual-index adapters are ligated to the fragments, and size selection was performed using AMPureXP beads. After the heat-labileUDG enzyme (NEB, cat.m0280, Ipswich, MA, USA) treatment of the U-labeled double-stranded DNAs, the ligated products are amplified with PCR by the following conditions: initial denaturation at 95 °C for 3 min, 8 cycles of denaturation at 98 °C for 15 s, annealing at 60 °C for 15 s, and extension at 72 °C for 30 s, and then final extension at 72 °C for 5 min. The average insert size for the final cDNA library was 300 ± 50 bp. At last, we performed the 2 × 150 bp paired-end sequencing (PE150) using an Illumina Hiseq2000 (San Diego, CA, USA) following the vendor’s recommended protocol.
2.9. Statistical Analysis
The data were expressed as mean ± standard deviation, and the fluorescence quantitative PCR data were calculated using Microsoft Excel 2010 software with a 2−ΔΔCt mathematical model. One-way ANOVA and multiple comparisons were performed on the experimental data by using GraphPad Prism 6.07 software. p < 0.05 was considered statistically significant.
3. Results
3.1. Effect of Different OA Concentrations on the Size and Viability of Yanbian Cattle Skeletal Muscle Satellite Cells
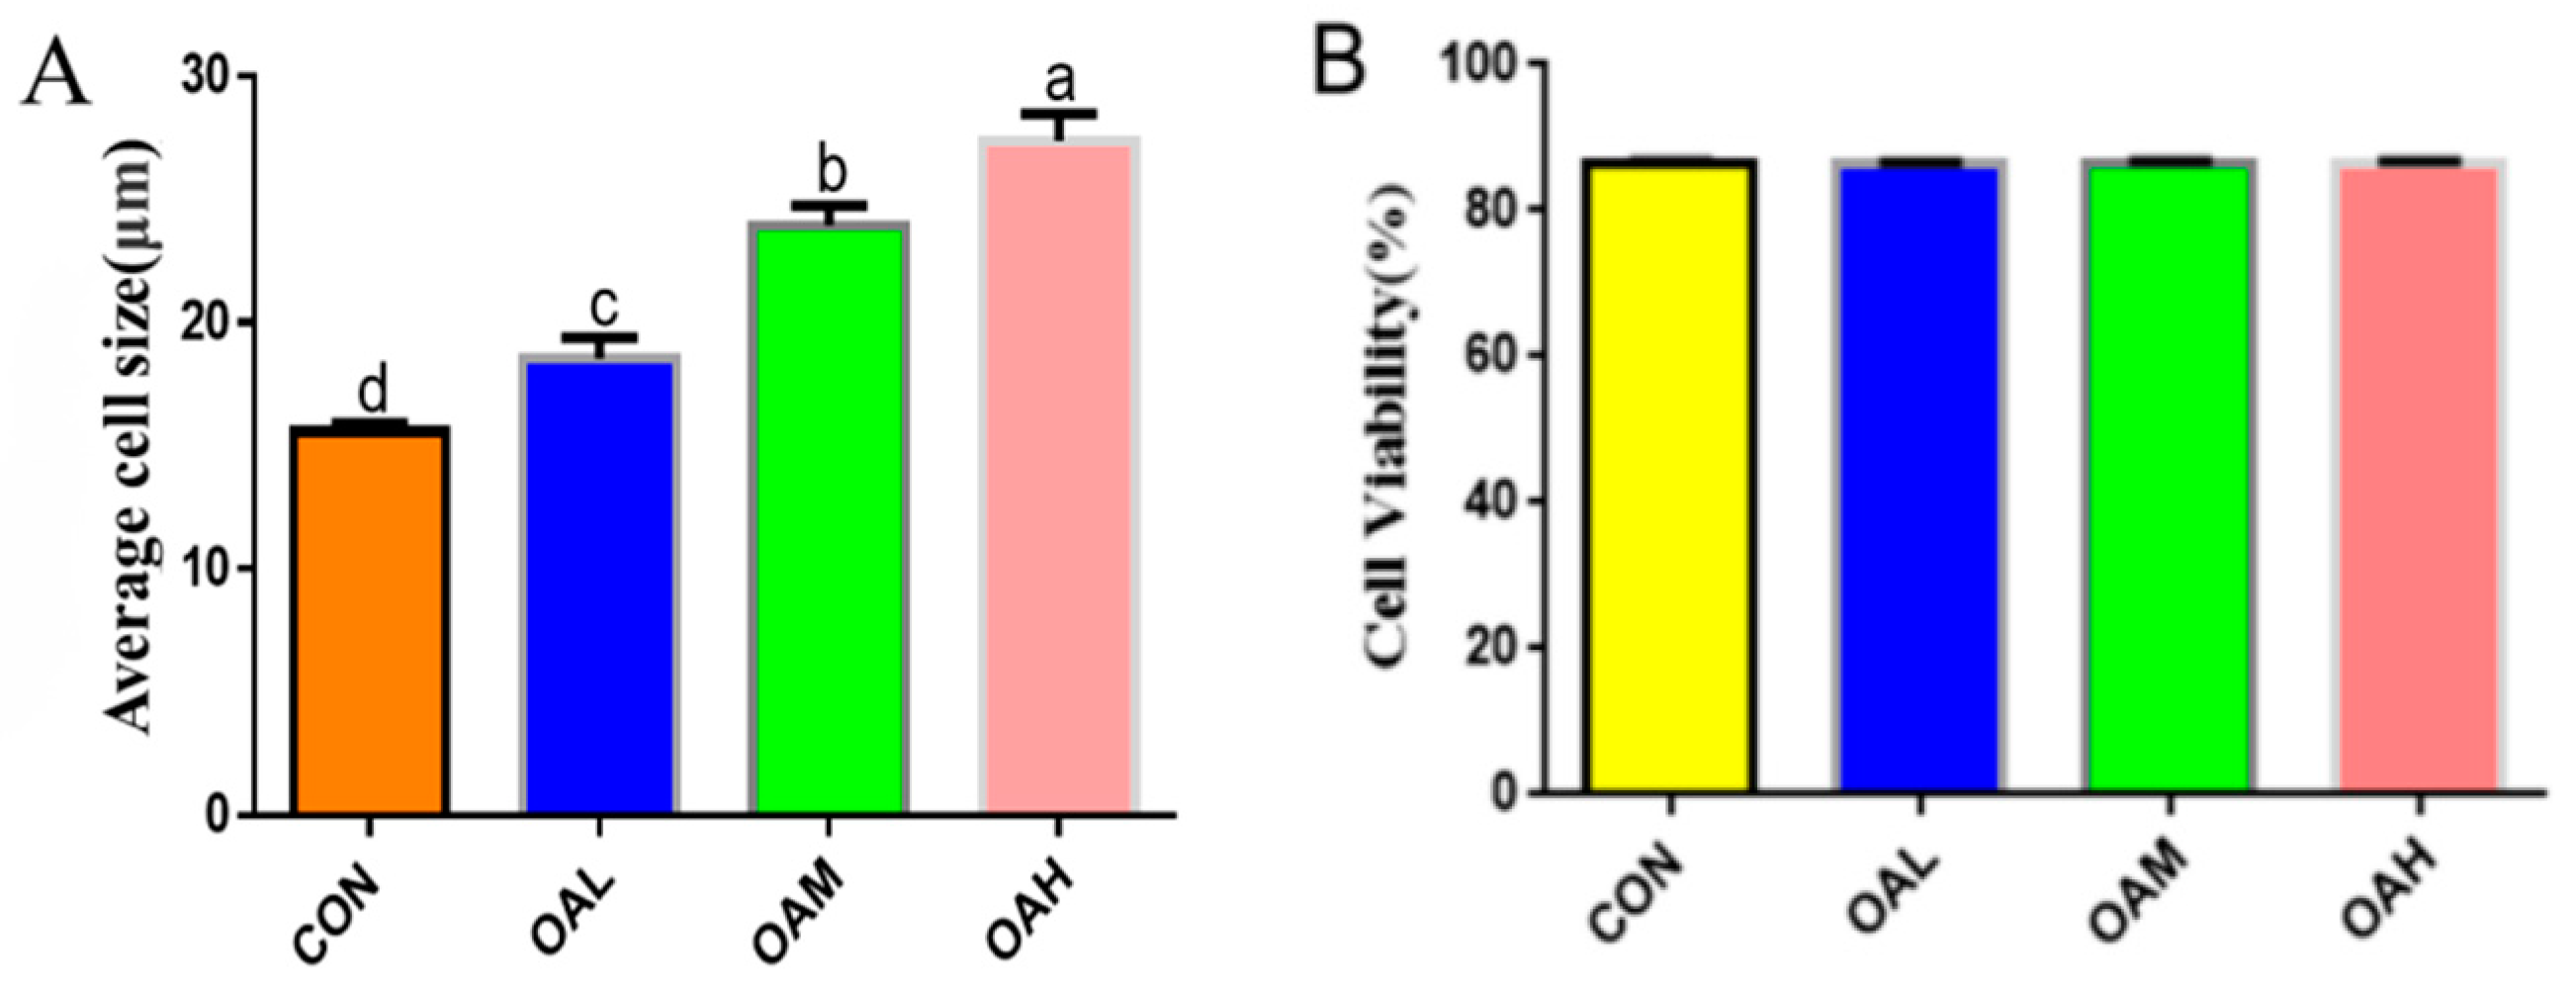
After 96 h of differentiation of the Yanbian skeletal muscle satellite cells induced by different OA concentrations, the effect of OA on the satellite cells was assessed by measuring the mean cell size and viability. The results revealed that the mean cell size was significantly increased in the OAL, OAM, and OAH groups (p < 0.05) compared to the CON group (Figure 1A), whereas no significant difference in cell viability (p > 0.05) was observed between the groups (Figure 1B).

Figure 1.
Effects of OA on the mean size (A) and cell viability (B) of BSC. Values with different superscript letters indicate significant difference (p < 0.05), whereas those with the same or no letter indicate that the difference is not significant (p > 0.05).
3.2. Effect of Different OA Concentrations on Lipid Droplet Formation in Yanbian Cattle Skeletal Muscle Satellite Cells
Bovine skeletal muscle satellite cells were treated with different concentrations of OA for 96 h, followed by Oil Red O staining of the treated and untreated cells. Intracellular lipid droplet generation is shown in Figure 2. The CON group exhibited obvious myotube formation, tight intercellular arrangement, and no lipid droplet generation (Figure 2). The induced group exhibited a large number of red lipid droplets around the nucleus, which became more obvious as the culture time was prolonged. Lipid droplet formation was accompanied by varying degrees of lipid droplet fusion.
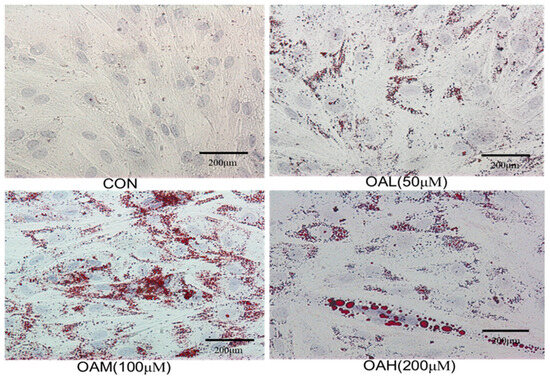
Figure 2.
Oil red O staining of cells in each group (×20).
3.3. Effect of Different OA Concentrations on Triglyceride Concentration and Lipid Droplet Area in Yanbian Cattle Skeletal Muscle Satellite Cells
Following 96 h of induction of the satellite cells with different OA concentrations, the triglyceride concentration and lipid droplet area in the cells were examined to observe the effect of OA on the lipogenic capacity of the skeletal muscle satellite cells. The triglyceride concentration (Figure 3A) and lipid droplet area (Figure 3B) of the induction groups were significantly different from those of the CON group (p < 0.05). The triglyceride concentration and lipid droplet area were also significantly different among the treatment groups (p < 0.05). They exhibited a dose-dependent relationship with the OA concentration, and changes in the triglyceride concentration and lipid droplet area were consistent with those of changes in OA concentrations.
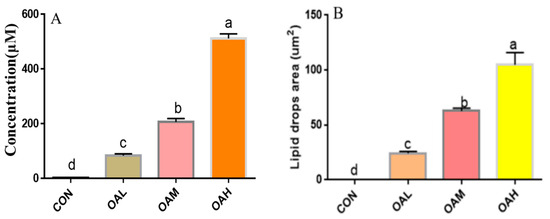
Figure 3.
Effect of OA on triglyceride concentration (A) and lipid droplet area (B) of BSCs. Values with different superscript letters indicate significant difference (p < 0.05), whereas those with the same or no letter indicate that the difference is not significant (p > 0.05).
3.4. Effect of Different OA Concentrations on the ADP Content of Yanbian Cattle Skeletal Muscle Satellite Cells
After 96 h of induction of the satellite cells with different OA concentrations, the cell cultures were collected for ADP content determination (Figure 4). ADP was produced in all treatment groups. Compared to the CON group, the ADP content was significantly increased in the induction groups (p < 0.05), and the difference among the induction groups was significant (p < 0.05).
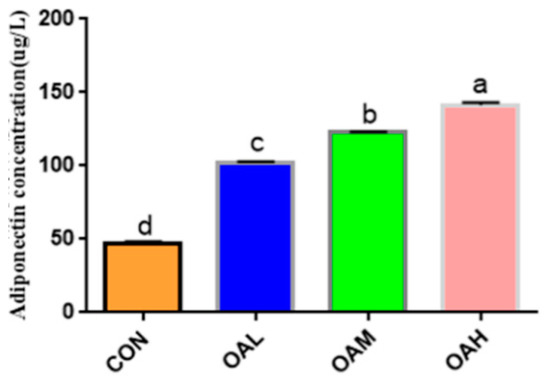
Figure 4.
Effect of OA on the formation of bovine adiponectin. Values with different superscript letters indicate significant difference (p < 0.05), whereas those with the same or no letter indicate that the difference is not significant (p > 0.05).
3.5. Effect of Different OA Concentrations on the Expression of Myogenic Lipogenic Genes in Yanbian Cattle Skeletal Muscle Satellite Cells
3.5.1. Different OA Concentrations Downregulated the Expression of Myogenic-Related Genes
After 96 h of OA induction, the expression of myogenic-related genes, Pax3, MyoD, MRF4, and Myf5, changed significantly (Figure 5). The expression of Pax3, MyoD, MRF4, and Myf5 genes was significantly downregulated in the OA-treated groups compared to the CON group (p < 0.05). Differences between the OAL, OAM, and OAH groups in the Pax3 gene were not significant (p > 0.05). Differences between the OAM group and the OAL and OAH groups in the MyoD gene were significant (p < 0.05), whereas those between the OAL and OAH groups were not significant (p > 0.05). Differences between the OAM group and the OAL and OAH groups in the MRF4 gene were not significant (p > 0.05), whereas those between the OAL and OAH groups were significant (p < 0.05). The difference between the OAL, OAM, and CON groups and the OAH group in the Myf5 gene was significant (p < 0.05), whereas that between the OAL and OAM groups and the CON and OAH groups was not significant (p > 0.05).
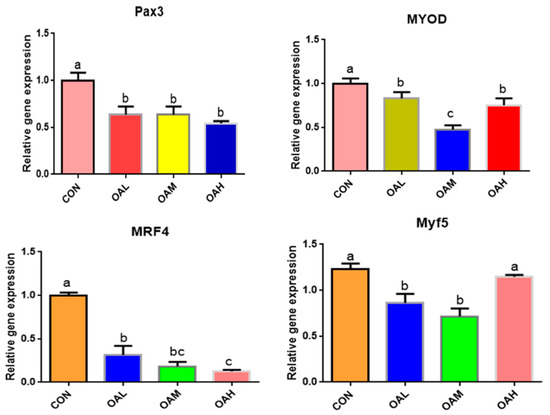
Figure 5.
Effects of OA on the expression of myogenic-related genes. Values with different superscript letters indicate significant difference (p < 0.05), whereas those with the same or no letter indicate that the difference is not significant (p > 0.05).
3.5.2. The Expression of Lipogenesis-Related Genes Was Upregulated by Different OA Concentrations
The expression of adipose differentiation genes, such as C/EBPα, C/EBPβ, PPARγ, and SREBP1, changed significantly after 96 h of OA-induced differentiation of the skeletal muscle satellite cells (Figure 6). Compared to the CON group, C/EBPα, C/EBPβ, PPARγ, and SREBP1 genes were significantly upregulated in the OA-treated groups (p < 0.05). The PPARγ gene was significantly different among the treatment groups (p < 0.05), exhibiting a measurement-dependent relationship. The C/EBPβ gene was significantly different between the OAH group and the OAL and OAM groups (p < 0.05), whereas the difference between the OAL and OAM groups was not significant (p > 0.05). The C/EBPα gene was significantly different among the treatment groups (p < 0.05). The SREBP1 gene was significantly different among the treatment groups (p < 0.05) but not between the OAL and CON groups (p > 0.05).
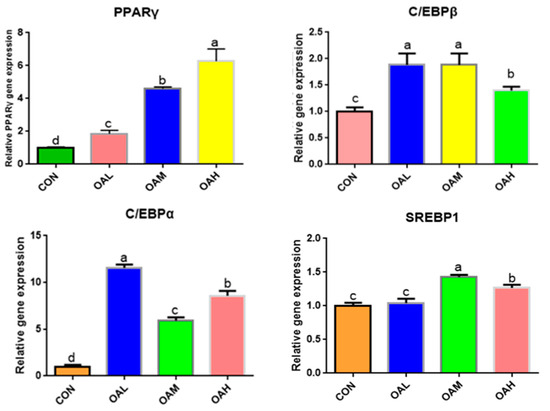
Figure 6.
Effect of OA on the expression of adipogenesis-related genes. Values with different superscript letters indicate significant difference (p < 0.05), whereas those with the same or no letter indicate that the difference is not significant (p > 0.05).
3.5.3. Expression of Fatty Acid-Associated Genes in Yanbian Cattle Skeletal Muscle Satellite Cells Treated with Different OA Concentrations
Among the fatty acid-related genes, the expression of SCD genes was significantly downregulated in the BSC cells after 96 h of OA induction (p < 0.05) in all OA-treated groups compared to the CON group (Figure 7). The differences were significant (p < 0.05) between the OAL group and the OAM and OAH groups, whereas those between the OAM and OAH groups were not significant (p > 0.05). The expression of PLIN2 genes was significantly upregulated (p < 0.05) among all treatment groups compared to the CON group (p < 0.05) and exhibited a measurement-dependent relationship.
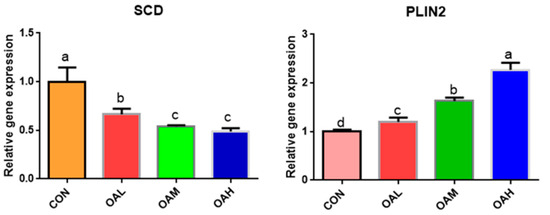
Figure 7.
Effect of OA on fatty acid-related gene expression. Values with different superscript letters indicate significant difference (p < 0.05), whereas those with the same or no letter indicate that the difference is not significant (p > 0.05).
3.6. Effects of Different OA Concentrations on the Expression of Proteins Associated with Yanbian Cattle Skeletal Muscle Satellite Cells
Following 96 h of induction with different OA concentrations, the protein expression levels of myogenic and lipogenic genes and the internal reference gene β-actin were detected through Western blotting. The results revealed that the expression of β-actin in the CON, OAL, OAM, and OAH groups was basically maintained at the same levels (Figure 8), which proved that the initial protein addition was consistent. Compared to the CON group, the protein expression levels of the lipogenesis-related genes PLIN2, C/EBPα and SREBP1 in the treatment groups exhibited an overall increasing trend, and those of the myogenesis-related genes, MyoG and MyoD, exhibited an overall decreasing trend. This was generally consistent with the trend of gene expression results.
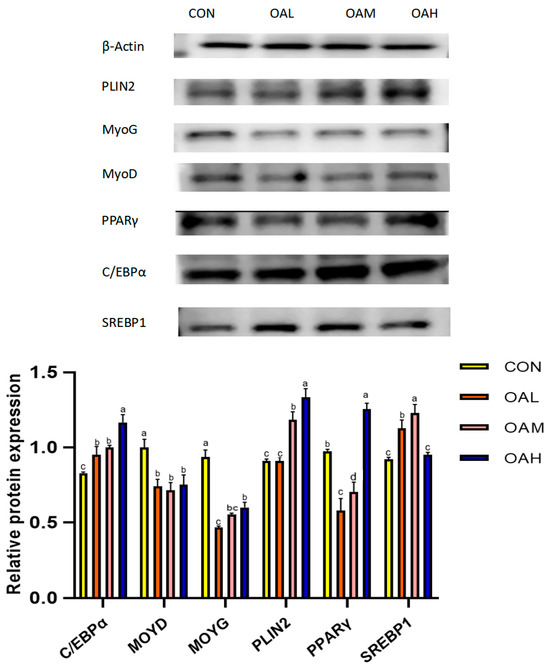
Figure 8.
Effects of OA on protein expression. The original Western blot images are included in the Supplementary Materials. Values with different superscript letters indicate significant difference (p < 0.05), whereas those with the same or no letter indicate that the difference is not significant (p > 0.05).
3.7. Analysis of Differential Genes Involved in the Effects of Different OA Concentrations on Lipogenic Differentiation of Yanbian Cattle Skeletal Muscle Satellite Cells
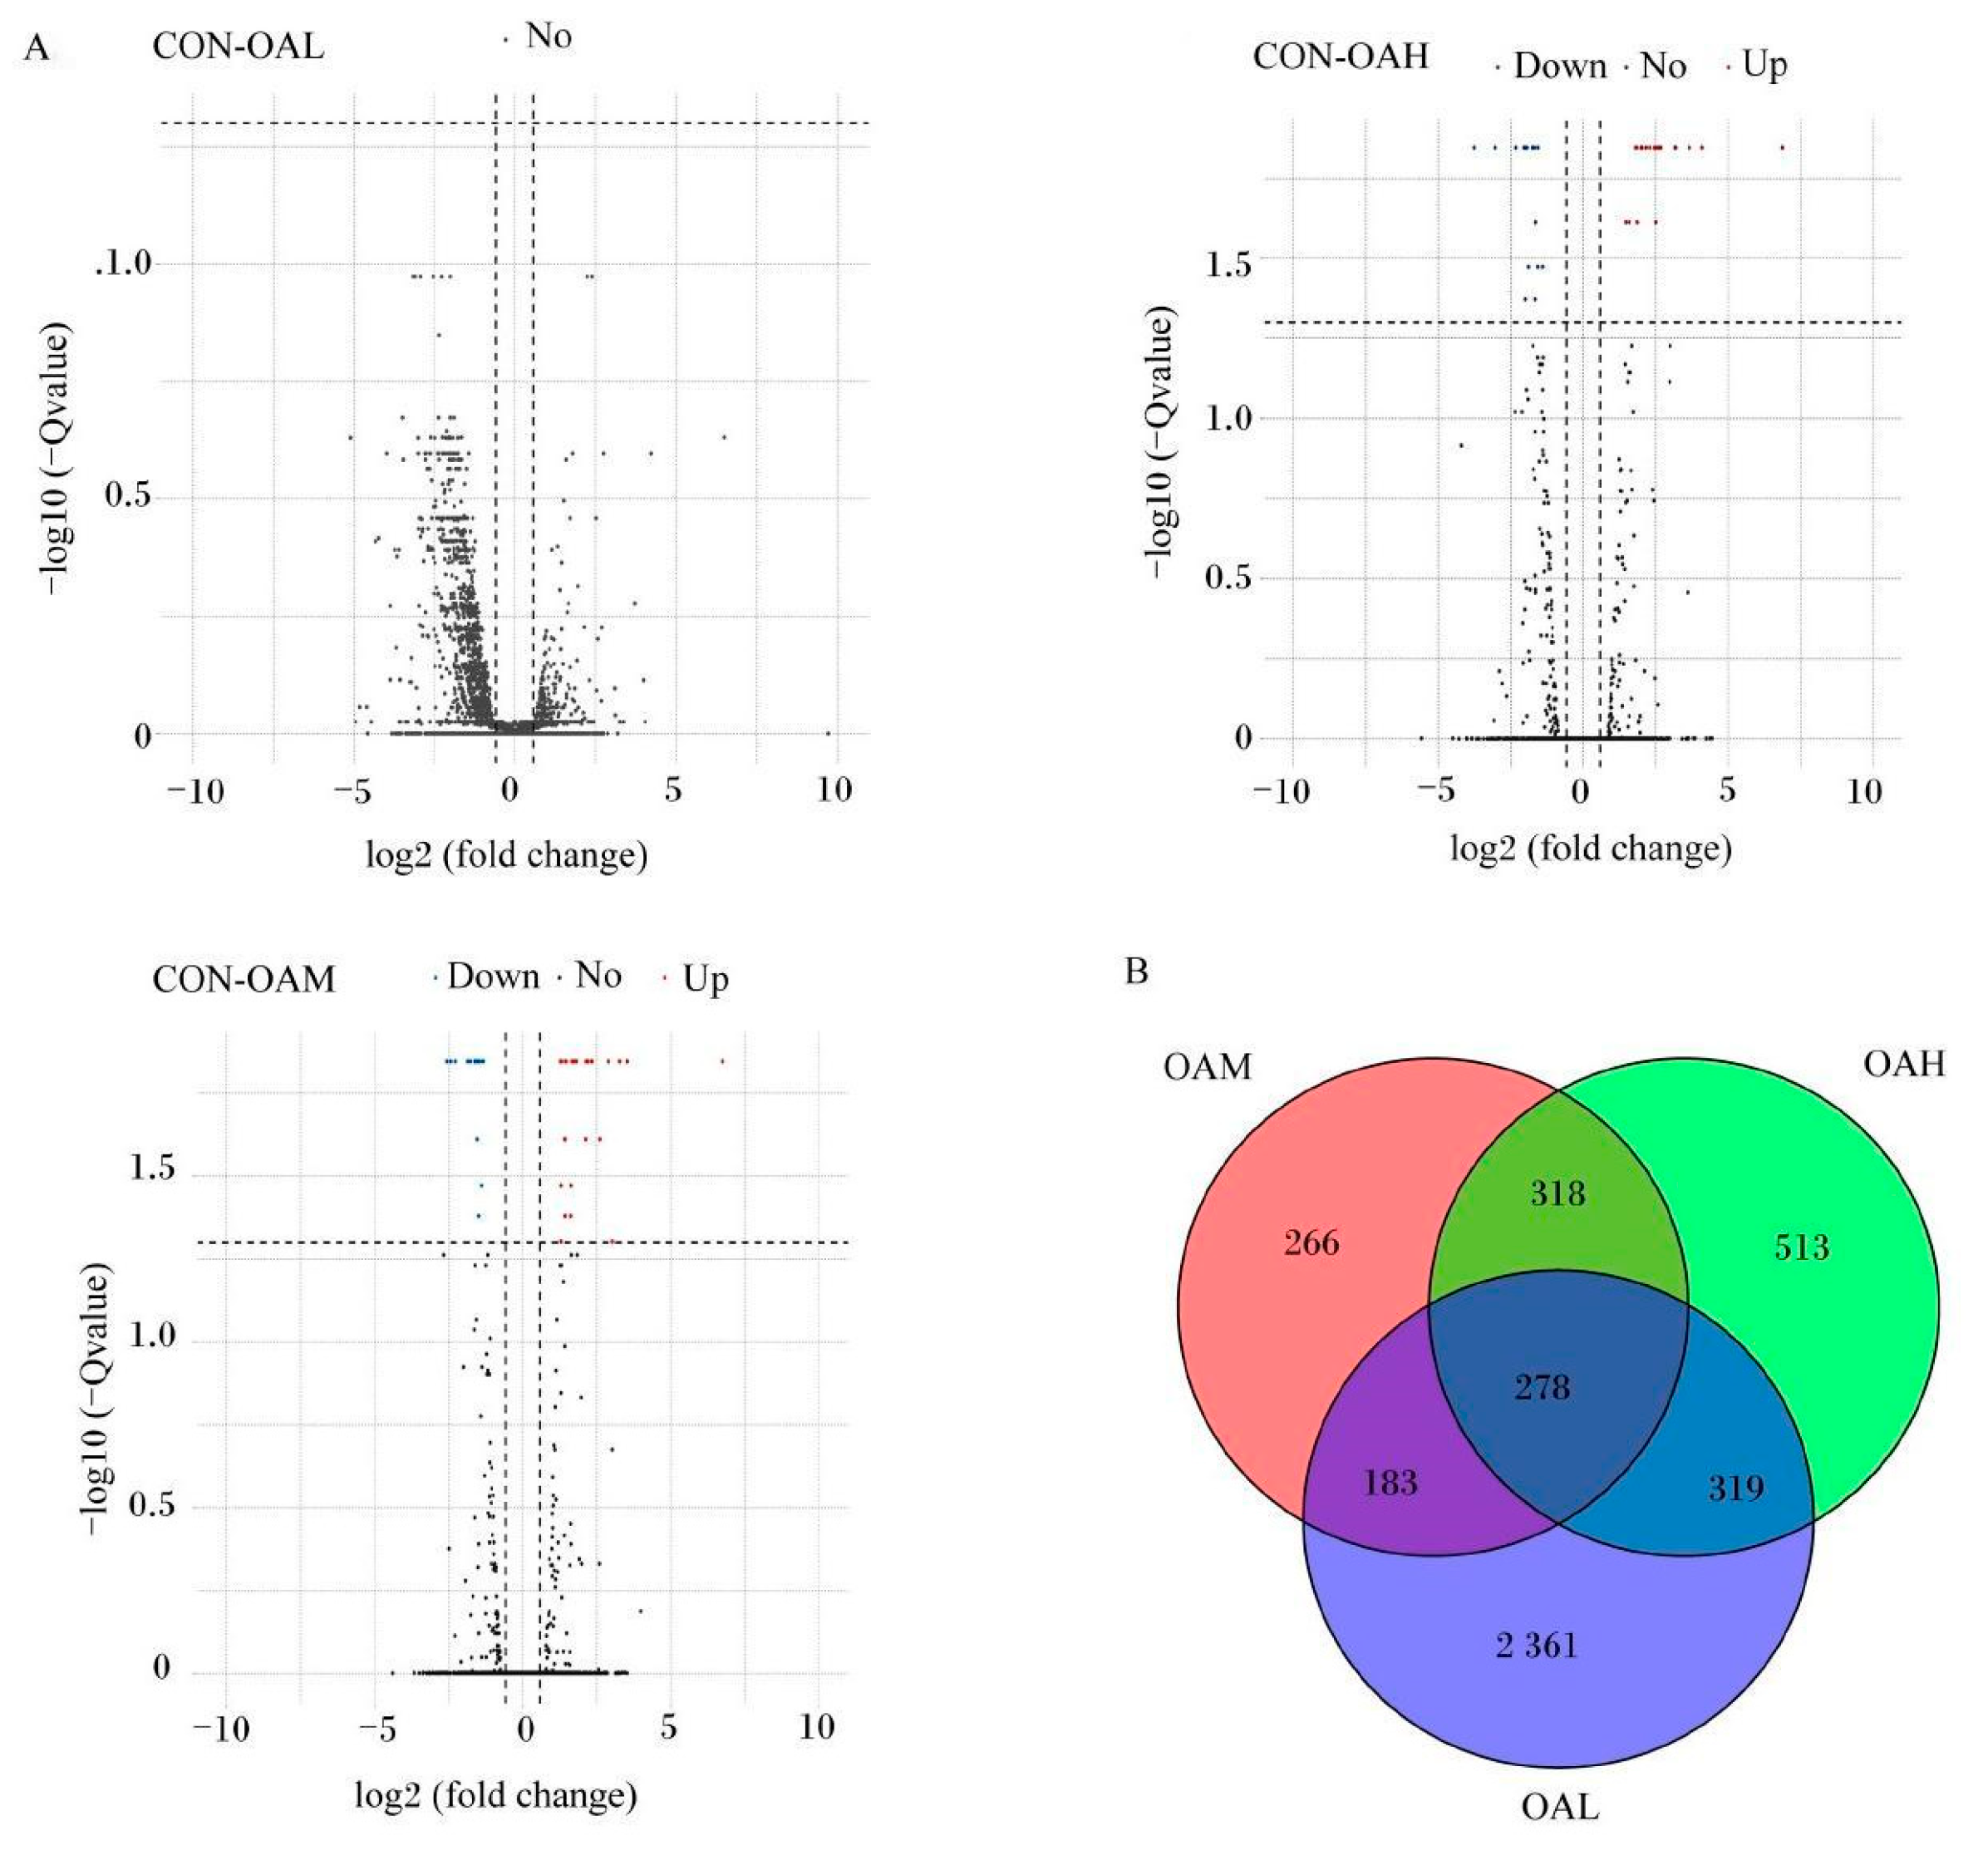
After 96 h of induction of the satellite cells by OA, results of the differential gene analysis (Figure 9A) revealed that, compared to the CON group, the OAL group had 3412 DEGs. Of them, 1168 genes were relatively upregulated, and 1973 genes were relatively downregulated. The OAM group had 1045 DEGs, of which 463 genes were relatively upregulated, and 582 genes were relatively downregulated. In the OAH group, 1428 DEGs were present, of which 704 genes were relatively upregulated, and 724 genes were relatively downregulated. As shown in the Wayne diagram, the combined analysis of these differential gene results revealed the presence of 278 DEGs in the satellite cells treated with different OA concentrations (Figure 9B). The clustering analysis revealed a clear pattern of differentially expressed gene grouping (Figure 10).
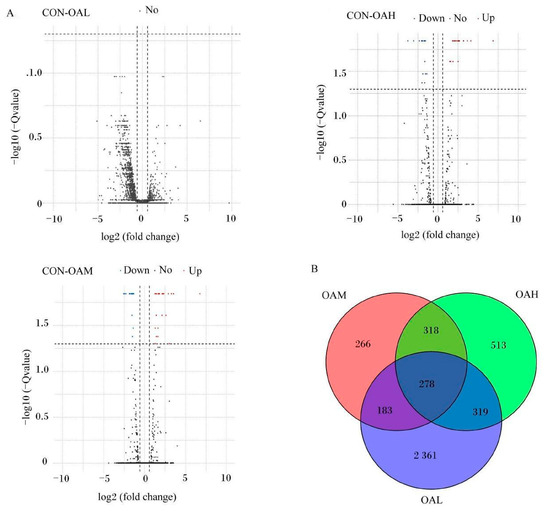
Figure 9.
DEGs induced by different OA concentrations. (A) is a volcano map of DEG analysis. Red dots represent upregulated genes, blue dots represent downregulated genes, and gray dots represent genes that have not changed significantly. (B) is a Venn diagram of DEGs.
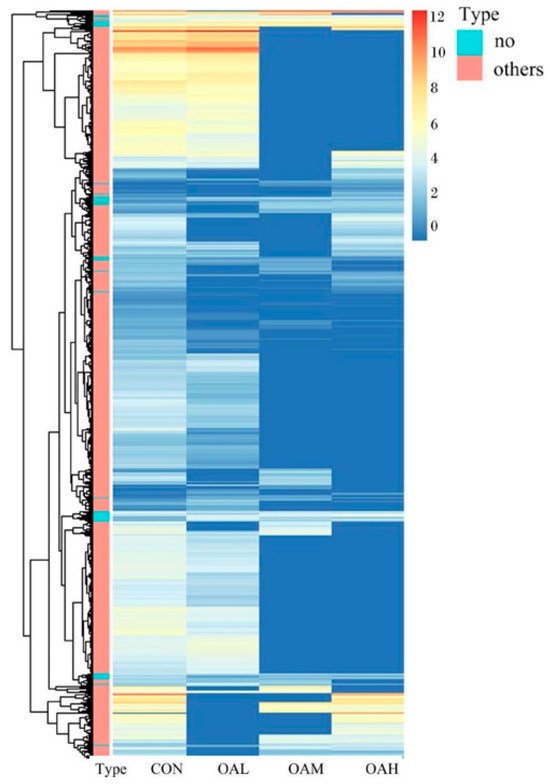
Figure 10.
Clustering heat map analysis of DEGs in satellite cells with different OA concentrations. In the figure, the abscissa represents different experimental groups, and the ordinate represents the differentially expressed proteins of the group. The color blocks at different positions represent the relative protein expression levels at the corresponding positions. Red represents high expression levels, and blue represents low expression levels.
3.8. Functional Analysis of DEG GO in Yanbian Bovine Skeletal Muscle Satellite Cells Treated with Different OA Concentrations
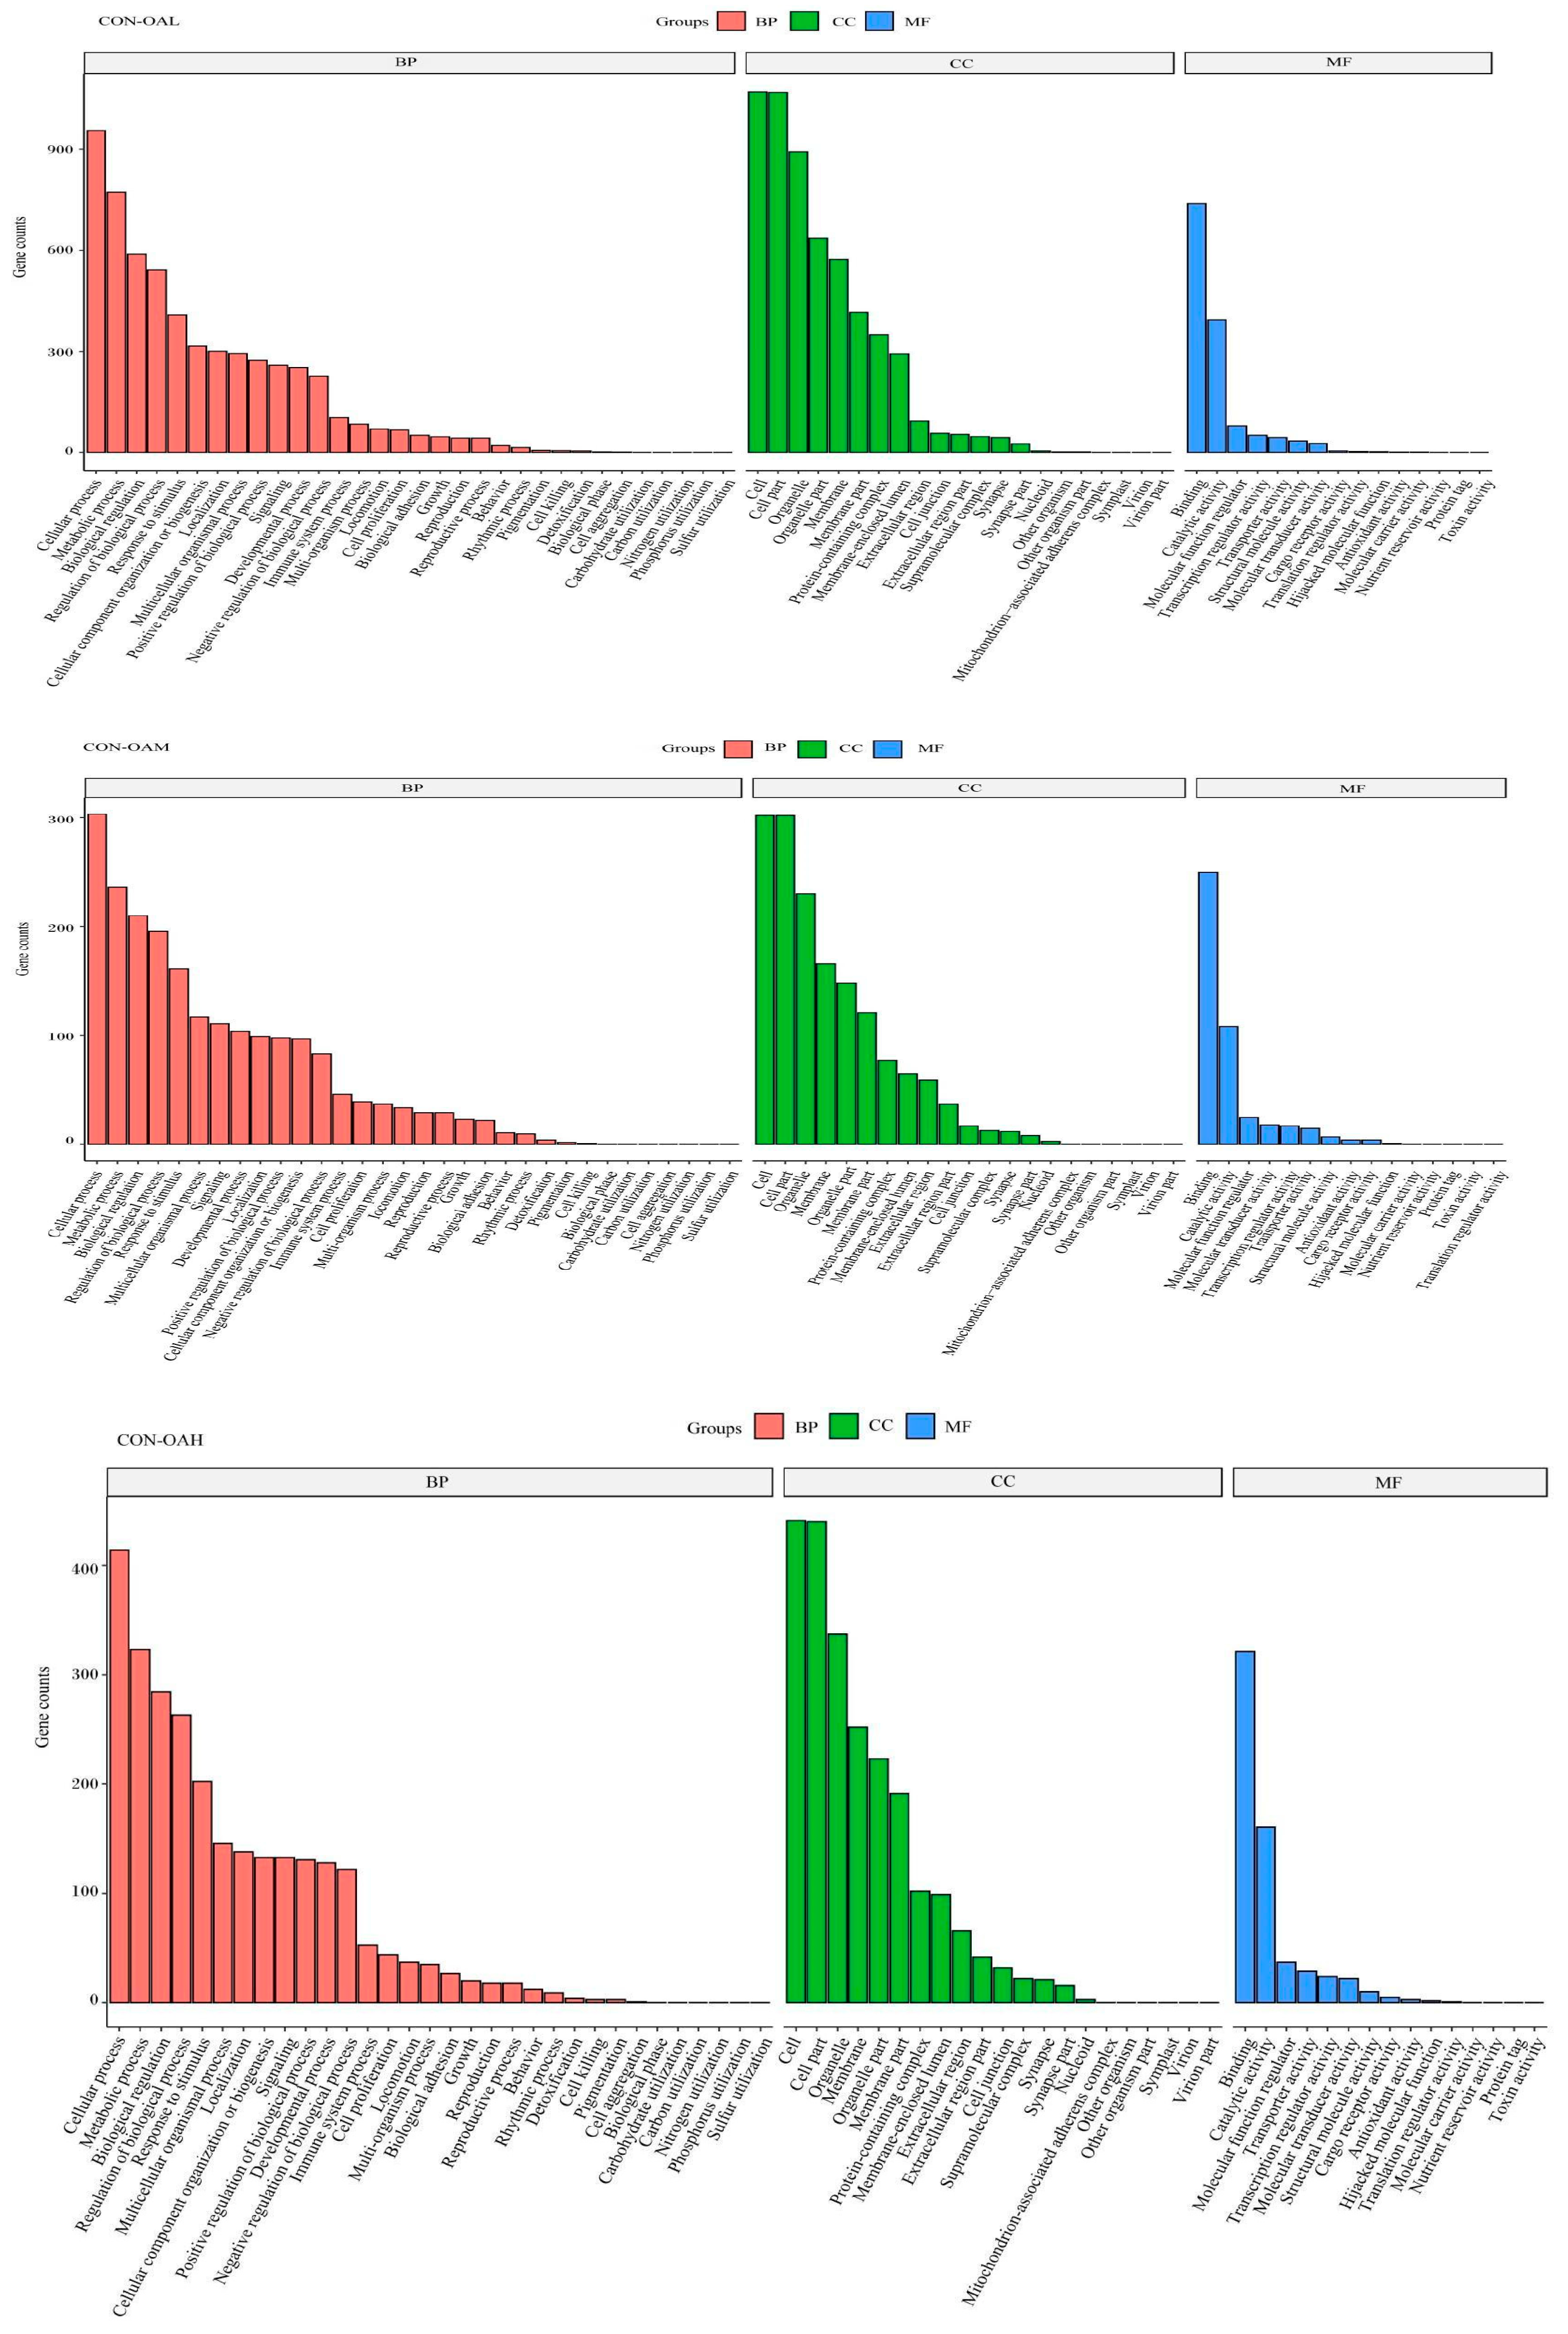
To explore the biological functions of these DEGs, the GO enrichment results of DEGs at different OA concentrations were analyzed. The GO terms were categorized into molecular functions (MFs), biological processes (BPs), and cellular components (CCs). The top 10 GO entries with the smallest p values, that is, the most significant enrichment, in each GO category were selected for display (Figure 11). Compared to the CON group, the DEGs in the treatment groups were involved in various biological processes, including cellular processes, metabolic processes, and bioregulatory processes. In the molecular function category, most gene functions were associated with binding activity, catalytic activity, and molecular function regulatory activity. Most genes in the cellular component category were enriched in cells, cell parts, and organelles.

Figure 11.
GO functional annotation classification of DEGs. The vertical axis represents the number of genes, and the horizontal axis represents the GO function annotation classification, from left to right.
3.9. KEGG Enrichment Analysis of DEG-Associated Pathways in Yanbian Cattle Skeletal Muscle Satellites Treated with Different OA Concentrations
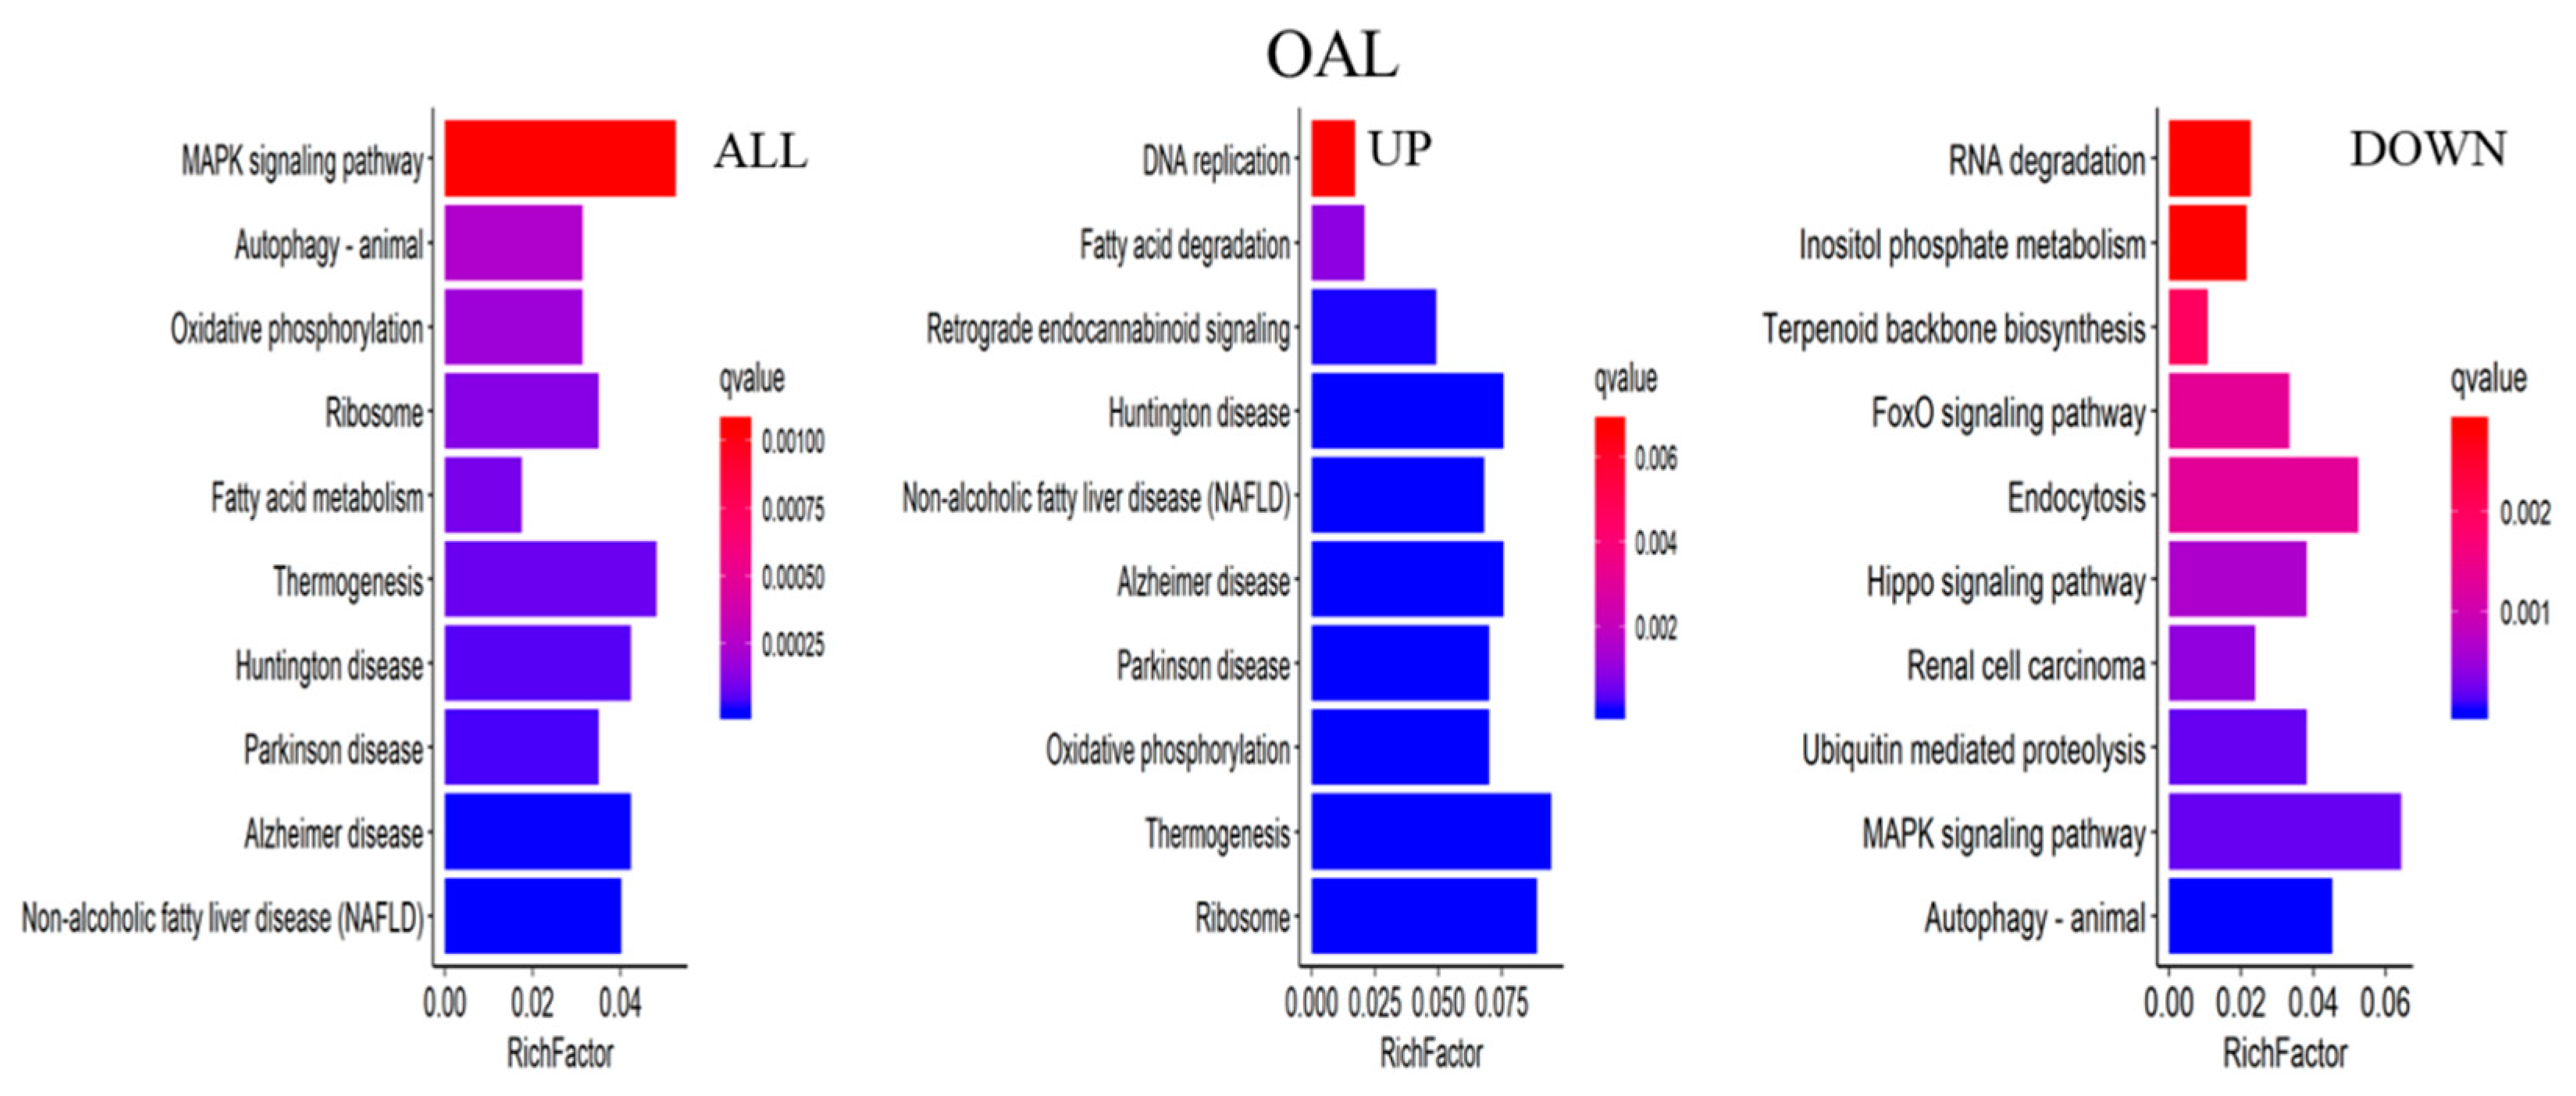
The major biochemical metabolic and signaling pathways associated with DEGs were explored through the KEGG enrichment analysis, and the top 10 enriched pathways were screened. Compared to the CON group, 1367 differential genes were annotated in the OAL group, which involved 86 pathways, and the most enriched pathways were the MAPK signaling pathway, thermogenic effect pathway, fatty acid metabolism pathway, etc. Among them, the 529 upregulated genes were mainly involved in the thermogenic effect pathway, ribosomal pathway, fatty acid degradation pathway, etc. The 838 downregulated genes were associated with the MAPK signaling pathway and cytokinesis pathway. In the OAM group, 444 genes were annotated, which involved 35 pathways, and the most enriched pathways were the PPAR signaling pathway, AMPK signaling pathway, fatty acid metabolism pathway, etc. Among them, the 203 upregulated genes were mainly involved in the PPAR signaling pathway, fatty acid degradation pathway, fatty acid metabolism pathway, etc. The 241 downregulated genes were mainly associated with the steroid biosynthesis pathway, PPAR signaling pathway, fatty acid metabolism pathway, etc. In the OAH group, 605 genes were annotated, which involved 57 pathways, and the most enriched pathways were the steroid biosynthesis pathway, MAPK signaling pathway, p53 signaling pathway, etc. Among them, the 289 upregulated genes were mainly associated with the p53 signaling pathway, fatty acid degradation pathway, MAPK signaling pathway, etc. The 316 downregulated genes were mainly involved in the steroid biosynthesis pathway, terpene skeleton biosynthesis, propionate metabolism pathway, etc. (Figure 12).
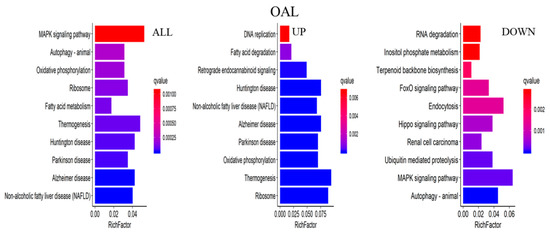
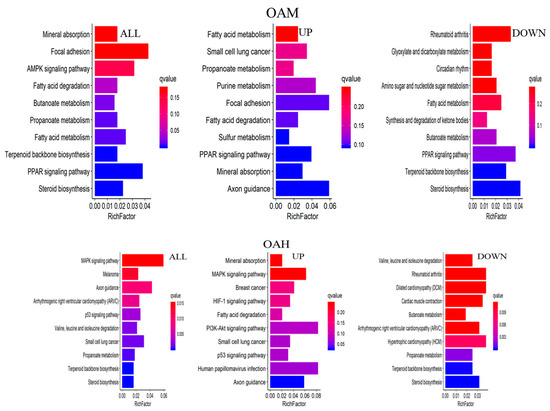
Figure 12.
KEGG enrichment analysis of genes. The horizontal axis represents the enrichment coefficient, and the vertical axis represents the name of the pathway. The figure presents all the DEGs, the upregulated genes, and the top 10 signal pathways of the downregulated genes induced by different OA concentrations.
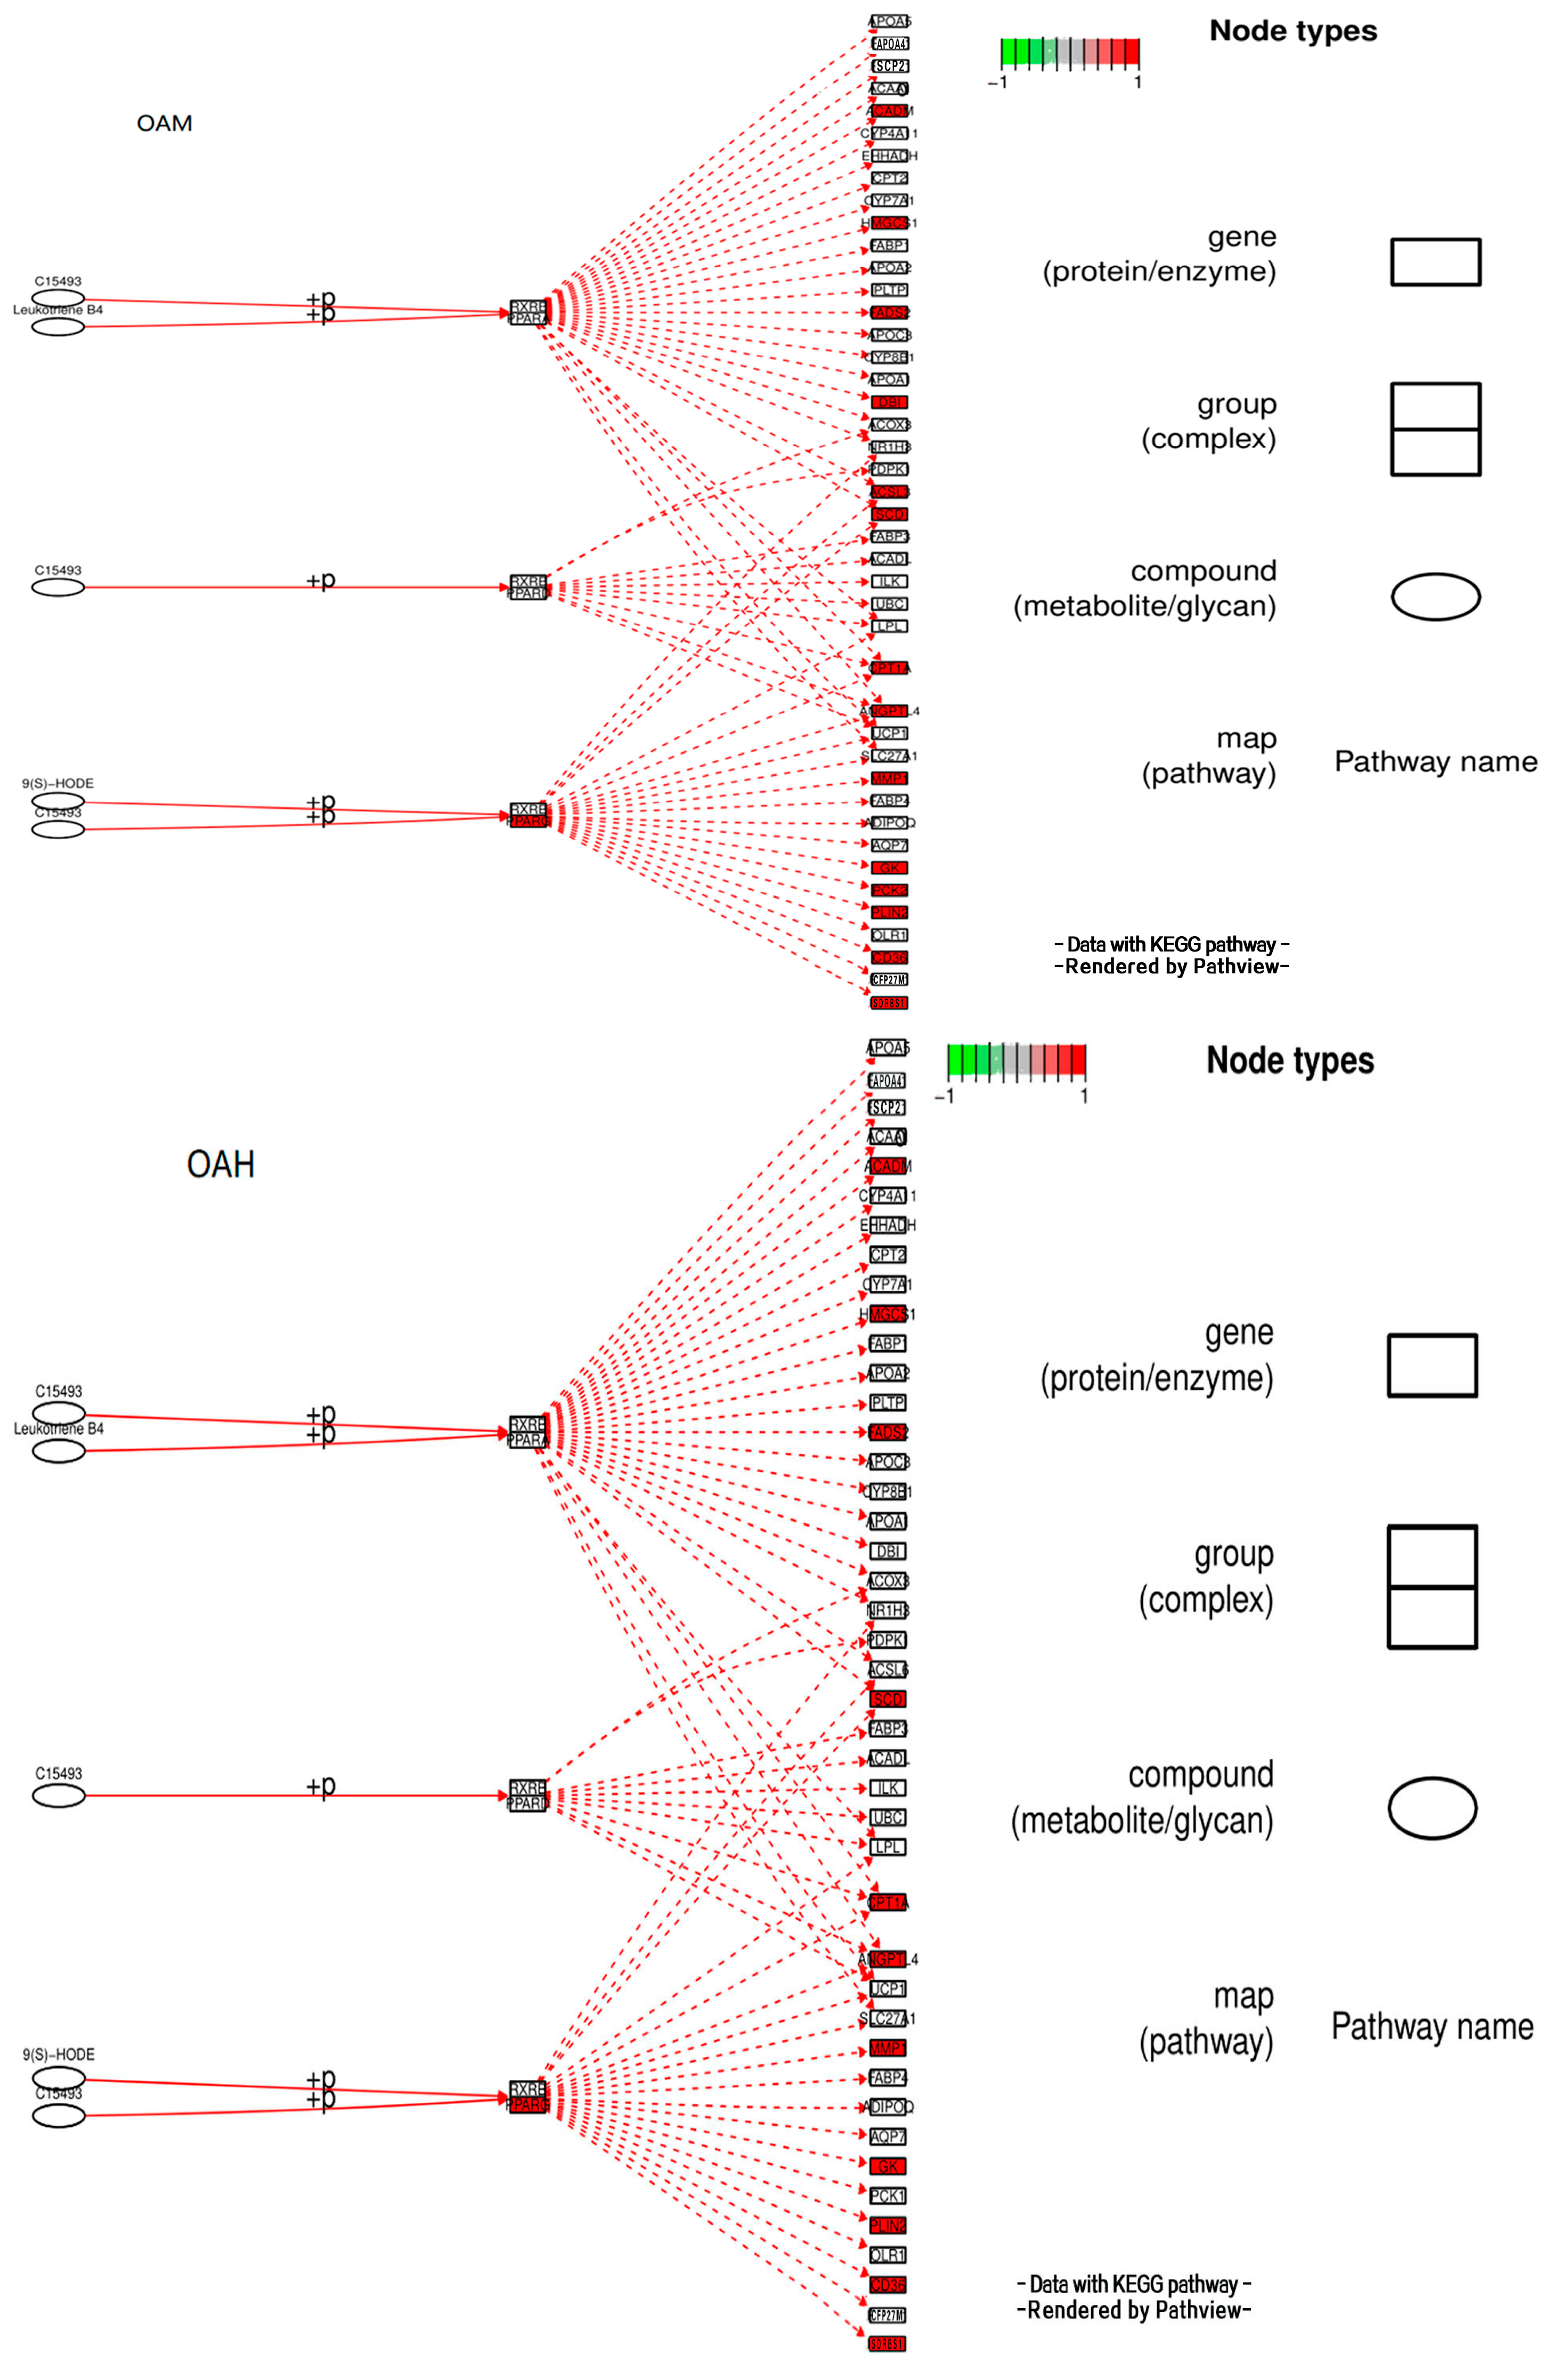
3.10. Analysis of the Signaling Pathway of the PLIN2 Gene in Yanbian Cattle
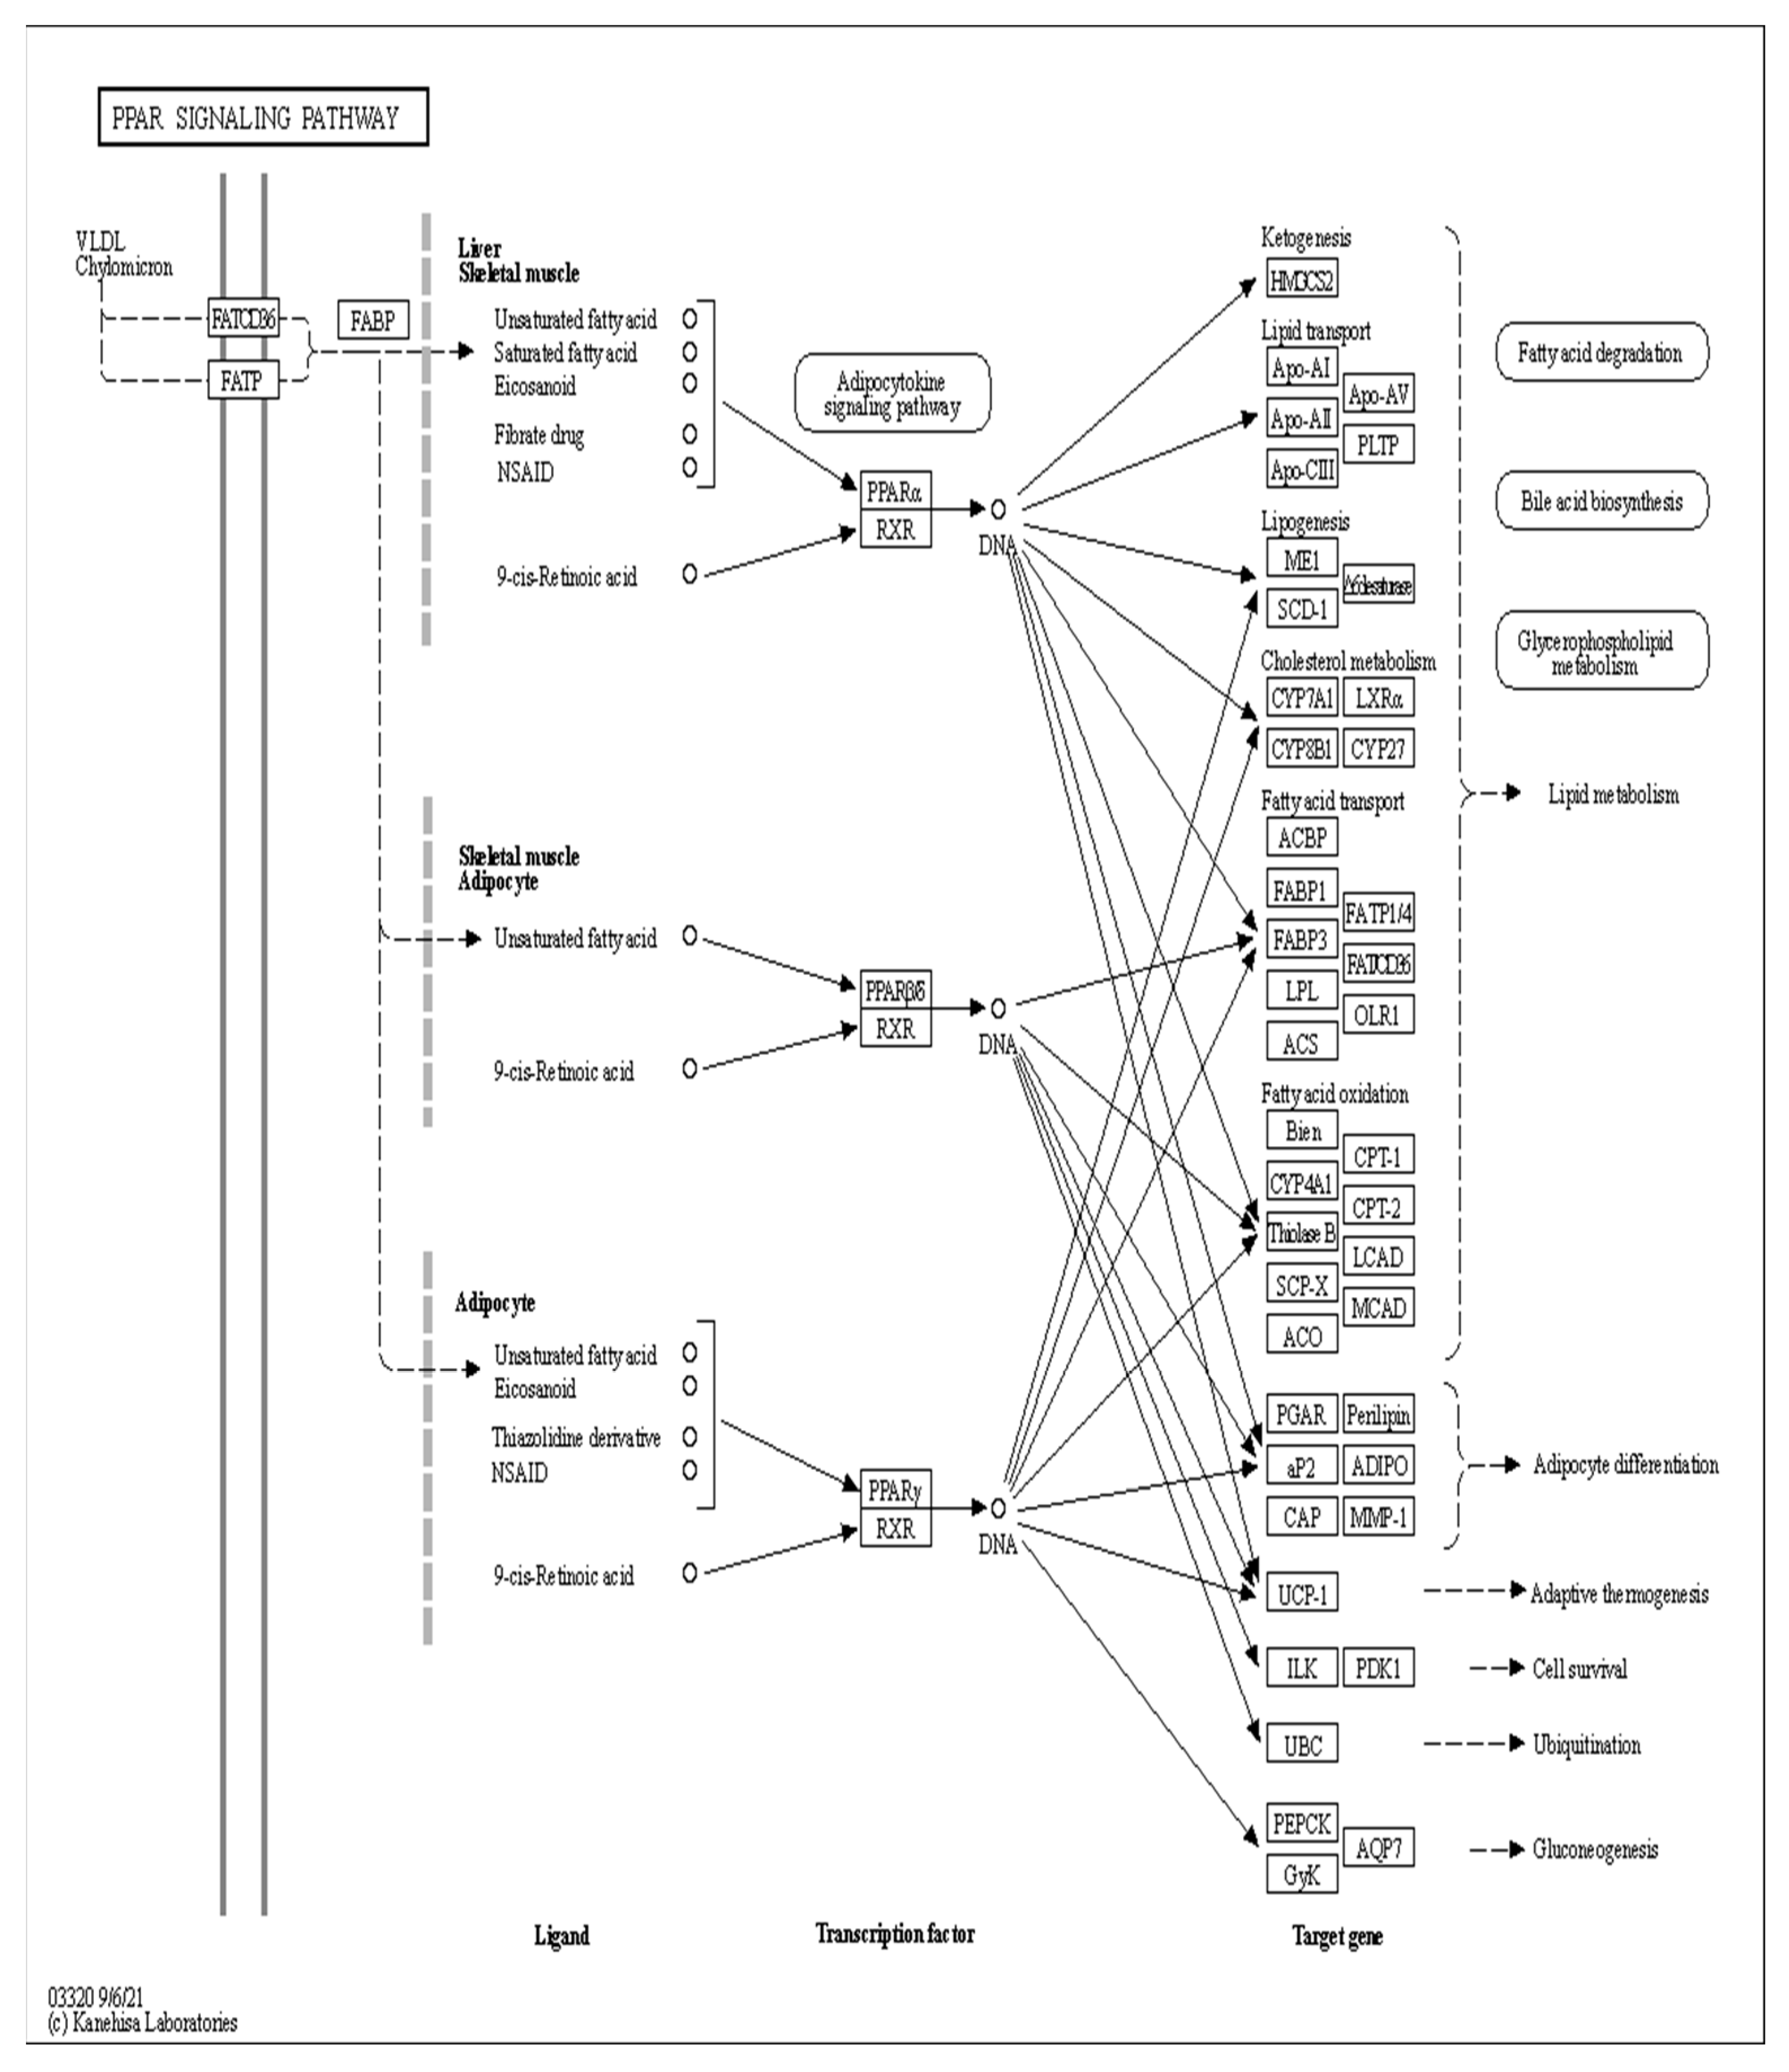
The signaling pathway of the PLIN2 gene was analyzed on the basis of KEGG enrichment results of DEGs in the satellite cells induced with OA for 96 h (Figure 13 and Figure 14). PLIN2 is present only in the PPAR signaling pathway, and PLIN2 gene expression is only regulated by PPARγ. This pathway is enriched in the liver, skeletal muscle, and adipocytes. When PPARγ is activated by binding to ligands, such as unsaturated fatty acids, eicosanoids, thiazolidine derivatives and NSAIDs, it forms PPAR/RXR heterodimeric transcription factors with the 9-cis-retinoic acid X receptor (RXR), which then binds to the PPAR initiation element (PPRE) upstream of the target gene promoter and finally regulates the transcription of these target genes. PPARγ plays a major regulatory role in adipose differentiation and lipogenesis in the PPAR signaling pathway. In addition, according to the pathway view (Figure 14), when the side of the added OA concentration changed, the target genes regulated by PPARγ also changed accordingly. However, matrix metalloproteinase (MMP)1, articulon protein 1 (SORBS1), PLIN2, and leukocyte differentiation antigen 36 (CD36) were all present in the pathway throughout the process, wherein MMP1 and SORBS1 were downregulated, whereas PLIN2 and CD36 were upregulated. This suggested a major molecular functional correlation among them and their crucial roles in lipogenesis.
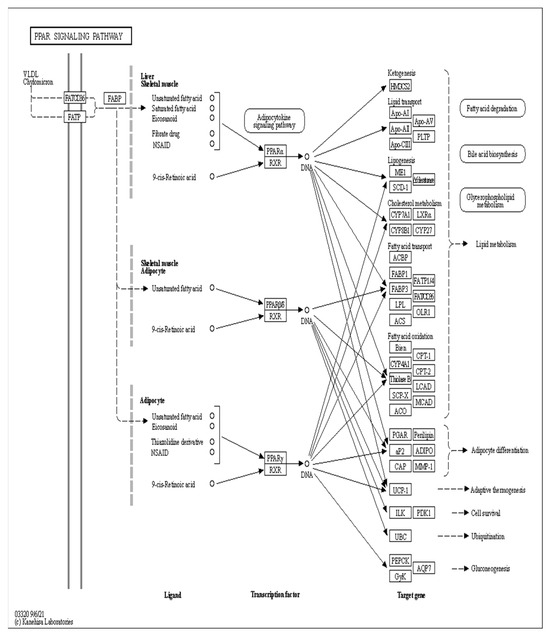
Figure 13.
PPAR signaling pathway under the regulation of OA.
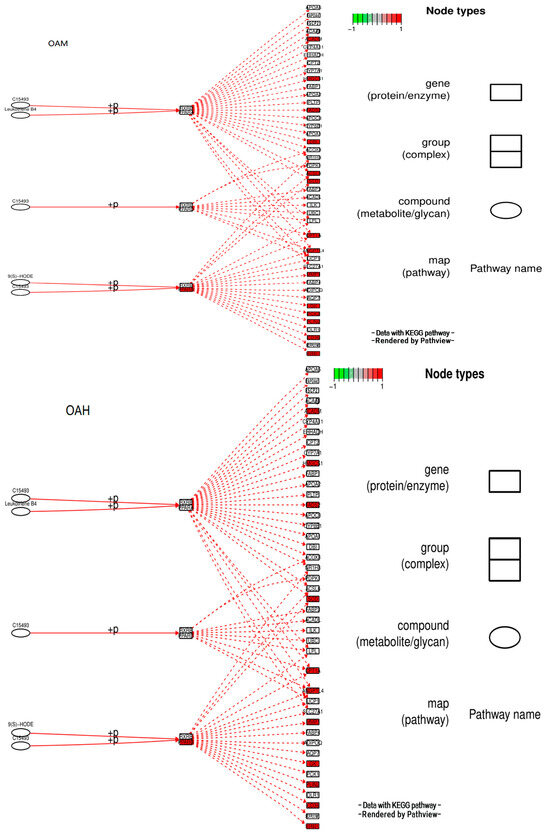
Figure 14.
Pathview under the PPAR signaling pathway.
3.11. Fluorescence Quantitative PCR Results of Effects of Different OA Concentrations on Differential Genes of Yanbian Bovine Skeletal Muscle Satellite Cells
After OA induction for 96 h, the pathways enriched for DEGs changed with different OA concentrations. They were mainly enriched in MAPK, PPAR, AMPK, and other signaling pathways. The PPAR signaling pathway is a key player in adipogenesis and lipid metabolism. It is a key factor in regulating the body’s energy metabolism and fatty acid oxidation, while OA is a natural ligand of the PPAR system, combined with enrichment analysis and the main metabolic pathways related to adipocyte differentiation, To test the accuracy of transcriptome sequencing data, the candidate adipocyte differentiation-related genes LPL, FABP4, and CPT1B were screened from the PPAR metabolic pathways (Table 2). The transcriptome data were validated through fluorescence quantitative PCR (Figure 14). The correlation between the results of fluorescence quantitative PCR and transcriptome sequencing results was analyzed. The correlation was significant at the 0.05 level, and the gene expression trends were basically consistent. This indicated that the FPKM values obtained from the transcriptome were relatively accurate (Figure 15).
Table 2.
Differential gene enrichment of the PPAR signaling pathway.
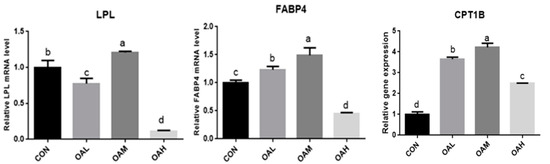
Figure 15.
qRT-PCR verification of transcriptome sequencing results at different OA concentrations. Values with different superscript letters indicate significant difference (p < 0.05), whereas those with the same or no letter indicate that the difference is not significant (p > 0.05).
4. Discussion
Numerous studies have demonstrated that myosatellite cells are pluripotent stem cells capable of differentiating into various cell types. Li et al. [9] used OA to increase lipogenic gene expression in bovine muscle satellite cells in the absence of a PPARγ agonist. They revealed that OA can effectively increase lipogenic gene expression in BSCs in the absence of a synthetic PPARγ agonist. The present experiment showed that the morphology of the skeletal muscle satellite cells changed significantly after different OA concentrations were added, from spindle-shaped to rounded adipocytes, with a significant decrease in myotubes and intracellular lipid droplet production. This result is consistent with those of Li et al. [9]. In addition, no significant difference was observed in the cell viability assay, indicating that the currently used OA dosage is not toxic for the growth and differentiation of the skeletal muscle satellite cells. This provides a fundamental theoretical basis for future studies on fat deposition in meat. However, the optimum OA dosage to be used requires further investigation.
Muscle development are regulated by a series of signaling pathways, and normal muscle differentiation involves the expression of MRF family members, such as MYOD, MYOG, and PAX3/7 [10]. Pax3/7 is mainly located in the upstream regulatory region of the MRF gene promoter, plays a role in initiating MRF gene expression, and is crucial for embryonic skeletal muscle development [11]. MyoD is among the key members of MRFs, a transcription factor with a decisive role in skeletal muscle formation, differentiation, and maturation, and is a critical myogenic transcription factor in muscle regeneration. MyoD expression reflects the activation and differentiation of satellite cells. MyoD is a vital player in the differentiation of precursor cells to myogenic cells [12]. In this experiment, after 96 h of OA-induced differentiation of the satellite cells of Yanbian yellow cattle, it was shown that OA had a significant downregulating effect on Pax3 and MyoD, indicating its ability to inhibit the differentiation of skeletal muscle satellite cells into myogenic cells. This result is consistent with those of Li et al. [9]. In their study, OA was used to increase lipogenic gene expression in bovine muscle satellite cells in the absence of a PPARγ agonist. They too found that OA significantly downregulated Pax3 and MyoD.
PPARγ and C/EBPα are considered the most crucial regulators of adipogenesis [8]. PPARγ controls terminal adipocyte differentiation and is required for maintaining their differentiated state [13]. C/EBPα do not function effectively in the absence of PPARγ. In this experiment, OA significantly upregulated PPARγ and C/EBPα genes after 96 h of OA-induced differentiation of skeletal muscle satellite cells in Yanbian cattle. This indicated that OA could promote lipid deposition in the Yanbian cattle skeletal muscle satellite cells.
SCD is a rate-limiting enzyme that converts saturated fatty acids to monounsaturated fatty acids, leading to the formation of neutral lipid droplets [14]. Thus, SCD plays a key role in fatty acid metabolism. PLIN2 was originally referred to as an adipose differentiation-associated protein, which indicates its role in the early regulation of adipocyte differentiation [15]. PLIN2 surrounds the lipid droplet and assists the storage of neutral lipids within the lipid droplets [16]. During lipid droplet formation, PLIN2 is usually upregulated in parallel with stored lipids and appears on the surface of lipid droplets in the early stage of lipid droplet synthesis. In the present experiment, OA significantly upregulated the PLIN2 gene and significantly downregulated the SCD gene after 96 h of the OA-induced differentiation of Yanbian cattle skeletal muscle satellite cells. This indicated that OA could promote fatty acid production in these satellite cells.
Adipose tissue, as a major endocrine organ, is a crucial player in regulating various physiological functions by secreting different hormones [17,18,19,20]. These adipose-derived hormones (also known as adipocytokines or adipokines) are secreted into the circulatory system where they act as important messengers between the adipose tissue and other tissues and organs [21]. Lipocalin is an adipokine that has received considerable research attention for its pleiotropic properties [22,23,24,25,26]. Lipocalin gene expression is tightly regulated by many transcription factors [27]. Upon binding to its receptors AdipoR1 and R2, lipocalin triggers a series of tissue-dependent signaling events [28,29], including AMPK and p38 MAPK phosphorylation and increased PPARα ligand activity [30,31,32]. This suggests that lipocalin production is closely related to AMPK, MAPK, and PPAR signaling pathways, as evidenced through the KEGG enrichment analysis of DEGs.
In this experiment, GO functional annotation and KEGG enrichment analysis of DEGs involved in OA-induced lipogenic transdifferentiation of Yanbian bovine skeletal muscle satellite cells revealed that the DEGs were mainly annotated to various biological processes and cell sites. The KEGG enrichment analysis revealed that the DEGs were mainly enriched in the AMPK and PPAR signaling pathways. The role of AMPK signaling pathway in regulating energy homeostasis is related to its effects on glucose and lipid metabolism, as well as on mitochondrial biogenesis and function [33]. The PPAR signaling pathway is mainly involved in regulating fatty acid metabolism, and cell proliferation and differentiation [34]. The functional annotation and enrichment analysis of KEGG–GO suggest that OA addition stimulates various metabolic pathways to promote the differentiation of the satellite cells toward lipogenesis, which may be because OA regulates the membrane structure of PE lipids, causing a negative membrane curvature strain, thus inducing a series of biological responses [35]. Cell membranes are mainly composed of phospholipids and proteins, and PE is the main phospholipid species in the plasma membrane [3]. PE is a lipid with a hexagonal HII phase preference [35]. Such hexagonal HII-phase-preference phospholipids can promote the fusion and fission of membrane bilayers [36,37], membrane permeability [38], protein transport [39], the regulation of chaperonin-like activity [3], etc. They are also involved in many cellular functions, such as endocytosis (membrane fission), extracellular (membrane–membrane fusion) processes, and the regulation of membrane protein activity [38]. Thus, the PE-conferred specific features are essential for membrane structure/function, and OA greatly promotes the tendency of the hexagonal HII phase [35], which is facilitated through the regulation of the negative membrane curvature strain. This regulation of the membrane structure partially explains the OA-mediated regulation of membrane and cellular functions, such as membrane fluidity, extracellular/endocytosis, cell division, signal transduction, and membrane protein activity, but the exact mechanisms need to be further explored.
PPARs play a chief role in lipid metabolism [40]. So far, three different PPAR isoforms, designated α, β (δ), and γ, have been identified. PPARγ is a key transcription factor of anabolism and plays an important role in lipid synthesis [41]. In the present study, PPARγ mRNA expression was observed in the skeletal muscle satellite cells after OA induction. The PPARγ expression level in the satellite cells increased significantly with increasing OA concentration and exhibited a dose-dependent relationship. Moreover, several studies have shown that PPARγ regulates PLIN2 gene expression. To perform transcriptional functions, PPARs heterodimerize with RXR receptors and bind to their ligands, thus allowing for the transcription of their target genes (Figure 16), which have PPREs in their promoters, such as various lipid-metabolizing enzymes and proteins that constitute lipid droplets [42,43], while the PLIN2 gene promoter region 5’-AGGTGAAA GGGCG-3’ sequence is a PPARγ PPRE [44]. This suggests that PPARγ controls PLIN2 transcription through a functional PPRE located within the PLIN2 promoter, as was also observed from the signaling pathway analysis of the PLIN2 gene. In the presence of ligands, PPARγ regulates the expression of various lipid metabolism-specific genes by binding to PPREs in the promoter regions of downstream target genes such as SCD, FABPs, LPL, and lipid droplet-encapsulated protein (PLIN), thereby participating in the whole lipid metabolism process, such as lipid synthesis, transport, and deposition [45,46,47,48]. This is also consistent with the pathway view and the validation of adipocyte differentiation-related genes in the transcriptome data.
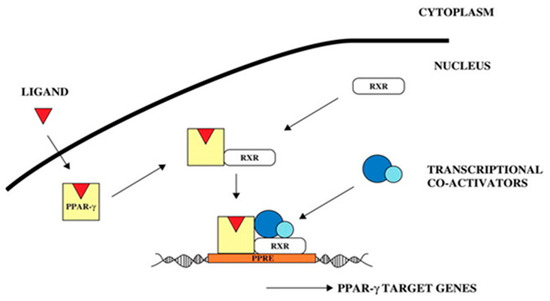
Figure 16.
PPARγ signal transduction pathway [44].
5. Conclusions
The study discovered that OA has the ability to promote the differentiation of Yanbian cattle skeletal muscle satellite cells towards lipogenesis. This promotion results in an increase in the generation of lipid droplets, the concentration of triglycerides, the content of lipocalin, and the expression of the PLIN2 gene. Transcriptomic analysis revealed that the PLIN2 gene is involved in the PPAR signaling pathway and its expression is regulated by PPARγ. Additionally, there exists a significant molecular functional correlation between PLIN2, MMP1, SORBS1, and CD36, emphasizing the crucial role of PLIN2 in lipogenesis.
Supplementary Materials
The following supporting information can be downloaded at: https://www.mdpi.com/article/10.3390/ani13233618/s1, The original Western blot figures.
Author Contributions
Conceptualization: X.L.; data curation: B.S. and J.S.; formal analysis: X.L. and E.W.; methodology: Q.L. and Q.J.; software: Y.W. and H.H.; investigation: B.S. and H.J. writing—original draft: B.S. and J.S. writing—review and editing: X.L. All authors have read and agreed to the published version of the manuscript.
Funding
This study was funded by the Research Fund of Engineering Research Center of the North-East Cold Region Beef Cattle Science & Technology Innovation, Ministry of Education and the “111” Project (D20034), China.
Institutional Review Board Statement
All study participants provided informed consent, and the animal study protocol was approved by the Ethics Committee of Yanbian University (approval ID: YBU-20160303).
Informed Consent Statement
Not applicable.
Data Availability Statement
The datasets generated and/or analyzed during the conduct of the study are included in this published article. Upon reasonable request, the datasets of this study are available from the corresponding author.
Acknowledgments
By Yan Bian University 2023.
Conflicts of Interest
The authors declare no conflict of interest.
References
- Harper, G.S.; Pethick, D.W. How might marbling begin. Aust. J. Exp. Agric. 2004, 44, 653–662. [Google Scholar] [CrossRef]
- Liao, F.H.; Liou, T.H.; Shieh, M.J.; Chien, Y.W. Effects of different ratios of monounsaturated and polyunsaturated fatty acids to saturated fatty acids on regulating body fat deposition in hamsters. Nutrition 2010, 26, 811–817. [Google Scholar] [CrossRef] [PubMed]
- Funari, S.S.; Barceló, F.; Escribá, P.V. Effects of oleic acid and its congeners, elaidic and stearic acids, on the structural properties of phosphatidylethanolamine membranes. J. Lipid Res. 2003, 44, 567–575. [Google Scholar] [CrossRef] [PubMed]
- Song, S.; Feng, L.P.; Su, H.W.; Cao, B.H.; Wu, M. Effect of oleic acid on proliferation and differentiation of perirenal preadipocytes in beef cattle. Chin. J. Anim. Husb. 2012, 48, 43–45. (In Chinese) [Google Scholar]
- Yang, J.M.; Gao, Y.; Li, C.H.; Liu, J.X. Effects of free fatty acids and insulin on the differentiation of adipose precursor cells. J. Beijing Med. Univ. 1998, 30, 276–278. (In Chinese) [Google Scholar]
- Ding, S.T.; Mersmann, H.J. Fatty acids modulate porcine adipocyte differentiation and transcripts for transcription factors and adipocyte-characteristic proteins. J. Nutr. Biochem. 2001, 12, 101–108. [Google Scholar]
- Smith, S.B.; Kawachi, H.; Choi, C.B.; Choi, C.W.; Wu, G.; Sawyer, J.E. Cellular regulation of bovine intramuscular adipose tissue development and composition. J. Anim. Sci. 2009, 87 (Suppl. 14), E72–E82. [Google Scholar] [CrossRef]
- Park, J.; Kim, H.L.; Jung, Y.; Ahn, K.S.; Kwak, H.J.; Um, J.Y. Bitter Orange (Citrus aurantium Linné) Improves Obesity by Regulating Adipogenesis and Thermogenesis through AMPK Activation. Nutrients 2019, 11, 1988. [Google Scholar] [CrossRef]
- Ntambi, J.M.; Young-Cheul, K. Adipocyte differentiation and gene expression. J. Nutr. 2000, 130, 3122S–3126S. [Google Scholar] [CrossRef]
- Su, X.; Zhao, Y.; Wang, Y.; Zhang, L.; Zan, L.; Wang, H. Overexpression of the Rybp Gene Inhibits Differentiation of Bovine Myoblasts into Myotubes. Int. J. Mol. Sci. 2018, 19, 2082. [Google Scholar] [CrossRef]
- Bentzinger, C.F.; Wang, Y.X.; Rudnicki, M.A. Building muscle: Molecular regulation of myogenesis. Cold Spring Harb. Perspect. Biol. 2012, 4, a008342. [Google Scholar] [CrossRef]
- Zhao, D.D.; Liu, C.C.; Jia, M.Y.; Yang, Y.; Ye, F.; Yan, Y.Q. Progress in the study of upstream transcriptional regulatory elements of muscle-specific gene promoters. Chin. J. Cell Biol. 2012, 34, 500–505. (In Chinese) [Google Scholar]
- MacDougald, O.A.; Lane, M.D. Transcriptional regulation of gene expression during Adipocyte differentiation. Annu. Rev. Biochem. 1995, 64, 345–373. [Google Scholar] [CrossRef] [PubMed]
- Zhang, Q.; Xiao, X.; Li, M.; Yu, M.; Ping, F. Bailing capsule ameliorates renal triglyceride accumulation through the PPARα pathway in diabetic rats. Front. Pharmacol. 2022, 13, 915592. [Google Scholar] [CrossRef] [PubMed]
- Brasaemle, D.L.; Barber, T.; Wolins, N.E.; Serrero, G.; Blanchette-Mackie, E.J.; Londos, C. Adipose differentiation-related protein is an ubiquitously expressed lipid storage droplet-associated. J. Lipid Res. 1997, 38, 2249–2263. [Google Scholar] [CrossRef] [PubMed]
- Park, S.R.; Cho, C.S.; Xi, J.; Kang, H.M.; Lee, J.H. Holistic characterization of single-hepatocyte transcriptome responses to high-fat diet. Am. J. Physiol. Endocrinol. Metab. 2021, 320, E244–E258. [Google Scholar] [CrossRef]
- Frühbeck, G.; Gómez-Ambrosi, J.; Muruzábal, F.J.; Burrell, M.A. The adipocyte: A model for integration of endocrine and metabolic signaling in energy metabolism. Am. J. Physiol. Endocrinol. Metab. 2001, 280, E827–E847. [Google Scholar] [CrossRef]
- Havel, P.J. Update on adipocyte hormones: Regulation of energy balance and carbohydrate/lipid metabolism. Diabetes 2004, 53 (Suppl. 1), S143–S151. [Google Scholar] [CrossRef]
- Rajala, M.W.; Scherer, P.E. Minireview: The adipocyte-at the crossroads of energy homeostasis, inflammation, and atherosclerosis. Endocrinology 2003, 144, 3765–3773. [Google Scholar] [CrossRef]
- Trayhum, P. Endocrine and signalling role of adipose tissue: New perspectives on fat. Acta Physiol. Scand. 2005, 184, 285–293. [Google Scholar] [CrossRef]
- Wang, Z.V.; Scherer, P.E. Adiponectin, the past two decades. J. Mol. Cell Biol. 2016, 8, 93–100. [Google Scholar] [CrossRef] [PubMed]
- Berg, A.H.; Scherer, P.E. Adipose tissue, inflammation, and cardiovascular disease. Circ. Res. 2005, 96, 939–949. [Google Scholar] [CrossRef] [PubMed]
- Kubota, N.; Terauchi, Y.; Yamauchi, T.; Kubota, T.; Moroi, M.; Matsui, J.; Eto, K.; Yamashita, T.; Kamon, J.; Satoh, H.; et al. Disruption of adiponectin causes insulin resistance and neointimal formation. J. Biol. Chem. 2002, 277, 25863–25866. [Google Scholar] [CrossRef] [PubMed]
- Okamoto, Y.; Kihara, S.; Ouchi, N.; Nishida, M.; Arita, Y.; Kumada, M.; Ohashi, K.; Sakai, N.; Shimomura, I.; Kobayashi, H.; et al. Adiponectin reduces atherosclerosis in apolipoprotein E-deficient mice. Circulation 2002, 106, 2767–2770. [Google Scholar] [CrossRef]
- Shimada, K.; Miyazaki, T.; Daida, H. Adiponectin and atherosclerotic disease. Clin. Chim. Acta 2004, 344, 1–12. [Google Scholar] [CrossRef]
- Wang, B.H.; Jenkins, J.R.; Trayhum, P. Expression and secretion of inflammation- related adipokines by human adipocytes differentiated in culture. Integrated response to TNF- alpha. Am. J. Physiol. Endocrinol. Metab. 2005, 288, E731–E740. [Google Scholar] [CrossRef]
- Shehzad, A.; Iqbal, W.; Shehzad, O.; Lee, Y.S. Adiponectin: Regulation of its production and its role in human diseases. Hormones 2012, 11, 8–20. [Google Scholar] [CrossRef]
- Yamauchi, T.; Nio, Y.; Maki, T.; Kobayashi, M.; Takazawa, T.; Iwabu, M.; Okada-Iwabu, M.; Kawamoto, S.; Kubota, N.; Kubota, T.; et al. Targeted disruption of AdipoR1 and AdipoR2 causes abrogation of adiponectin binding and metabolic actions. Nat. Med. 2007, 13, 332–339. [Google Scholar] [CrossRef]
- Fang, H.; Judd, R.L. Adiponectin regulation and function. Compr. Physiol. 2018, 8, 1031–1063. [Google Scholar]
- Gustafson, B.; Jack, M.M.; Cushman, S.W.; Smith, U. Adiponectin gene activation by thiazolidinediones requires PPARgamma2, but not C/EBP alpha-evidence for differential regulation of the aP2 and adiponectin genes. Biochem. Biophys. Res. Commun. 2003, 308, 933–939. [Google Scholar] [CrossRef]
- He, W.M.; Barak, Y.; Hevener, A.; Olson, P.; Liao, D.; Le, J.M.; Nelson, M.; Ong, E.; Olefsky, J.M.; Evans, R.M. Adipose-specific peroxisome proliferator- activated receptor gamma knockout causes insulin resistance in fat and liver but not in muscle. Proc. Natl. Acad. Sci. USA 2003, 100, 15712–15717. [Google Scholar] [CrossRef] [PubMed]
- Yamauchi, T.; Kamon, J.; Ito, Y.; Tsuchida, A.; Yokomizo, T.; Kita, S.; Sugiyama, T.; Miyagishi, M.; Hara, K.; Tsunoda, M.; et al. Cloning of adiponectin receptors that mediate antidiabetic metabolic effects. Nature 2003, 423, 762–769. [Google Scholar] [CrossRef] [PubMed]
- Wang, C.; Zhang, W.; Xu, W.; Liu, Z.; Huang, K. AMP-activated protein kinase α1 phosphorylates PHD2 to maintain systemic iron homeostasis. Clin. Transl. Med. 2022, 12, e854. [Google Scholar] [CrossRef] [PubMed]
- Herzig, S.; Shaw, R.J. AMPK: Guardian of metabolism and mitochondrial homeostasis. Nat. Rev. Mol. Cell Biol. 2018, 19, 121–135. [Google Scholar] [CrossRef]
- Chinetti, G.; Fruchart, J.C.; Staels, B. Peroxisome proliferator-activated receptors (PPARs): Nuclear receptors at the crossroads between lipid metabolism and inflammation. Inflamm. Res. 2000, 49, 497–505. [Google Scholar] [CrossRef]
- Bogdanov, M.; Sun, J.; Kaback, H.R.; Dowhan, W. A phospholipid acts as a chaperone in assembly of a membrane transport protein. J. Biol. Chem. 1996, 271, 11615–11618. [Google Scholar] [CrossRef]
- Siegel, D.P.; Banschbach, J.; Alford, D.; Ellens, H.; Lis, L.J.; Quinn, P.J.; Yeagle, P.L.; Bentz, J. Physiological levels of diacylglycerols in phospholipid membranes induce membrane fusion and stabilise inverted phases. Biochemistry 1989, 28, 3703–3709. [Google Scholar] [CrossRef]
- Emoto, K.; Kobayashi, T.; Yamaji, A.; Aizawa, H.; Yahara, I.; Inoue, K.; Umeda, M. Redistribution of phosphatidylethano-lamine at the cleavage furrow of dividing cells during cytokinesis. Proc. Natl. Acad. Sci. USA 1996, 93, 12867–12872. [Google Scholar] [CrossRef]
- Gudi, S.; Nolan, J.P.; Frangos, J.A. Modulation of GTPase activity of G proteins by fluid shear stress and phospholipid composition. Proc. Natl. Acad. Sci. USA 1998, 95, 2515–2519. [Google Scholar] [CrossRef]
- Rietveld, A.G.; Koorengevel, M.C.; de Kruijff, B. Non-bilayer lipids are required for efficient protein transport across the plasma membrane of Escherichia coli. EMBO J. 1995, 14, 5506–5513. [Google Scholar] [CrossRef]
- Qiao, X.; Zhou, Z.C.; Niu, R.; Su, Y.T.; Sun, Y.; Liu, H.L.; Teng, J.L.; Ye, J.N. Hydroxychloroquine Improves Obesity-Associated Insulin Resistance and Hepatic Steatosis by Regulating Lipid Metabolism. Front. Pharmacol. 2019, 10, 855. [Google Scholar] [CrossRef] [PubMed]
- Matsusue, K.; Aibara, D.; Hayafuchi, R.; Matsuo, K.; Takiguchi, S.; Gonzalez, F.J.; Yamano, S. Hepatic PPARγ and LXRα independently Regulating lipid accumulation in the livers of genetically obese mice. FEBS Lett. 2014, 588, 2277–2281. [Google Scholar] [CrossRef] [PubMed]
- Dubois, V.; Eeckhoute, J.; Lefebvre, P.; Staels, B. Distinct but complementary contributions of PPAR isotypes to energy homeostasis. J. Clin. Investig. 2017, 127, 1202–1214. [Google Scholar] [CrossRef] [PubMed]
- De la Rosa Rodriguez, M.A.; Kersten, S. Regulation of lipid droplet-associated proteins by peroxisome proliferator-activated receptors. Biochim. Biophys. Acta Mol. Cell Biol. Lipids 2017, 10, 1212–1220. [Google Scholar] [CrossRef]
- Targett-Adams, P.; McElwee, M.J.; Ehrenborg, E.; Gustafsson, M.C.; Palmer, C.N.; McLauchlan, J. A PPAR response element regulates transcription of the gene for human adipose differentiation- related protein. Biochim. Biophys. Acta 2005, 1728, 95–104. [Google Scholar] [CrossRef]
- Yang, H.; Suh, D.H.; Kim, D.H.; Jung, E.S.; Liu, K.H.; Lee, C.H.; Park, C.Y. Metabolomic and lipidomic analysis of the effect of pioglitazone on hepatic steatosis in a rat model of obese type 2 diabetes. Br. J. Pharmacol. 2018, 175, 3610–3625. [Google Scholar] [CrossRef]
- Tontonoz, P.; Hu, E.; Devune, J.; Beale, E.G.; Spiegelman, B.M. PPAR gamma 2 regulates adipose expression of the phosphoenolpyruvate carboxykinase gene. Mol. Cell. Biol. 1995, 15, 351–357. [Google Scholar] [CrossRef]
- Glorian, M.; Duplus, E.; Beale, E.G.; Scott, D.K.; Granner, D.K.; Forest, C. A single element in the phosphoenolpy-ruvate carboxykinase gene mediates thiazolidinedione action specifically in adipocytes. Biochimie 2001, 83, 933–943. [Google Scholar] [CrossRef]


Disclaimer/Publisher’s Note: The statements, opinions and data contained in all publications are solely those of the individual author(s) and contributor(s) and not of MDPI and/or the editor(s). MDPI and/or the editor(s) disclaim responsibility for any injury to people or property resulting from any ideas, methods, instructions or products referred to in the content. |
© 2023 by the authors. Licensee MDPI, Basel, Switzerland. This article is an open access article distributed under the terms and conditions of the Creative Commons Attribution (CC BY) license (https://creativecommons.org/licenses/by/4.0/).