1. Introduction
Freshwater ecosystems are of fundamental importance as they play a key role in ensuring global diversity and provide invaluable goods and services for various forms of life on Earth [
1,
2,
3,
4,
5,
6,
7]. These environments are currently undergoing substantial change due to anthropic impact. Although little studied, they are most affected by the creation of cultivated land, which inevitably leads to the fragmentation and/or destruction of natural habitats and water pollution [
7,
8,
9,
10,
11,
12,
13,
14]. In addition, rapid urbanization and industrialization processes (wastewater from agriculture or households) are dictating significant changes [
15]. Lastly, it is important to note that changes in land use can alter the inputs of river systems and therefore affect aquatic communities by reducing the supply of terrestrial carbon and influencing the retention of organic matter, thereby leading to the decline of aquatic biodiversity [
7,
16,
17,
18,
19]. For these reasons, it is extremely important to learn as much as possible about the species that live in freshwater environments, analyzing both single groups of organisms, such as fish, algae or invertebrates, and entire multitrophic communities [
17,
20,
21]. In this context, biomonitoring is known to be fundamental for ecological assessment and is at the basis of environmental protection [
22]. In recent years, the monitoring technique which uses environmental DNA has become increasingly widespread, revolutionizing traditional methods of biomonitoring, especially in freshwater ecosystems [
7,
23,
24,
25,
26,
27].
Some authors claim that traditional methods of identification based on morphology are often too costly in terms of time, work, disturbance of the habitat and even difficulty in finding the required taxonomic skills. For these authors, a metabarcoding technique applied to environmental samples, such as DNA released into the environment, would overcome these obstacles by providing large-scale spatial resolution and high-quality levels of biomonitoring [
24,
28].
This technique consists the extraction and analysis of genetic material released into the environment through feces, saliva, urine and skin cells, obtained directly from the environmental samples of water, soil, sediment or ice [
29]. The method relies on the detection of a short fragment of DNA for the identification of the species and different taxa using the “DNA barcode”, a standardized DNA region [
30,
31]. It is a technique which has already been applied to the monitoring of aquatic communities (e.g., microbes, algae, macroinvertebrates, fish and mammals), demonstrating its ability to identify the presence of rare, invasive, extinct species or those difficult to detect using conventional methods [
31,
32,
33,
34,
35,
36,
37,
38,
39,
40,
41,
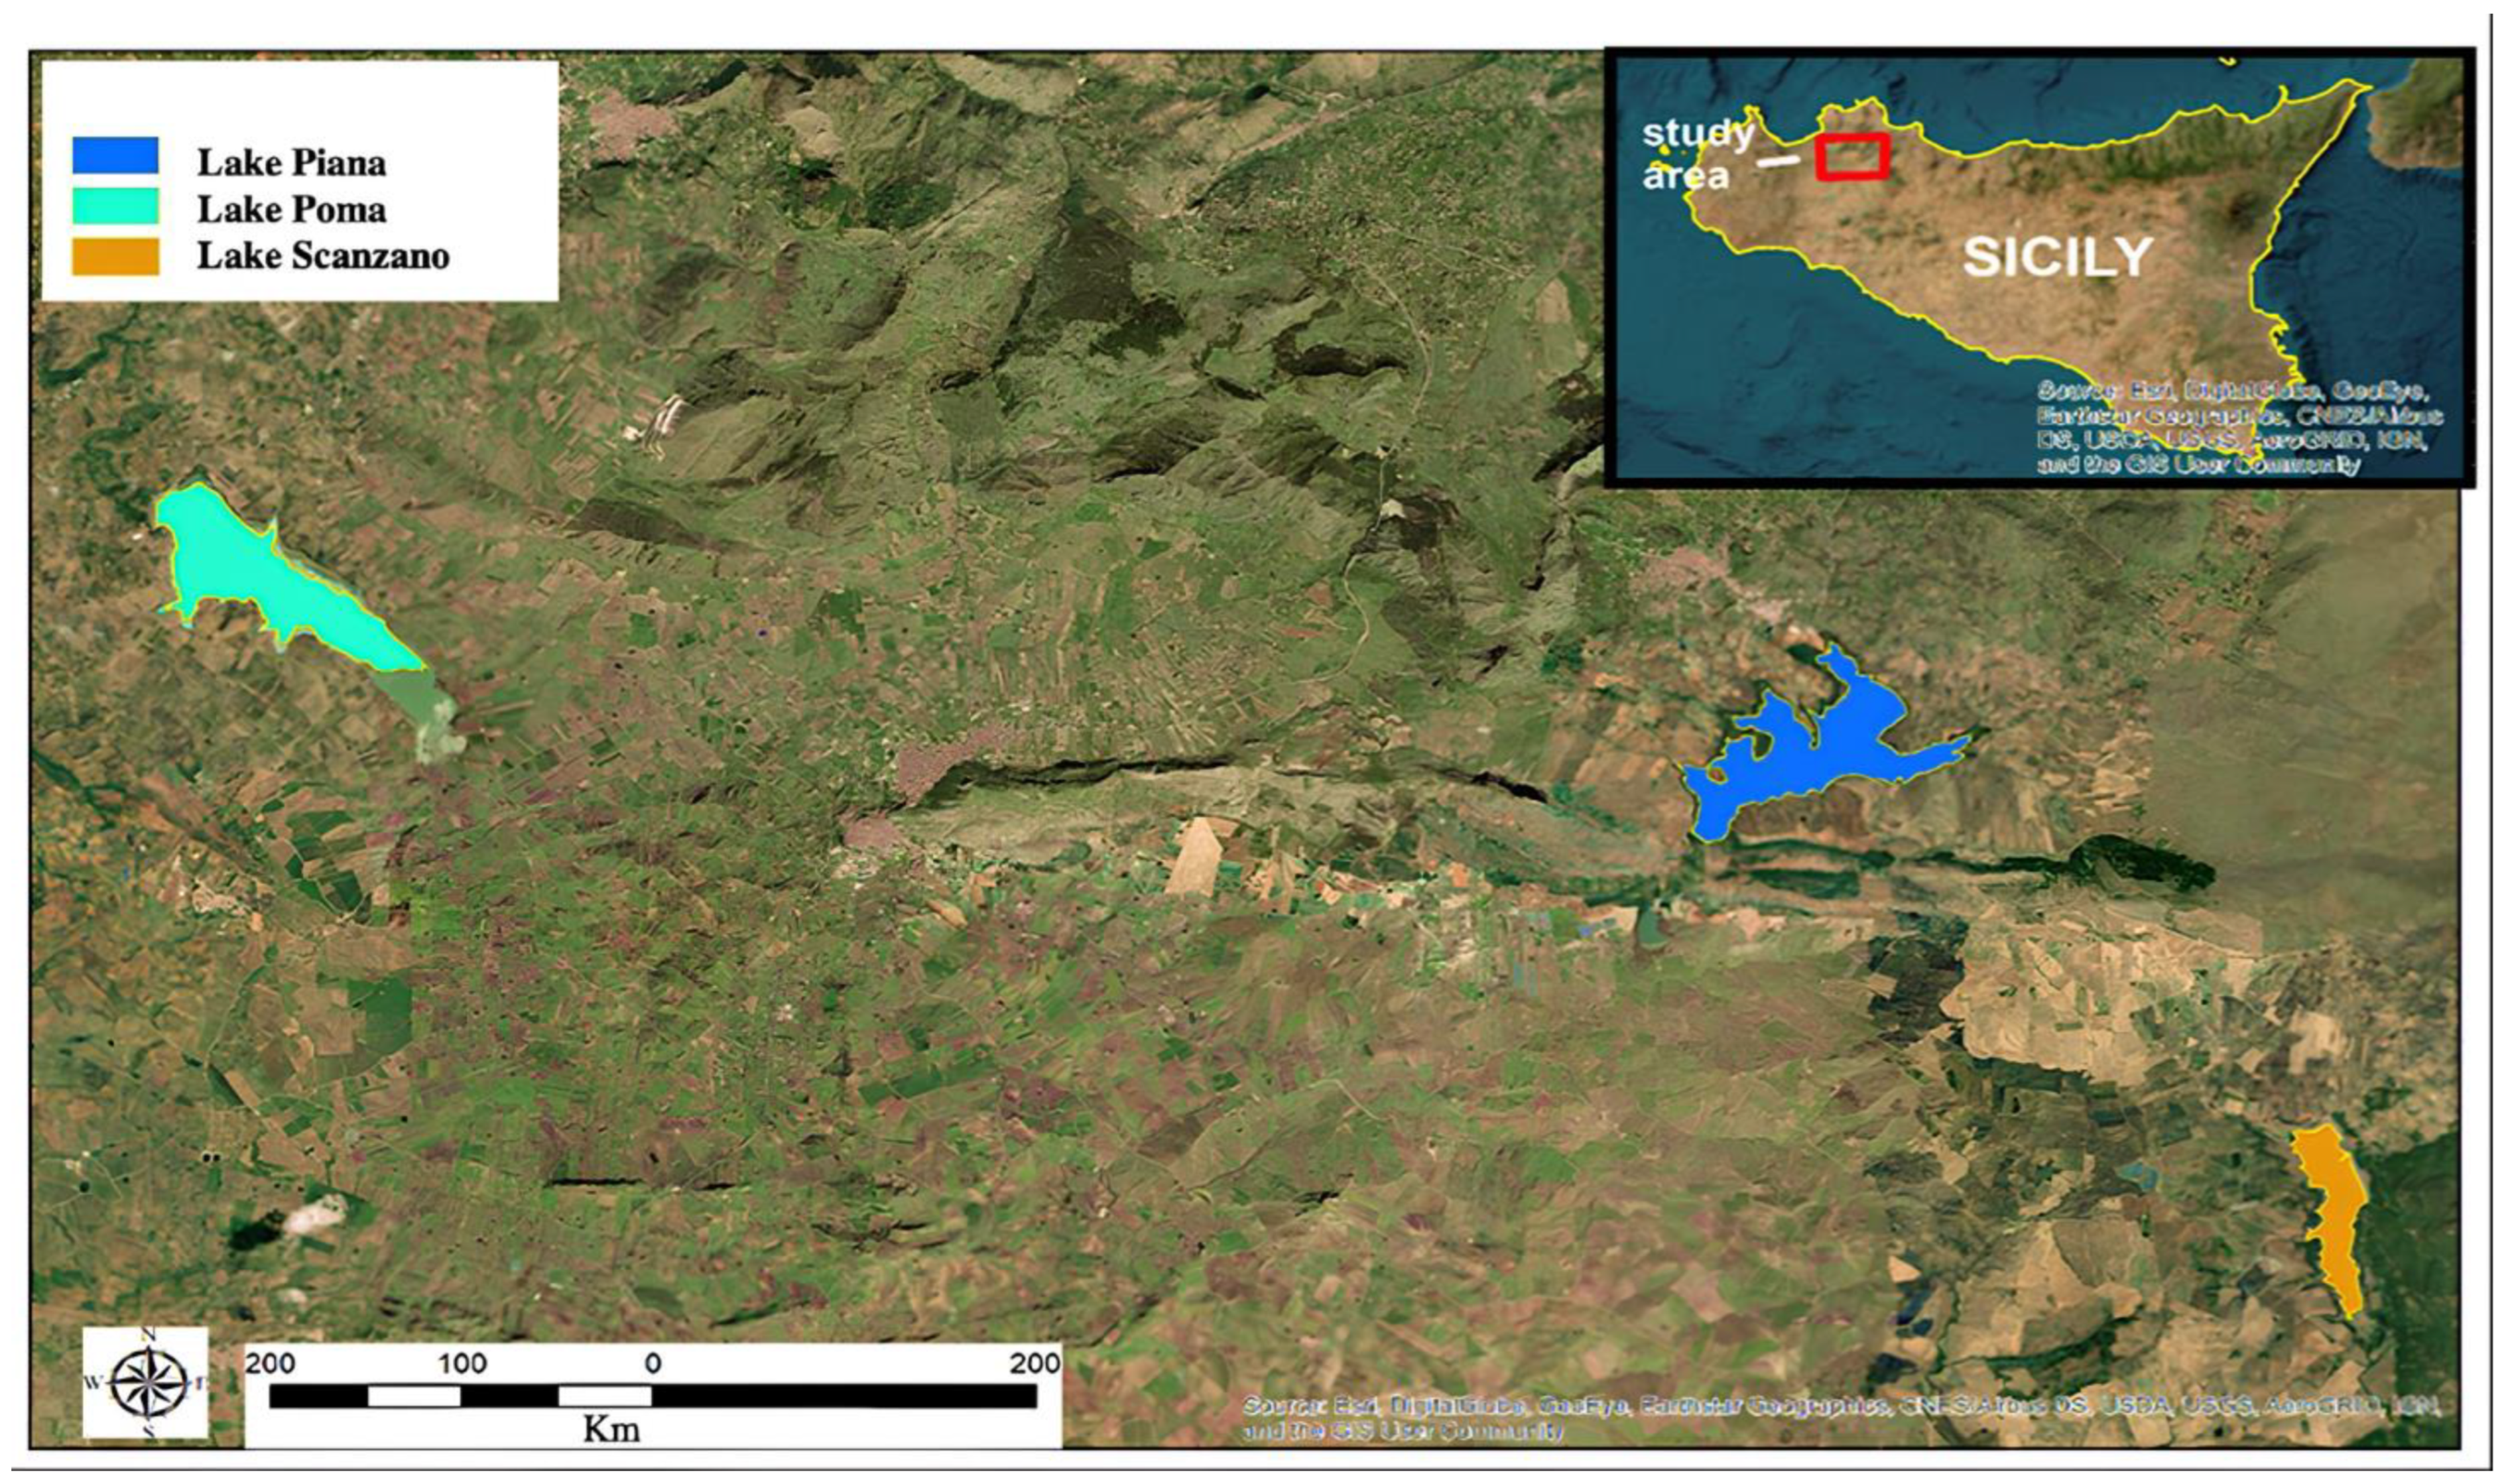
42]. With specific reference to the Region of Sicily, knowledge of the species present in freshwater environments is currently highly fragmentary (e.g., based on information from the population) and no official scientific documents linked to the sites describe vertebrate biodiversity exhaustively. In the light of human impact and climate change today, this information is fundamental in the provision of a baseline to understand if change will occur at a biodiversity level. This study focused on three Sicilian Lakes: Lake Poma, Lake Scanzano and Lake Piana degli Albanesi, three important artificial basins which supply fresh water to the urban centers of the area [
43]. Due to their naturalistic importance, in 1994, Lake Poma and, in 1999, Lake Piana degli Albanesi were recognized by the Sicilian Region as Protection Oasis and Wildlife Refuge. For the same reason, Lake Piana degli Albanesi is a protected area under the Habitats Directive (ITA020013 Lake of Piana degli Albanesi). In particular, we applied the environmental DNA technique to detect the taxa and characterize the vertebrate coenoses in these lakes, where knowledge of vertebrate biodiversity is currently scarce or largely undocumented. In particular, the aims of this research within these three wetlands were to use eDNA to have the first snapshot of vertebrate biodiversity in these three lakes, where little is known to provide valuable information useful for creating a baseline of knowledge regarding the biodiversity in these three lakes.
3. Results
The analysis carried out on the eDNA samples obtained from the three Sicilian lakes showed an average number of fragment readings equal to: 124,781, 99,534 and 106,403 from Lake Poma, Lake Piana and Lake Scanzano, respectively. The data obtained were subsequently processed and cleaned to extrapolate only the fragments of interest to the study. Analysis allowed for taxonomic discrimination from the phylum to species level, with the most comprehensive results achieved at the order level.
Table 2 shows the data relating to the number of fragments identified for each order in each lake analyzed. Total cleaned frequencies used to analyze the taxonomic order were 7247, 10,010.7 and 8052.5 for Lake Poma, Lake Piana and Lake Scanzano. These data are detailed and described as percentages for each site in the pie charts shown in
Figure 2,
Figure 3 and
Figure 4, highlighting differences or similarities found between the sites.
Regarding Lake Poma (
Figure 2), the highest number of fragments concerned the orders of Atheriniformes (3.61%), Centrarchiformes (9.88%), Perciformes (7.31%), Galliformes (7.46%), Artiodactyla (2.12%) and Carnivora (66.43%). For the orders of Cypriniformes, Anura, Lagomorpha, Gadiforme and Istiophoriformes, no eDNA fragments were identified. Very low quantities of fragments were detected for Cyprinodontiformes, Apodiformes, Charadriiformes and Spariformes, recorded as 0.5 (0.01%), 10.5 (0.03%), 2 and 28 (0.3%), respectively. Finally, for the orders of Podicipediformes, Pelecaniformes and Siluriformes, low but noteworthy levels were found in the number of fragments, which were 37.5 (0.52%), 65.5 (0.90%) and 88 (1.21%), respectively.
In Lake Piana (
Figure 3) the highest number of fragments concerned the orders of Cypriniformes, Cyprinodontiformes, Perciformes, Galliformes, Artiodactyla and Carnivora that were equal to 1653.3 (16.52%), 225 (2.25%), 1642.3 (16.41%), 1003 (10.02%), 473.3 (4.73%) and 4572.7 (45.68%), respectively. No eDNA fragments were identified for the orders of Atheriniformes, Centrarchiformes, Podicipediformes and Siluriformes. Very low quantities of fragments were detected for Anura, Charadriiformes and Spariformes at 1.7 (0.02%), 14 (0.14%) and 30.7 (0.31%), respectively. Finally, for the orders of Apodiformes, Pelecaniformes, Gadiformes and Istiophoriformes, low but noteworthy levels were found regarding the number of fragments at 42.3 (0.42%), 54.7 (0.55%), 56.7 (0.57%) and 88.3 (0.88%), respectively. On the other hand, some orders detected in Lake Piana, such as Cyprinifromes, Anura, Lagomorpha, Gadiformes and Istiophoriformes, were not detected in Lake Poma.
As regards to Lake Scanzano (
Figure 4), the highest number of fragments concerned the orders of Cypriniformes, Cyprinodontiformes, Perciformes, Galliformes, Artiodactyla and Carnivora, which were equal to 495 (6.15%), 853.5 (10.60%), 2789 (34.64%), 266.5 (3.31%), 636 5 (7.90%) and 2829 (35.13%), respectively. Furthermore, in most cases, the number of fragments obtained was even greater than those obtained in Lake Piana. No eDNA fragments were identified for the orders of Atheriniformes, Anura, Podicipediformes, Apodiformes, Charadriiformes, Pelecaniformes, Gadiformes, Siluriformes or Spariformes. Lower amounts of fragments were found for Centrarchiformes and Istiophoriformes at 128 (1.59%) and 53 (0.66%) respectively. In conclusion, for Lagomorpha, the lowest quantities of fragments were detected, which was equal to two (0.02%). Compared to the other two lakes, there were a greater number of orders for which no eDNA fragments were identified. Several absent orders were found to be present in the other two lakes, such as Pelecaniformes, Artiodactyla, Apodiformes and Charadriiformes. An absence of Atherinifromes, Podicipedifromes and Siluriformes orders was also found in Lake Piana. The same was observed for Anura and Gadiformes when compared to Lake Poma.
In various cases, environmental DNA analysis led to the identification of the species present within different orders. Our results highlighted the possibility to identify different types of species indicated in
Table 3 and divided these into four categories: wild aquatic species (
sensu strictu), other wild species, domestic terrestrial species and marine species. The latter has been included in a separate category as the lakes collect freshwater and are not in communication with any marine environment, thus the presence of marine species was an expected result. Each single category is described respectively (
Figure 5,
Figure 6,
Figure 7 and
Figure 8).
Results for aquatic species are detailed in
Figure 5 and expressed as a percentage of fragments obtained. The highest fragment percentages in Lake Poma were obtained for species
Micropterus salmoides,
Perca fluviatilis,
Atherina boyeri and
Ameirus melas (43%, 31%, 16% and 10%, respectively). High fragment percentages in Lake Piana were observed in
P. fluviatilis (47%
) only.
Discoglossus pictus,
Cyprinus carpio and
Gambusia holbrooki, not found in Lake Poma, showed fragment percentages of 0.14%, 47% and 6%, respectively. Finally, regarding Lake Scanzano, the highest fragment percentage was identified for
Carassius auratus (75%), a species seemingly not present in the other two lakes. However, similar to Lake Poma, fragments of
M. salmoides and
A. boyeri were identified, albeit at lower percentages (24% and 0.72%, respectively), and similar to Lake Piana, fragments of
C. carpio were found, although, once again, at much a lower percentage (0.16%).
Other wildlife species for which eDNA fragments were detected in the three lakes are shown in percentages in
Figure 6. A high fragment percentage were detected in Lake Poma for
Podiceps cristatus (57%) and limited fragment percentages for
Apus apus and
Ardea cinerea at 10% and 33%, respectively. In Lake Piana, the highest fragment percentages concerned the species
Lepus corsicanus (48%) and
A. apus, although this last species was found at a higher rate (26%) than in Lake Poma. Similar to Lake Scanzano, fragments of
A. cinerea and
L. michahellis were also detected. In Lake Piana, however, detection rates were lower (17% and 9%, respectively), whilst in Lake Scanzano, these two species were the only fragments identified (61% and 39%, respectively).
Regarding domestic terrestrial species (
Figure 7) in Lake Poma,
Canis lupus (84%) was detected with the highest fragment percentage and
G. gallus (13%) and
S. scrofa (3%) with the two lower rates.
Likewise, in Lake Piana, the highest fragment percentage was recorded for C. lupus (73%) and lower percentages for G. gallus (17%) and S. scrofa (3%). However, fragments of B. taurus and O. aries were also detected in Lake Piana at 3% and 1%, respectively. Lastly, in Lake Scanzano, a high fragment percentage was detected only for S. scrofa (93%), with lower percentages recorded for O. aries and C. lupus at 7% and 0.1%, respectively.
To conclude, a fascinating result concerned the detection of eDNA fragments of typically marine species (
Figure 8). In Lake Poma,
Diplodus puntazzo was detected at a rate of 100%, whilst
Merluccius merluccius and
Xiphias gladius were detected in Lake Piana and Lake Scanzano at differing percentages. In more detail, rates were found to be 43% and 34%, respectively, in Lake Piana and 2% and 98% in Lake Scanzano. Moreover, fragments of
Spicara maena (23%) were only detected in Lake Piana.
Figure 9 shows the number of taxa and the values of the biodiversity index (relative to wild vertebrates) found in the three lakes examined and compared. Lake Piana was the lake with the highest specific richness and biodiversity values, while Lake Scanzano was found to be the lowest.
Despite the similarity of these values, the coenoses of the three lakes were found to be quite different from each other. In fact, by comparing the similarity values found, there are differences of at least 50% from a qualitative point of view and at least 60% from a qualitative–quantitative point of view (
Table 4).
Regarding the environmental typologies around the three lakes,
Table 5 shows the number of habitats found and the relative diversity values.
Once again, the values were quite similar to each other. However, unlike the data observed regarding the fauna, habitat comparison yielded a value of less than 50% similarity only in the case of the Bray–Curtis index (
Table 6).
4. Discussion
Biomonitoring is essential to analyze the biological diversity, contamination and ecological status of the ecosystems examined [
53,
54,
55]. Among the different approaches, one of the most important in recent years is based on the detection and characterization of DNA released by organisms into the environment and that are classified into two types: organismic and extraorganismic [
56,
57].
In this study, the environmental DNA technique was applied to three Sicilian lakes in order to provide the first snapshot of vertebrate biodiversity in these three lakes that would be useful to create a baseline of knowledge regarding the biodiversity in these three lakes. Our preliminary eDNA results showed differences between the three lakes, in contrast with high similarity found in the composition of surrounding habitats, an issue that will need to be further investigated. Regarding aquatic orders, fragments of Cypriniformes, Cyprinodontiformes, Perciformes, Centrarchiformes and Atheriniformes were identified, although detected in differing abundances in the three sites. Similar results were observed by analyzing the number of fragments of other orders. In regards to the orders and wild aquatic species, we had sporadic information based on our knowledge, sightings or information collected from the local population and amateur fishermen, which reported both about the species that we identified with eDNA and also about the species that were not identified with eDNA in our study [
58,
59,
60]. Regarding the last ones, the not revealing of their eDNA could be due to the lack of a DNA barcode in the reference libraries [
61,
62,
63]. Despite this, these results constitute the first snapshot of the three lakes to be further explored and expanded in future sampling, also during other seasons. A particularly important result of the eDNA approach concerned the ability to verify the presence of species that were not strictly aquatic, however dependent on these ecosystems to some extent. Species such as
Podiceps cristatus and
Ardea cinerea, which nest in these environments,
Apus apus, a species which uses the reservoirs for drinking, or
Larus michahellis, which is present all year round, were identified. However, this is a relatively low number of species compared to those actually present. This fact depends partially on the sampling period but also on the phenology of the species. Bird species (both migratory and sedentary) in these areas are, in reality, much more numerous, not to mention the known presence of amphibians and reptiles not yet detected by eDNA. Indeed, during sampling, bird species such as
Egretta garzetta,
Bubulcus ibis,
Anas plathyrhyncos,
Gallinula chloropus,
Actitis hypoleucos and
Ardea alba were observed, and reptiles, such as
Natrix helvetica [
64], or amphibians, such as
Xenopus laevis or
Bufo bufo [
65,
66,
67], as well as being known to the area, were also seen during sample collection.
The different biodiversity values could be due to a number of factors, such as water sampling (e.g., the need to increase sampling to cover a wider surface area) or the degradation processes of the DNA released into the environment. Indeed, it is important to consider that environmental DNA is a heterogeneous mixture of genetic materials, including chromosomes and plasmids protected inside cells, or other types of cellular debris and extracellular DNA fragments that are floating in the environment [
68]. It has also been observed that the methods of preservation and extraction of the sample can also influence the final result [
34,
69,
70,
71,
72]. Regardless of the nature of the DNA released into the environment, it is clear that its fate can differ as it encounters factors and/or conditions which either protect it and keep it intact or degrade it [
73,
74,
75,
76,
77]. It is known rather that the resistance of environmental DNA in water samples depends on the characteristics of the molecule (length, conformation, sequence) and on environmental characteristics [
78]. For example, environmental temperatures or salinity conditions, or the availability of oxygen, ultraviolet or solar radiation, can also influence the degradation of the molecule through denaturation processes [
79,
80,
81,
82,
83,
84,
85,
86,
87,
88,
89]. Even microbial communities and extracellular enzymes can influence the degradation processes [
90].
Abiotic and biotic conditions of the studied ecosystem could also have an influence on the performance of the primer, which can vary under differing conditions [
91,
92]. In addition, studies on target 16s sequencing of mock communities reported large deviations from expected values, dependent on sequencing primers, extraction methods and the sequencing platform applied [
93]. The choice of primer pairs that allow DNA amplification of specific taxonomic groups and discriminate between species is crucial. A large variety of primer pairs have been developed, either universally or specifically, to amplify target clades [
94,
95,
96,
97]. Multiprimer comparison generally found considerable differences in the amplified taxonomic specificity and species discrimination power both in silico and in situ [
98]. Thus, to increase the ability of species detection, it would be appropriate to use different primer pairs in combination [
99].
To implement DNA metabarcoding for the identification of species and ecosystem biomonitoring, we need reliable sequence reference libraries of the known taxa [
61]. Currently, the incompleteness of DNA barcode reference libraries represents a significant limit to unveiling total biodiversity, especially of an aquatic ecosystem and species from lakes. Among aquatic taxa, species-rich groups, such as arthropods and polychaetes, or economically important fish are better represented in libraries, while specific taxonomic groups, at the local/regional level in particular, are completely absent [
61,
62,
63]. Results of metagenomic analyses highlighted the presence of different categories of species. Some of these concerned the category of wild aquatic species in the strict sense, typical of these sites. The ability to use eDNA to detect species of fish present in freshwater environments certainly offers new possibilities for less invasive censuses and for the creation and/or updating of regional fish maps. However, an extremely important result regarded the acquisition of information on other wild species or domestic terrestrial species. As far as the presence of domestic species is concerned, this could be due, in some cases, such as
Bos taurus,
Ovis aries and
Canis lupus familiaris, to the shepherds’ habit of keeping these species near to reservoirs for water supply. In other cases, the presence of eDNA, such as that of
Gallus gallus and
Sus scrofa, linked to anthropic activities or farming in the surrounding area, could reach the water body by soil leaching or through discharges into small watercourses that flow into the reservoirs [
100,
101,
102].
On the other hand, the presence of marine fish species, typically used for human nutrition, could only be explained by waste disposal in these waters. This could be due to anthropic impacts that influence freshwater environments today [
103,
104], although fisheries sector businesses would seem to be absent from the area. Thus, differences between the three lakes, to our knowledge, are not correlated to the presence of particular anthropic activities nearby. Taken together, our results highlighted the ability to use environmental DNA evaluation not only as a tool for biodiversity census but also as a tool to evaluate the ecological status of aquatic environments. Our results confirmed that this technique has the potential to complement traditional methods, although using both approaches may offer a more comprehensive understanding of the ecosystem [
105].
5. Conclusions
The results of this study confirmed the considerable potential of environmental DNA analysis as a tool to evaluate not only the species in a given site but also its ecological status. Results presented in this study show that DNA release into the environment could be useful to identify both strictly aquatic species and terrestrial species that use these sites as a source of water supply. Moreover, our results showed that the use of eDNA can be inserted in a much broader context than a simple census, i.e., in the evaluation of the ecological status of the ecosystem in question. It seems, for example, that environmental DNA could allow us to identify the presence of anthropogenic impacts from the illegal dumping of fishing waste. In this regard, our results detected marine species which could not be in these lakes otherwise, as the water bodies are not in communication with the marine environment. Despite this, our results confirmed that the exclusive use of this technique to replace conventional techniques entirely is not yet possible. There are still too many variables that influence the persistence of environmental DNA, and the detection or otherwise of some species cannot necessarily be connected to their absence or presence. Another important issue concerns the standardization of protocols used due to considerable deviations from the expected values, which are largely dependent on extraction methods, specificity sequencing primers and the sequencing platform applied.
Moreover, it is worth noting that our results could depend on a series of factors, including the lack of DNA barcoding of different taxa in the reference libraries, on the selection of appropriate primer pairs or on the need to use more than one pair to detect a wide range of taxa.
Conventional taxonomic skills today cannot be replaced entirely if we are to ensure the correct characterization of the biodiversity of a given site. However, results obtained undoubtedly provide a satisfactory starting point for the creation of a fish map of these sites and for a census of the biodiversity present, that can be broadened by carrying out further samplings in different seasons.

 ,
, 


