Article

Predation Risk, and Not Shelter or Food Availability, as the Main Determinant of Reproduction Investment in Island Lizards

by
Johannes Foufopoulos
1,*,†,
Yilun Zhao
1,2,†,
Kinsey M. Brock
3,4,
Panayiotis Pafilis
5,6 and
Efstratios D. Valakos
6,7
1
School for Environment and Sustainability, University of Michigan, Dana Building, 440 Church St., Ann Arbor, MI 48109, USA
2
Geography and GIScience, University of Illinois, 1042 Natural History Building, Urbana, IL 61801, USA
3
College of Natural Resources, University of California-Berkeley, Hilgard Hall, Wickson Rd., Berkeley, CA 94709, USA
4
Museum of Vertebrate Zoology, University of California-Berkeley, Valley Life Sciences Building, 3101 UC Berkeley Rd., Berkeley, CA 94709, USA
5
Department of Biology, Section of Zoology and Marine Biology, National and Kapodistrian University of Athens, Panepistimioupolis, Ilissia, 157-84 Athens, Greece
6
Zoological Museum, National and Kapodistrian University of Athens, Panepistimioupolis, Ilissia, 157-84 Athens, Greece
7
Department of Biology, Section of Animal and Human Physiology, National and Kapodistrian University of Athens, Panepistimioupolis, Ilissia, 157-84 Athens, Greece
*
Author to whom correspondence should be addressed.
These authors contributed equally to this work.
Animals 2023, 13(23), 3689; https://doi.org/10.3390/ani13233689
Submission received: 23 February 2023 / Revised: 19 September 2023 / Accepted: 21 November 2023 / Published: 28 November 2023
(This article belongs to the Special Issue Lizard Evolutionary Ecology in Islands)

Abstract

:

Simple Summary

Understanding individual variation in reproductive investment, such as the number and size of eggs a mother produces in a single clutch, is an important species characteristic with implications for resilience to environmental change and conservation. In this study, we aimed to identify the main determinants of female reproductive investment in an island lizard species that experiences different local selection pressures depending on island size and local conditions such as vegetation cover, food availability, and predator species. We found that the number of eggs produced by a female is not just a function of maternal size, but is also strongly shaped by the richness of the local predator community: lizard populations living on islands with the fewest predators showed a >50% reduction in clutch size, as well as corresponding reductions in clutch volume. Our results emphasize the importance of local ecological conditions on vertebrate reproductive investment.

Abstract

Reproductive investment, including the number of offspring produced, is one of the fundamental characteristics of a species. It is particularly important for island vertebrates, which face a disproportionate number of threats to their survival, because it predicts, among other things, a species’ resilience to environmental disruption. Taxa producing more offspring recover more quickly from environmental perturbations and survive environmental change better. However, ecologists do not understand which primary drivers shape a species’ reproductive investment well. Here, we compare the reproductive efforts of 14 island populations of the Aegean Wall Lizard (Podarcis erhardii), which lives across widely diverging environmental conditions. We test three hypotheses, namely that reproductive investment (measured as clutch size, clutch volume) is (1) positively associated with predation risk [‘Predation Risk Hypothesis’]; (2) positively associated with the presence of reliable vegetation cover that provides shelter [‘Gravid Female Protection Hypothesis’]; and (3) limited by (and hence positively correlated with) food availability [‘Food Limitation Hypothesis’]. Although field data are somewhat consistent with all three hypotheses, statistical analyses provide strong support for the Predation Risk Hypothesis. The results not only shed light on which fundamental forces shape reproductive investment in island vertebrates, but can also help shape conservation priorities.

1. Introduction

Island endemics inhabit only a relatively small area of the planet, yet they represent a significant component of Earth’s biodiversity. These taxa also represent a disproportionate fraction of Earth’s endangered biodiversity, with fully 41% of the world’s endangered terrestrial species found predominately in island systems [1]. Island species face particularly high extinction rates [2], as they are impacted by numerous threats including invasive organisms [3,4] and global climate change [5]. The rapidly deteriorating conservation status of island vertebrates adds urgency to understanding the endogenous and exogenous factors that drive their decline.
Island vertebrates are often characterized by a distinct suite of life history changes referred to under the umbrella term ‘island syndrome’ [6]. These changes have been observed across a broad range of disparate island organisms including mammals [7], birds [8], and reptiles [9]. Among reptiles, typical changes associated with island syndrome include shifts in body size [10,11,12], modified limb length and head shapes [13,14], and longer life spans and lower growth rates [15]. Island lizards tend to achieve higher densities [16,17,18], and may also display altered levels of intraspecific aggressiveness [12,19,20] as well as attenuated anti-predator morphologies and behaviors [21,22,23]. Probably the most widely recognized aspect of island syndrome is the modified pattern of reproductive investment, typically in the form of smaller clutches of larger eggs [24,25,26]. However, this pattern is neither universal [27,28] nor consistent [9], and it is not clear which factors drive reproductive investment.
Reproductive investment is a central aspect of a species’ life history and can vary tremendously even across closely related taxa [29,30,31]. Studies over the last half century have revealed a multitude of broad factors that can shape reproduction, including climate [32,33], latitude [30,34,35], elevation [36,37], foraging mode [38], phylogenetic history (e.g., [39,40], and general body bauplan [33], but also proximate environmental conditions such as refugium shape [41,42], resource availability [43], predation [44], and infection with parasites [45].
Chief among others, reproductive effort is thought to be subject to the constraints imposed by resource availability [43]. Numerous studies have demonstrated the importance of both condition and seasonal nutrient intake in shaping clutch size and clutch volume [28,46,47,48]. In practice, comparisons made between high and lower quality habitats or between high and low rainfall years have revealed that food availability can, but does not have to be, a driver of reproductive investment [43,49]. Moreover, it is not clear to what extend food availability modulates individual clutch size across years, and between individuals of a population, or whether it can also act as a long-term driver of macroevolutionary differences in reproductive output across different populations of a species.
Beyond resource availability, perhaps the most attention has been paid to the role of predation on reproductive investment. Both theoretical and empirical studies have revealed that predator-caused mortality can be a particularly important driver of an organism’s patterns of reproduction [38,50,51,52,53]. Indeed, according to classic life history theory, in areas of high mortality, selection should favor an early onset of reproduction and high reproductive investment, even if that comes at the cost of future reproduction [54]. Nonetheless, whether predator-induced mortality affects reproductive investment in relatively isolated island populations has been only rarely tested (e.g., [55]).
Numerous studies have shown that increases in reproductive investment in females come at the cost of declining running ability [56], and that this decline can also undermine longer-term survival [57], revealing a trade-off between current and future reproduction [58,59]. Gravid females can partially compensate for some of this loss in escape ability by modifying their foraging behavior [60,61,62] and initiating escape activities earlier [53,63,64]. Furthermore, gravid females stay closer to refugia [61,62] and reduce their visibility through appropriate microhabitat selection [60]. Consequently, habitats that lack or have only insufficient cover and refugia may exert selective pressure on reduced reproductive investment [65,66]. For example, in Platynotus semitaeniatus, an iguanid lizard species that seeks refuge in narrow rock crevices, females have evolved smaller clutches and a reduced clutch volume which, in turn, allow them to squeeze into smaller crevices to avoid predation [41,42]. Nonetheless, beyond this special case, the hypothesis that the availability of cover can affect reproductive investment has, to our knowledge, never been explicitly tested.
While a steadily growing body of literature has described patterns of vertebrate reproduction on islands, very few studies have investigated which are the proximate drivers that have shaped the evolution of these patterns. Because so many co-varying factors have the potential to affect reproductive output in wildlife [67], an increasing number of studies have taken an intraspecific approach and compared populations across a single widespread species [33,68,69,70]. By comparing multiple locations within the circumscribed geographic range of a single species, investigators can control for many confounding factors such as climate, elevation, body architecture, and phylogenetic effects and identify which microevolutionary processes are ultimately responsible for the observed variation in reproductive output. Focusing on island populations has the added benefit that they are evolutionarily discrete and, especially if small enough, can be considered homogenous in terms of prevailing environmental conditions.
In this study, we describe and analyze the evolutionary patterns of reproductive investment in the Aegean Wall Lizard (Podarcis erhardii)—a lacertid species widely distributed across the Aegean archipelago. By taking advantage of an unusual ecological setting where pronounced life-history differences exist between numerous well-characterized island populations, both in reproductive investment and in the prevailing ecological conditions, we test three fundamental hypotheses regarding the forces driving the evolution of clutch size in island taxa. Specifically, we test whether clutch size and clutch volume are determined by:
  • The amount of food available to the lizards (Food Limitation Hypothesis);
  • The amount of shelter available to the lizards (Gravid Female Protection Hypothesis);
  • The species richness of the local predator community (Predation Risk Hypothesis).
By elucidating these relationships, we aim to shed light on the drivers of the island syndrome and to understand the fundamental causes of reproductive investment in ectothermic organisms.

2. Materials and Methods

2.1. Study System

The study region lies predominantly in the Aegean Sea archipelago located between the southern Balkan peninsula in the west and the Anatolian mainland in the east. The study was conducted on 12 Aegean islands—8 islands in the Cyclades Cluster and 4 islands in the Sporades Cluster—as well as 2 sites located in nearby mainland Greece (Figure 1). Island sizes range from 0.005 km2 to 429 km2. The climate of the region is typically Mediterranean, with long, dry and warm summers and mild, rainy winters [71]. The vegetation cover on the study sites consists mostly of xerophytic, summer-deciduous, coastal heaths termed ‘phrygana’ (which are comprised of diverse, spinose plant communities rich in aromatic taxa), as well as of agricultural fields and sclerophyllous evergreen maquis [71]. The vegetation has been shaped by millennia of anthropogenic human activities, including terraced agriculture and small ruminant grazing [72].

2.2. Study Organism

The Aegean Wall Lizard (Podarcis erhardii) is a medium-sized lacertid lizard species with an adult Snout-Vent Length (SVL) of 49–78 mm [73]. This species is widely distributed across the Greek mainland and the Aegean Sea islands [74]. The species usually mates in spring and females lay their eggs in the period from April to July. Depending on the local conditions, eggs hatch in mid- to late summer [73]. Aegean wall lizards occur in a wide range of open habitats, with a preference for open, stony regions, and tend to be absent from areas with dense vegetation and close forest cover. They are particularly common in areas that provide refugia in the form of broken-up terrain and anthropogenic structures such as dry-stone walls and terraces [75]. Podarcis erhardii consume invertebreates opportunistically, eating a broad range of arthropods [76], with a particular emphasis on Coleoptera, Orthoptera, and soft-bodied larvae [77]. Additional secondary food items include snails [78] and even fruit. Observations suggest that the species displays at least occasionally cannibalistic tendencies [78,79].

2.3. Reproductive Traits

Morphological traits were obtained from museum specimens. Snout-vent length (SVL) and reproductive traits including clutch size, egg volume, and clutch volume were collected from specimens deposited at the Alexander König Zoological Research Museum in Bonn (Germany), as well as from the Zoologische Staatssammlung in Munich (Germany). While the species may occasionally lay a second clutch in mid- to late summer, museum collection dates indicate that all of the reproductive data reported here pertain to first clutches, and are therefore directly comparable across sites [77]. Following dissection, the number of oviductal eggs was recorded as clutch size (Table 1). We recorded the size of oviductal eggs, including the longest and shortest axes, using digital calipers. Egg volume was determined by using the equation for the volume (V) of an ellipsoid:
V = 4 3 π α b 2
where α is half of the longest axis, and b is half of the shortest axis. The clutch volume for each female was calculated as the sum of the individual egg volumes [80].

2.4. Predation Pressure

Numerous types of predators feed on Aegean wall lizards, but their individual presence varies greatly across the range of P. erhardii, depending on ecological, vicariance, and biogeographic factors [21]. While mainland sites tend to harbor diverse communities of avian, mammalian, and reptile predators, some of the smallest islands fail to support even a single type of predator, hence creating a wide range of predation regimes. To obtain a more formal estimation of the predation environment that each population experiences, we followed the methodology of previous authors [21,23,55,81] and used predator species richness as a proxy of predation risk in each area. Predator presence data were obtained from the published literature and were then confirmed though our own field observations.

2.5. Measurement of Food Availability

We investigated the diet of P. erhardii across the study sites spanning a spectrum of ecological conditions by studying biomass and the abundance of arthropods in these sites during the key period during which females forage to form their clutches. Lizard food availability in the Aegean Sea can vary between years dependent on the extent of winter precipitation, and therefore can potentially obscure inter-island differences. However, empirical evidence suggests that this is not the case, as recent investigations have demonstrated that inter-island differences in food availability are sufficiently stable across different years to shape pronounced and consistent differences in P. erhardii body size.
From May to July 2017, five pitfall and sticky trap pairs were set on each island to collect crawling and flying arthropods. All pitfalls and sticky traps were set in randomly selected areas with natural vegetation in the immediate vicinity of the sites where the reproductive data specimens were collected. Specifically, crawling arthropod populations were analyzed by deploying five 400 mL pitfalls containing antifreeze. To determine flying insect populations, we set up five 15.24 cm × 30.48 cm sticky traps placed on 30 cm stakes, over or near the pitfalls on each island. Following collection, all arthropods from pitfalls were washed with ethanol to remove dirt and antifreeze and stored in 60 mL plastic wide-mouthed jars for subsequent identification and measurement. All arthropods were identified to order, and length was measured to the nearest mm using a ruler. The approximate biomass of each individual was then calculated using the standard length-to-biomass equation [82]:
W = 0.0305 · L 2.62
The abundance and biomass of each sticky trap or pitfall trap was calculated and each island’s abundance and biomass were calculated by averaging each sticky strip or pitfall. Because the deployment time of the sticky strips and pitfalls from each island was different, the average abundance and biomass was standardized to a 48 h basis.

2.6. Measurement of Vegetation

While Aegean Wall lizards will sometimes also use crevices in the rocky substrate as refugia, past and ongoing research has shown that the availability of brush cover is critically important for the survival of P. erhardii populations in most regions of the species’ range [77]. Hence, to assess the availability of such refugia, we quantified evergreen brush vegetation cover by utilizing a Normalized Difference Vegetation Index (NDVI) (“Measuring Vegetation”, NASA Earth Observatory). For each island, we downloaded Landsat 8 OLI/TIRS level 2 (surface reflectance) images from Earth Explorer, U.S. Geological Survey. To ensure the accuracy of NDVI, we used only images with less than 10% cloud cover. The NDVI of each surface reflectance image was calculated in ERDAS Imagine 2016. Each image was then input into ArcGIS 10 and clipped to the sample area with 62.5 m radius around each lizard collection site based on the size of the smallest of our field sites (Kokkinonisi). The NDVI of each pixel in the sample area was exported and for each island the NDVI of the sample area was calculated by averaging the values of the corresponding pixels.

2.7. Statistical Analyses

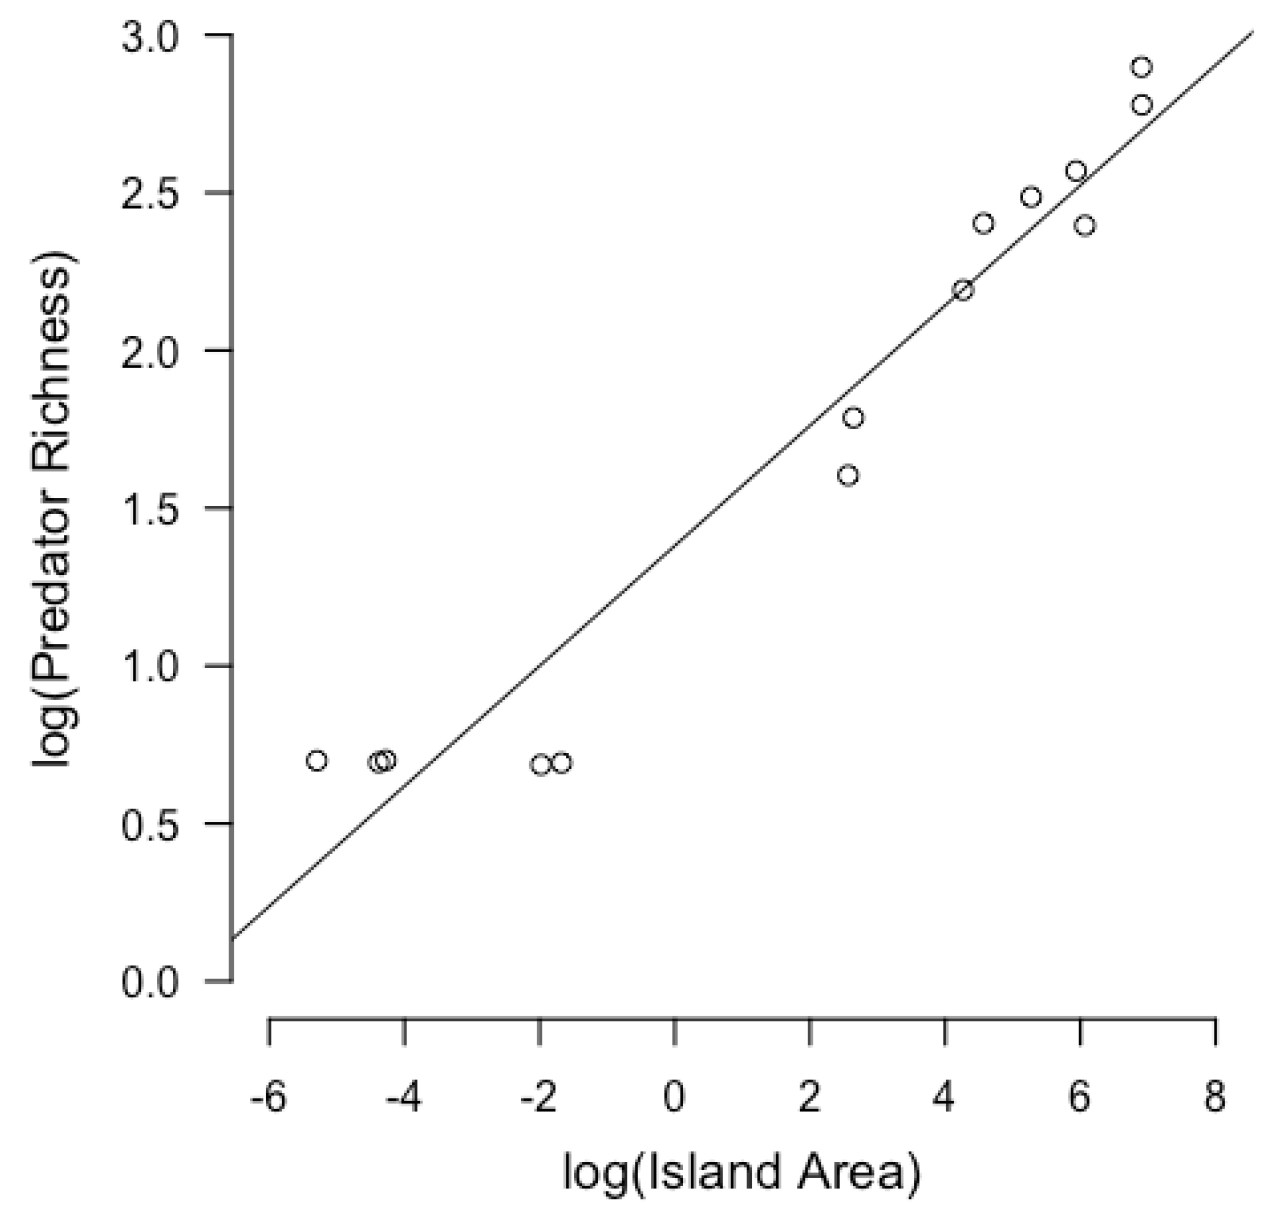
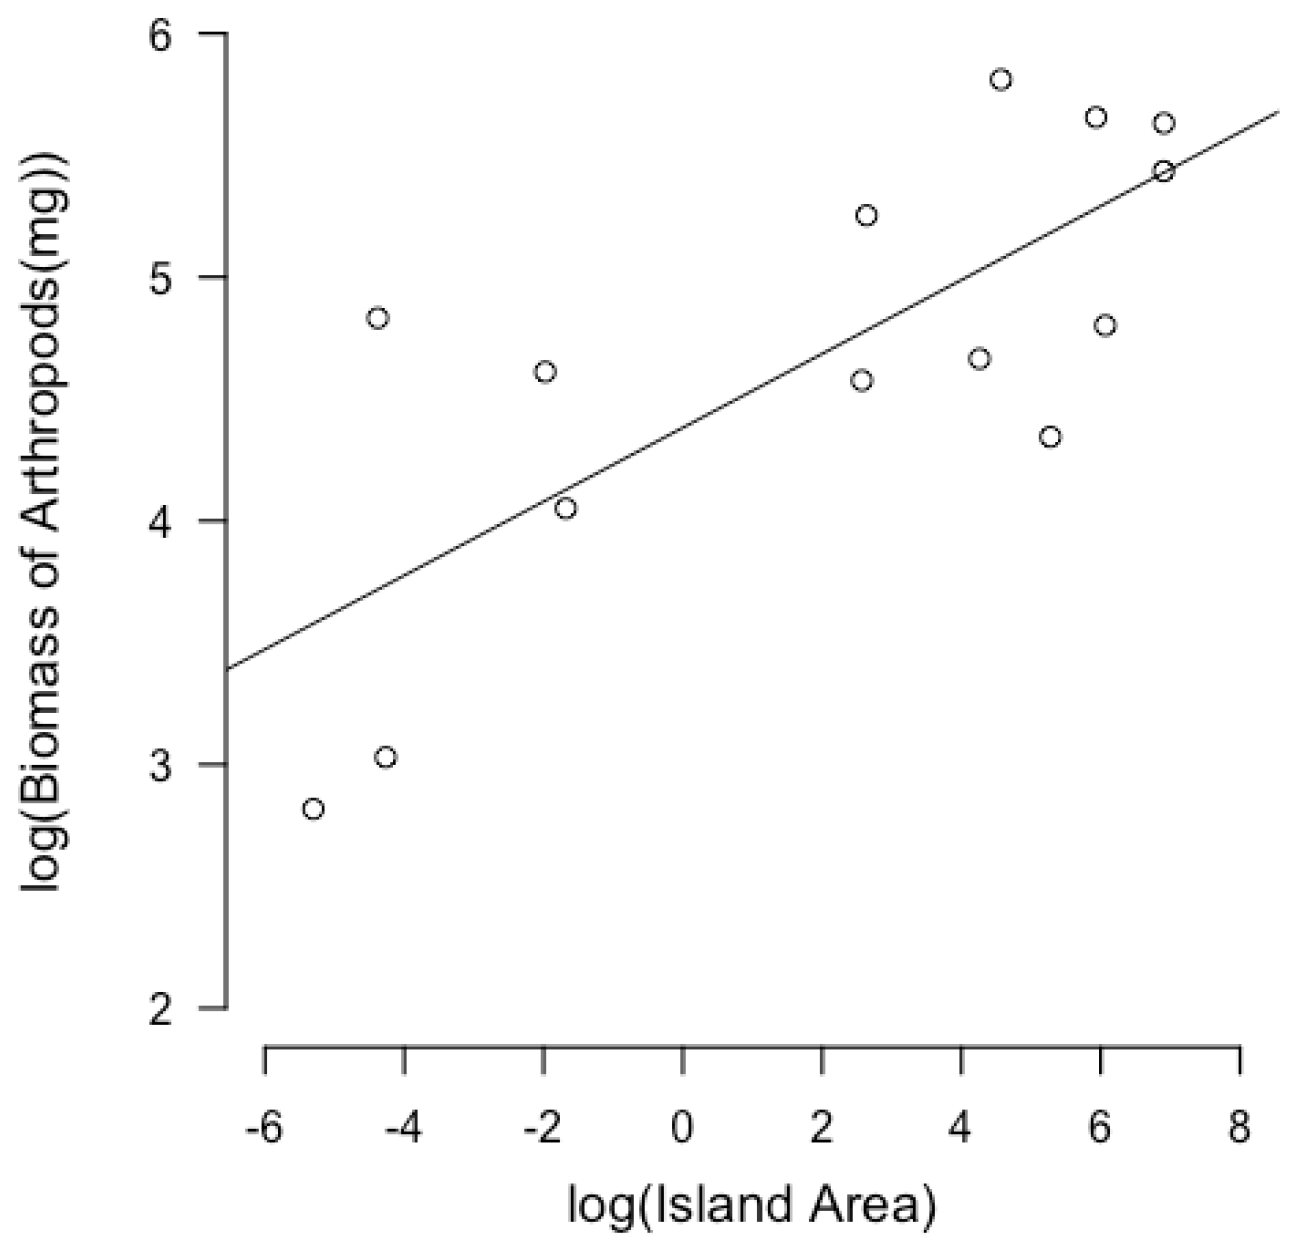
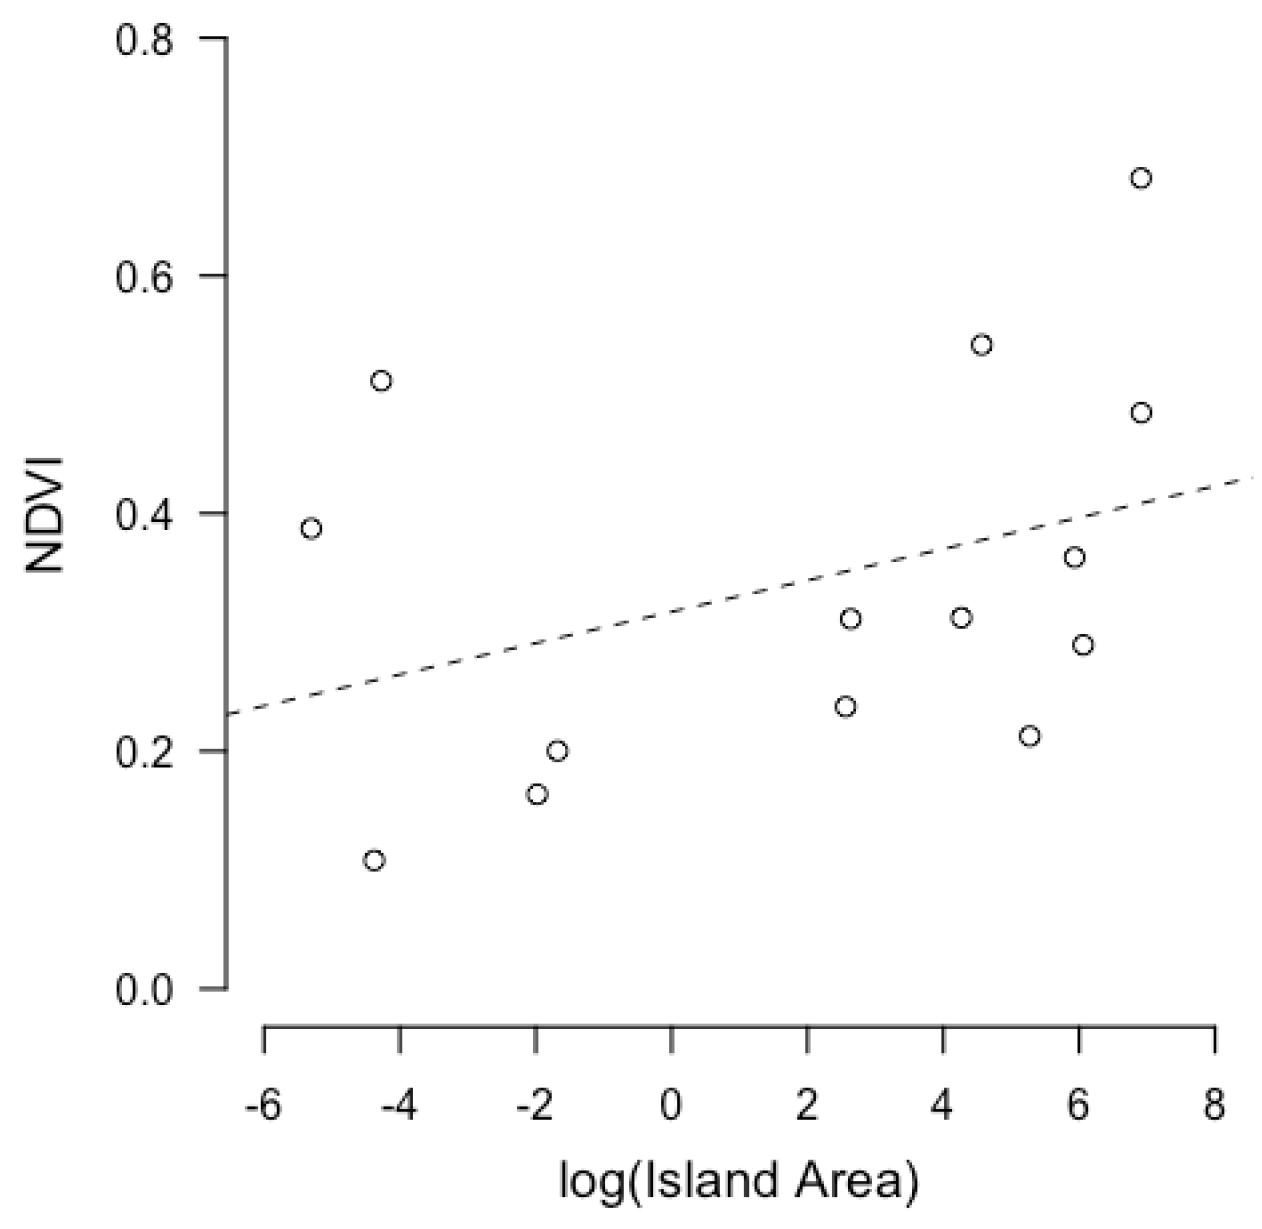
Former studies show that island size influences vegetation, arthropods, and predation risk [83,84,85]. To test this hypothesis, we used linear models to find the relationship between island size (island area) and the number of shelters (vegetation), food availability (biomass of arthropods), and predation risk (predator richness). Since island area has a highly skewed distribution, we used both island area and log-transformed island area as the independent variable when building linear regression models.
Because earlier research has shown that maternal SVL may affect reproductive traits, we included maternal SVL in some of the models as a covariate [28,86]. To avoid issues of collinearity, we tested the correlations between all explanatory variables considered in this paper (maternal SVL, NDVI, predator richness, and biomass of arthropods) and excluded any complex models that had variables that were highly correlated with each other (r > 0.5). Since multiple lizards from each island were measured and individuals from the same island are assumed to be more similar to each other, we built linear mixed effect models in addition to linear models to check the effect of shelter amount, predation risk, and food availability on reproductive traits.
Afterwards, Akaike information criterion (AIC) was used for the comparison of the models. For each reproductive trait, the same types of models (linear model or linear mixed effect model) were compared by AIC. The independent variable(s) in the model with the lowest AIC value were considered the most important factor(s) affecting reproductive traits. Data were analyzed in R and met all test assumptions.

3. Results

3.1. Linear Models of Island Size and Independent Variables

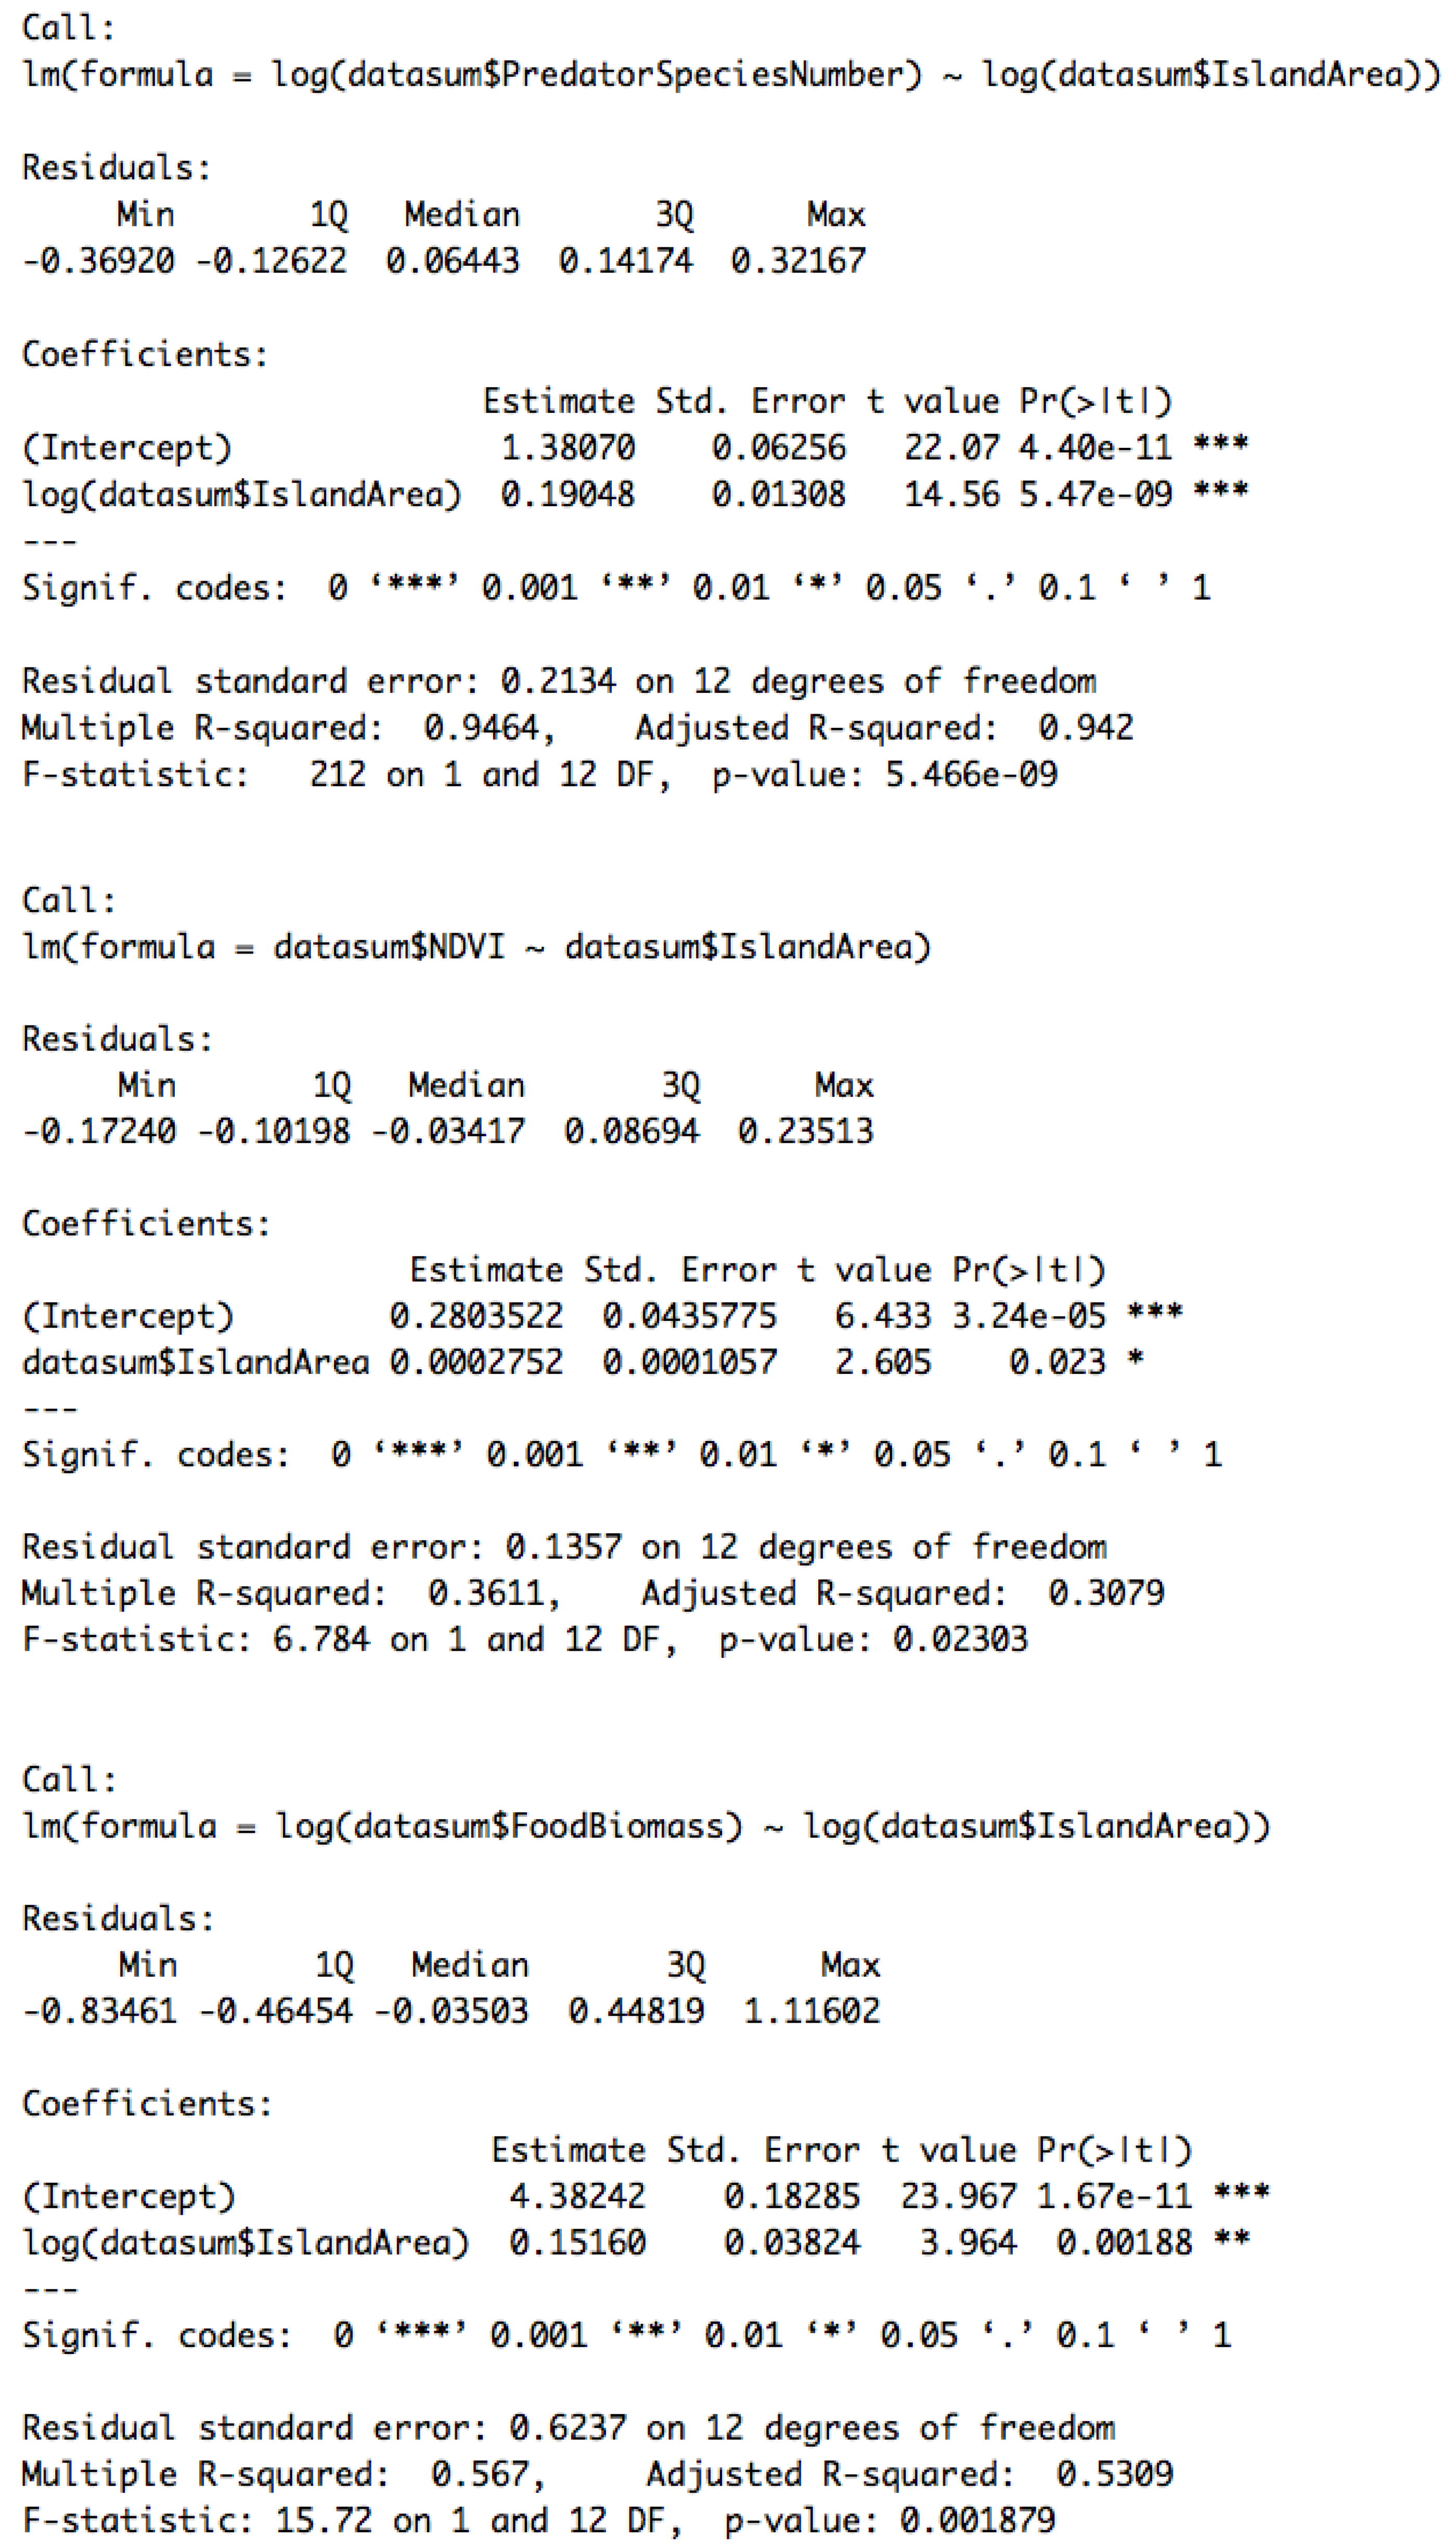
The results of the linear models show that the log-transformed island area has a positive relationship with log-transformed predator richness (b = 0.190 ± 0.013, p < 0.001, R2 adj = 0.942) (Figure 2). The log-transformed biomass of arthropods has a positive correlation with the log-transformed island area (b = 0.152 ± 0.038, p = 0.0018, R2 adj = 0.531) (Figure 3). NDVI shows a positive relationship with island area (b = 0.0002752 ± 0.0001, p = 0.023, R2 adj = 0.308) (Figure 4). Hence, larger islands tend to have higher predation risk, food availability, and extent of shelter-providing vegetation cover (Appendix A).

3.2. Correlations

The correlation between predator richness and NDVI is 0.650 (p < 0.001), the correlation between predator richness and biomass of arthropods is 0.701 (p < 0.001), and the correlation between arthropods biomass and NDVI is 0.600 (p < 0.001). Because the correlations among predator richness, biomass of arthropods, and NDVI are all higher than 0.5, resulting in potential collinearity issues, we did not include them as independent variables in the same models during the model building process. In contrast, the correlation between maternal snout-vent length and predator richness is 0.195 (p = 0.002); the correlation between maternal snout-vent length and NDVI is 0.102 (p = 0.111); and the correlation between maternal snout-vent length and the biomass of arthropods is −0.014 (p = 0.826), all precluding collinearity issues between these variables and maternal body size. Therefore, maternal snout-vent length and one of the other three independent variables were included in the same models.

3.3. Effect of Predator Richness, Biomass of Arthropods, and NDVI on Reproductive Traits

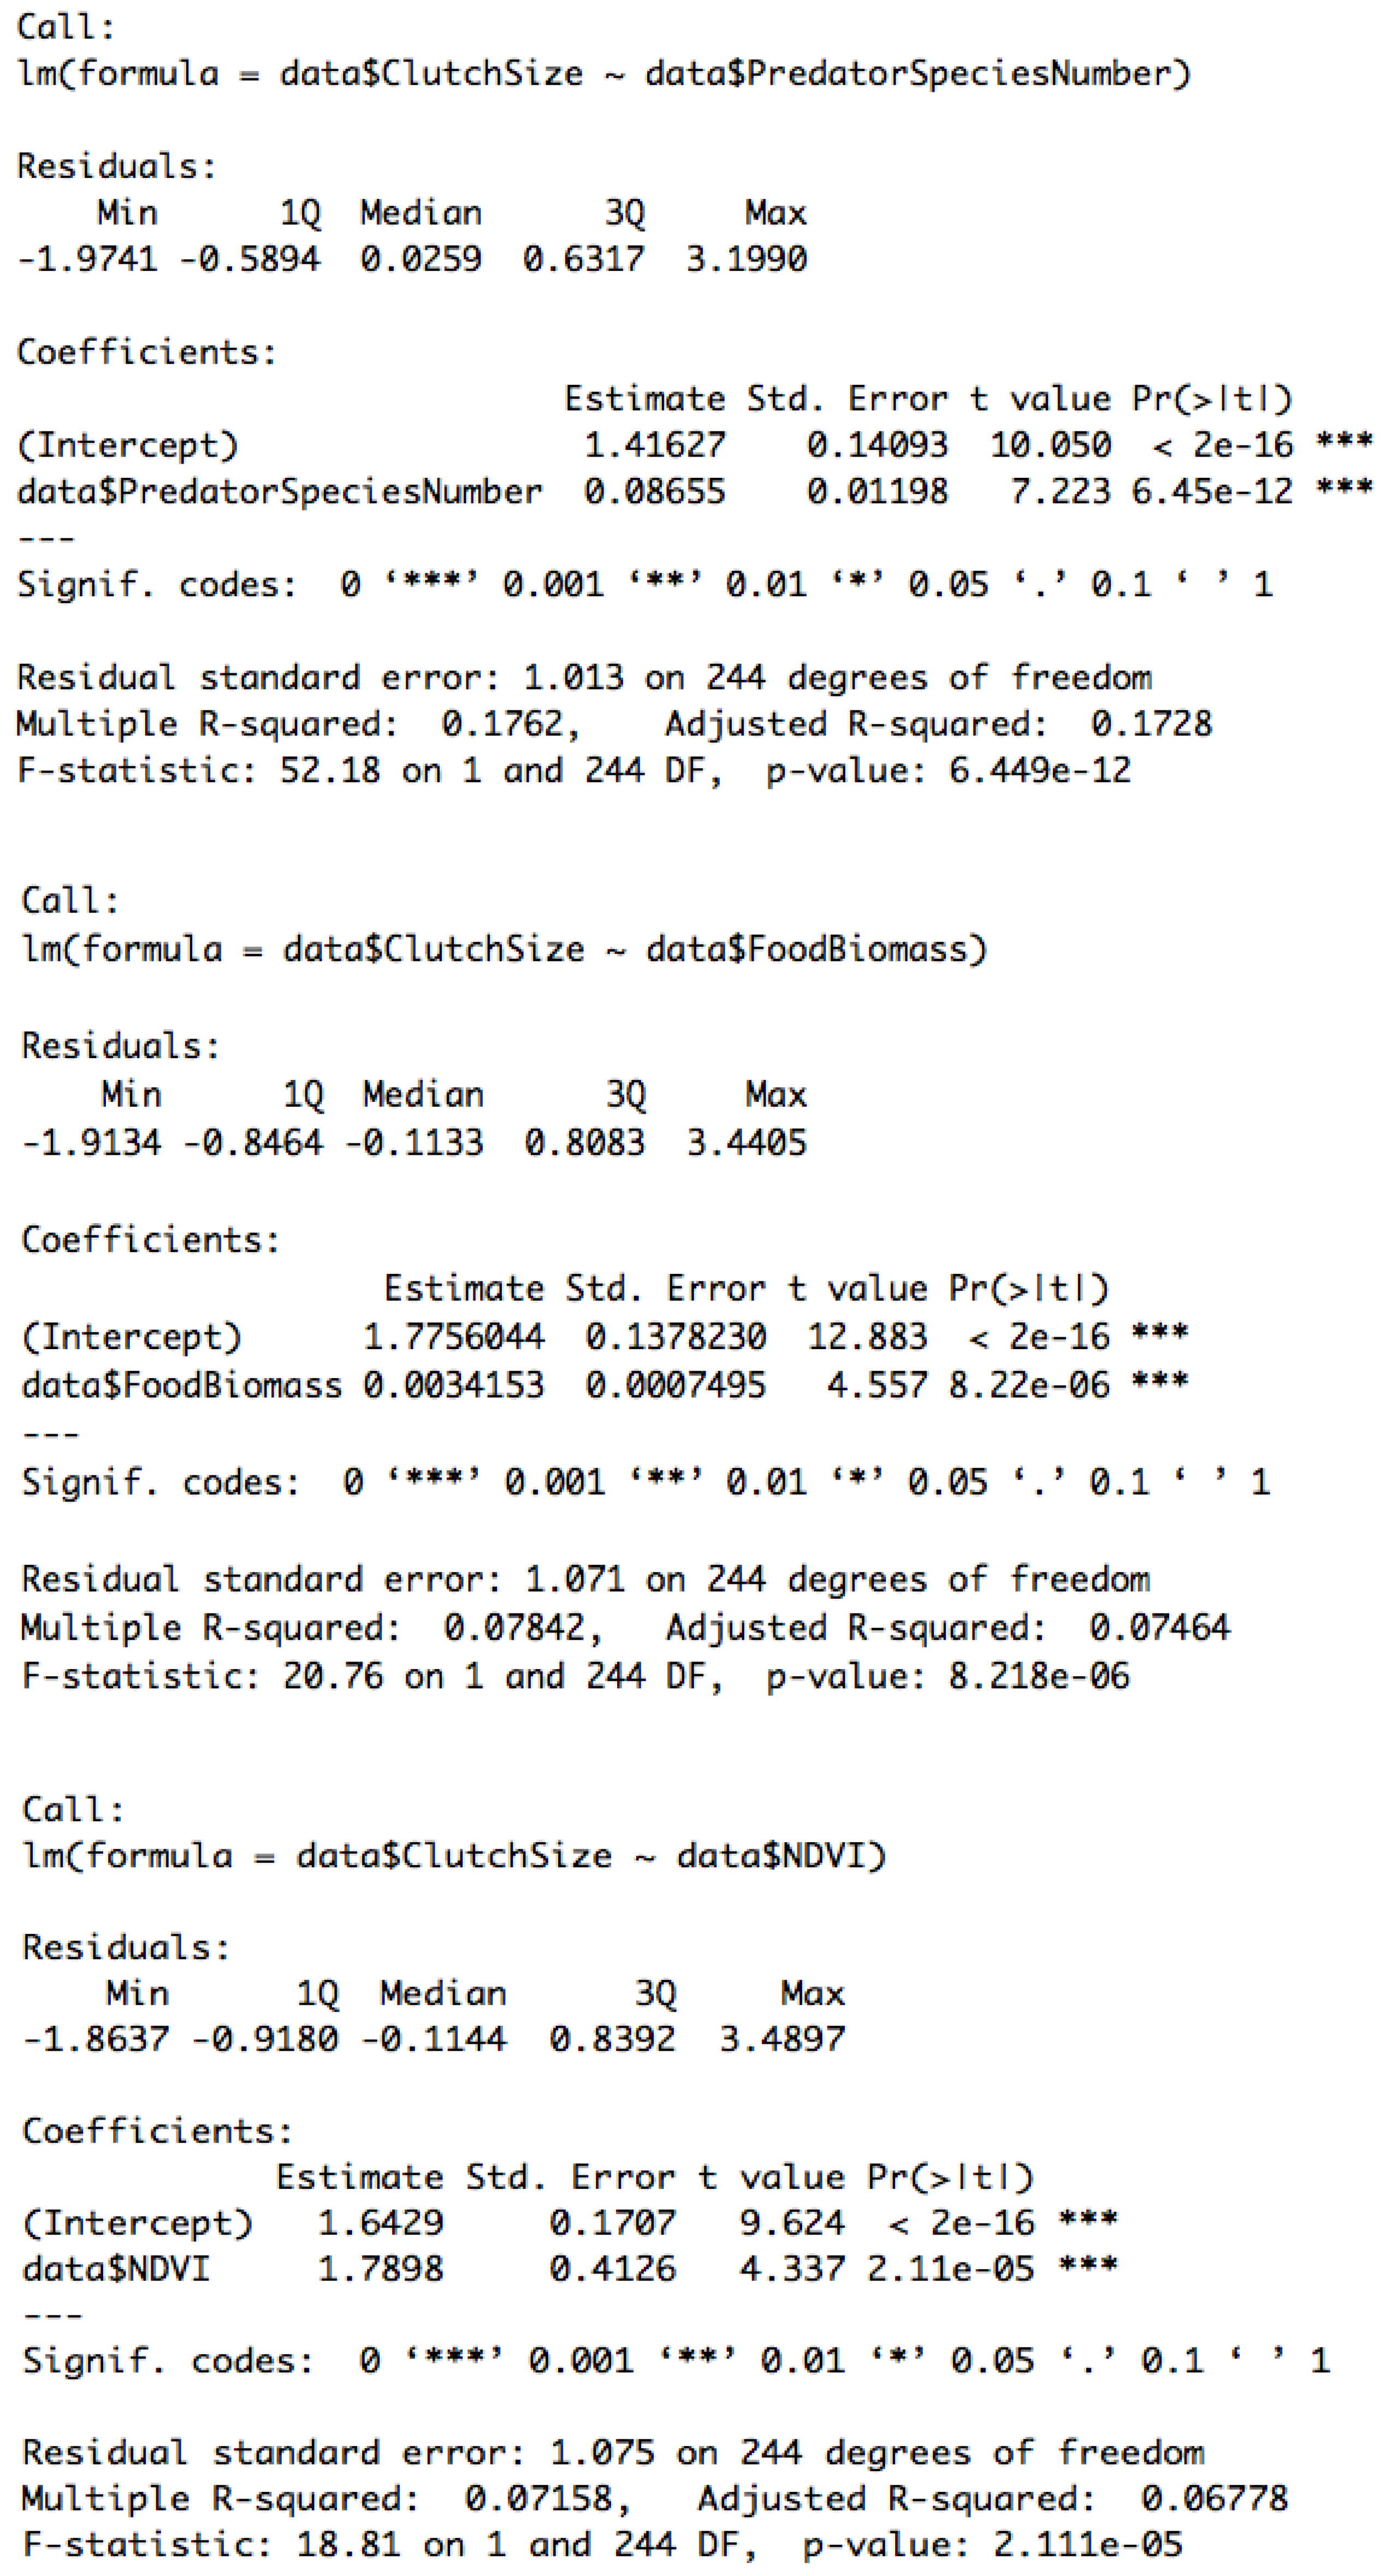
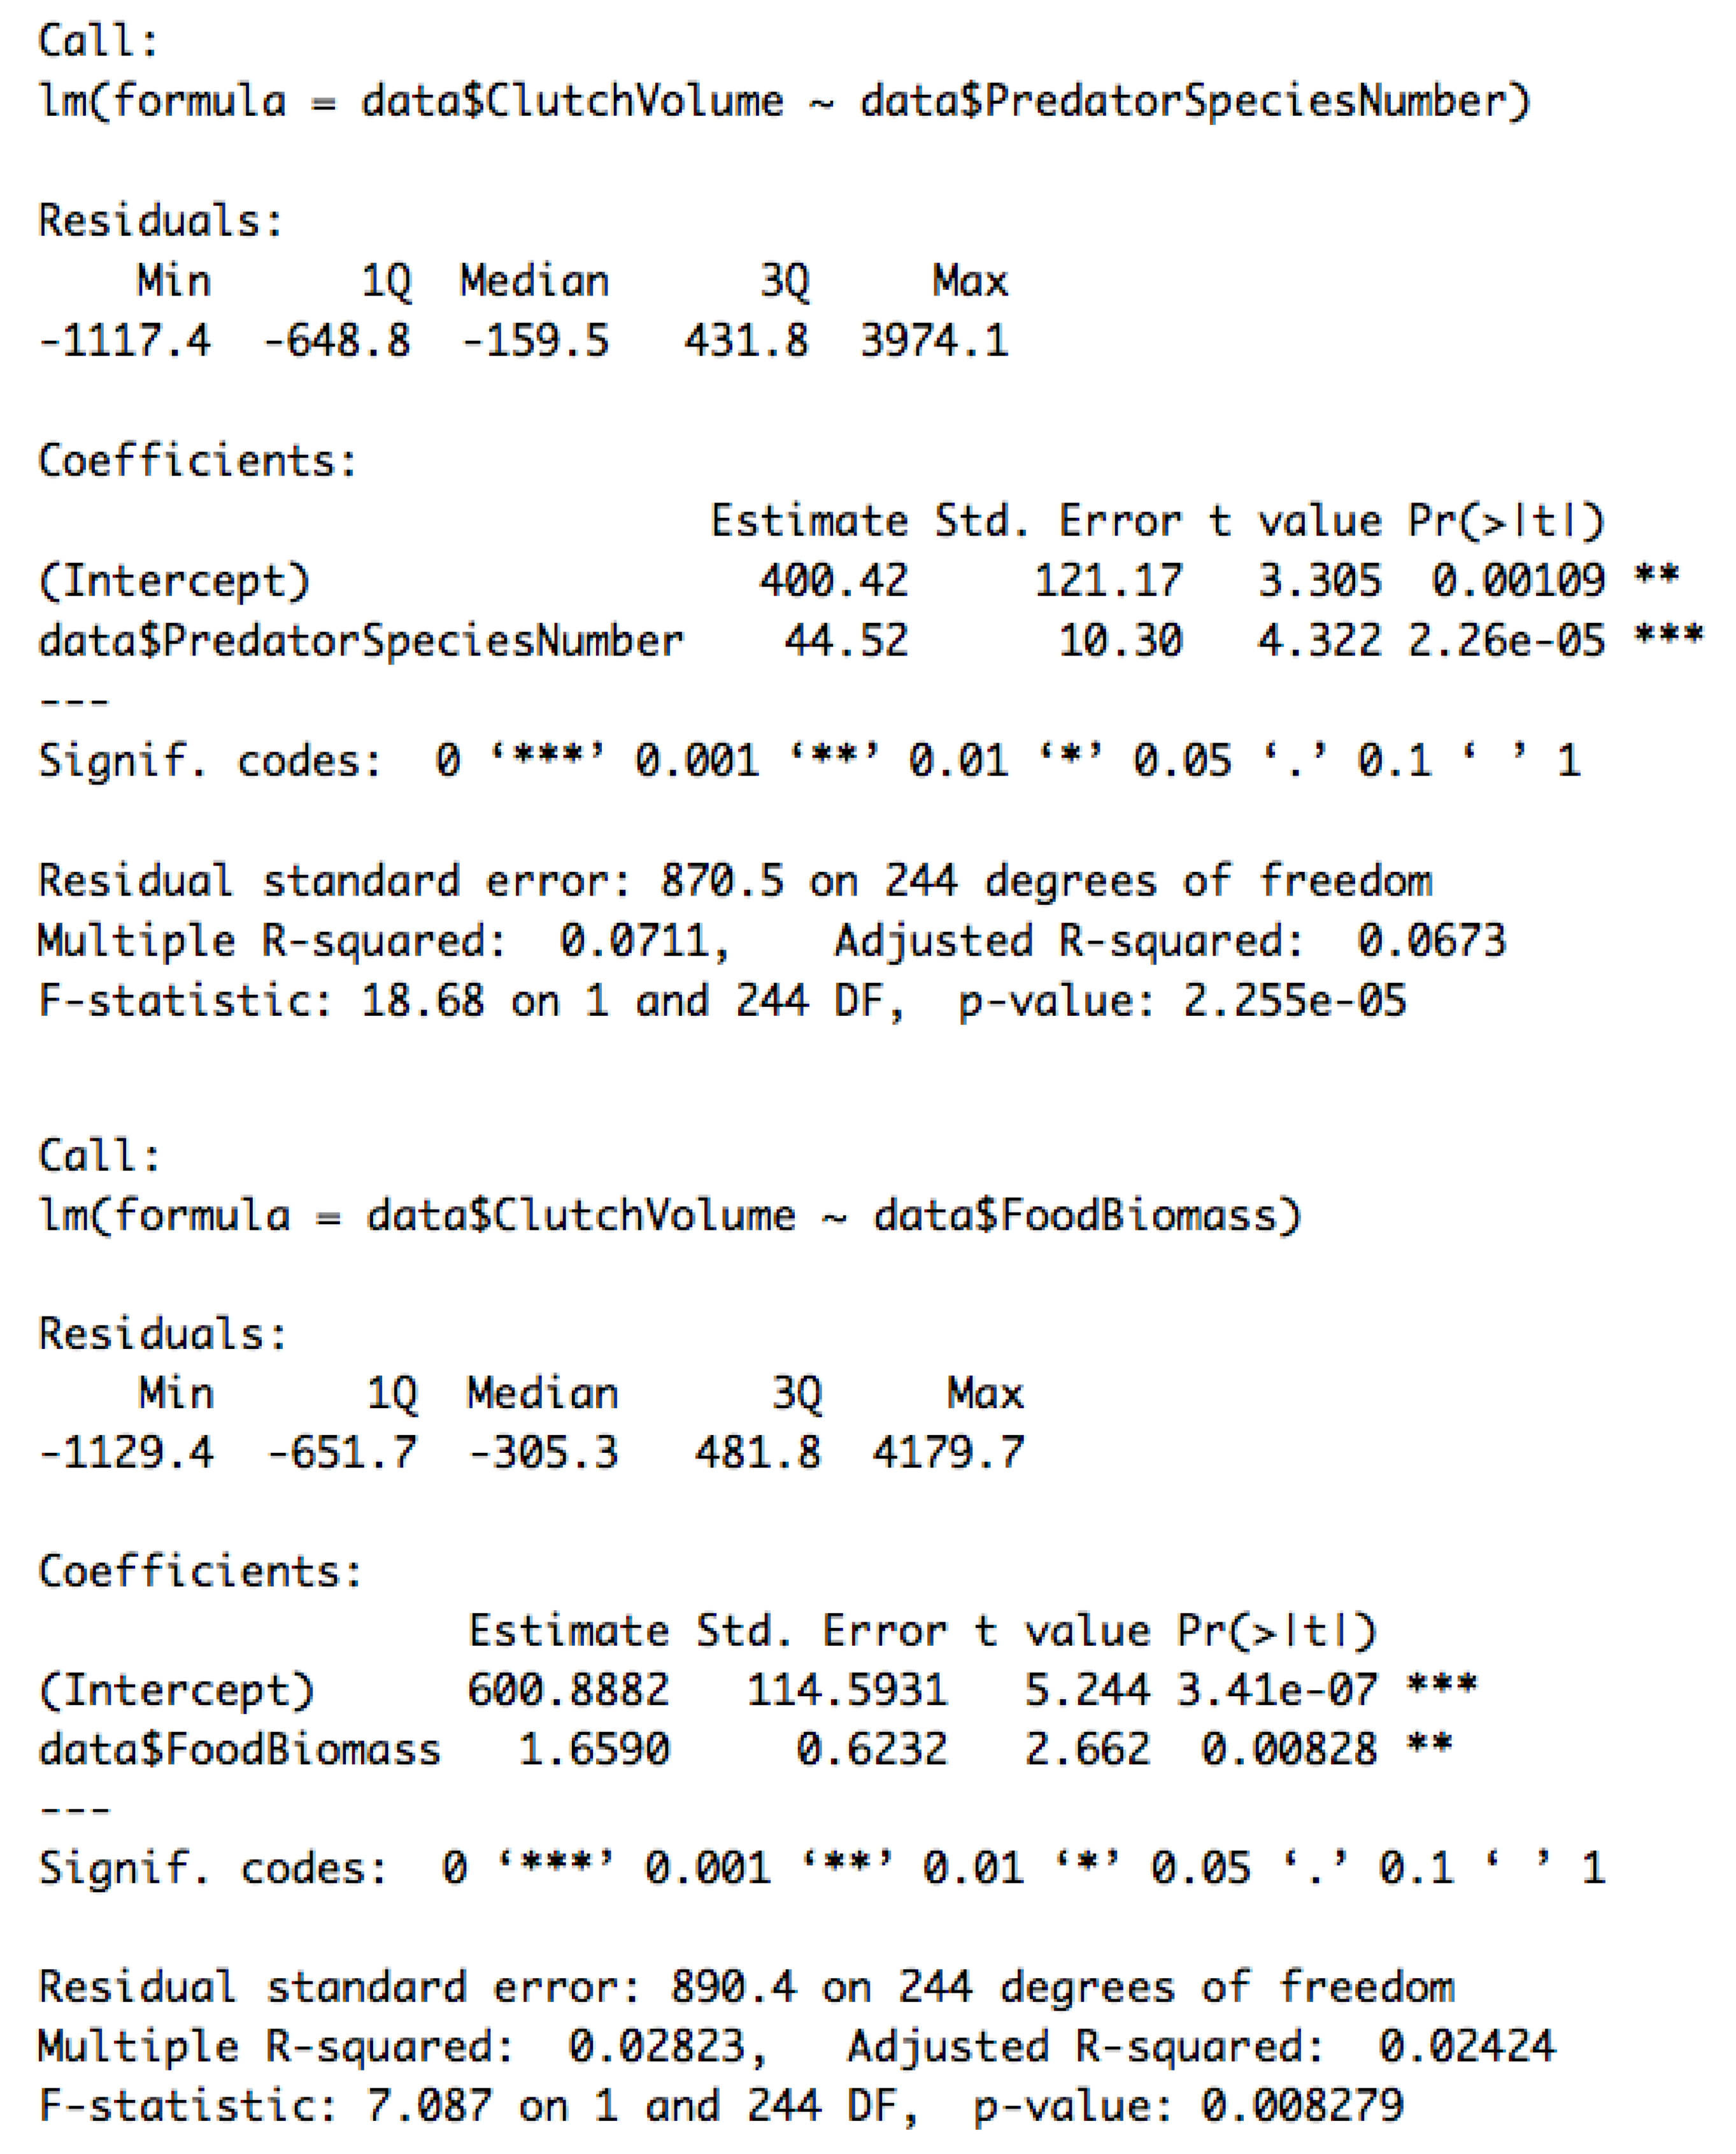
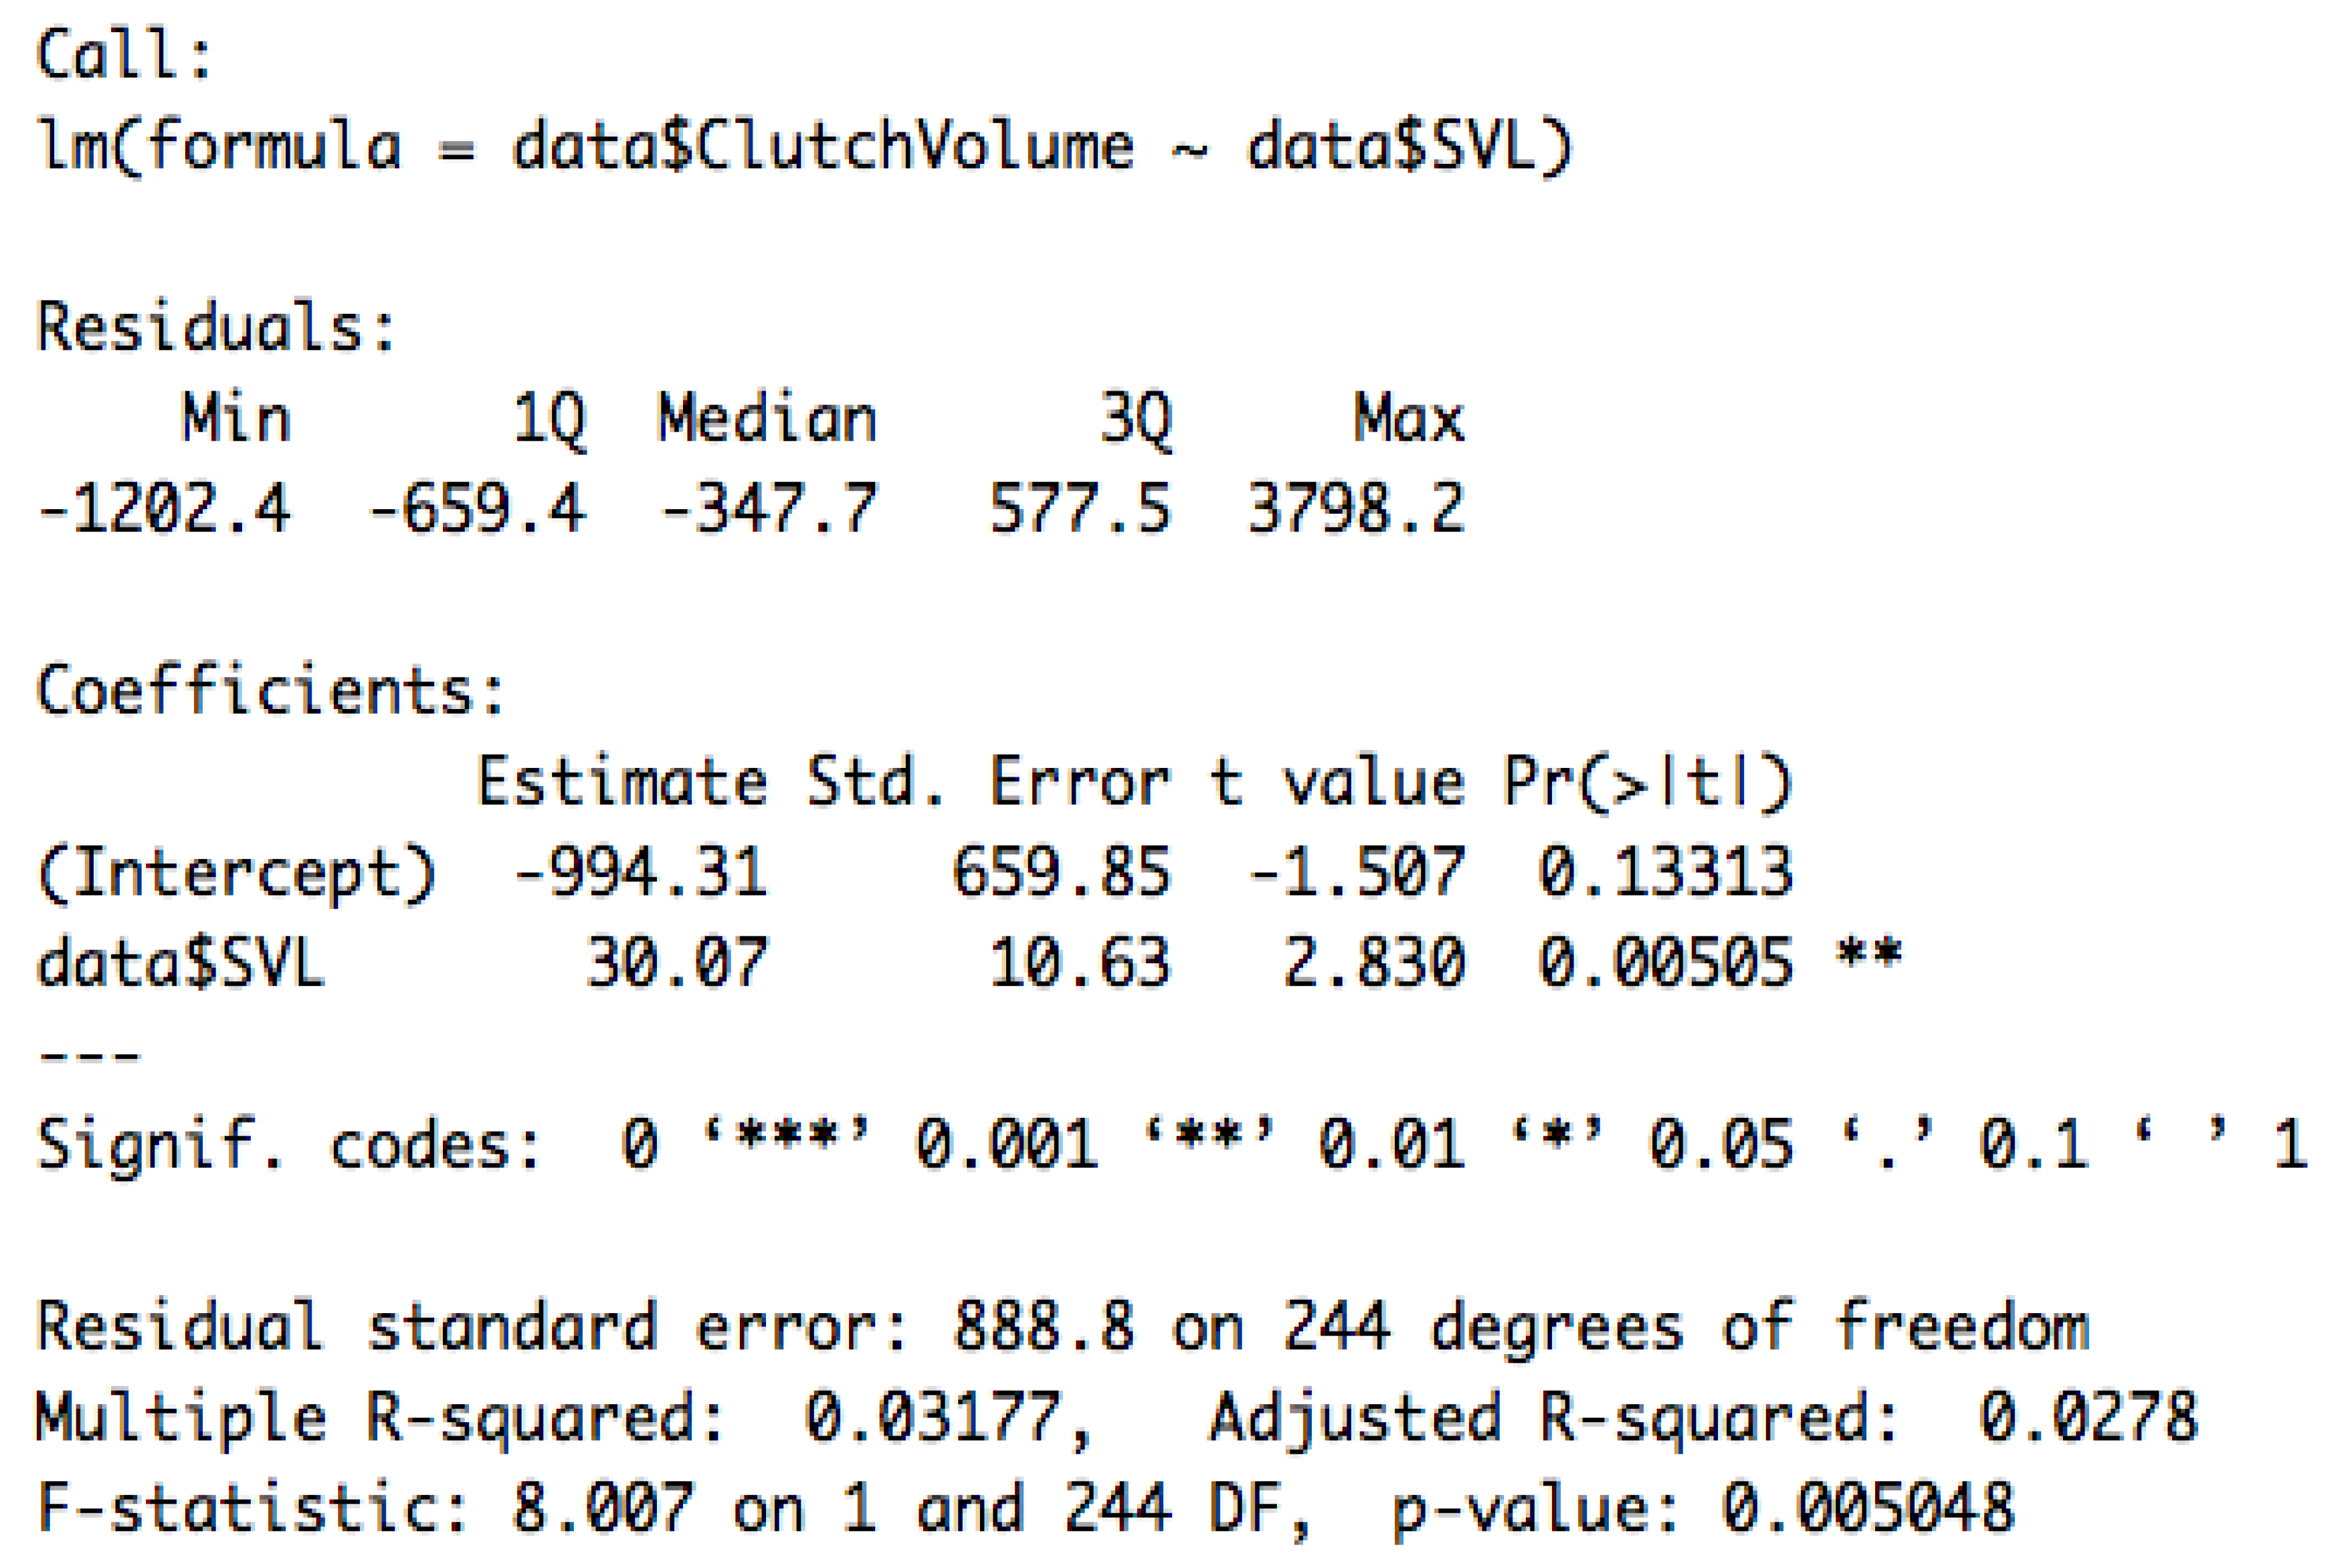
Among three reproductive traits, clutch size was found to be significantly related to predator richness (r = 0.087, p < 0.001, R2 adj = 0.173), biomass of arthropods (r = 0.00341, p < 0.001, R2 adj = 0.07464), and NDVI (r = 1.7898, p < 0.001, R2 adj = 0.06778). Additionally, clutch volume had significant positive relationships with predator richness (r = 44.52, p < 0.001, R2 adj = 0.0673) and biomass of arthropods (r = 1.659, p = 0.00828, R2 adj = 0.02424). We also found significant positive effects of maternal snout-vent length on clutch size (r = 0.06146, p < 0.001, R2 adj = 0.08326) and clutch volume (r = 30.07, p = 0.00505, R2 adj = 0.0278) (Appendix B, Appendix C and Appendix D).

3.4. Hypothesis Testing

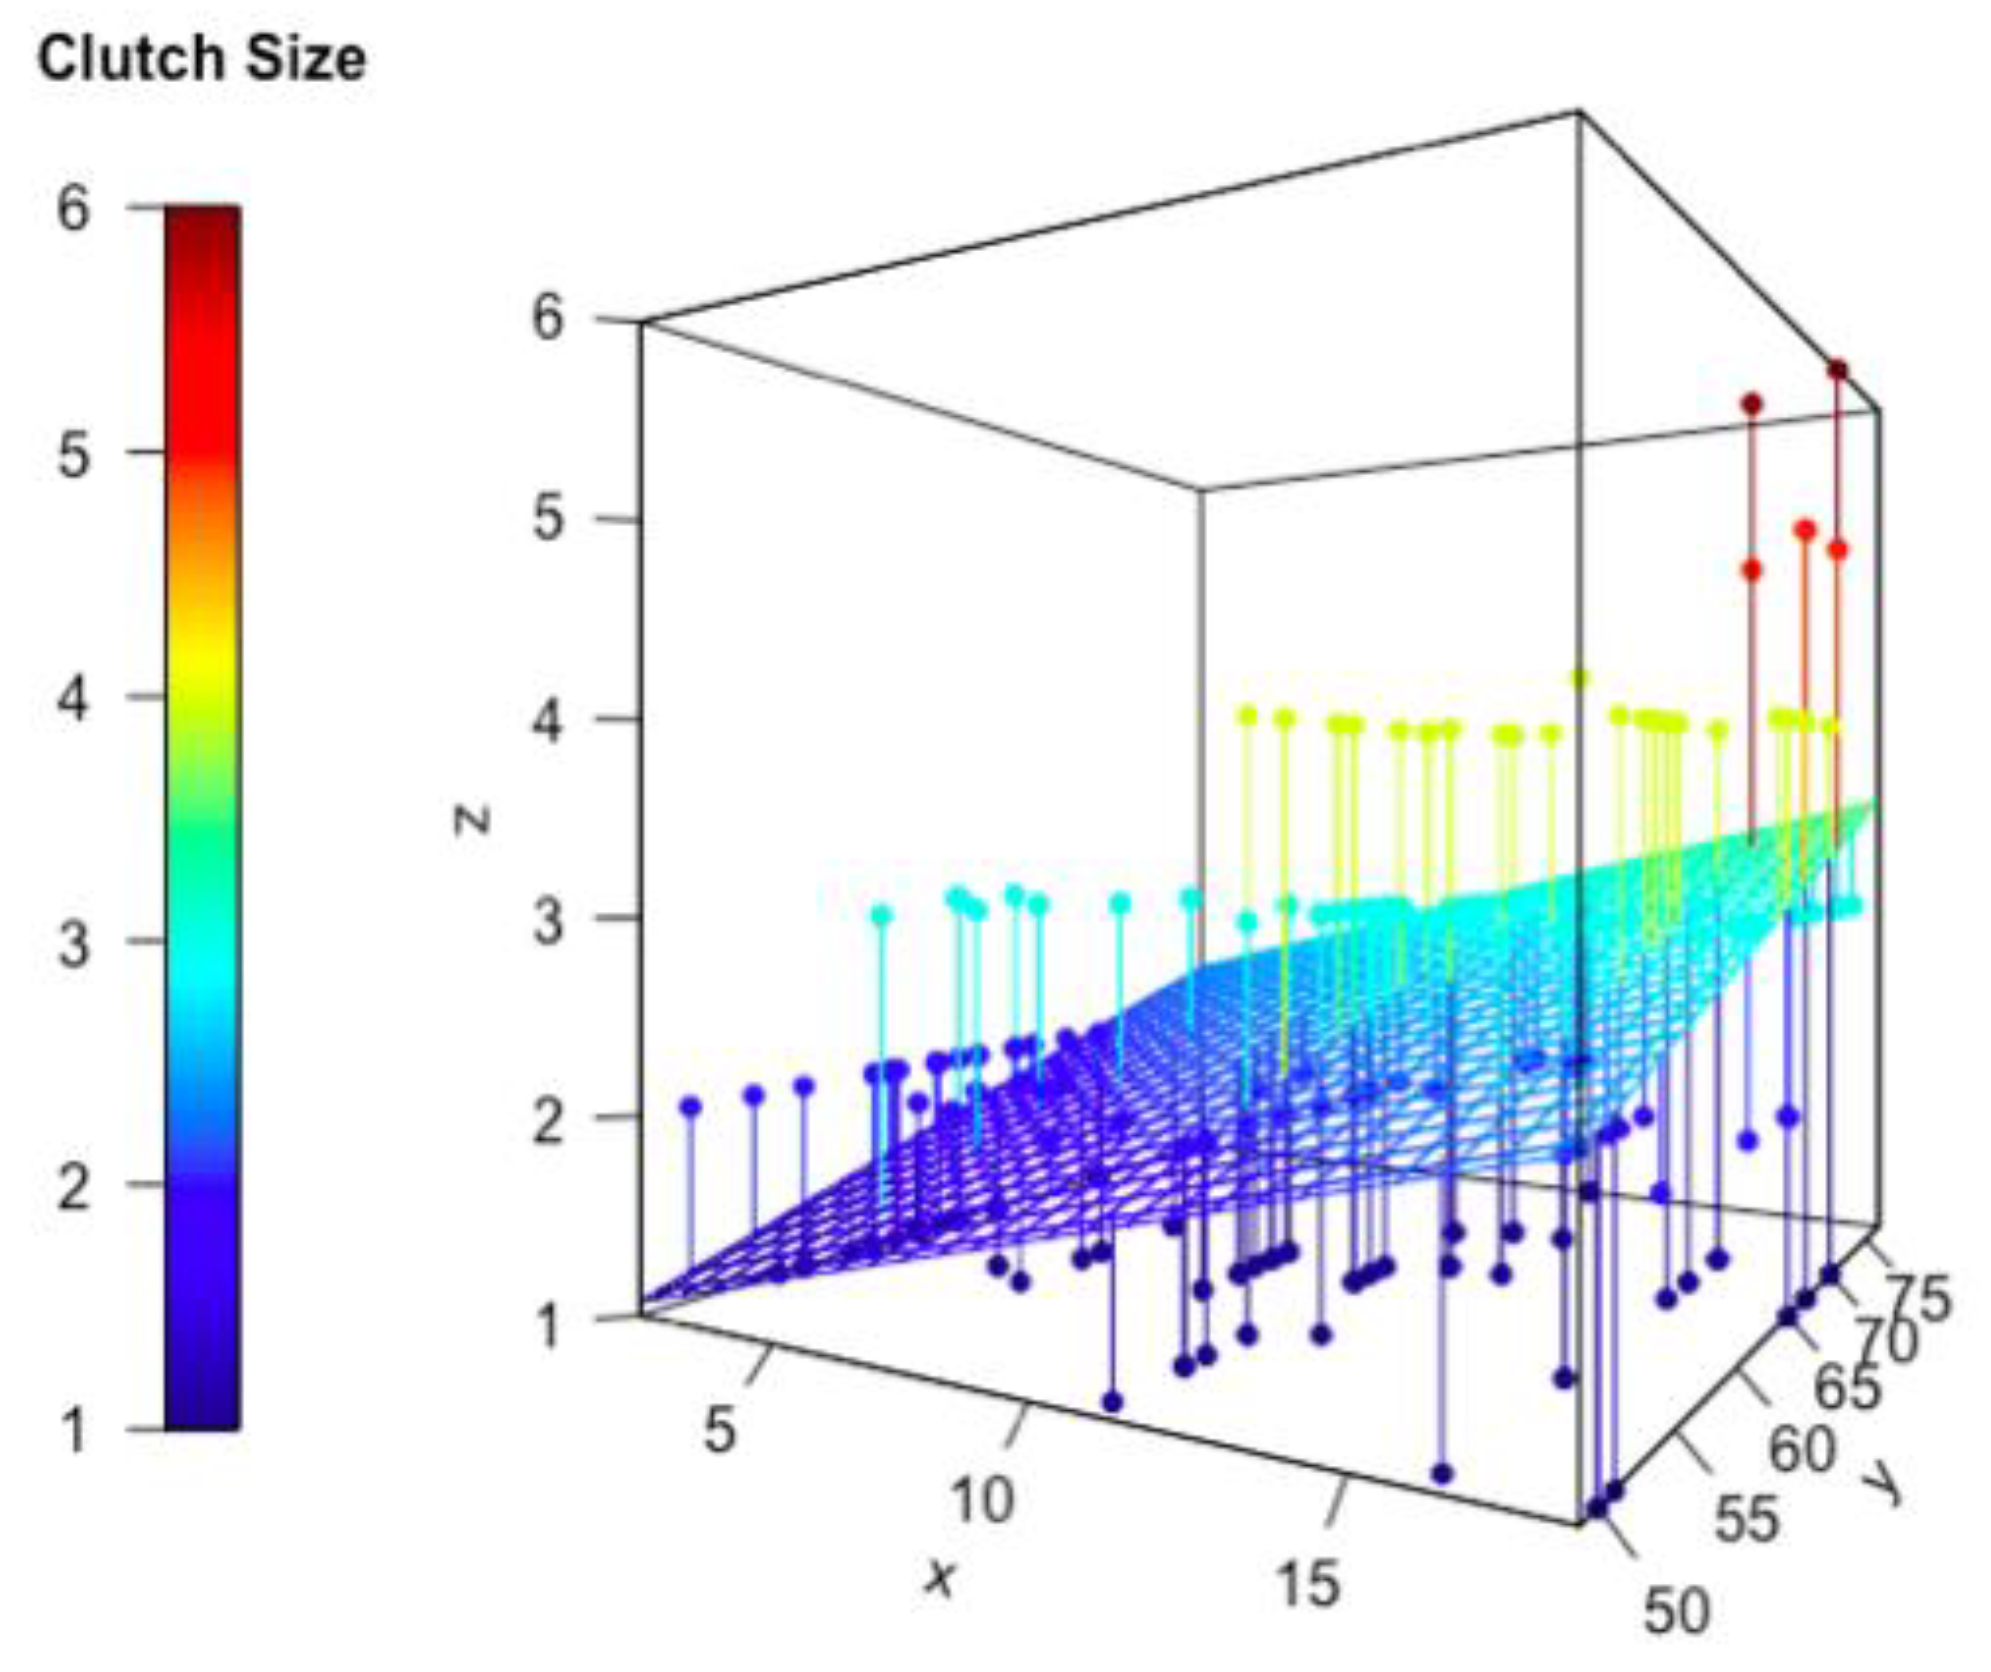
The results of AIC comparisons for the best mixed models are listed in Table 2 and Table 3 and Appendix E (runner-up linear models are in Table A1 and Table A2 in Appendix F). Among all linear mixed effect models for explaining clutch size, the model that contains predator richness and maternal SVL, and location as the random term, has the lowest AIC value (Table 2). For clutch volume, the linear mixed effect model including predator richness and maternal SVL as fixed terms, and location as the random term, has the lowest AIC value in terms of the highest explanation power (Table 3), although an alternative model that included NDVI, maternal SVL, and location was only marginally worse (Appendix E). Figure 5 and Figure 6 are the visualization of these two best models.

4. Discussion

Reproductive investment is a fundamental component of a species’ biology and has been the focus of many fruitful life-history studies [52,65,88,89]. It is also of practical importance; for example, a small clutch size has been shown to be a critical predictor of vulnerability to extinction in lizards [90]. Reptiles have emerged as particularly useful study systems to investigate the evolution of different reproductive investments because of the tremendous variety in reproductive modes that are made possible by ectothermy [30,91]. Because reproduction entails multiple conflicting demands and requires that organisms operate under limited resources (e.g., nutrients [43]; maternal body cavity volume [92]), it is impossible for an individual to optimize all aspects of its life history [30]. This, in turn, creates important trade-offs such as present-season versus future-season reproduction [50,54,57,93,94,95]. Other well-recognized trade-offs exist within a single clutch, e.g., the fundamental choice between the number of offspring and the size of individual offspring [34,96]. Ultimately, a lot of variation exists between as well as within species (e.g., [32,97]), and much of it remains unexplained.
In this study, we tested the effects of different factors on two different reproductive traits, clutch size and clutch volume. Our results provided support to the Predation Risk Hypothesis: we found that clutch size was significantly and positively correlated with predation risk; while food availability and vegetation cover also had a weaker relationship to clutch size, they had little explanatory power. Specifically, regarding clutch size, the model with the lowest AIC score included predator species richness and maternal snout-vent length as explanatory factors. Similarly, the marginally better model for clutch volume included predation risk and maternal snout-vent length as independent variables.
Our analyses indicate that the main factor associated with the evolution of different clutch sizes in island lizards is predator species richness (see Appendix G). As the species richness of syntopic predators decreases, so does clutch size, declining from an average of 2.9 eggs per clutch in Olympiada to 1.4 eggs per clutch on predator-poor Agios Ioannis. Similarly, predator species richness was the most important driver (albeit marginally) of clutch volume, with the smallest clutch volumes found on one of the most predator-poor islands (219 mm3, on Mikropsathoura). These results underscore the primary importance of predation pressure for Lacertid lizards and dovetail with recent investigations that highlight the importance of predation as a general driving force for the evolution of island lizards. For example, intraspecific comparisons across numerous island populations have demonstrated that wall lizards on reduced-predation islands have slower sprint speeds and tend to have relatively shorter legs [98,99]. Furthermore, lizards on low-predation islands have downregulated tail autotomy [100], stray further away from refugia [101,102], and are more apt to let potential predators approach before initiating escape behaviors [21,102] relative to lizards in predator-rich mainland regions.
Previous studies have argued that food availability is a critical driver of reproductive output in vertebrates [43,49,103,104]. While in temperate lizards and in species living in strongly seasonal environments, increased food availability generally translates into larger clutches [43], in more tropical or aseasonal environments it may instead result in more frequent clutches of the same size [49]. Although the Aegean Sea region is a strongly seasonal environment and Podarcis lizards tend to produce only one or at most two clutches annually [105], none of the models including food availability emerged as being the best at explaining the observed clutch size variation. While there were significant correlations between food availability and both clutch size and clutch volume, the explanatory power was very small (R2 adj = 0.075 and 0.024, respectively). Part of this may be because the field methods did not allow us to adequately sample the preferred foods of the species. For example, P. erhardii appears to prefer to feed on larval Coleoptera and Orthoptera [106], two groups of arthropods that are hard to sample either in pitfall or in sticky traps. This species is also known to occasionally consume plant matter, but this does not make up a substantial part of its diet. Alternatively, it is known that clutch investment represents not just the nutrients available during the reproductive season that are then shunted towards reproduction, but also integrates stored lipids, and is a reflection of the general longer-term nutritional status of an animal rather than recent nutritional income. Lastly, it is possible that the average clutch size and volume are phylogenetically conservative traits that represent the long-term optimum for a population, rather than mapping tightly onto the local food availability in a given year. Either one of these may be the reason why we failed to detect a stronger relationship between food availability and clutch size or volume.
Numerous earlier studies have shown that increased reproductive output, whether in mammals [107], birds [108,109] or reptiles [110], incurs multiple costs that can affect future survival. Such costs stem from impaired thermoregulation [111], but especially from reduced locomotor performance, which in turn impairs the escaping ability from predators [53,63]. While the proximate drivers of reduced running speed in gravid females are complex [95], many of the costs center on the need to escape rapidly while carrying additional offspring mass along [110,111]. As a result, gravid females tend to stay close to hiding places, and the presence of sufficient cover and refugia can help females escape predation and perhaps thermoregulate more efficiently [99]. While P. erhardii generally prefers open areas, it requires the presence of hiding places such as sclerophyllous phrygana and maqui vegetation. Consequently, we predicted that the presence of cover in the form of evergreen shrubby vegetation, which can be measured as an island’s NDVI, would be positively related to a population’s reproductive investment. Instead, we found that there was only a weak relationship between clutch size and NDVI. We also found that there was some support for a model incorporating NDVI to explain clutch volume, although this model was not the best (Table 3).

5. Conclusions

In summary, when it comes to reproductive investment, wall lizard populations found in the Aegean Sea region constitute a textbook example of local adaptation. They showcase different degrees of expression of the island syndrome depending on the extend of insularity of a particular population. The number of eggs produced by a female is not just a function of maternal SVL, but is also strongly shaped by the richness of the resident predator community: lizard populations living on islands with the fewest predators showed a >50% reduction in clutch size, as well as corresponding reductions in clutch volume. At the same time, food availability appears to be a modest factor for both clutch size and clutch volume: lizards living on islands with higher food availability have more eggs and larger clutches. The presence of vegetation appears to be positively associated with clutch size (but not clutch volume), presumably because more plant cover allows for slower-moving gravid females to avoid being preyed on and perhaps because of thermoregulatory benefits. Our findings confirm and formalize a previous study highlighting the important effect of predation pressure on the reproductive output of other lizards in the Aegean Sea [55].
Traditional life history theory posits that the observed reductions in clutch size stem from a trade-off between clutch size and average egg (and therefore offspring) size. While in predator-rich environments selective pressures favor the production of a large number of small-bodied offspring, high intraspecific competition among young lizards in low-predation but high-lizard-density environments was expected to favor investment in large-bodied offspring [28]. Instead, we found that low-predation populations produce both small clutches and eggs with relatively unchanged size. There are at least two possible explanations for this pattern. First, it is possible that low-predation islands are also low-productivity environments that do not provide adequate resources for the production of large clutch numbers and volumes. Alternatively, it is possible that selection in low predation islands favors the evolution of long-lived life histories that produce small annual reproductive investment across many years. It is notable that these evolutionary patterns appear to have evolved several times, and relatively rapidly. Some of the strongest inter-population differences occur on neighboring islands (e.g., on Naxos and Glaronissi, which are <5 km away from each other and have been separated for <5000 years), indicating that such differences can evolve quite quickly.

Author Contributions

Conceptualization, J.F. and Y.Z.; methodology, J.F. and Y.Z.; formal analysis, J.F. and Y.Z.; investigation, J.F., Y.Z., P.P. and E.D.V.; resources, J.F. and Y.Z.; writing—original draft preparation, J.F. and Y.Z.; writing—review and editing, J.F., Y.Z., K.M.B., P.P. and E.D.V.; visualization, J.F., Y.Z. and K.M.B.; supervision, J.F.; funding acquisition, J.F. and Y.Z. All authors have read and agreed to the published version of the manuscript.

Funding

Financial support for this research was provided by the School for Environment and Sustainability (SEAS), the Program for Modern Greek, and the Weiser Center for Europe and Eurasia (WCEE), all at the University of Michigan.

Institutional Review Board Statement

Field investigations were conducted under a permit from the University of Michigan IACUC (PRO00006987) and the Greek Ministry for Environment and Energy (Permit Nr.: AΔA: Ω6ΛΝ4653Π8-ΤΨA), and were in full compliance with Greek National Law (Presidential Decree 67/81).

Data Availability Statement

Data are available upon request from the authors.

Acknowledgments

Special thanks to Shannon Brines for all of his help and guidance on the GIS and NDVI data analysis. Sincere thanks also go out to Kathleen Bergen, and Alison Davis Rabosky for their patient assistance with this work. We would also like to thank Mike Rockwell and Graham Bevier for their help in the field, as well as Chuying Lu, Zijun Yang, and Feng-Hsun Chang for assistance with data interpretation and analysis. Lastly, we would like to express our gratitude to W. Böhme for his encouragement and support and for making the Alexander König Zoological Research Museum collections available to us. Similarly, we would also like to thank M. Franzen and F. Glaw at the Zoologische Staatssammlung in Munich for providing us with access to their collections.

Conflicts of Interest

The authors declare no conflict of interest.

Appendix A

R outputs of linear regression between island area and independent variables. Significance notations: *—0.01 < p < 0.05; **—0.001 < p < 0.01; ***—p < 0.001. Same significance conventions apply to all subsequent Appendices.
Animals 13 03689 i001

Appendix B

R outputs of linear regressions between clutch size and independent variables.
Animals 13 03689 i002

Appendix C

R outputs of linear regressions between clutch volume and independent variables.
Animals 13 03689 i003

Appendix D

R outputs of linear regressions between clutch size or clutch volume and maternal snout-vent length.
Animals 13 03689 i004
Animals 13 03689 i005

Appendix E

R outputs of selected models to explain clutch size and clutch volume.
Animals 13 03689 i006
Animals 13 03689 i007

Appendix F

AIC tables of linear mixed effect models of clutch size and linear models of clutch volume.
Table A1. AIC for seven linear models constructed to explain clutch size.
ModelAICc∆ AICcAkaike Weight
CS ~ P + SVL695.69100.998
CS ~ P708.22512.5331.895 × 10−3
CS ~ B + SVL712.71517.0242.007 × 10−4
CS ~ NDVI +SVL719.65123.9596.257 × 10−6
CS ~ SVL733.50437.8126.141 × 10−9
CS ~ B735.80540.1141.943 × 10−9
CS ~ NDVI737.62441.9337.826 × 10−10
CS = Clutch size, P = Predator richness, B = Biomass of arthropods, SVL = maternal snout-vent length. Models were ranked based on their AICc value differences. Associated Akaike weights are provided and were calculated based on the equation: W i A I C = e x p 0.5 Δ i A I C /   k = 1 k e x p ( 0.5 Δ k A I C ) [87].
Table A2. AIC for seven linear models constructed to explain clutch volume.
ModelAIC∆ AICAkaike Weight
CV ~ P + SVL4030.07300.753
CV ~ P4032.5052.4320.223
CV ~ B + SVL4037.2057.1322.128 × 10−2
CV ~ SVL4042.70712.6341.359 × 10−2
CV ~ B4043.60613.5338.668 × −10−4
CV ~ NDVI + SVL4043.92613.8537.386 × 10−4
CV ~ NDVI4049.32519.2524.967 × 10−5
CV = clutch volume, P = predator richness, B = biomass of arthropods, SVL = maternal snout-vent length. Models were compared with their AICc values and their associated Akaike weight, which was calculated using the following equation: W i A I C = e x p 0.5 Δ i A I C / k = 1 k e x p ( 0.5 Δ k A I C ) [87].

Appendix G

Table A3. Predator and area information for each island. The numbers and names of predator species are given. Sources: (H&D) = G. Handrinos and A. Dimitropoulos. 1999. The Raptors of Greece (in Greek), Evstathiadis Group; (H&A) = G. Handrinos, Akriotis, F. 1997. The Birds of Greece. A&C Black (Publishers) Ltd., London, UK.; Cattaneo 1998. Gli Anfibi e i Rettili delle isole greche di Skyros, Skopelos e Alonissos (Sporadi settentrionali), Atti Soc. It. Sci. Nat. Museo Civ. Stor. Nat. Milano, 139/1998 (II): 127–149; (Chond) = Chondropoulos, B.P., 1989. A Checklist of Greek Reptiles. II. The Snakes. Herpetozoa, Wien, 2(1/2), pp. 3–36; JF—Johannes Foufopoulos, field obs.
Island NameArea (km2)Predators
Kokkinonisi0.0052
Snakes: — 0
Birds: Corvus, F. eleon. (H&D)
Mammals: —
Mikropsathoura (Myiga)0.0142
Snakes: — 0
Birds: Corvus (Wt), F. eleon. (H&D)
Mammals: —
Ag. Ioannis0.0332
Snakes: — 0
Birds: Corvus, F. eleon. (H&D)
Mammals: — 0
Kopria0.1382
Snakes: — 0
Birds: Corvus Field observ. (JF) F. eleon (JF)
Mammals:
Glaronisi0.1882
Rats: F. eleon (JF)
Birds: R. rattus (JF)
Ano Koufonisi5.7705
Snakes: Eryx (JF), Vipera (JF).
Birds: F. tinnunculus (JF), Corvus (JF)
Mammals: Rattus sp.
Gioura11.0526
Snakes: Colubridae sp. (Legakis)
Birds: Corvus (JF), B. buteo, F. tinnunc (H&D), F. eleon (H&D),
Mammals: Rattus sp.
Santorini76.1979
Snakes: E. sit (Dimit), E. quat (Clarck 90), T. fall (Chon)
Birds: B. buteo (H&D), F. tinnunc (H&D), F. eleon (H&D), A. noct (H&A), L. sen (H&A), Corvus (Wt),
Mammals: Rattus sp.
Skopelos96.22911
Snakes: E. sit (Dimit), M. monsp (Dimit), E. quat (Cattan 98), V. ammod (Cattan)
Birds: Corvus (Wt), L. senat (Wt), B. buteo (H&D), F. tinnunc (H&D) F. eleon (H&D), A. noct (H&A), L. sen (H&A)
Mammals: Rattus sp., M. foi (JF)
Tinos194.50012
Snakes: E. sit (Dimit), E. quat (Dimit), D. caspius (Dimit), N. natr (Chon), V. amm (Chon), T. fall (Chon)
Birds: B. buteo (H&D), F. tinnunc (H&D), F. eleon (H&D), A. noct (H&A), L. sen (H&A), Corvus (Wt),
Mammals:
Andros380.00013
Snakes: Z. sit, E. quat, D. casp, N. natr, T. fall, V. amm
Birds: B. buteo, C. gall, L. sen, T. fall
Naxos429.785Mammals: R. rat, M. foi, V. vul
11
Snakes: E. quat (JF), N. natr (Chon), V. amm (Chon)
Birds: Corvus (Wt), B. buteo (H&D), B. ruf (H&A), C. gallic (H&A), F. tinnunc (H&D), F. eleon (H&D), A. noct (H&A), L. sen (H&A)
Mammals: R. rat, M. foi (JF)
Olympiada100016
Snakes: Z. sit, E. quat, Z. long, D. casp, P. naj, N. natr, V. amm
Birds: B. buteo, C. gall, C. aer, F. tinnunc, A. noct, L. coll, L. sen, Corvus
Mammals: M. foi
Vevi100018
Snakes: Z. sit, E. quat, D. casp, H. gem, N. natr, P. naj, M. monsp, V. ammo
Birds: B. buteo, C. gall, C. aer, F. tinnunc, A. noct, L. coll, L. sen, Corvus
Mammals: Rattus, M. foi (JF)
Species abbreviations: Reptiles: D. caspDolichophis caspius; E. quatElaphe quatuorlineata; N. natrixNatrix natrix; T. fallTelescopus fallax; V. ammV. ammodytes; Z. sitZamenis situla; Z. longZamenis longissimus. Birds: A. noctAthene noctua; B. buteoButeo buteo; B. rufButeo rufinus; C. gallCircaetus gallicus; C. aerCircus aeroginosus; CorvusCorvus corone and/or Corvus corax; F. eleonFalco eleonorae; F. tinnuncFalco tinnunculus; L. collLanius collurio; L. senLanius senator. Mammals: M. foiMartes foina; R. ratRattus rattus; V. vulpVulpes vulpes.

References

  1. Spatz, D.R.; Zilliacus, K.M.; Holmes, N.D.; Butchart, S.H.M.; Genovesi, P.; Ceballos, G.; Tershy, B.R.; Croll, D.A. Globally threatened vertebrates on islands with invasive species. Sci. Adv. 2017, 3, e1603080. [Google Scholar] [CrossRef] [PubMed]
  2. Whittaker, R.J.; Fernández-Palacios, J.M.; Matthews, T.J.; Borregaard, M.K.; Triantis, K.A. Island biogeography: Taking the long view of nature’s laboratories. Science 2017, 357, eaam8326. [Google Scholar] [CrossRef] [PubMed]
  3. Bellard, C.; Cassey, P.; Blackburn, T.M. Alien species as a driver of recent extinctions. Biol. Lett. 2016, 12, 20150623. [Google Scholar] [CrossRef] [PubMed]
  4. Wikelski, M.; Foufopoulos, J.; Vargas, H.; Snell, H. Galápagos birds and diseases: Invasive pathogens as threats for island species. Ecol. Soc. 2004, 9, 5. [Google Scholar] [CrossRef]
  5. Foufopoulos, J.; Kilpatrick, A.M.; Ives, A.R. Climate change and elevated extinction rates of reptiles from Mediterranean islands. Am. Nat. 2011, 177, 119–129. [Google Scholar] [CrossRef]
  6. Adler, G.H.; Levins, R. The island syndrome in rodent populations. Q. Rev. Biol. 1994, 69, 473–490. [Google Scholar] [CrossRef]
  7. Goltsman, M.; Kruchenkova, E.P.; Sergeev, S.; Volodin, I.; Macdonald, D.W. ‘Island syndrome’ in a population of Arctic foxes (Alopex lagopus) from Mednyi Island. J. Zool. 2005, 267, 405–418. [Google Scholar] [CrossRef]
  8. Clegg, S.M.; Owens, P.F. The ‘island rule’ in birds: Medium body size and its ecological explanation. Proc. R. Soc. Lond. B Biol. Sci. 2002, 269, 1359–1365. [Google Scholar] [CrossRef] [PubMed]
  9. Novosolov, M.; Meiri, S. The effect of island type on lizard reproductive traits. J. Biogeogr. 2013, 40, 2385–2395. [Google Scholar] [CrossRef]
  10. Case, T.J. A general explanation for insular body size trends in terrestrial vertebrates. Ecology 1978, 59, 1–18. [Google Scholar] [CrossRef]
  11. Meiri, S. Size evolution in island lizards. Glob. Ecol. Biogeogr. 2007, 16, 702–708. [Google Scholar] [CrossRef]
  12. Pafilis, P.; Meiri, S.; Foufopoulos, J.; Valakos, E. Intraspecific competition and high food availability are associated with insular gigantism in a lizard. Naturwissenschaften 2009, 96, 1107–1113. [Google Scholar] [CrossRef]
  13. Herrel, A.; Huyghe, K.; Vanhooydonck, B.; Backeljau, T.; Breugelmans, K.; Grbac, I.; Damme, R.V.; Irschick, D.J. Rapid large-scale evolutionary divergence in morphology and performance associated with exploitation of a different dietary resource. Proc. Natl. Acad. Sci. USA 2008, 105, 4792–4795. [Google Scholar] [CrossRef] [PubMed]
  14. Runemark, A.; Hansson, B.; Pafilis, P.; Valakos, E.D.; Svensson, E.I. Island biology and morphological divergence of the Skyros wall lizard Podarcis gaigeae: A combined role for local selection and genetic drift on color morph frequency divergence? BMC Evol. Biol. 2010, 10, 269. [Google Scholar] [CrossRef] [PubMed]
  15. Andrews, R.M. Growth rate in island and mainland anoline lizards. Copeia 1976, 1976, 477–482. [Google Scholar] [CrossRef]
  16. Case, T.J. Species numbers, density compensation, and colonizing ability of lizards on islands in the Gulf of California. Ecology 1975, 56, 3–18. [Google Scholar] [CrossRef]
  17. Novosolov, M.; Rodda, G.H.; Feldman, A.; Kadison, A.E.; Dor, R.; Meiri, S. Power in numbers. Drivers of high population density in insular lizards. Glob. Ecol. Biogeogr. 2016, 25, 87–95. [Google Scholar] [CrossRef]
  18. BeVier, G.T.; Brock, K.M.; Foufopoulos, J. Ecology and home range of the Aegean Wall Lizard (Podarcis erhardii). Herpetol. Conserv. Biol. 2021, 16, 394–404. [Google Scholar]
  19. Cooper, W.E., Jr.; Dimopoulos, I.; Pafilis, P. Sex, age, and population density affect aggressive behaviors in island lizards promoting cannibalism. Ethology 2015, 121, 260–269. [Google Scholar] [CrossRef]
  20. Donihue, C.M.; Brock, K.M.; Foufopoulos, J.; Herrel, A. Feed or fight: Testing the impact of food availability and intraspecific aggression on the functional ecology of an island lizard. Funct. Ecol. 2016, 30, 566–575. [Google Scholar] [CrossRef]
  21. Brock, K.M.; Bednekoff, P.A.; Pafilis, P.; Foufopoulos, J. Evolution of antipredator behavior in an island lizard species, Podarcis erhardii (Reptilia: Lacertidae): The sum of all fears? Evolution 2015, 69, 216–231. [Google Scholar] [CrossRef] [PubMed]
  22. Li, Y.; Xu, F.; Guo, Z.; Liu, X.; Jin, C.; Wang, Y.; Wang, S. Reduced predator species richness drives the body gigantism of a frog species on the Zhoushan Archipelago in China. J. Anim. Ecol. 2011, 80, 171–182. [Google Scholar] [CrossRef] [PubMed]
  23. Pafilis, P.; Foufopoulos, J.; Poulakakis, N.; Lymberakis, P.; Valakos, E.D. Tail shedding in island lizards [Lacertidae, Reptilia]: Decline of antipredator defenses in relaxed predation environments. Evolution 2009, 63, 1262–1278. [Google Scholar] [CrossRef]
  24. Huang, W.S. Ecology and reproductive patterns of the agamid lizard Japalura swinhonis on an east Asian island, with comments on the small clutch sizes of island lizards. Zool. Sci. 2007, 24, 181–188. [Google Scholar] [CrossRef] [PubMed]
  25. Smith, C.C.; Fretwell, S.D. The optimal balance between size and number of offspring. Am. Nat. 1974, 108, 499–506. [Google Scholar] [CrossRef]
  26. Blondel, J. Evolution and ecology of birds on islands: Trends and prospects. Vie Milieu 2000, 50, 205–220. [Google Scholar]
  27. Galán, P. Reproductive characteristics of an insular population of the lizard Podarcis hispanica from Northwest Spain (Cies Islands, Galicia). Copeia 2003, 2003, 657–665. [Google Scholar] [CrossRef]
  28. Pafilis, P.; Foufopoulos, J.; Sagonas, K.; Runemark, A.; Svensson, E.; Valakos, E.D. Reproductive biology of insular reptiles: Marine subsidies modulate expression of the “island syndrome”. Copeia 2011, 2011, 545–552. [Google Scholar] [CrossRef]
  29. Du, W.G.; Ji, X.; Zhang, Y.P.; Xu, X.F.; Shine, R. Identifying sources of variation in reproductive and life-history traits among five populations of a Chinese lizard (Takydromus septentrionalis, Lacertidae). Biol. J. Linn. Soc. 2005, 85, 443–453. [Google Scholar] [CrossRef]
  30. Mesquita, D.O.; Costa, G.C.; Colli, G.R.; Costa, T.B.; Shepard, D.B.; Vitt, L.J.; Pianka, E.R. Life-history patterns of lizards of the world. Am. Nat. 2016, 187, 689–705. [Google Scholar] [CrossRef] [PubMed]
  31. Lundblad, C.G.; Conway, C.J. Ashmole’s hypothesis and the latitudinal gradient in clutch size. Ecol. Evol. 2021, 94, 1349–1366. [Google Scholar] [CrossRef] [PubMed]
  32. Angilletta, M.J., Jr.; Niewiarowski, P.H.; Dunham, A.E.; Leaché, A.D.; Porter, W.P. Bergmann’s clines in ectotherms: Illustrating a life-history perspective with sceloporine lizards. Am. Nat. 2004, 164, E168–E183. [Google Scholar] [CrossRef]
  33. Roitberg, E.S.; Kuranova, V.N.; Bulakhova, N.A.; Orlova, V.F.; Eplanova, G.V.; Zinenko, O.I.; Shamgunova, R.R.; Hofmann, F.; Yakovlev, V.A. Variation of reproductive traits and female body size in the most widely-ranging terrestrial reptile: Testing the effects of reproductive mode, lineage, and climate. Evol. Biol. 2013, 40, 420–438. [Google Scholar] [CrossRef] [PubMed]
  34. Sinervo, B. The evolution of maternal investment in lizards: An experimental and comparative analysis of egg size and its effects on offspring performance. Evolution 1990, 44, 279–294. [Google Scholar] [CrossRef]
  35. Meiri, S.; Avila, L.; Bauer, A.M.; Chapple, D.G.; Das, I.; Doan, T.M.; Doughty, P.; Ellis, R.; Grismer, L.; Kraus, F.; et al. The global diversity and distribution of lizard clutch sizes. Glob. Ecol. Biogeogr. 2020, 29, 1515–1530. [Google Scholar] [CrossRef]
  36. Ballinger, R.E. Intraspecific variation in demography and life history of the lizard, Sceloporus jarrovi, along an altitudinal gradient in southeastern Arizona. Ecology 1979, 60, 901–909. [Google Scholar] [CrossRef]
  37. Cruz-Elizalde, R.; Ramírez-Bautista, A. Reproductive cycles and reproductive strategies among populations of the Rose-bellied Lizard Sceloporus variabilis (Squamata: Phrynosomatidae) from central Mexico. Ecol. Evol. 2016, 6, 1753–1768. [Google Scholar] [CrossRef] [PubMed]
  38. Vitt, L.J.; Congdon, J.D. Body shape, reproductive effort, and relative clutch mass in lizards: Resolution of a paradox. Am. Nat. 1978, 112, 595–608. [Google Scholar] [CrossRef]
  39. Mesquita, D.O.; Colli, G.R. Life history patterns in South American tropical lizards. Reprod. Reptiles Morfol. Ecol. Evol. 2010, 45–71. [Google Scholar]
  40. Werneck FD, P.; Giugliano, L.G.; Collevatti, R.G.; Colli, G.R. Phylogeny, biogeography and evolution of clutch size in South American lizards of the genus Kentropyx (Squamata: Teiidae). Mol. Ecol. 2009, 18, 262–278. [Google Scholar] [CrossRef] [PubMed]
  41. Vitt, L.J. Lizard reproduction: Habitat specificity and constraints on relative clutch mass. Am. Nat. 1981, 117, 506–514. [Google Scholar] [CrossRef]
  42. Goodman, B.A.; Hudson, S.C.; Isaac, J.L.; Schwarzkopf, L. The evolution of body shape in response to habitat: Is reproductive output reduced in flat lizards? Evolution 2009, 63, 1279–1291. [Google Scholar] [CrossRef]
  43. Ballinger, R.E. Reproductive strategies: Food availability as a source of proximal variation in a lizard. Ecology 1977, 58, 628–635. [Google Scholar] [CrossRef]
  44. Hermansson, I.; von Numers, M.; Jaatinen, K.; Öst, M. Predation risk and landscape properties shape reproductive output of an endangered sea duck from two subpopulations with contrasting predation risk. J. Ornithol. 2023, 164, 311–326. [Google Scholar] [CrossRef]
  45. Foufopoulos, J. Host-Parasite Interactions in the Mountain Spiny Lizard Sceloporus jarrovi. Ph.D. Thesis, University of Wisconsin, Madison, WI, USA, 1999; 210p. [Google Scholar]
  46. Jordan, M.A.; Snell, H.L. Life history trade-offs and phenotypic plasticity in the reproduction of Galapagos lava lizards (Microlophus delanonis). Oecologia 2002, 130, 44–52. [Google Scholar] [CrossRef]
  47. Hoy, S.R.; Millon, A.; Petty, S.J.; Whitfield, D.P.; Lambin, X. Food availability and predation risk, rather than intrinsic attributes, are the main factors shaping the reproductive decisions of a long-lived predator. J. Anim. Ecol. 2016, 85, 892–902. [Google Scholar] [CrossRef] [PubMed]
  48. Warne, R.W.; Gilman, C.A.; Garcia, D.A.; Wolf, B.O. Capital breeding and allocation to life-history demands are highly plastic in lizards. Am. Nat. 2012, 180, 130–141. [Google Scholar] [CrossRef]
  49. Du, W.G. Phenotypic plasticity in reproductive traits induced by food availability in a lacertid lizard, Takydromus septentrionalis. Oikos 2006, 112, 363–369. [Google Scholar] [CrossRef]
  50. Schaffer, W.M. Optimal reproductive effort in fluctuating environments. Am. Nat. 1974, 108, 783–790. [Google Scholar] [CrossRef]
  51. Stearns, S.C. The evolution of life history traits: A critique of the theory and a review of the data. Annu. Rev. Ecol. Syst. 1977, 8, 145–171. [Google Scholar] [CrossRef]
  52. Stearns, S.C. The Evolution of Life Histories; Oxford University Press: Oxford, NY, USA, 1992. [Google Scholar]
  53. Magnhagen, C. Predation risk as a cost of reproduction. Trends Ecol. Evol. 1991, 6, 183–186. [Google Scholar] [CrossRef] [PubMed]
  54. Schwarzkopf, L. Measuring trade-offs: A review of studies of costs of reproduction in lizards. In Lizard Ecology: Historical and Experimental Perspectives; Vitt, L.J., Pianka, E.R., Eds.; Princeton University Press: Princeton, NJ, USA, 1994; pp. 7–30. [Google Scholar]
  55. Schwarz, R.; Itescu, Y.; Antonopoulos, A.; Gavriilidi, I.-A.; Tamar, K.; Pafilis, P.; Meiri, S. Isolation and predation drive gecko life-history evolution on islands. Biol. J. Linn. Soc. 2020, 129, 618–629. [Google Scholar] [CrossRef]
  56. Van Damme, R.; Bauwens, D.; Verheyen, R.F. Effect of relative clutch mass on sprint speed in the lizard Lacerta vivipara. J. Herpetol. 1989, 23, 459–461. [Google Scholar] [CrossRef]
  57. Miles, D.B.; Sinervo, B.; Frankino, W.A. Reproductive burden, locomotor performance, and the cost of reproduction in free ranging lizards. Evolution 2000, 54, 1386–1395. [Google Scholar]
  58. Reznick, D. Costs of reproduction: An evaluation of the empirical evidence. Oikos 1985, 44, 257–267. [Google Scholar] [CrossRef]
  59. Reznick, D. Measuring the costs of reproduction. Trends Ecol. Evol. 1992, 7, 42–45. [Google Scholar] [CrossRef] [PubMed]
  60. Cooper, W.E.; Vitt, L.J.; Hedges, R.; Huey, R.B. Locomotor impairment and defense in gravid lizards (Eumeces laticeps): Behavioral shift in activity may offset costs of reproduction in an active forager. Behav. Ecol. Sociobiol. 1990, 27, 153–157. [Google Scholar] [CrossRef]
  61. Braña, F. Shifts in body temperature and escape behaviour of female Podarcis muralis during pregnancy. Oikos 1993, 66, 216–222. [Google Scholar] [CrossRef]
  62. Bauwens, D.; Thoen, C. Escape tactics and vulnerability to predation associated with reproduction in the lizard Lacerta vivipara. J. Anim. Ecol. 1981, 50, 733–743. [Google Scholar] [CrossRef]
  63. Brown, G.P.; Shine, R. Effects of reproduction on the antipredator tactics of snakes (Tropidonophis mairii, Colubridae). Behav. Ecol. Sociobiol. 2004, 56, 257–262. [Google Scholar] [CrossRef]
  64. Lima, S.L.; Dill, L.M. Behavioral decisions made under the risk of predation: A review and prospectus. Can. J. Zool. 1990, 68, 619–640. [Google Scholar] [CrossRef]
  65. Cruz-Elizalde, R.; Ramírez-Bautista, A.; Stephenson, B.P.; Luja, V.H.; Hernández-Salinas, U. Variation in female reproduction between populations of the arboreal lizard Urosaurus bicarinatus (Squamata: Phrynosomatidae) from two different environments in Mexico. Salamandra 2017, 53, 359–367. [Google Scholar]
  66. Haenel, G. Effects of habitat on clutch size of ornate tree lizards, Urosaurus ornatus. West. N. Am. Nat. 2011, 71, 247–256. [Google Scholar] [CrossRef]
  67. Dunham, A.E.; Miles, D.B. Patterns of covariation in life history traits of squamate reptiles: The effects of size and phylogeny reconsidered. Am. Nat. 1985, 126, 231–257. [Google Scholar] [CrossRef]
  68. Niewiarowski, P.H.; Angilletta, M.J.; Leaché, A.D. Phylogenetic comparative analysis of life-history variation among populations of the lizard Sceloporus undulatus: An example and prognosis. Evolution 2004, 58, 619–633. [Google Scholar] [CrossRef] [PubMed]
  69. Díaz, J.; Pérez-Tris, J.; Tellería, J.; Carbonell, R.; Santos, T. Reproductive investment of a Lacertid lizard in fragmented habitat. Conserv. Biol. 2005, 19, 1578–1585. [Google Scholar] [CrossRef]
  70. Iverson, J.B.; Higgins, H.; Sirulnik, A.; Griffiths, C. Local and geographic variation in the reproductive biology of the snapping turtle (Chelydra serpentina). Herpetologica 1997, 53, 96–117. [Google Scholar]
  71. Giorgi, F.; Lionello, P. Climate change projections for the Mediterranean region. Glob. Planet. Change 2008, 63, 90–104. [Google Scholar] [CrossRef]
  72. Fielding, J.; Turland, N. Flowers of Crete, 2nd ed.; Royal Botanic Gardens, Kew: London, UK, 2008. [Google Scholar]
  73. Grove, A.T.; Rackham, O. The Nature of Mediterranean Europe: An Ecological History; Yale University Press: New Haven, CT, USA, 2023. [Google Scholar]
  74. Valakos, E.; Pafilis, P.; Sotiropoulos, K.; Lymberakis, P.; Maragou, P.; Foufopoulos, J. The Amphibians and Reptiles of Greece; Chimaira: Frankfurt, Germany, 2008. [Google Scholar]
  75. Brock, K.M.; Madden, I.E. Morph-specific differences in escape behavior in a color polymorphic lizard. Behav. Ecol. Sociobiol. 2022, 76, 104. [Google Scholar] [CrossRef]
  76. Arnold, E.N. Resource partition among lacertid lizards in southern Europe. J. Zool. 1987, 1, 739–782. [Google Scholar] [CrossRef]
  77. Gruber, U. Podarcis erhardii (Bedriaga, 1876)–Ägäische Mauereidechse. In Handbuch der Reptilien und Amphibien Europas; AULA Wiesbaden: Wiesbaden, Germany, 1986; Volume 2, pp. 25–49. [Google Scholar]
  78. Adamopoulou, C.; Valakos, E.D.; Pafilis, P. Summer diet of Podarcis milensis, P. gaigeae and P. erhardii (Sauria: Lacertidae). Bonn. Zool. Beiträge 1999, 48, 275–282. [Google Scholar]
  79. Madden, I.E.; Brock, K.M. An extreme record of cannibalism in Podarcis erhardii mykonensis (Reptilia: Lacertidae) from Siros island, Cyclades, Greece. Herpetol. Notes 2018, 11, 291–292. [Google Scholar]
  80. Mayhew, W.W. Reproduction in the granite spiny lizard, Sceloporus orcutti. Copeia 1963, 1963, 144–152. [Google Scholar] [CrossRef]
  81. Itescu, Y.; Schwarz, R.; Meiri, S.; Pafilis, P. Intraspecific competition, rather than predation, drives tail loss in insular geckos. J. Anim. Ecol. 2017, 86, 66–74. [Google Scholar] [CrossRef]
  82. Rogers, L.E.; Hinds, W.T.; Buschbom, R.L. A General Weight vs. Length Relationship for Insects. Ann. Entomol. Soc. Am. 1976, 69, 387–389. [Google Scholar] [CrossRef]
  83. Kohn, D.D.; Walsh, D.M. Plant species richness—The effect of island size and habitat diversity. J. Ecol. 1994, 82, 367–377. [Google Scholar] [CrossRef]
  84. Shure, D.J.; Phillips, D.L. Patch size of forest openings and arthropod populations. Oecologia 1991, 86, 325–334. [Google Scholar] [CrossRef]
  85. Polis, G.A.; Hurd, S.D. Extraordinarily high spider densities on islands: Flow of energy from the marine to terrestrial food webs and the absence of predation. Proc. Natl. Acad. Sci. USA 1995, 92, 4382–4386. [Google Scholar] [CrossRef]
  86. Abell, A.J.; Cole, B.J.; Reyes, R.; Wiernasz, D.C. Sexual selection on body size and shape in the western harvester ant, Pogonomyrmex occidentalis Cresson. Evolution 1999, 53, 535–545. [Google Scholar] [CrossRef]
  87. Turkheimer, E.; Haley, A.; Waldron, M.; d’Onofrio, B.; Gottesman, I.I. Socioeconomic status modifies heritability of IQ in young children. Psychol. Sci. 2003, 14, 623–628. [Google Scholar] [CrossRef] [PubMed]
  88. Tinkle, D.W. The concept of reproductive effort and its relation to the evolution of life histories of lizards. Am. Nat. 1969, 103, 501–516. [Google Scholar] [CrossRef]
  89. Tinkle, D.W.; Wilbur, H.M.; Tilley, S.G. Evolutionary strategies in lizard reproduction. Evolution 1970, 24, 55–74. [Google Scholar] [CrossRef] [PubMed]
  90. Siliceo, I.; Díaz, J.A. A comparative study of clutch size, range size, and the conservation status of island vs. mainland lacertid lizards. Biol. Conserv. 2010, 143, 2601–2608. [Google Scholar] [CrossRef]
  91. Shine, R. Life-history evolution in reptiles. Annu. Rev. Ecol. Syst. 2005, 36, 23–46. [Google Scholar] [CrossRef]
  92. Qualls, C.P.; Shine, R. Maternal body-volume as a constraint on reproductive output in lizards: Evidence from the evolution of viviparity. Oecologia 1995, 103, 73–78. [Google Scholar] [CrossRef] [PubMed]
  93. Shine, R. Locomotor speeds of gravid lizards: Placing ‘costs of reproduction’within an ecological context. Funct. Ecol. 2003, 17, 526–533. [Google Scholar] [CrossRef]
  94. Shine, R.; Schwarzkopf, L. The evolution of reproductive effort in lizards and snakes. Evolution 1992, 46, 62–75. [Google Scholar] [CrossRef]
  95. Olsson, M.; Shine, R.; Wapstra, E. Costs of reproduction in a lizard species: A comparison of observational and experimental data. Oikos 2001, 93, 121–125. [Google Scholar] [CrossRef]
  96. Sinervo, B.; Licht, P. Proximate constraints on the evolution of egg size, number, and total clutch mass in lizards. Science 1991, 252, 1300–1302. [Google Scholar] [CrossRef]
  97. Slavenko, A.; Itescu, Y.; Foufopoulos, J.; Pafilis, P.; Meiri, S. Clutch size variability in an ostensibly fix-clutched lizard: Effects of insularity on a Mediterranean gecko. Evol. Biol. 2015, 42, 129–136. [Google Scholar] [CrossRef]
  98. Semegen, S.L. Predation Pressure as A Determinant of Locomotor Performance: Lizards Run Slower on Islands Without Predators. Master’s Thesis, University of Michigan, Ann Arbor, MI, USA, 2018. [Google Scholar]
  99. Vervust, B.; Grbac, I.; Van Damme, R. Differences in morphology, performance and behaviour between recently diverged populations of Podarcis sicula mirror differences in predation pressure. Oikos 2017, 116, 1343–1352. [Google Scholar] [CrossRef]
  100. Pérez-Mellado, V.; Corti, C.; LoCascio, P. Tail autotomy and extinction in Mediterranean lizards. A preliminary study of continental and insular populations. J. Zool. 1997, 243, 533–541. [Google Scholar] [CrossRef]
  101. Cooper, W.E. Tradeoffs between predation risk and feeding in a lizard, the broad-headed skink (Eumeces laticeps). Behaviour 2000, 137, 1175–1189. [Google Scholar] [CrossRef]
  102. Li, B.; Belasen, A.; Pafilis, P.; Bednekoff, P.; Foufopoulos, J. Effects of feral cats on the evolution of anti-predator behaviours in island reptiles: Insights from an ancient introduction. Proc. R. Soc. Lond. B 2014, 281, 20140339. [Google Scholar] [CrossRef] [PubMed]
  103. Mugabo, M.; Marquis, O.; Perret, S.; Le Galliard, J.F. Direct and socially-mediated effects of food availability late in life on life-history variation in a short-lived lizard. Oecologia 2011, 166, 949–960. [Google Scholar] [CrossRef]
  104. Kumar, V.; Sharma, A.; Tripathi, V. Physiological effects of food availability times in higher vertebrates. J. Exp. Biol. 2022, 225, jeb239004. [Google Scholar] [CrossRef] [PubMed]
  105. Adamopoulou, C.; Valakos, E.D. Small clutch size in a Mediterranean endemic lacertid (Podarcis milensis). Copeia 2000, 2000, 610–614. [Google Scholar] [CrossRef]
  106. Valakos, E. The feeding ecology of Podarcis erhardii (Reptilia-Lacertidae) in a main insular ecosystem. Herpetol. J. 1986, 1, 118–121. [Google Scholar]
  107. McLean, J.A.; Speakman, J.R. Morphological changes during postnatal growth and reproduction in the brown long-eared bat Plecotus auritus: Implications for wing loading and predicted flight performance. J. Nat. Hist. 2000, 34, 773–791. [Google Scholar] [CrossRef]
  108. Lee, S.J.; Witter, M.S.; Cuthill, I.C.; Goldsmith, A.R. Reduction in escape performance as a cost of reproduction in gravid starlings, Sturnus vulgaris. Proc. R. Soc. Lond. B 1996, 263, 619–623. [Google Scholar]
  109. Veasey, J.S.; Houston, D.C.; Metcalfe, N.B. A hidden cost of reproduction: The trade-off between clutch size and escape take-off speed in female zebra finches. J. Anim. Ecol. 2001, 70, 20–24. [Google Scholar]
  110. Seigel, R.A.; Huggins, M.M.; Ford, N.B. Reduction in locomotor ability as a cost of reproduction in gravid snakes. Oecologia 1987, 73, 481–485. [Google Scholar] [CrossRef] [PubMed]
  111. Shine, R. “Costs” of reproduction in reptiles. Oecologia 1980, 46, 92–100. [Google Scholar] [CrossRef] [PubMed]
Figure 1. Map of the general area. Study sites are indicated by yellow circles and are identifiable by a two letter code: Agios Ioannis (AI), Andros (AN), Ano Koufonisi (AK), Gioura (GI), Glaronisi (GL), Kokkinonisi (KK), Kopria (KO), Mikropsathoura (Myga) (MI), Naxos (NA), Olympiada (OL), Santorini (SA), Skopelos (SK), Tinos (TI), Vevi (VE).
Animals 13 03689 g001
Figure 2. Linear regression between log-transformed island area and log-transformed predator richness. Each circle represents an island. Log-transformed predator richness has a positive relationship with log-transformed island area.
Animals 13 03689 g002
Figure 3. Linear regression between log-transformed island area and log-transformed biomass of arthropods. Each circle represents an island. Log-transformed biomass of arthropods has a positive relationship with log-transformed island area.
Animals 13 03689 g003
Figure 4. Linear regression between log-transformed island area and NDVI. Each circle represents an island.
Animals 13 03689 g004
Figure 5. Lizard clutch size against predator species richness and maternal body size. Each dot represents one lizard clutch, and the wire mesh represents the predictions of the best model as provided from the AIC model comparison. x: Predator species richness, y: maternal snout-vent length (in mm), z: clutch size (number of eggs).
Animals 13 03689 g005
Figure 6. Lizard clutch volume against predator species richness and maternal body size (in mm). Each dot represents one lizard clutch, and the wire mesh represents the predictions of the linear model. x: Predator species richness, y: maternal snout-vent length (in mm), z: clutch volume (in mm3).
Animals 13 03689 g006
Table 1. Summary table including island name, coordinates, island size, predator richness, biomass of arthropods, NDVI, clutch size, and clutch volume (sample size).
Island NameCoordinatesIsland Size (km2)Predator RichnessBiomass of
Arthropods (mg)
NDVIClutch SizeClutch
Volume (mm3)
Kokkinonisi39°9′38.757″ N, 23°54′7.129″ E0.005216.7340.3871.7 ± 0.3 (10)598 ± 234 (10)
Mikropsathoura (Myga)39°28′56.262″ N, 24°10′51.691″ E0.014220.7240.5111.6 ± 0.2 (11)219 ± 60 (11)
Agios Ioannis36°36′36.327″ N, 24°57′23.118″ E0.0332125.7270.1081.4 ± 0.2 (10)433 ± 143 (10)
Kopria36°59′27.899″ N, 25°38′14.122″ E0.1382100.8700.1641.6 ± 0.2 (10)805 ± 254 (10)
Glaronisi36°55′15.371″ N, 25°36′15.286″ E0.188257.5480.2001.9 ± 0.1 (8)362 ± 100 (8)
Ano Koufonisi36°56′49.45″ N, 25°36′20.237″ E5.770596.8740.2372.2 ± 0.2 (9)386 ± 120 (9)
Gioura39°23′46.899″ N, 24°10′20.407″ E11.0526191.5910.3111.8 ± 0.3 (9)549 ± 149 (9)
Santorini36°22′59.326″ N, 25°28′29.843″ E76.1979106.4540.3121.7 ± 0.1 (24)612 ± 121 (24)
Skopelos39°7′30.145″ N, 23°39′10.323″ E96.22911333.1540.5422.5 ± 0.4 (12)947 ± 235 (12)
Tinos37°33′31.293″ N, 25°7′40.568″ E194.5001277.2320.2132.7 ± 0.2 (23)1268 ± 269 (23)
Andros37°53′23.97″ N, 24°43′25.309″ E380.00013286.3270.3632.2 ± 0.4 (9)777 ± 289 (9)
Naxos37°4′54.364″ N, 25°29′16.147″ E429.78511121.8370.2892.4 ± 0.1 (42)1008 ± 139 (42)
Olympiada39°59′45.907″ N, 22°14′0.477″ E1000.00016278.5600.4852.9 ± 0.2 (35)1258 ± 175 (35)
Vevi40°46′27.065″ N, 21°36′53.896″ E1000.00018229.5230.6822.9 ± 0.2 (34)951 ± 165 (34)
Table 2. AIC for seven linear mixed effect models constructed to explain clutch size.
ModelAICcΔ AICcAkaike Weight
CS ~ P + SVL + (1|Location)714.70300.687
CS ~ NDVI +SVL+ (1|Location)716.9972.2930.218
CS ~ SVL + (1|Location)719.6234.9205.871 × 10−2
CS ~ P + (1|Location)720.7506.0473.342 × 10−2
CS ~ NDVI + (1|Location)727.22012.5171.315 × 10−3
CS ~ B + SVL + (1|Location)727.67412.9711.049 × 10−3
CS ~ B + (1|Location)739.57024.8672.737 × 10−6
CS = clutch size, P = predator richness, B = biomass of arthropods, SVL = maternal snout-vent length. Models were ranked based on their AICc value differences. Associated Akaike weights are provided and were calculated based on the equation W i A I C = e x p 0.5 Δ i A I C / k = 1 k e x p ( 0.5 Δ k A I C ) [87].
Table 3. AIC for seven linear mixed effect models constructed to explain clutch volume.
ModelAICΔ AICAkaike Weight
CV ~ P + SVL + (1|Location)4008.38900.587
CV ~ NDVI + SVL + (1|Location)4009.1530.7640.401
CV ~ P + (1|Location)4017.4079.0186.461 × 10−3
CV ~ B + SVL + (1|Location)4018.70110.3123.383 × 10−3
CV ~ NDVI + (1|Location)4019.65111.2622.104 × 10−3
CV ~ SVL + (1|Location)4022.03113.6426.401 × 10−4
CV ~ B + (1|Location)4029.95221.5631.220 × 10−5
CV = clutch volume, P = predator richness, B = biomass of arthropods, SVL = maternal snout-vent length. Models were ranked based on their AICc value differences. Associated Akaike weights are provided and were calculated based on the equation W i A I C = e x p 0.5 Δ i A I C / k = 1 k e x p ( 0.5 Δ k A I C ) [87]. Random effects are indicated in parentheses.
Disclaimer/Publisher’s Note: The statements, opinions and data contained in all publications are solely those of the individual author(s) and contributor(s) and not of MDPI and/or the editor(s). MDPI and/or the editor(s) disclaim responsibility for any injury to people or property resulting from any ideas, methods, instructions or products referred to in the content.