Article

Does Direct MRI Tenography Improve the Diagnostic Performance of Low-Field MRI to Identify Artificially Created Soft-Tissue Lesions within the Equine Cadaveric Digital Flexor Tendon Sheath?

1
Equine Hospital, Vetsuisse-Faculty, University of Zürich, 8057 Zürich, Switzerland
2
Clinic of Diagnostic Imaging, Vetsuisse-Faculty, University of Zürich, 8057 Zürich, Switzerland
3
Section of Veterinary Epidemiology, Vetsuisse-Faculty, University of Zürich, 8057 Zürich, Switzerland
*
Author to whom correspondence should be addressed.
Animals 2023, 13(24), 3772; https://doi.org/10.3390/ani13243772
Submission received: 11 September 2023 / Revised: 1 December 2023 / Accepted: 5 December 2023 / Published: 7 December 2023
(This article belongs to the Special Issue Diagnostic Imaging of Equines)

Abstract

:

Simple Summary

Tenosynovitis of the digital flexor tendon sheath (DFTS), developing secondary to intrathecal tendinopathy, is commonly diagnosed using ultrasonography and contrast tenography. However, precise pre-operative diagnosis remains challenging. The objective of this study was to determine and compare the sensitivity and specificity of low-field MRI and direct low-field MRI tenography (MRIt) to detect experimentally created lesions of the superficial digital flexor tendon (SDFT), deep digital flexor tendon (DDFT), manica flexoria (MF) and proximal scutum in 21 DFTS cadavers. Proximal scutum lesions (Sensitivity: 38% versus 50%, p = 0.80; specificity: 96% versus 96%, p = 1) and SDFT lesions (Sensitivity: 39% versus 54%, p = 0.72; specificity: 93% versus 96%, p = 1) were less frequently identified by MRI compared to MRIt, respectively. MRI detected DDFT lesions (sensitivity 34%; specificity 100%) better than MRIt (sensitivity 32%, p = 0.77; specificity 98%, p = 1). This was similar for MF lesions (MRI sensitivity 61%; specificity 100% vs. MRIt sensitivity 50%, p = 0.68; specificity 96%, p = 1). Lesion size was significantly associated with MRI or MRIt diagnosis (p = 0.001).

Abstract

Tenosynovitis of the digital flexor tendon sheath (DFTS) is diagnosed using ultrasonography and contrast tenography. Nevertheless, making a precise preoperative diagnosis is challenging. This study aimed to determine and compare the sensitivity and specificity of low-field MRI and MRI tenography (MRIt) to detect artificially created soft-tissue lesions in the DFTS. In 21 DFTSs, 118 lesions were made tenoscopically in the superficial digital flexor tendon (SDFT), deep digital flexor tendon (DDFT), manica flexoria (MF) and proximal scutum. MRI and MRI, following intrathecal gadolinium administration (MRIt), were performed. The sensitivity and specificity of MRI and MRIt were calculated and compared. Proximal scutum lesions were less frequently identified by MRI (Sensitivity 38%, specificity 96%) compared to MRIt (Sensitivity: 50%, p = 0.80; specificity: 96%, p = 1). This was similar for SDFT lesions (Sensitivity: 39% versus 54%, p = 0.72; specificity: 93% versus 96%, p = 1). MRI detected DDFT lesions (sensitivity 34%; specificity 100%) better than MRIt (sensitivity 32%, p = 0.77; specificity 98%, p = 1). This was similar for MF lesions (MRI sensitivity 61%; specificity 100% vs. MRIt sensitivity 50%, p = 0.68; specificity 96%, p = 1). Lesion size was significantly associated with MRI or MRIt diagnosis (p = 0.001). The intrathecal administration of gadolinium did not significantly improve the ability of low-field MRI to diagnose artificial DFTS tendon lesions. Small lesion length was a significant discriminating factor for lesion detection. MRI and MRIt specificity were high, thus being helpful in diagnosing an intact structure.

1. Introduction

Lameness attributed to digital flexor tendon sheath (DFTS) pathologies are common in horses. Moreover, DFTS tenosynovitis most commonly develops secondary to intrathecal tendinopathy. Overall, laterally situated marginal tears of the deep digital flexor tendon (DDFT) and manica flexoria (MF) tears belong to the most commonly reported intrathecal lesions [1,2,3].
Making an accurate preoperative diagnosis of these types of lesions remains challenging. Following the localization of lameness, DFTS ultrasonography is used as a first-line diagnostic tool; however, it has shown unreliable results for the detection of intrathecal tendinopathies [1,2,3,4,5]. The sensitivity of ultrasonographic lesion detection was in a low- to mid-range for MF tears (38%) and DDF tendinopathies (63% [1]–71% [3]). Furthermore, it could be shown that ultrasonography only detected lesions in up to 54% of the cases, when lesions were present tenoscopically [2,3]. Different non-weight-bearing, dynamic and dynamic synovial flow techniques have been described to improve the ultrasonographic diagnosis of MF tears [6,7].
Contrast radiography yielded more promising results compared to ultrasonography. Particularly for MF tears, higher sensitivity (92–96%) and specificity values (56–80%) are reported [8,9]. The results for DDFT lesions are lower with a sensitivity and specificity of 54% [8]–57% [9], and 73% [8]–84% [9], respectively. Nevertheless, in many cases, tenoscopy remains the diagnostic tool of choice for DFTS disorders, not only allowing for the visualization of a specific soft-tissue lesion but also its surgical debridement [3,4,5,10]. However, it would be desirable to have a standing diagnostic imaging tool that reliably detects these soft-tissue lesions pre-operatively in order to plan surgery based on an accurate diagnosis.
Nowadays MRI is increasingly used in veterinary medicine to visualize various pathologies. Only a few authors have described high-field MRI for the diagnosis of intrathecal tendon lesions so far [11,12,13,14]. While 3 Tesla MRI has a very high diagnostic performance for soft-tissue imaging, general anaesthesia is necessary, and it remains logistically cumbersome and time-consuming. When considering standing diagnostic imaging technologies, low-field MRI is a sought-after imaging modality for diagnosing DTFS pathologies. T2 sequences are necessary to achieve hypointense soft tissue to intrathecally hyperintense fluid contrast. In terms of spatial resolution and anatomical detail, T1 sequences are considered superior. Injecting a contrast media intrathecally and acquiring post-contrast T1 sequences would combine the advantages of both and may improve the diagnostic performance of standing low-field MRI when diagnosing intrathecally situated soft-tissue lesions.
Gadolinium-enhanced MRI techniques have been used in human medicine for many years [15,16,17,18,19,20,21,22] and have also recently been tested and applied in veterinary medicine [23,24,25]. Administering gadolinium-based contrast media intrathecally results in the increased filling of the tendon sheath, outlining intra-synovial structures, and ultimately diffusion of contrast media into tears and depicting them [15,18,20,22,26]. The benefits of a direct MR arthrography of the canine elbow and stifle, as well as the equine distal interphalangeal joint, have been reported [27,28,29,30,31].
The objective of this study was to determine and compare the sensitivity and specificity of low-field MRI and direct low-field MRI DFTS tenography (MRIt) with gadolinium-based contrast media to detect artificially created lesions in the SDFT, DDFT and MF, as well as the proximal scutum. It was hypothesized that intrathecal gadolinium administration would improve the detection of intrathecally situated soft-tissue lesions compared to pre-contrast T1 and T2 sequences.

2. Materials and Methods

2.1. Specimens

Twenty-five distal limbs were obtained within 24 h after euthanasia (13 forelimbs and 12 hindlimbs) from Warmblood horses, for reasons unrelated to this study. Following the owners’ consent, the distal limbs were removed at the levels of the carpus and tarsus and stored at −28 °C. Prior to tenoscopy, the cadavers were defrosted in water until they reached room temperature (20 °C), then clipped and prepared for DFTS tenoscopy.

2.2. Tenoscopic Procedure

A tenoscopy of the DFTS was performed by a standard medial or lateral (randomly determined by flipping a coin) approach by a 3rd-year surgical resident (AA) using a 30° forward angled, 4 mm rigid arthroscope (Karl Storz GmbH & Co. KG, Tuttlingen, Germany). Briefly, the distal pouch of the DFTS was distended with 40 mL NaCl; a standard arthroscopic portal was made into the DFTS, outpouching between the palmar annular ligament and the proximal digital annular ligament. The skin incision was made slightly palmar/plantar to the centre of the outpouching and 3–6 mm palmar/plantar to the neurovascular bundle. The arthroscopic sleeve was introduced using a conical obturator, and the sleeve was directed proximad through the fetlock canal into the proximal recess of the DFTS [32]. As a first step, the SDFT, DDFT, MF and proximal scutum were examined for preexisting lesions. Only limbs without lesions were included in this study. Then, an instrument portal was made in the proximal recess ipsilateral to the arthroscopic portal in a standard fashion. Using an arthroscopic hook knife (blade dimensions: 3 mm long and 1 mm wide), lesions in all the structures were randomly created (Figure 1). For the SDFT, DDFT and proximal scutum, one or two lesions (small and/or large) were placed, or the structure was left intact, serving as a negative control. The lesions (or negative controls), randomly determined by flipping a coin, were made on the ipsilateral side of the arthroscopic portal (medial or lateral), and the structures on the contralateral side always served as negative controls. Lesion depth in the SDFT, DDFT and proximal scutum was standardized to 3–5 mm based on the dimensions of the hook knife. The defects were categorized according to their size: SDFT lesions as small (5–10 mm) or large (15–20 mm); DDFT and proximal scutum lesions as small (15–20 mm) or large (30–40 mm). The choice of lesion size was based on the results of a previously performed experimental study, which showed inferior detection rates of DDFT lesions compared to SDFT and proximal scutum lesions using 3 tesla MRI [33]. Every tendon lesion was made by cutting into the structure parallel to its fibre course, creating small partial thickness lesions and fibre tearing parallel to the fibre course. DDFT and SDFT border lesions were located either distal to the MF or at the same height. This position was also randomly determined by flipping a coin.
MF lesions were defined as partial lesions. These partial lesions were like proximal scutum lesions cut perpendicular to their normal fibre course [4,34]. Partial lesions were defined as cutting half or less of the lateral or medial distal tendinous MF. Following tenoscopy, an 18-gauge, 5.1 cm catheter was placed under visual control into the proximal pouch on the contralateral side of the instrument portal, sutured in place and secured with tape. All the arthroscopic portals were closed, including the DFTS capsule and the skin. Following tenoscopy, all the limbs were stored at −28 °C.

2.3. Diagnostic Imaging

All the limbs were defrosted for 24 h before the diagnostic imaging procedure. MRI was performed with a 0.27 Tesla MRI scanner (Hallmarq Advanced Veterinary Imaging, Hallmarq Veterinary Imaging Ltd., Guildford, Surrey, UK). The limbs were positioned in a gantry and held in place by a custom-made wooden mount to achieve an upright position. Using a fetlock radiofrequency coil (Hallmarq Advanced Veterinary Imaging, Hallmarq Veterinary Imaging Ltd., Guildford, Surrey, UK), the DFTS of each limb was scanned. The MRI scanning protocol included a pre-contrast transverse T2-weighted fast spin echo motion insensitive (MI) and a transverse T1-weighted gradient echo MI sequence. Then, each DFTS was injected with 0.05 mL of gadolinium (0.5 mmol/mL) (Dotarem, Gadotersäure, Guerbet AG, Zürich, Switzerland), diluted with a 30 mL solution consisting of 10 mL iodinated contrast media (350 mg iodine/mL) (Ioversol, Optiray 350, Mallinckrodt AG, Steinhausen, Switzerland) and 20 mL of 0.9% NaCl saline, which was injected through the pre-placed catheter. This was distributed within the DFTS by extending and flexing the limb. Post-contrast MRI scans consisted of a transverse T1-weighted gradient echo MI sequence. MRI sequences, planes and acquisition parameters are summarized in Table 1.

2.4. Image Analysis

Images were examined in all planes for the presence or absence of lesions in the aforementioned soft-tissue structures in the DFTS using a diagnostic workstation and medical imaging software (Intellispace PACS Radiology 4.4553.0, Phillips Healthcare, Zurich, Switzerland). All the images were examined by a 2nd-year large animal diagnostic imaging resident under the supervision of a diplomate radiologist (AB, SO), and a consensus was reached. The radiologists were blinded to the presence, location, severity and total number of lesions within each DFTS. The radiologists received a randomly generated order in which the images had to be reviewed. The radiologists were not allowed to compare the pre- and post-contrast images (MRIt), but the pre-contrast T1 and T2 sequences were evaluated together. Based on the current literature, the normal MRI appearance of the investigated soft-tissue structures was defined [13]. A lesion was considered present if contrast media/synovial fluid was infiltrating with a linear or focal contrast accumulation/hyperintense signal in the respective normal hypointense structure.

2.5. Statistical Analysis

Data were stored in Microsoft Excel. The normal distribution of the data for continuous variables was assessed using the Kolmogorov–Smirnoff test. Parametric data were reported as the mean ± standard deviation, and non-parametric data were reported as the median (range).
For all the lesions of the different structures, the sensitivity and specificity of MRI and MRIt were calculated. Tenoscopy served as the reference. Sensitivity and specificity values were compared between all the modalities using McNemar’s tests. Binary logistic regression was used to evaluate the association of the soft-tissue structure (SDFT, DDFT, MF or proximal scutum), contrast administration (yes, no) and lesion length (mm) on the MRI and MRIt diagnoses (no lesion, lesion present). All the statistical analyses were performed with a commercially available statistical software program (R Core Team (2016). R: A language and environment for statistical computing. R Foundation for Statistical Computing, Vienna, Austria. URL https://www.R-project.org/ (accessed on 1 January 2023).) using the MASS, car and lme4 packages. A p-value < 0.05 was considered statistically significant.

3. Results

A total of 13 forelimbs (7 left and 6 right) and 12 hindlimbs (6 left and 6 right) of 7 cadaveric middle-aged Warmblood horses of different genders underwent DFTS tenoscopy. Four limbs had to be excluded from this study due to technical issues in the imaging part of the study (air artefacts or insufficient contrast filling). A total number of 118 lesions were created in 21 DFTSs. In each DFTS, a median of five lesions (four–seven lesions) were made.
The median lesion size in the SDFT, DDFT and proximal scutum was 10 mm (range: 5–30 mm).
The quality of the MRI and MRIt studies was considered good in all the included DFTSs. However, in all the DFTSs, a mild extravasation of contrast media/synovial fluid was visible, with both modalities following the arthroscopic portals.
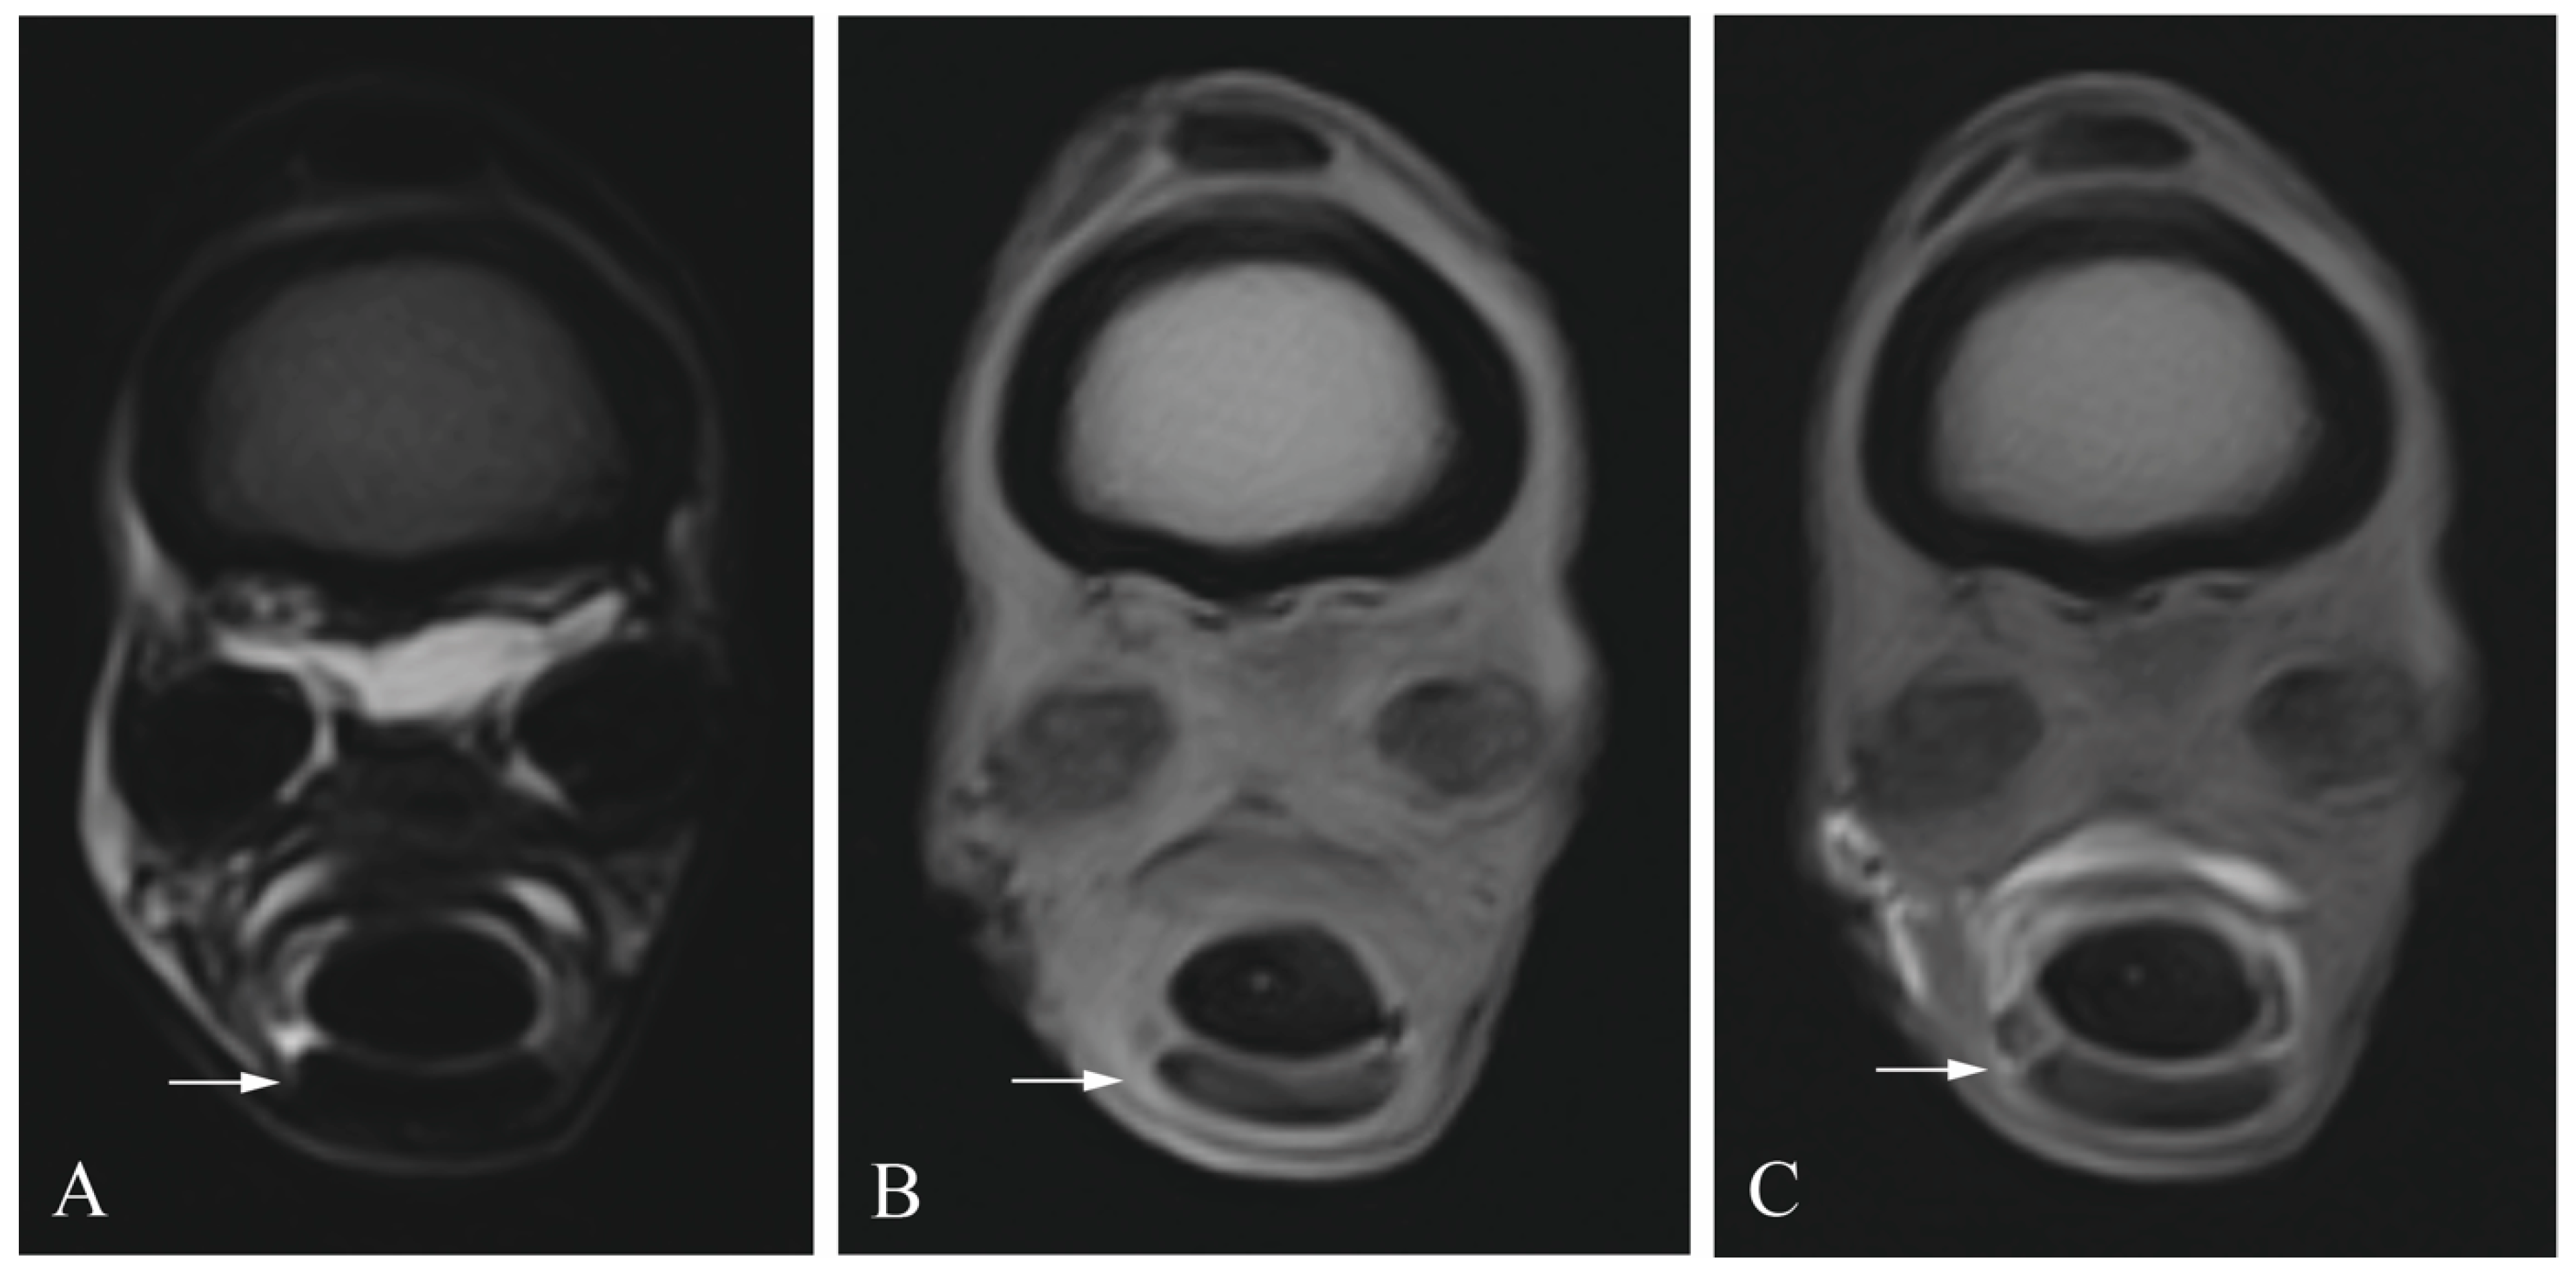
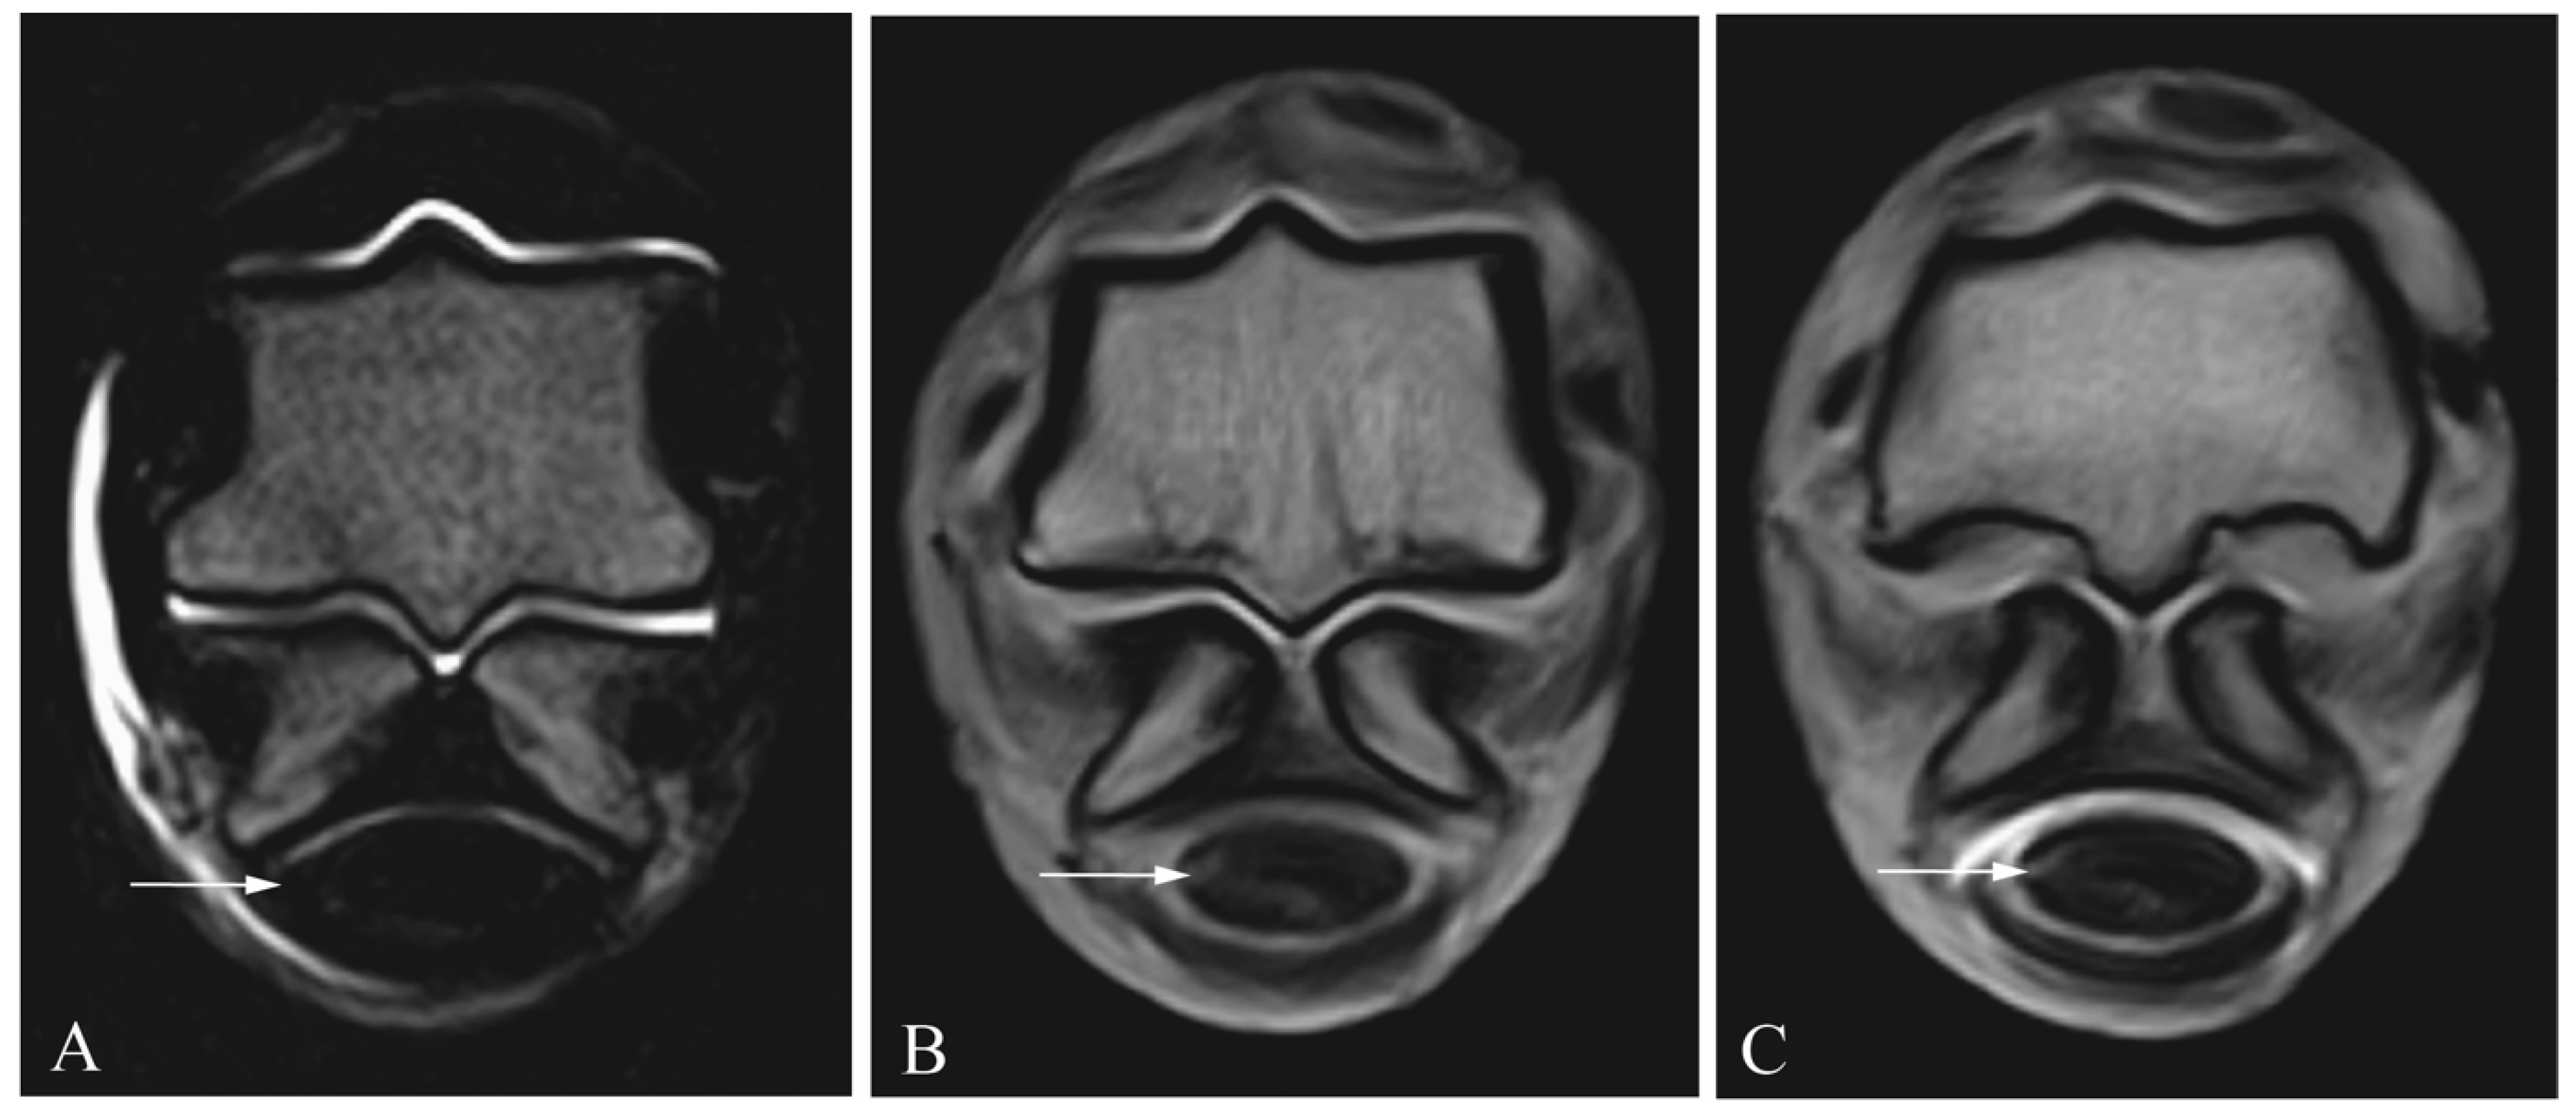
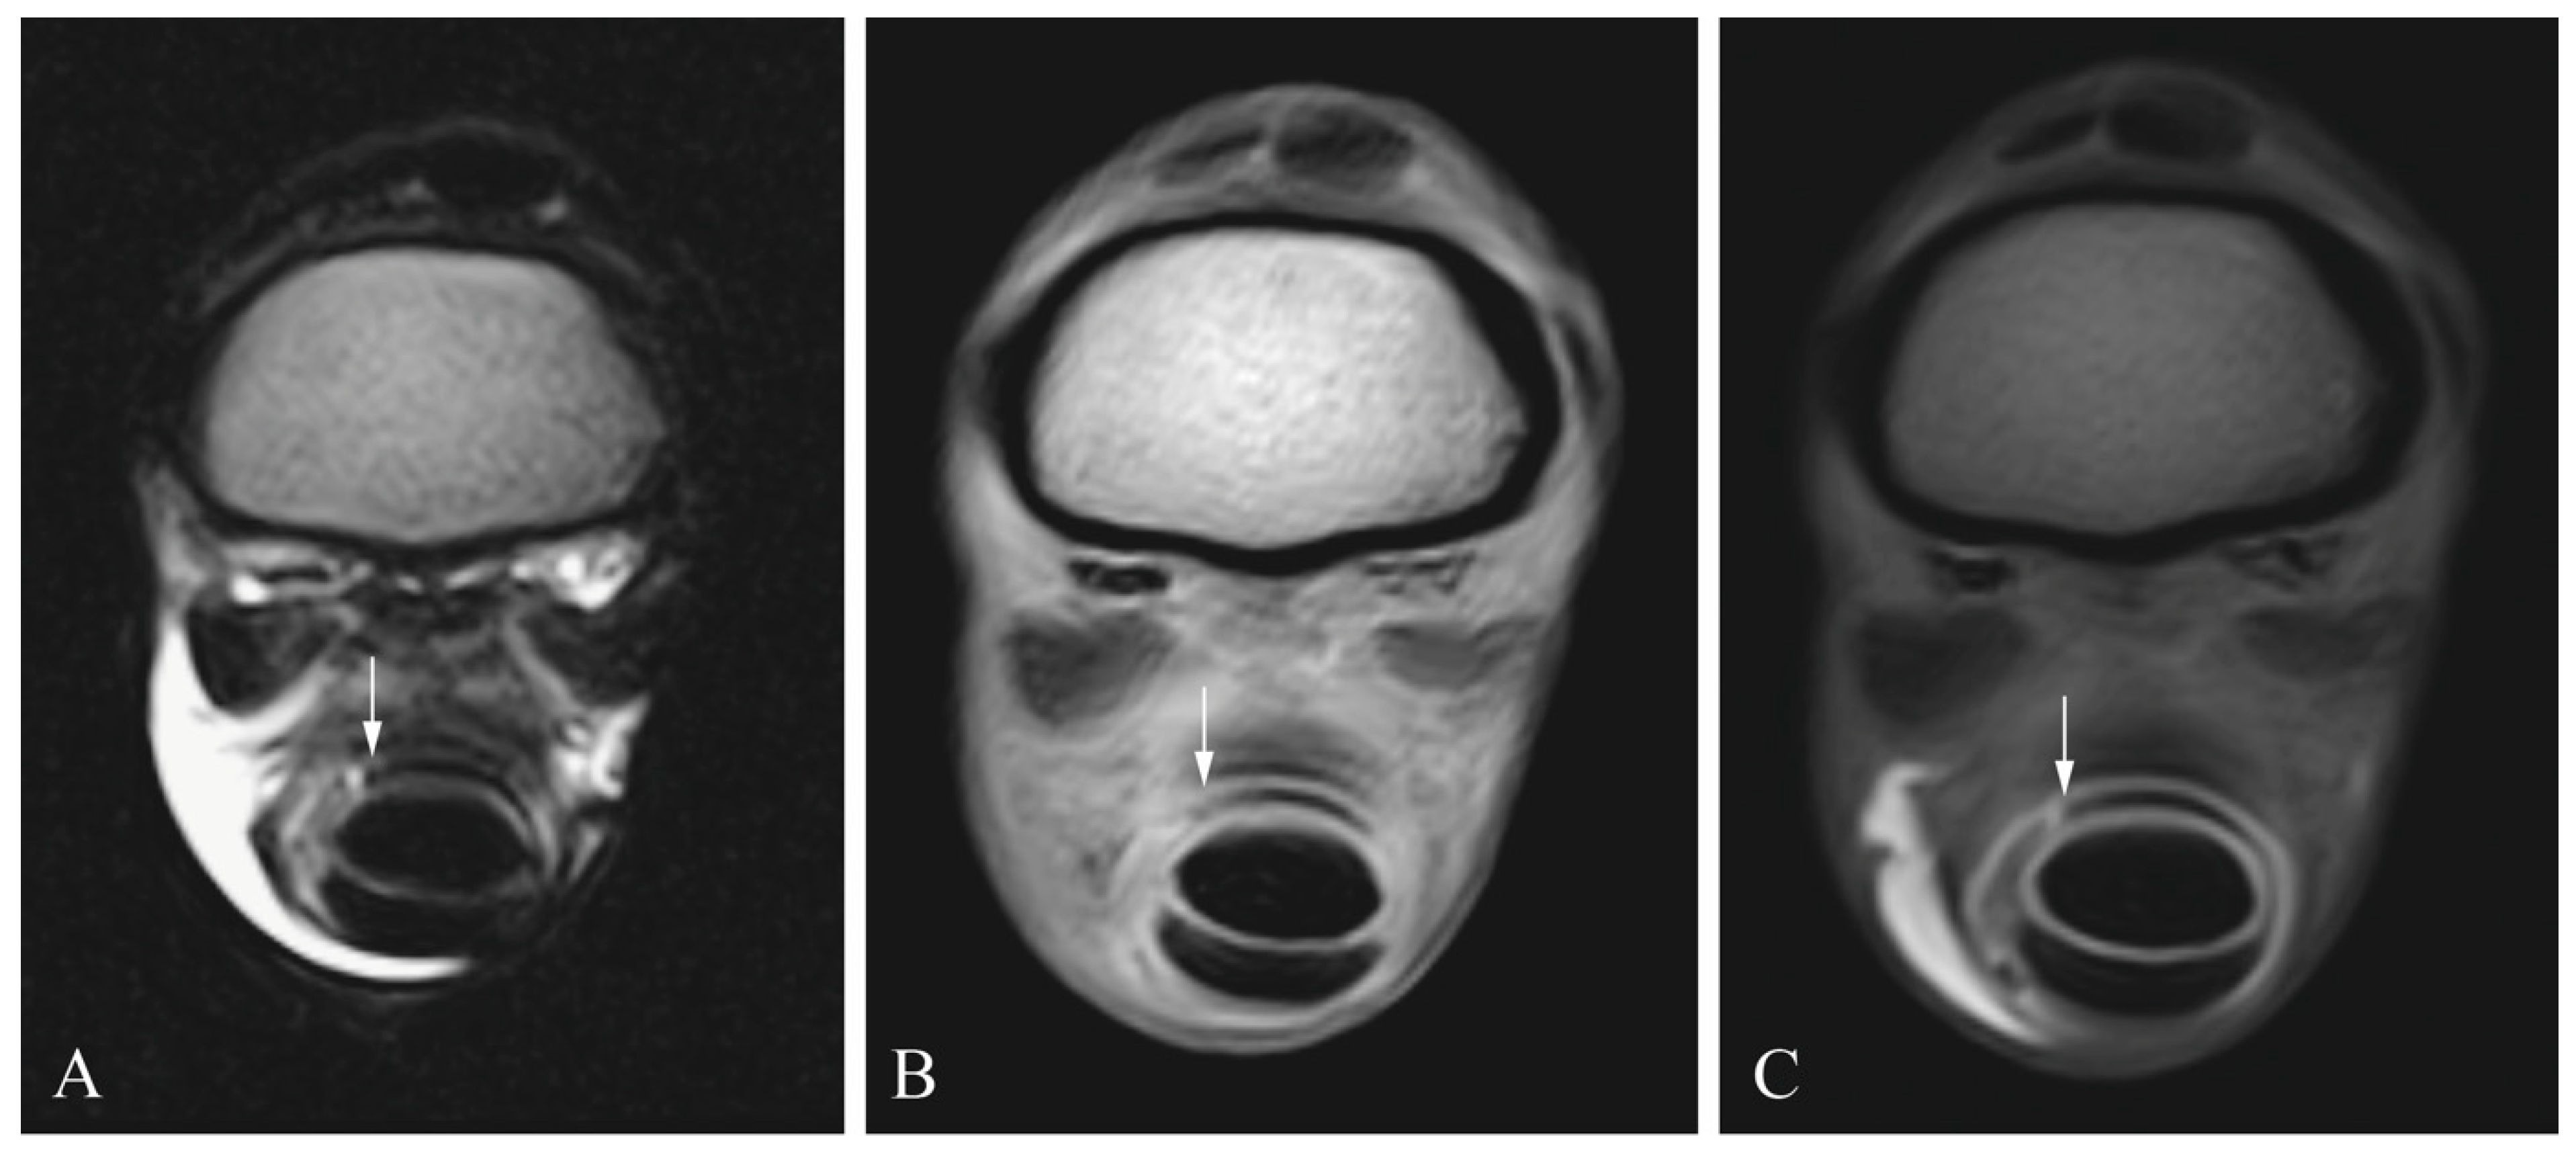
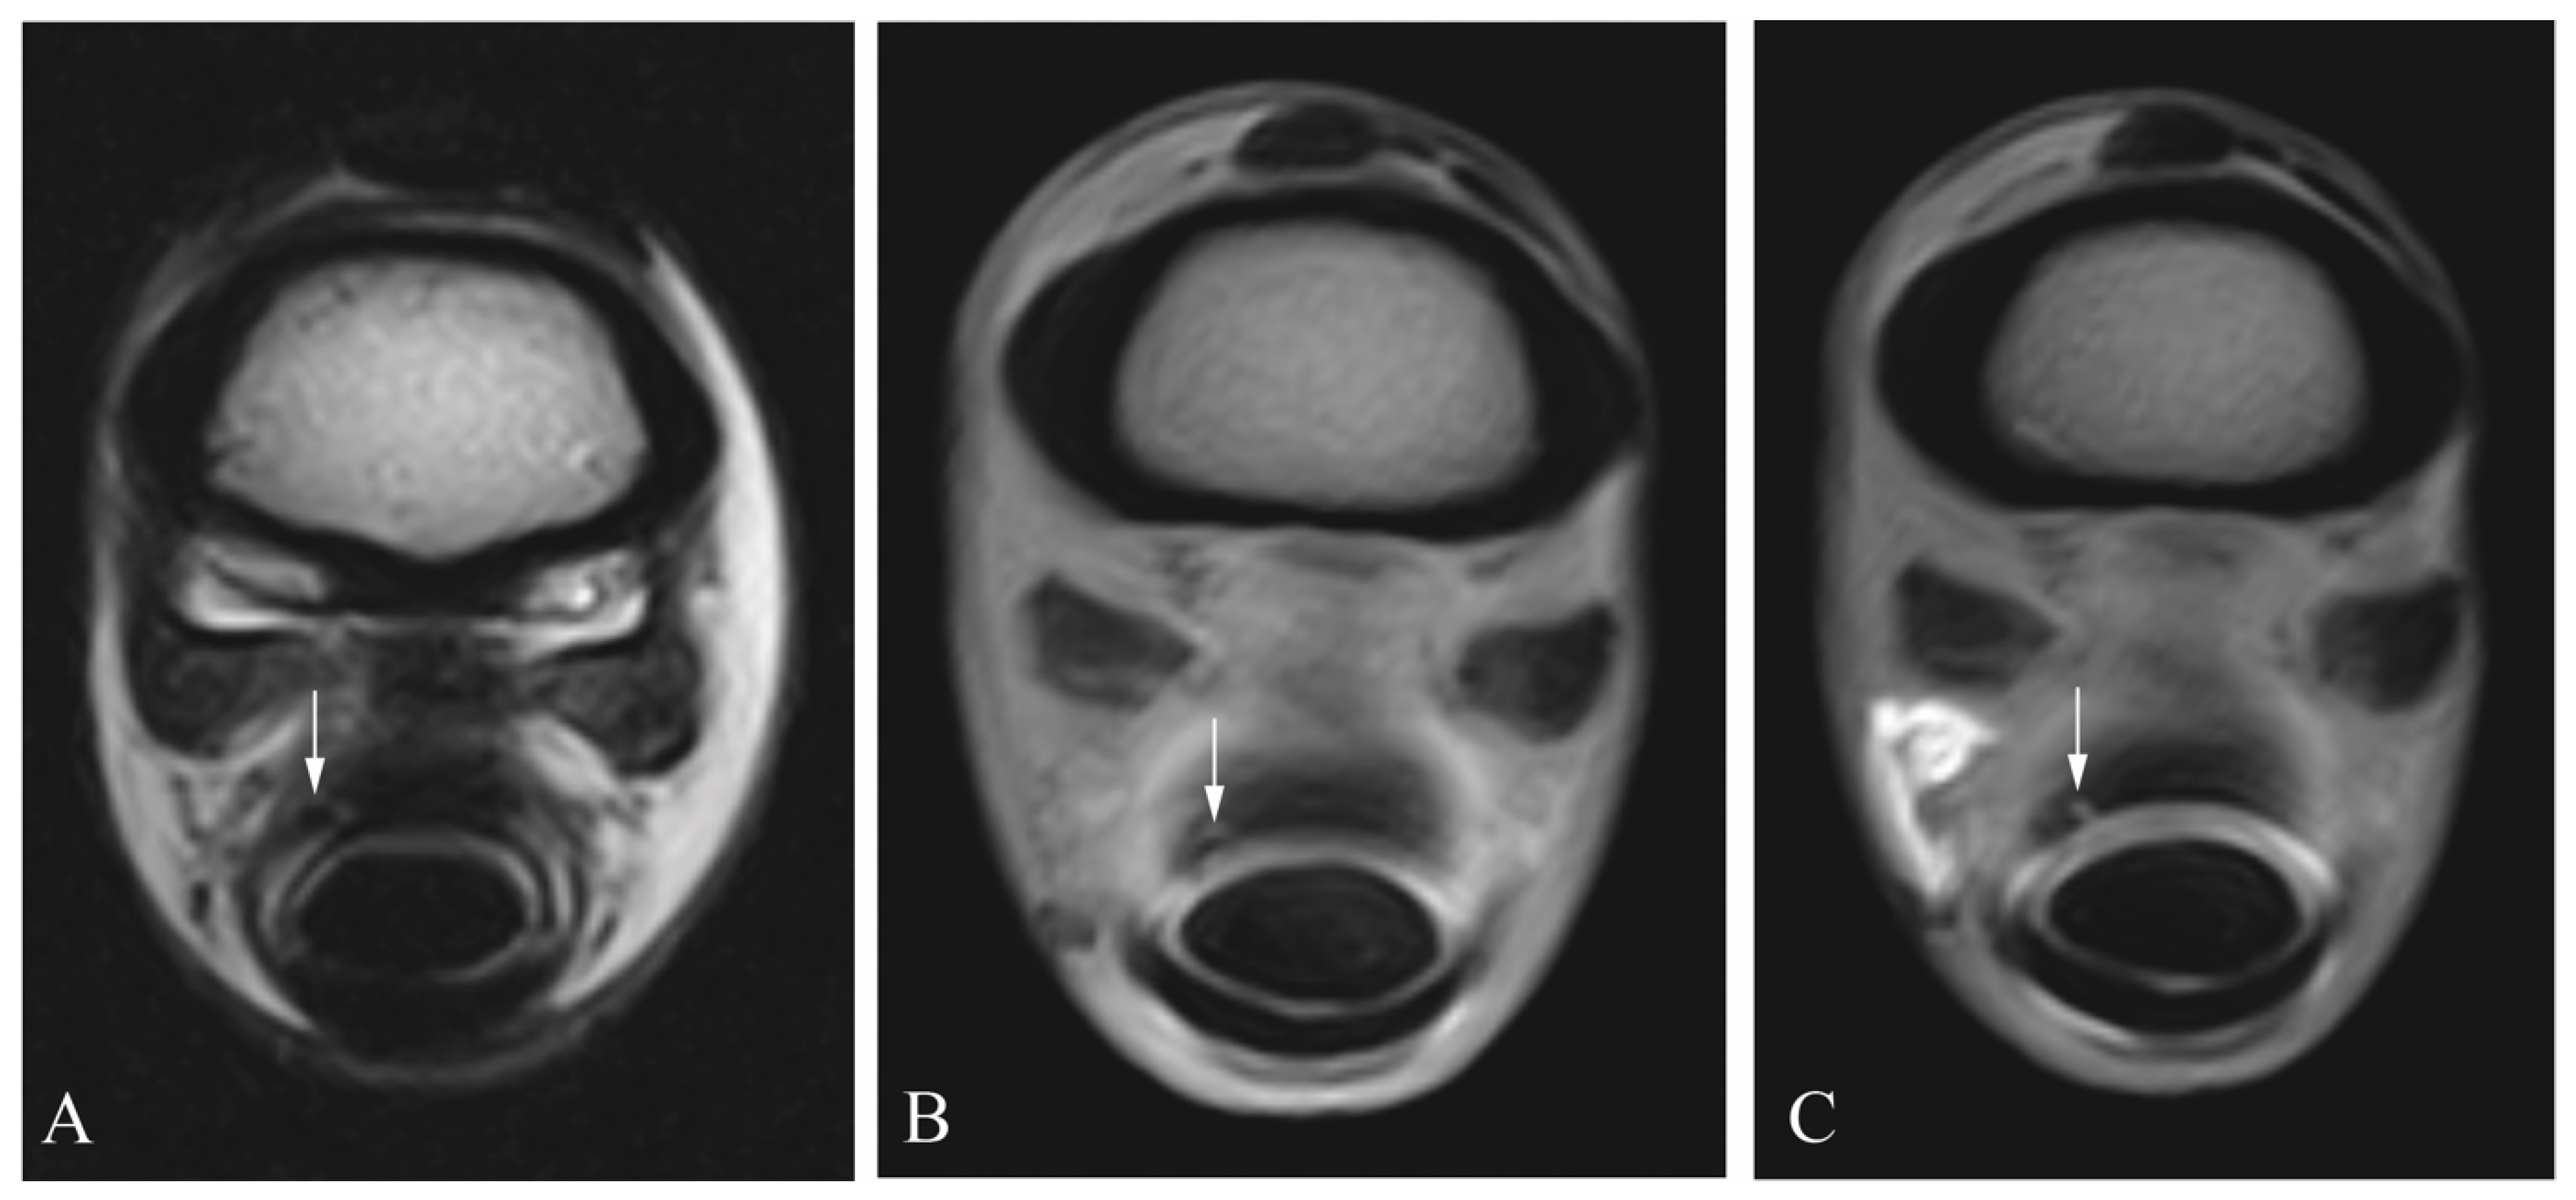
Sensitivity and specificity values for the different soft-tissue structures are shown in Table 1. Figure 2, Figure 3, Figure 4 and Figure 5 show the different lesions visible on the MRI and MRIt. Briefly, MRI and MRIt showed similar sensitivity and specificity values for lesions in the SDFT (MRI (39% sensitivity and 93% specificity) in comparison to MRIt (54% sensitivity, p = 0.72; and 96% specificity, p = 1)). For proximal scutum lesions, sensitivity and specificity were the same for MRI and MRIt (38% sensitivity and 50%, respectively, p = 0.80; 96% specificity and 96%, respectively, p = 1). There was also no statistically significant difference between MRI (34% sensitivity; 100% specificity) and MRIt (32% sensitivity, p = 0.77; 98% specificity, p = 1) for DDFT lesions. MF lesions were detected by MRI with 61% sensitivity, which was also comparable to MRIt (50% sensitivity, p = 0.68). The specificity values (96%) were equally high for MF lesions diagnosed by MRI and MRIt (p = 1).
The confidence intervals were fairly large for the sensitivity values (0.18–0.83) and narrower for the specificity values (0.83–1) (Table 2). Neither lesion site nor gadolinium administration into the DFTS was associated with making a correct MRI or MRIt diagnosis (p = 0.47–0.79). Only lesion size was significantly associated with making a correct MRI or MRIt diagnosis (p = 0.001).

4. Discussion

The pre-operative diagnosis of DFTS pathology is always a challenging task, and, therefore, tenoscopy is considered the gold standard for diagnosing intrathecally located soft-tissue lesions. However, 3D imaging modalities have a very high diagnostic potential and could represent a step forward in the diagnosis of DFTS pathologies pre-operatively, especially when performed in a standing set-up. Hence, this study aimed to determine the diagnostic value of low-field MRI and direct MRIt for the detection of artificially created soft-tissue lesions within the DFTS. The authors hypothesized that MRIt would improve the detection rate of intrathecally located soft-tissue lesions compared with MRI. This hypothesis was refuted in this study, as intrathecal gadolinium administration did not improve the diagnostic performance of low-field MRI.
T1, in contrast to T2 sequences, have better anatomical detail and are less susceptible to motion artefacts, which, when combined with the administration of gadolinium, may make these sequences a better alternative for investigating tendon lesions within the DFTS. Gadolinium is a paramagnetic contrast media and causes a shortening of both T2 and T1 relaxation times, but changes in T1 relaxation times are dominant, resulting in increased signal intensity from the enhanced tissues or fluids in images acquired with rapid repetition [35]. The T1-weighted signal intensity of gadolinium depends on its concentration and magnetic field strength [15]. Despite the theoretical advantages of the T1 sequence in combination with gadolinium injection over the T2 sequence, there was no statistical difference between pre- and post-contrast MRI studies in their ability to visualize tendon lesions within the DFTS in this study.
Looking at the plain MRI sequences, radiologists used the T2 sequence more often than the pre-contrast T1 sequence to make a diagnosis in this study. Lesions were easier to detect in the T2 sequence, as is shown for proximal scutum lesions in Figure 5. This is due to the well-known fact that, in the T2 sequence, there is a better contrast between the hyperintense fluid within the tendon sheath and the hypointense tendon; therefore, defects of the tendon’s surface or hyperintense signal within a tendon are better detected as compared to the pre-contrast T1 sequence.
Regarding the sensitivity and specificity values, MRIt showed slightly better results for SDFT and proximal scutum lesions, whereas MRI, in comparison to MRIt, was better at detecting DDFT and MF lesions. Whether these small differences between modalities could become statistically significant in a larger number of cases remains to be confirmed.
Comparing the results of this study with a similar study using 3 tesla MRI to diagnose artificial lesions within the DFTS, both low-field MRI and MRIt achieved lower sensitivity values for each structure [33]. This is an expected finding. The main disadvantage of low-field compared to high-field MRI is its inferior signal to noise ratio and lower spatial resolution [36]. Low-field MRI produces images with a much greater slice thickness, which is an additional disadvantage [37,38]. Slice thickness likely contributes significantly to the low sensitivity results of low-field MRI and MRIt for the rather small artificial tendon lesions created in this study. The median lesion length in our study was 10 mm (range: 5–30 mm). Depending on the sequence used, the slice thickness was 5 mm (see Table 1). Looking at these values, it is easy to explain that small lesions of 5–10 mm were easily missed or simply not displayed, due to volume averaging. The binary logistic regression analysis of lesion length in our study supports this finding, as lesion length had a significant impact on whether a correct MRI diagnosis was made or not, independent of the use of contrast media. Volume averaging may play an important role as to why small lesions were not detected or were measured as significantly smaller. Also, the normally hyperintense contrast appears rather grey in certain areas, which can lead to defects being overlooked [39]. In this study, we placed artificial lesions that were, of course, not directly comparable to naturally occurring lesions. Fibrillations and general secondary changes within the DFTS as present in a clinical scenario were missing, and could not help the radiologists in identifying the lesions. In addition, it should be noted that naturally occurring longitudinal tendon tears are usually much larger than the lesions placed in this study. Large lesions have previously been classified as over 7 cm long, and small lesions have been classified as under 7 cm long [1]. The lesions placed here were considerably smaller, with a maximum length of 3 cm. The lesions created in the study should test the limits of the modality. Hence, it is expected that MRI would achieve higher sensitivity and specificity values for the detection of naturally occurring lesions; however, this remains to be confirmed.
To date, there is no established standard protocol for the concentrations at which gadolinium should be used in small animals or horses for various synovial structures yet. In humans, gadolinium concentrations of 2–5 mmol/L have been described for intra-articular use, with 2 mmol/L being the most commonly used concentration for a wide variety of applications [22,40,41,42]. Others report optimal gadolinium concentrations of 0.7–3.5 mmol/L [43]. There are studies in small animals that used lower gadolinium concentrations and achieved good detection rates of shoulder pathologies; and another study, which tested different gadolinium concentrations, showed that lower concentrations were also diagnostic [27,44,45]. A maximum contrast signal intensity is not always advantageous, as it may obscure mild to moderate changes in the lesion periphery [45]. This observation is supported by several in vitro studies showing that the optimal gadolinium concentration significantly shifts to lower concentrations when mixed with iodine. In this study, we used a final gadolinium concentration of 0.75 mmol/L and injected with it iodine at a concentration of 117 mg/mL. These concentrations are within the previously described ranges, where gadolinium concentrations of 0.625–1.25 mmol/L in combination with 30–300 mg iodine/mL have been recommended [43,46,47]. Iodine was injected into the tendon sheath, and these concentrations were chosen because the same specimens were used in a master’s thesis study.
The tenoscopic portals could not be completely sealed, despite multiple-layer closure. As a result, in some cases, after injecting a volume of 30 mL, contrast media leaked into the subcutaneous tissue surrounding the tenoscopic portals, causing hyperintensity in this area. In humans, diagnostic difficulties due to extraarticular injection or contrast media leakage through the capsular puncture site are also known [15]. This problem may make it difficult to identify individual lesions. The leakage and resulting artefacts affected the pre contrast images equally in this study and should not have led to a difference between MRI and MRIt. However, they may have contributed to the overall low results of both.
Specificity values for all lesion types were very high for both MRI (93–100%) and MRItt (96–98%). They appear to be highly accurate for the diagnosis of a normal, i.e., intact, soft-tissue structure.
The limitations of the study are the small number of cadaver limbs used. This is a cadaver study, and the artificial lesions placed here cannot be directly compared with naturally occurring marginal tendon lesions. Most importantly, lesions in a natural setting are usually larger than those created in this study. In addition, secondary changes are common in natural lesions and extremely helpful for making a diagnosis. Another limitation, as mentioned above, is that the tenoscopic portals could not be completely sealed and, as a result, contrast media leakage occurred at the portals using a volume of only 30 mL. Furthermore, there are still no studies that have determined the optimal volume for the tenography of DFTS pathologies. Whilst injecting contrast media into intact DFTS in clinical patients, contrast leakage into the surrounding tissue will occur to a lesser extent, and much higher volumes and pressures should be achieved in clinical cases, potentially increasing the diagnostic performance of MRIt. As only one radiologist was available to review the MRI and MRIt studies, we were unable to assess the interobserver agreement and reliability of our data. To avoid creating multiple arthroscopy portals where contrast extravasation could occur, all the lesions were created ipsilateral to the tenoscopy portals. Of course, the tenoscopy portals were visible in both MRI and MRIt. Although the radiologist was blinded and had to recognise a lesion against a negative control, this may have led to a minor bias of the radiologists over time, as they may have had a learning curve. However, this bias is similar for MRI and MRIt, and should not have led to a difference in the comparison between both. Overall, the radiologists still had to detect the lesions in each structure or deem a structure as healthy. We only investigated whether the use of contrast in the DFTS made a difference in the diagnosis of soft-tissue lesions. It was not objectively assessed whether the pre-contrast T1 or T2 sequence was better for making a diagnosis, which is another limitation of this study. Furthermore, adding high resolution sequences with lower slice thickness may have improved the pre contrast diagnostic performance compared to the protocol used.

5. Conclusions

MRIt did not improve the diagnostic performance of low-field MRI to detect artificially created tendon lesions within the DFTS. From the results of this study, the intrathecal administration of gadolinium cannot be recommended to improve the diagnostic performance of low-field MRI examination of the DFTS. However, whether this also applies to clinical cases with naturally occurring, intrathecally situated tendon lesions remains to be proven. The specificity of both MRI and MRIt was high, thus being accurate in diagnosing an intact soft-tissue structure. Small lesion length was a significant discriminating factor for the likelihood of lesion detection. These are important results for the future use of low-field MRI in clinical cases, for instance when aiming to exclude certain intrathecally situated soft-tissue lesions in horses without them needing to undergo tenoscopy.

Author Contributions

All the authors have made substantial contributions to this study. The conception and design of the study and data collection was carried out by, A.A., A.B. and S.H. The analysis and interpretation of the data were carried out by A.A., A.B., S.O. and P.T., A.A., A.B., S.O., P.T. and S.H. were responsible for writing the manuscript and revising it. All authors have read and agreed to the published version of the manuscript.

Funding

This research was funded by the LORIOT RESEARCH FUND.

Institutional Review Board Statement

The horses were euthanized in the clinic due to study-unrelated reasons. No approval of research ethics committees was required to accomplish the aims of this study because experimental work was conducted only on cadavers. All procedures involving cadavers, in accordance with the law of 15 January 2015 on the protection of animals used for scientific or educational purposes, do not require the approval of the local ethics committee (Journal of Laws 2015, item 266).

Informed Consent Statement

The horses were euthanized due to reasons unrelated to this study, and informed consent was obtained from all the subjects involved in this study.

Data Availability Statement

Data contained within the article.

Conflicts of Interest

The authors declare no conflict of interest.

References

  1. Arensburg, L.; Wilderjans, H.; Simon, O.; Dewulf, J.; Boussauw, B. Nonseptic tenosynovitis of the digital flexor tendon sheath caused by longitudinal tears in the digital flexor tendons: A retrospective study of 135 tenoscopic procedures. Equine Vet. J. 2011, 43, 660–668. [Google Scholar] [CrossRef] [PubMed]
  2. Wilderjans, H.; Boussauw, B.; Madder, K.; Simon, O. Tenosynovitis of the digital flexor tendon sheath and annular ligament constriction syndrome caused by longitudinal tears in the deep digital flexor tendon: A clinical and surgical report of 17 cases in Warmblood horses. Equine Vet. J. 2003, 35, 270–275. [Google Scholar] [CrossRef] [PubMed]
  3. Smith, M.R.; Wright, I.M. Noninfected tenosynovitis of the digital flexor tendon sheath: A retrospective analysis of 76 cases. Equine Vet. J. 2006, 38, 134–141. [Google Scholar] [CrossRef] [PubMed]
  4. Findley, J.A.; De Oliveira, F.; Bladon, B. Tenoscopic surgical treatment of tears of the manica flexoria in 53 horses. Vet. Surg. 2012, 41, 924–930. [Google Scholar] [CrossRef] [PubMed]
  5. Edinger, J.; Möbius, G.; Ferguson, J. Comparison of tenoscopic and ultrasonographic methods of examination of the digital flexor tendon sheath in horses. Vet. Comp. Orthop. Traumatol. 2005, 18, 209–214. [Google Scholar] [PubMed]
  6. Garcia da Fonseca, R.M.; Evrard, L.; Rabba, S.; Salciccia, A.; Busoni, V. Dynamic flexion/extension and non-weight bearing ultrasonography is helpful for identifying manica flexoria tears in horses. Vet. Radiol. Ultrasound 2019, 60, 65–74. [Google Scholar] [CrossRef] [PubMed]
  7. Hibner-Szaltys, M.; Cavallier, F.; Cantatore, F.; Withers, J.M.; Marcatili, M. Ultrasonography can be used to predict the location of manica flexoria tears in horses. Equine Vet. Educ. 2022, 35, e200–e207. [Google Scholar] [CrossRef]
  8. Kent, A.V.; Chesworth, M.J.; Wells, G.; Gerdes, C.; Bladon, B.M.; Smith, R.K.W.; Fiske-Jackson, A.R. Improved diagnostic criteria for digital flexor tendon sheath pathology using contrast tenography. Equine Vet. J. 2019, 52, 205–221. [Google Scholar] [CrossRef]
  9. Fiske-Jackson, A.R.; Barker, W.H.; Eliashar, E.; Foy, K.; Smith, R.K. The use of intrathecal analgesia and contrast radiography as preoperative diagnostic methods for digital flexor tendon sheath pathology. Equine Vet. J. 2013, 45, 36–40. [Google Scholar] [CrossRef]
  10. Nixon, A.J.; McIlwraith, C.W.; Wright, I.M. Arthroscopic Surgery of the Carpal and Digital Tendon Sheaths, 4th ed.; Mosby: Maryland Heights, MI, USA, 2015. [Google Scholar]
  11. Gonzalez, L.M.; Schramme, M.C.; Robertson, I.D.; Thrall, D.E.; Redding, R.W. MRI features of metacarpo (tarso) phalangeal region lameness in 40 horses. Vet. Radiol. Ultrasound 2010, 51, 404–414. [Google Scholar] [CrossRef]
  12. King, J.N.; Zubrod, C.J.; Schneider, R.K.; Sampson, S.N.; Roberts, G. MRI findings in 232 horses with lameness localized to the metacarpo (tarso) phalangeal region and without a radiographic diagnosis. Vet. Radiol. Ultrasound 2013, 54, 36–47. [Google Scholar] [CrossRef] [PubMed]
  13. Dyson, S.; Murray, R. Magnetic resonance imaging of the equine fetlock. Clin. Tech. Equine Pract. 2007, 6, 62–77. [Google Scholar] [CrossRef]
  14. Daniel, A.; Leise, B.; Selberg, K.; Barrett, M. Enhanced ultrasonographic imaging of the equine distal limb using saline injection of the digital flexor tendon sheath: A cadaver study. Vet. J. 2019, 247, 26–31. [Google Scholar] [CrossRef] [PubMed]
  15. Steinbach, L.S.; Palmer, W.E.; Schweitzer, M.E. Special focus session: MR arthrography. Radiographics 2002, 22, 1223–1246. [Google Scholar] [CrossRef] [PubMed]
  16. Bergin, D.; Schweitzer, M. Indirect magnetic resonance arthrography. Skelet. Radiol. 2003, 32, 551–558. [Google Scholar] [CrossRef]
  17. Bittersohl, B.; Hosalkar, H.S.; Werlen, S.; Trattnig, S.; Siebenrock, K.A.; Mamisch, T.C. Intravenous versus intra-articular delayed gadolinium-enhanced magnetic resonance imaging in the hip joint: A comparative analysis. Investig. Radiol. 2010, 45, 538–542. [Google Scholar] [CrossRef] [PubMed]
  18. Şahin, G.; Demirtaş, M. An overview of MR arthrography with emphasis on the current technique and applicational hints and tips. Rev. Clin. Imaging 2007, 31, 73. [Google Scholar] [CrossRef]
  19. Kopka, L.; Funke, M.; Fischer, U.; Keating, D.; Oestmann, J.; Grabbe, E. MR arthrography of the shoulder with gadopentetate dimeglumine: Influence of concentration, iodinated contrast material, and time on signal intensity. AJR. Am. J. Roentgenol. 1994, 163, 621–623. [Google Scholar] [CrossRef]
  20. McCauley, T.R.; Elfar, A.; Moore, A.; Haims, A.H.; Jokl, P.; Lynch, J.K.; Ruwe, P.A.; Katz, L.D. MR arthrography of anterior cruciate ligament reconstruction grafts. Am. J. Roentgenol. 2003, 181, 1217–1223. [Google Scholar] [CrossRef]
  21. Robinson, P.; White, L.; Salonen, D.; Ogilvie-Harris, D. Anteromedial impingement of the ankle: Using MR arthrography to assess the anteromedial recess. Am. J. Roentgenol. 2002, 178, 601–604. [Google Scholar] [CrossRef]
  22. Sciulli, R.L.; Boutin, R.D.; Brown, R.; Nguyen, K.D.; Muhle, C.; Lektrakul, N.; Pathria, M.N.; Pedowitz, R.; Resnick, D. Evaluation of the postoperative meniscus of the knee: A study comparing conventional arthrography, conventional MR imaging, MR arthrography with iodinated contrast material, and MR arthrography with gadolinium-based contrast material. Skelet. Radiol. 1999, 28, 508–514. [Google Scholar] [CrossRef]
  23. Saveraid, T.C.; Judy, C.E. Use of intravenous gadolinium contrast in equine magnetic resonance imaging. The Veterinary clinics of North America. Equine Pract. 2012, 28, 617–636. [Google Scholar] [CrossRef] [PubMed]
  24. De Zani, D.; Rabbogliatti, V.; Ravasio, G.; Pettinato, C.; Di Giancamillo, M.; Zani, D.D. Contrast enhanced magnetic resonance imaging of the foot in horses using intravenous versus regional intraarterial injection of gadolinium. Open Vet. J. 2018, 8, 471–478. [Google Scholar] [CrossRef] [PubMed]
  25. Aarsvold, S.; Solano, M.; Garcia-Lopez, J. Magnetic resonance imaging following regional limb perfusion of gadolinium contrast medium in 26 horses. Equine Vet. J. 2018, 50, 649–657. [Google Scholar] [CrossRef] [PubMed]
  26. Nelson, B.; Goodrich, L.; Barrett, M.; Grinstaff, M.; Kawcak, C. Use of contrast media in computed tomography and magnetic resonance imaging in horses: Techniques, adverse events and opportunities. Equine Vet. J. 2017, 49, 410–424. [Google Scholar] [CrossRef] [PubMed]
  27. Zhalniarovich, Y.; Przyborowska-Zhalniarovich, P.; Mieszkowska, M.; Adamiak, Z. Direct magnetic resonance arthrography of the canine elbow. Acta Vet. Brno 2017, 86, 85–89. [Google Scholar] [CrossRef]
  28. Banfield, C.M.; Morrison, W.B. Magnetic resonance arthrography of the canine stifle joint technique and applications in eleven military dogs. Vet. Radiol. Ultrasound 2000, 41, 200–213. [Google Scholar] [CrossRef]
  29. Van Zadelhoff, C.; Schwarz, T.; Smith, S.; Engerand, A.; Taylor, S. Identification of naturally occurring cartilage damage in the equine distal interphalangeal joint using low-field magnetic resonance imaging and magnetic resonance arthrography. Front. Vet. Sci. 2020, 6, 508. [Google Scholar] [CrossRef]
  30. Bischofberger, A.S.; Fürst, A.E.; Torgerson, P.R.; Carstens, A.; Hilbe, M.; Kircher, P. Use of a 3-telsa magnet to perform delayed gadolinium-enhanced magnetic resonance imaging of the distal interphalangeal joint of horses with and without naturally occurring osteoarthritis. Am. J. Vet. Res. 2018, 79, 287–298. [Google Scholar] [CrossRef]
  31. Carstens, A.; Kirberger, R.M.; Velleman, M.; Dahlberg, L.E.; Fletcher, L.; Lammentausta, E. Feasibility for mapping cartilage T1 relaxation times in the distal metacarpus3/metatarsus3 of thoroughbred racehorses using delayed gadolinium-enhanced magnetic resonance imaging of cartilage (dGEMRIC): Normal cadaver study. Vet. Radiol. Ultrasound 2013, 54, 365–372. [Google Scholar] [CrossRef]
  32. McIlwraith, C.W.; Nixon, A.J.; Wright, I.M. Diagnostic and Surgical Arthroscopy in the Horse, 4th ed.; Elsevier: Amsterdam, The Netherlands, 2014. [Google Scholar]
  33. Aßmann, A.D.; Ohlerth, S.; Torgerson, P.R.; Bischofberger, A.S. Sensitivity and specificity of 3 Tesla magnetic resonance imaging and multidetector computed tomographic tenography to identify artificially induced soft tissue lesions in the equine cadaveric digital flexor tendon sheath. Equine Vet. Educ. 2023, 35, e507–e516. [Google Scholar] [CrossRef]
  34. Findley, J.A.; Ricci, E.E.; Singer, E.E. An anatomical and histological study of the equine proximal manica flexoria. Vet. Comp. Orthop. Traumatol. 2017, 30, 91–98. [Google Scholar] [CrossRef] [PubMed]
  35. Lin, S.P.; Brown, J.J. MR contrast agents: Physical and pharmacologic basics. J. Magn. Reson. Imaging Off. J. Int. Soc. Magn. Reson. Med. 2007, 25, 884–899. [Google Scholar] [CrossRef] [PubMed]
  36. Murray, R.C.; Mair, T.S.; Sherlock, C.E.; Blunden, A.S. Comparison of high-field and low-field magnetic resonance images of cadaver limbs of horses. Vet. Rec. 2009, 165, 281–288. [Google Scholar] [CrossRef] [PubMed]
  37. Vallance, S.; Bell, R.; Spriet, M.; Kass, P.H.; Puchalski, S. Comparisons of computed tomography, contrast enhanced computed tomography and standing low-field magnetic resonance imaging in horses with lameness localised to the foot. Part 1: Anatomic visualisation scores. Equine Vet. J. 2012, 44, 51–56. [Google Scholar] [CrossRef] [PubMed]
  38. Porter, E.G.; Werpy, N.M. New concepts in standing advanced diagnostic equine imaging. Vet. Clin. Equine Pract. 2014, 30, 239–268. [Google Scholar] [CrossRef]
  39. Werpy, N.M. Magnetic resonance imaging of the equine patient: A comparison of high-and low-field systems. Clin. Tech. Equine Pract. 2007, 6, 37–45. [Google Scholar] [CrossRef]
  40. Carrino, J.A.; Morrison, W.B.; Zou, K.H.; Steffen, R.T.; Snearly, W.N.; Murray, P.M. Noncontrast MR imaging and MR arthrography of the ulnar collateral ligament of the elbow: Prospective evaluation of two-dimensional pulse sequences for detection of complete tears. Skelet. Radiol. 2001, 30, 625–632. [Google Scholar] [CrossRef]
  41. Zanetti, M.; Bräm, J.; Hodler, J. Triangular fibrocartilage and intercarpal ligaments of the wrist: Does MR arthrography improve standard MRI? J. Magn. Reson. Imaging 1997, 7, 590–594. [Google Scholar] [CrossRef]
  42. Stecco, A.; Brambilla, M.; Puppi, A.M.; Lovisolo, M.; Boldorini, R.; Carriero, A. Shoulder MR arthrography: In vitro determination of optimal gadolinium dilution as a function of field strength. J. Magn. Reson. Imaging Off. J. Int. Soc. Magn. Reson. Med. 2007, 25, 200–207. [Google Scholar] [CrossRef]
  43. Andreisek, G.; Froehlich, J.M.; Hodler, J.; Weishaupt, D.; Beutler, V.; Pfirrmann, C.W.; Boesch, C.; Nanz, D. Direct MR arthrography at 1.5 and 3.0 T: Signal dependence on gadolinium and iodine concentrations—Phantom study. Radiology 2008, 247, 706–716. [Google Scholar] [CrossRef] [PubMed]
  44. Murphy, S.E.; Ballegeer, E.A.; Forrest, L.J.; Schaefer, S.L. Magnetic resonance imaging findings in dogs with confirmed shoulder pathology. Vet. Surg. 2008, 37, 631–638. [Google Scholar] [CrossRef] [PubMed]
  45. Schaefer, S.L.; Baumel, C.A.; Gerbig, J.R.; Forrest, L.J. Direct magnetic resonance arthrography of the canine shoulder. Vet. Radiol. Ultrasound 2010, 51, 391–396. [Google Scholar] [CrossRef] [PubMed]
  46. Ugas, M.A.; Huynh, B.H.; Fox, M.G.; Patrie, J.T.; Gaskin, C.M. MR arthrography: Impact of steroids, local anesthetics, and iodinated contrast material on gadolinium signal intensity in phantoms at 1.5 and 3.0 T. Radiology 2014, 272, 475–483. [Google Scholar] [CrossRef]
  47. Montgomery, D.D.; Morrison, W.B.; Schweitzer, M.E.; Weishaupt, D.; Dougherty, L. Effects of iodinated contrast and field strength on gadolinium enhancement: Implications for direct MR arthrography. J. Magn. Reson. Imaging Off. J. Int. Soc. Magn. Reson. Med. 2002, 15, 334–343. [Google Scholar] [CrossRef]
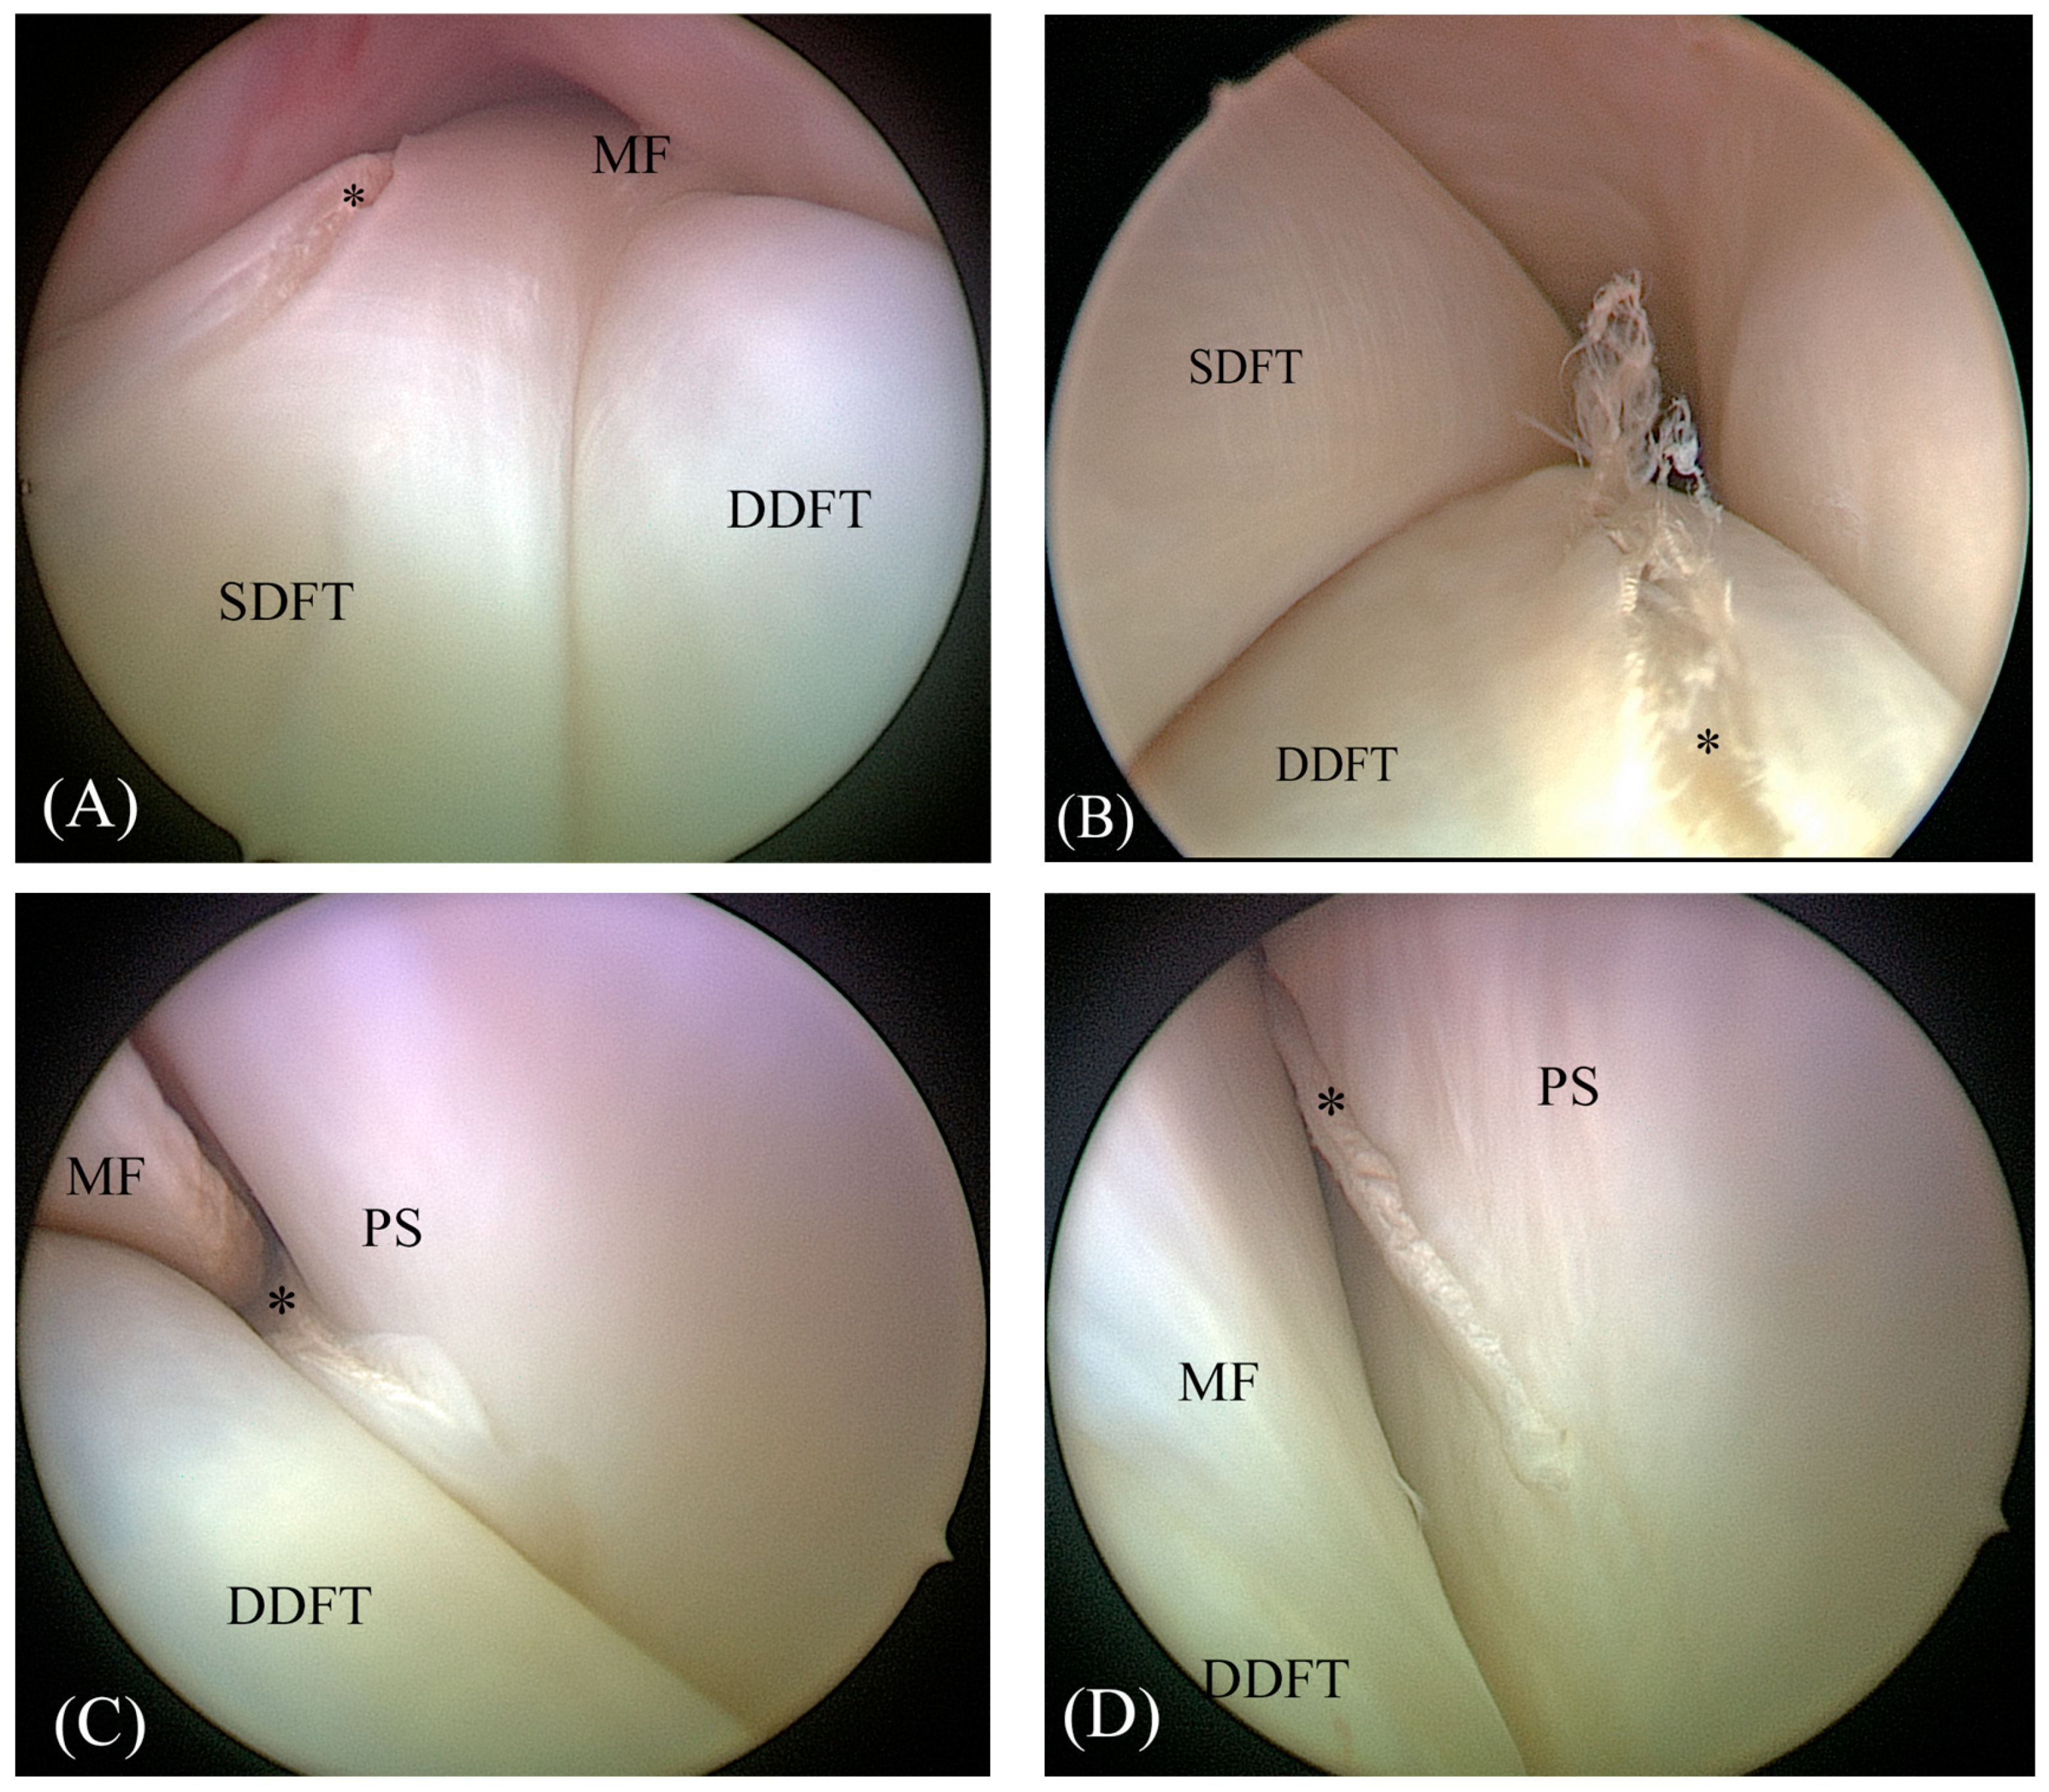
Figure 1. Images of tenoscopically created lesions (asterisk) in the superficial digital flexor tendon (SDFT) (A), the deep digital flexor tendon (DDFT) (B), the manica flexoria (MF) (C) and the proximal scutum (PS) (D).
Animals 13 03772 g001
Figure 2. Superficial digital flexor tendon lesion (arrow) in a cadaveric equine digital flexor tendon sheath: transverse T2 magnetic resonance image (A), transverse T1 magnetic resonance tenographic image (B) and a transverse post-contrast T1 magnetic resonance tenographic image (C) of the same limb.
Animals 13 03772 g002
Figure 3. Deep digital flexor tendon lesion (arrow) in a cadaveric equine digital flexor tendon sheath: transverse T2 magnetic resonance image (A), transverse T1 magnetic resonance tenographic image (B) and a transverse post-contrast T1 magnetic resonance tenographic image (C) of the same limb.
Animals 13 03772 g003
Figure 4. Manica flexoria lesion (arrow) in a cadaveric equine digital flexor tendon sheath: transverse T2 magnetic resonance image (A), transverse T1 magnetic resonance tenographic image (B) and a transverse post-contrast T1 magnetic resonance tenographic image (C) of the same limb.
Animals 13 03772 g004
Figure 5. Proximal scutum lesion (arrow) in a cadaveric equine digital flexor tendon sheath: transverse T2 magnetic resonance image (A), transverse T1 magnetic resonance tenographic image (B) and a transverse post-contrast T1 magnetic resonance tenographic image (C) of the same limb.
Animals 13 03772 g005
Table 1. Scanning parameters of the magnetic resonance imaging sequences used in this study. Abbreviations: FOV: field of view, TR: time to repetition, TE: time to echo, NEX: number of excitations, SNR: signal to noise ratio, TRA: transverse, GRE: gradient echo, MI: Motion insensitive, FSE: fast spin echo.
T2W_FSE_TRA_MI
Pre-Contrast
T1W_GRE_TRA_MI
Pre-Contrast
T1W_GRE_TRA_MI
Post-Contrast
TR15445252
TE8888
Flip angle905050
Echo811
NEX111
FOV170171171
Slice thickness5 mm5 mm5 mm
Gap width1 mm1 mm1 mm
Number of slices888
Time to run (min)2:102:102:10
SNR949999
Spacing between slices6.06.06.0
Table 2. Sensitivity and specificity of magnetic resonance imaging (MRI) and magnetic resonance imaging tenography (MRIt) to detect experimental lesions in different soft-tissue structures within the digital flexor tendon sheath.
LesionSensitivity (%) (95% ^), (n)Specificity (%) (95% ^), (n)
MRI SDFT39% (0.22–0.59) (11)93% (0.83–0.98) (52)
MRIt SDFT54% (0.34–0.72) (15)96% (0.88–0.99) (54)
MRI DDFT34% (0.19–0.51) (13)100% (0.92–1) (46)
MRIt DDFT32% (0.18–0.49) (12)98% (0.88–0.99) (45)
MRI MF61% (0.36–0.83) (11)96% (0.79–0.99) (23)
MRIt MF50% (0.26–0.74) (9)96% (0.79–0.99) (23)
MRI scutum38% (0.22–0.56) (13)96% (0.86–0.99) (48)
MRIt scutum50% (0.32–0.68) (17)96% (0.86–0.99) (48)
Disclaimer/Publisher’s Note: The statements, opinions and data contained in all publications are solely those of the individual author(s) and contributor(s) and not of MDPI and/or the editor(s). MDPI and/or the editor(s) disclaim responsibility for any injury to people or property resulting from any ideas, methods, instructions or products referred to in the content.