
Association between Days Open and Parity, Calving Season or Milk Spectral Data

Abstract
:Simple Summary
Abstract
1. Introduction
2. Materials and Methods
2.1. Data Acquisition and Editing
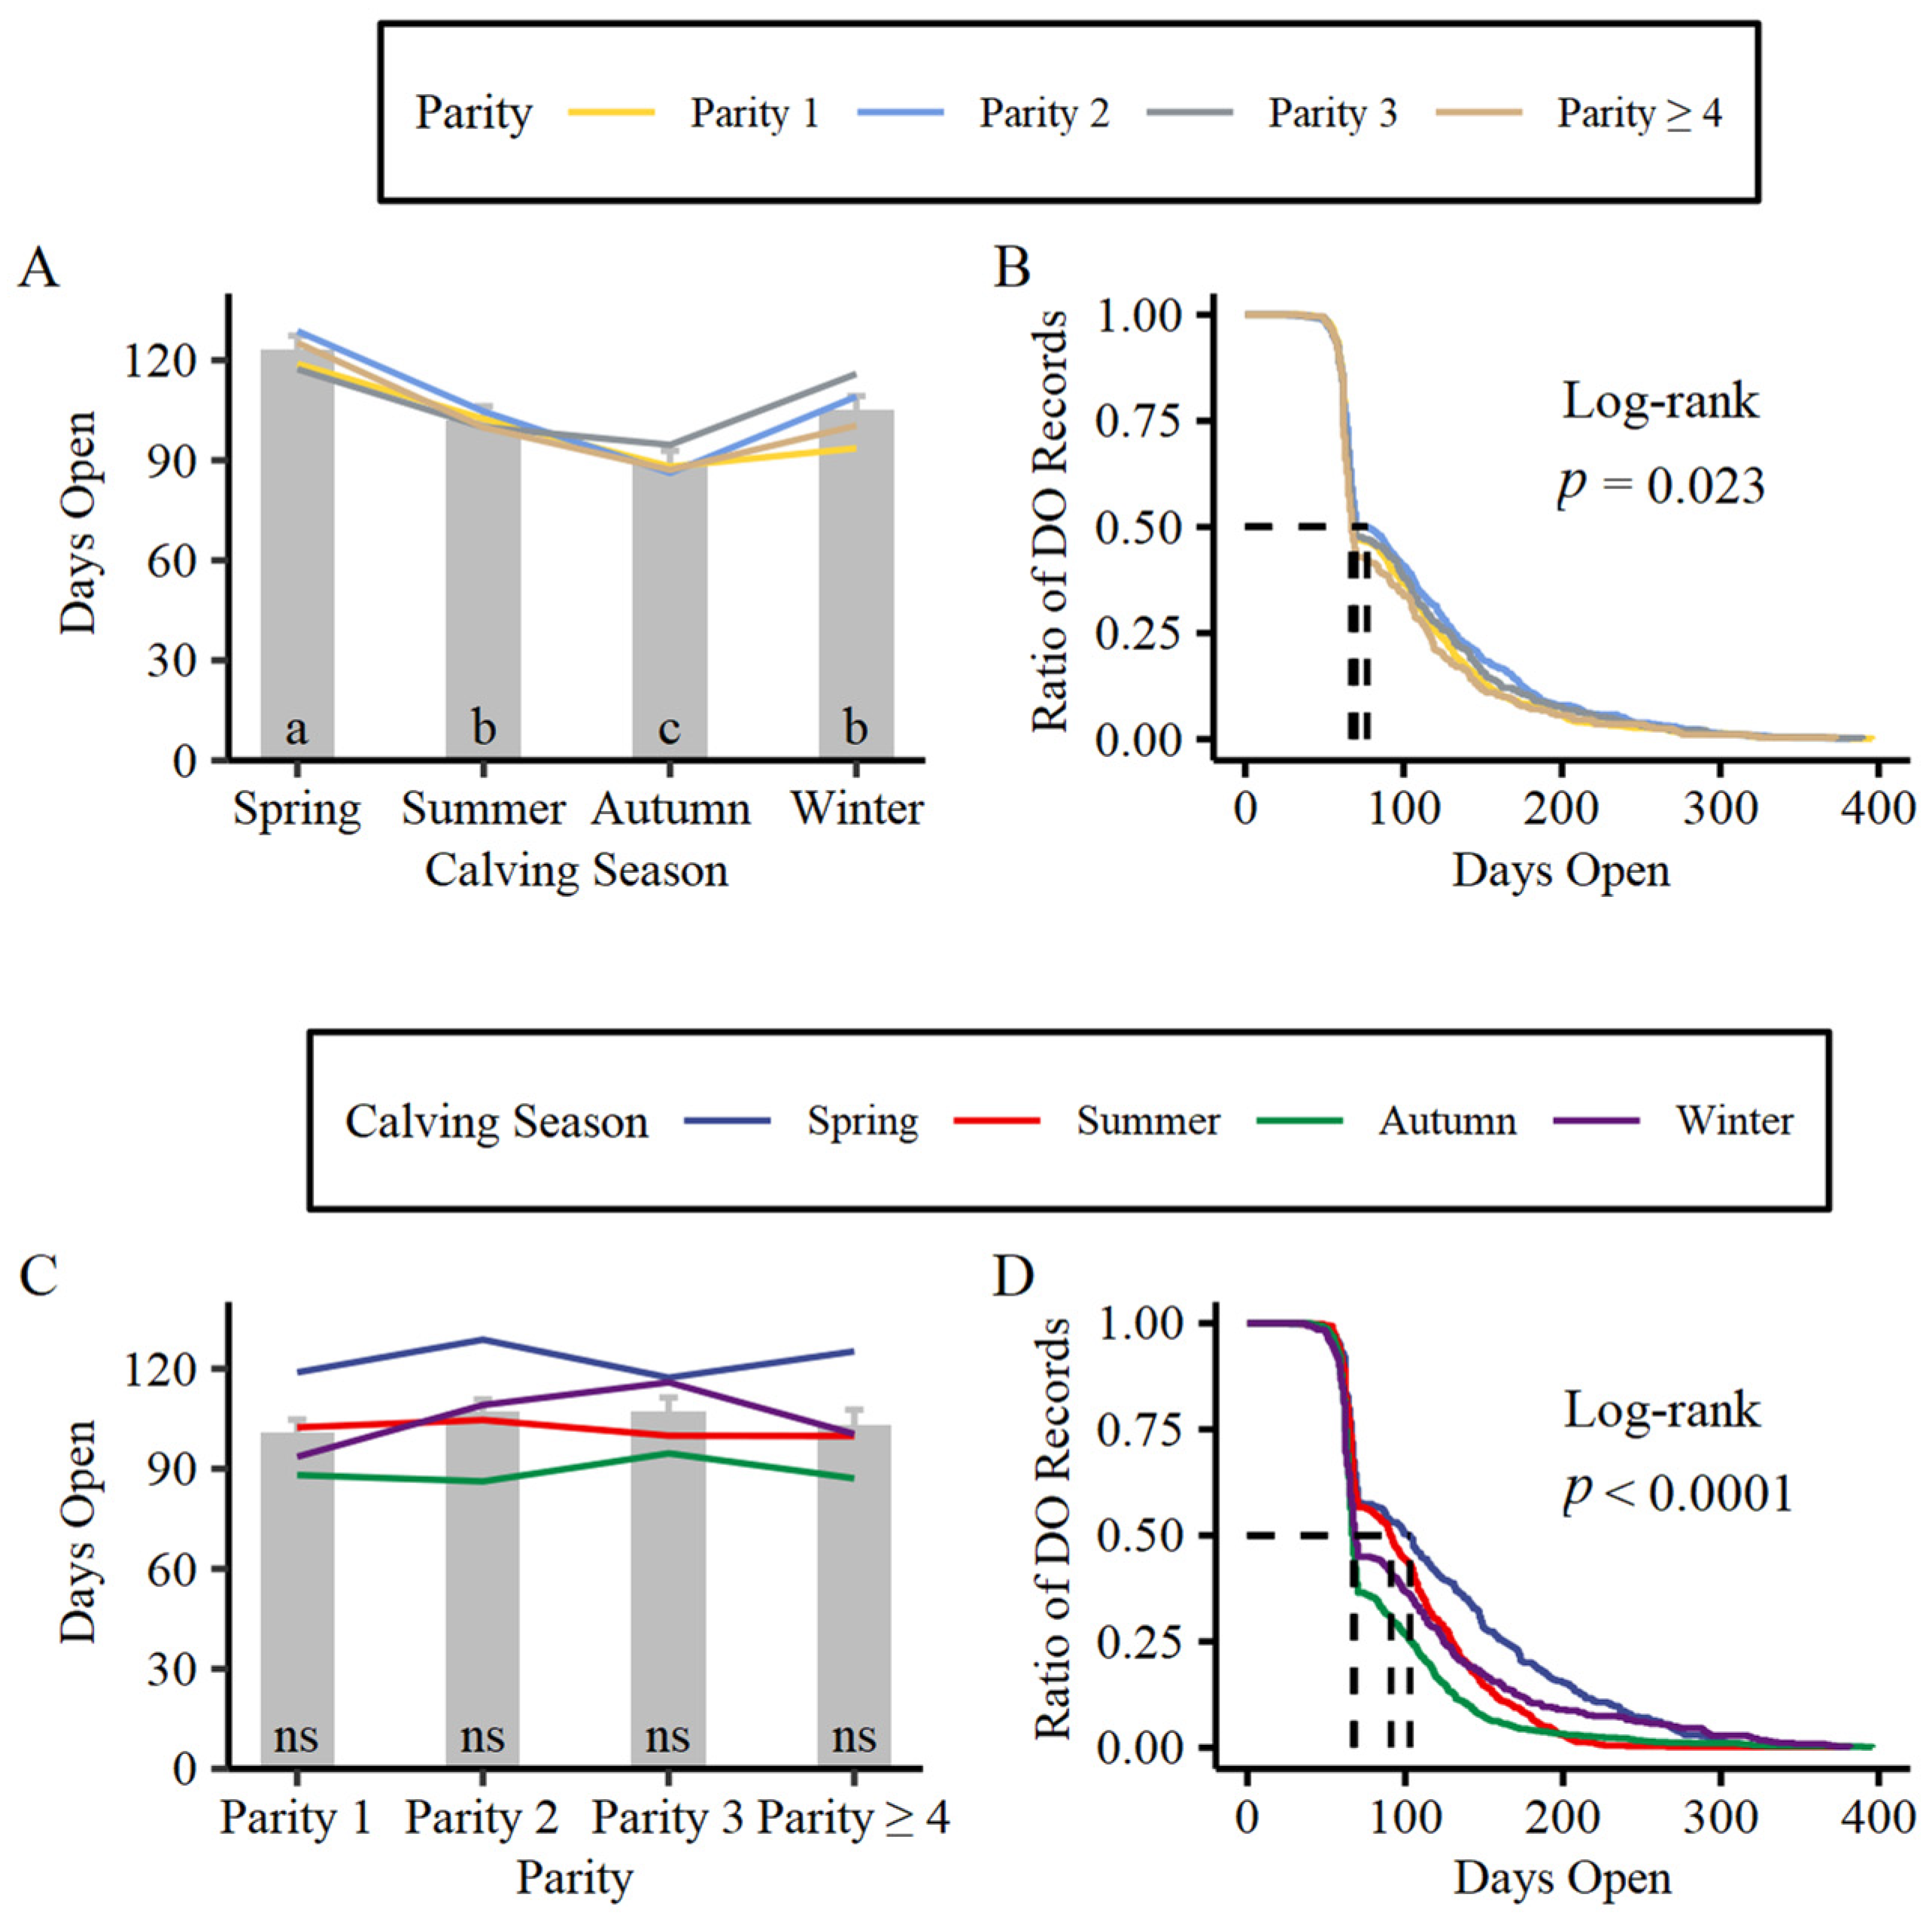
2.2. Difference in DO between Parity or Calving Season Groups
2.3. Associations between Days Open and Milk Spectral Data
2.4. Marginal and Joint Associations between Wavenumbers and DO
3. Results
3.1. Difference in DO between Parity or Calving Season Groups
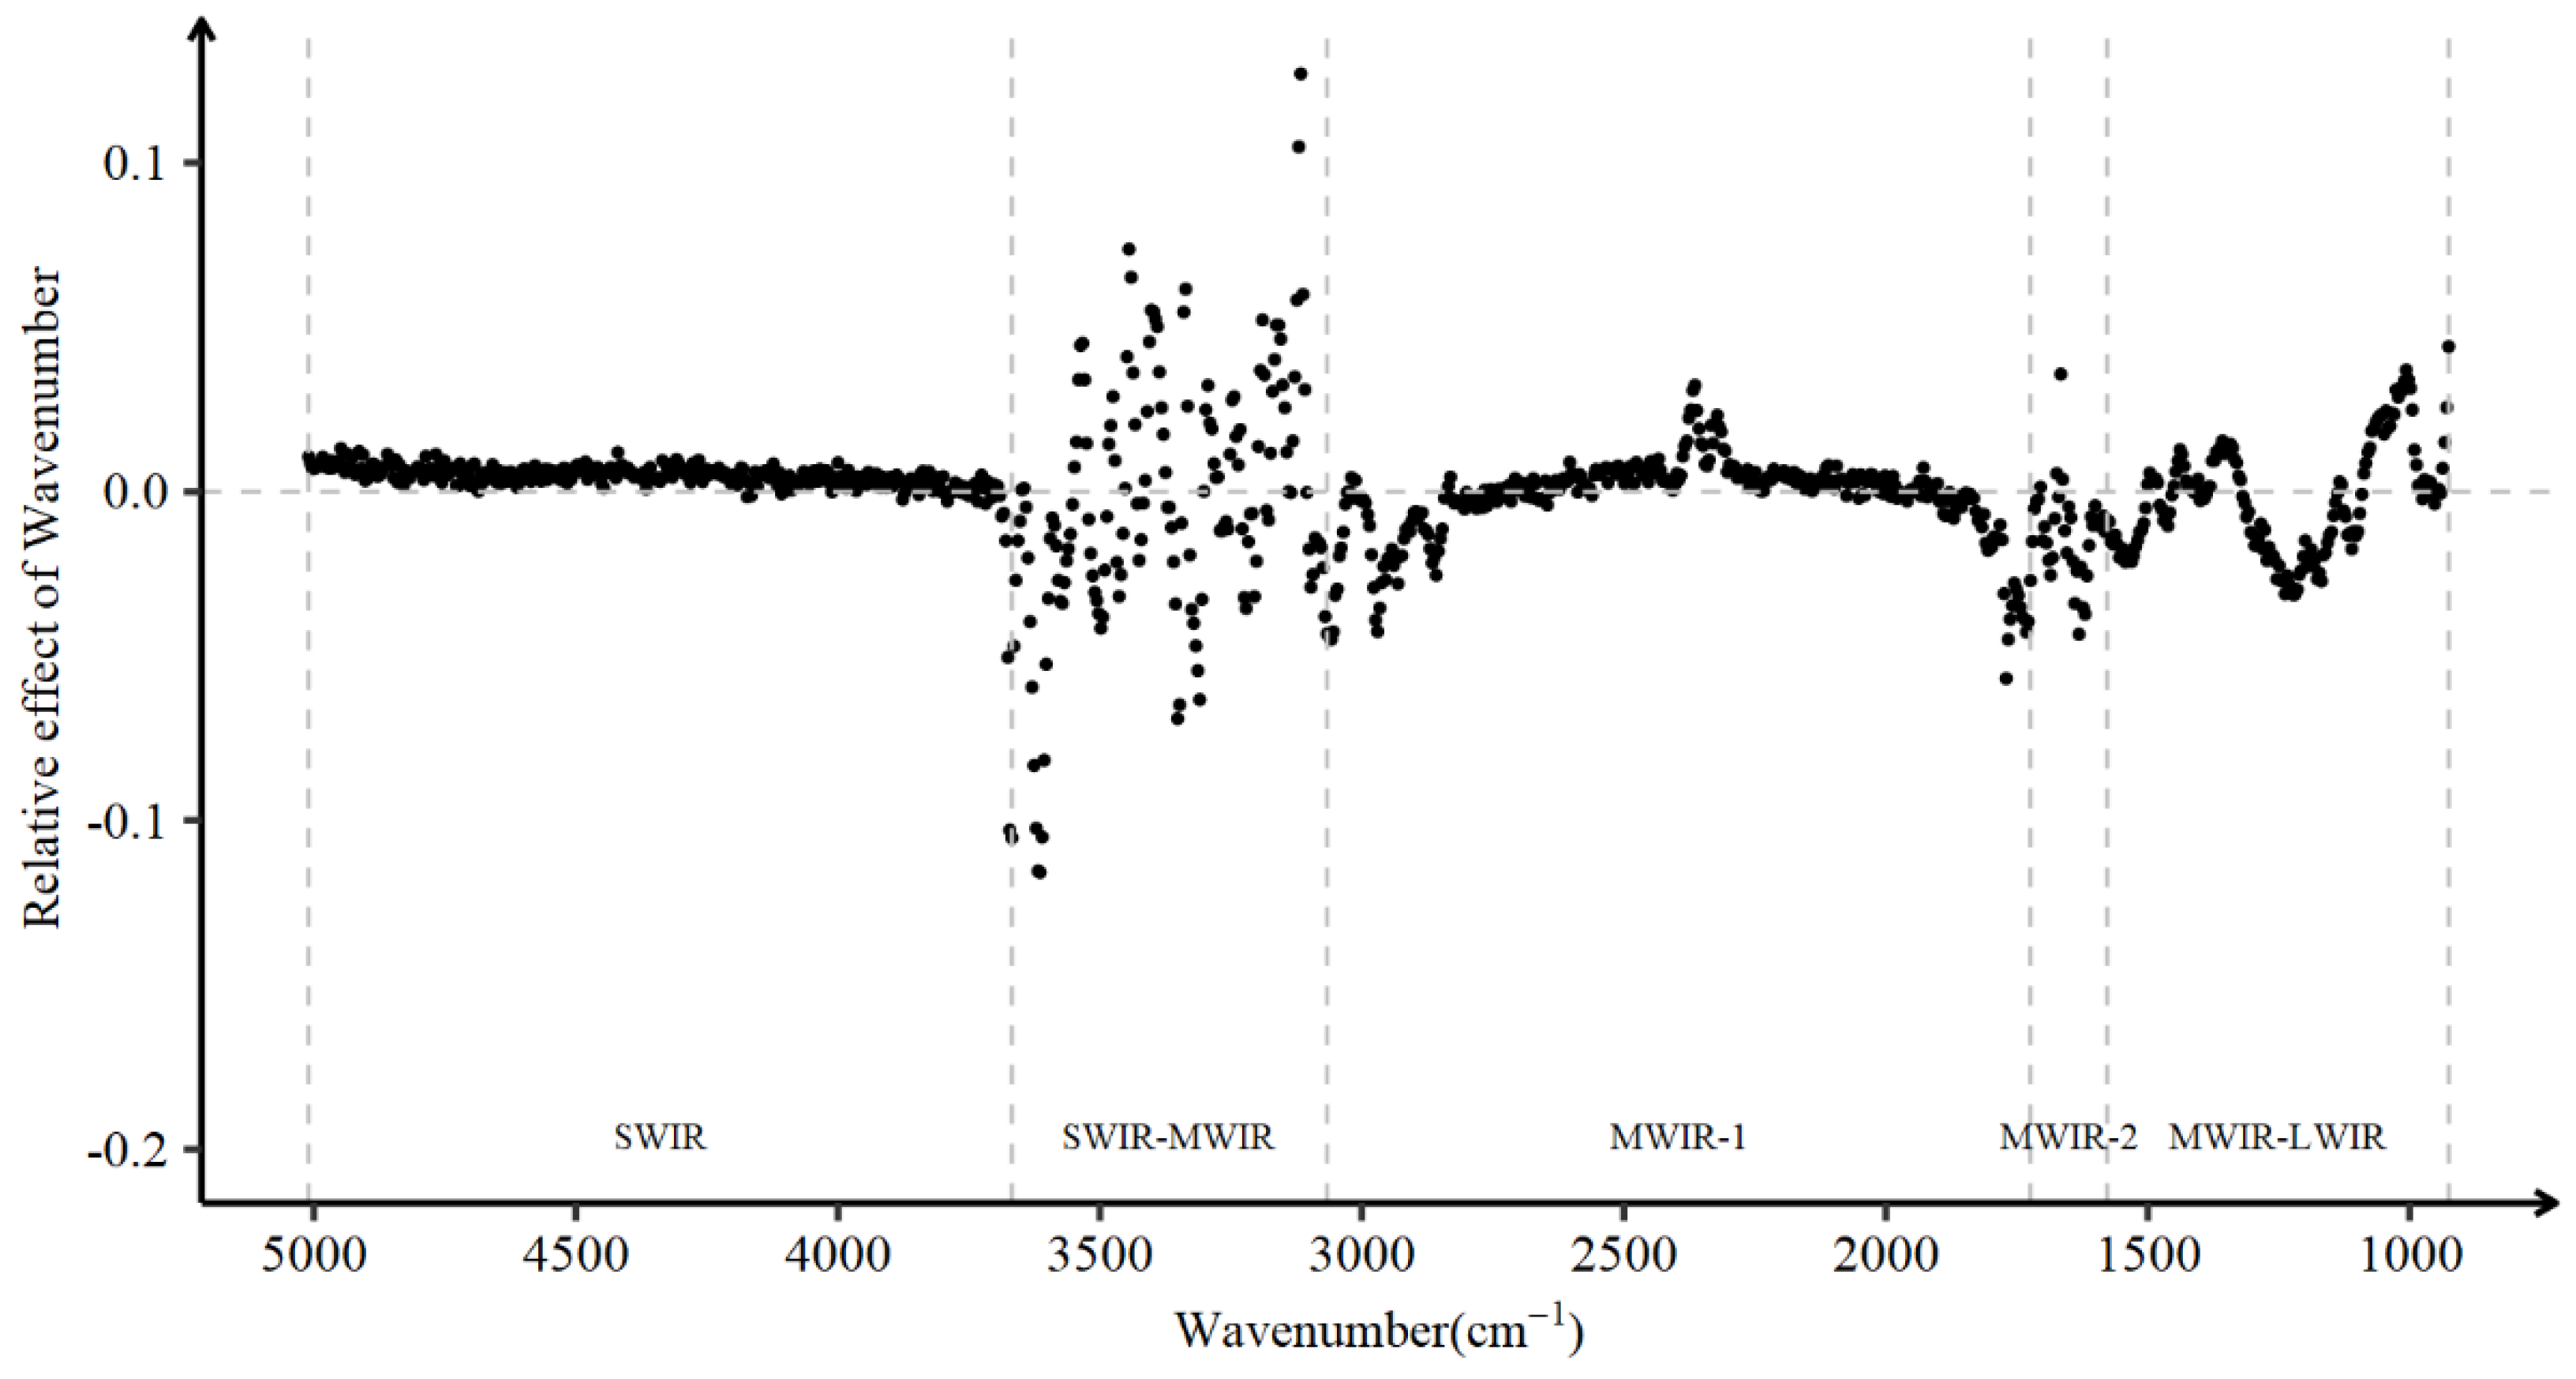
3.2. Associations between Wavenumbers and DO
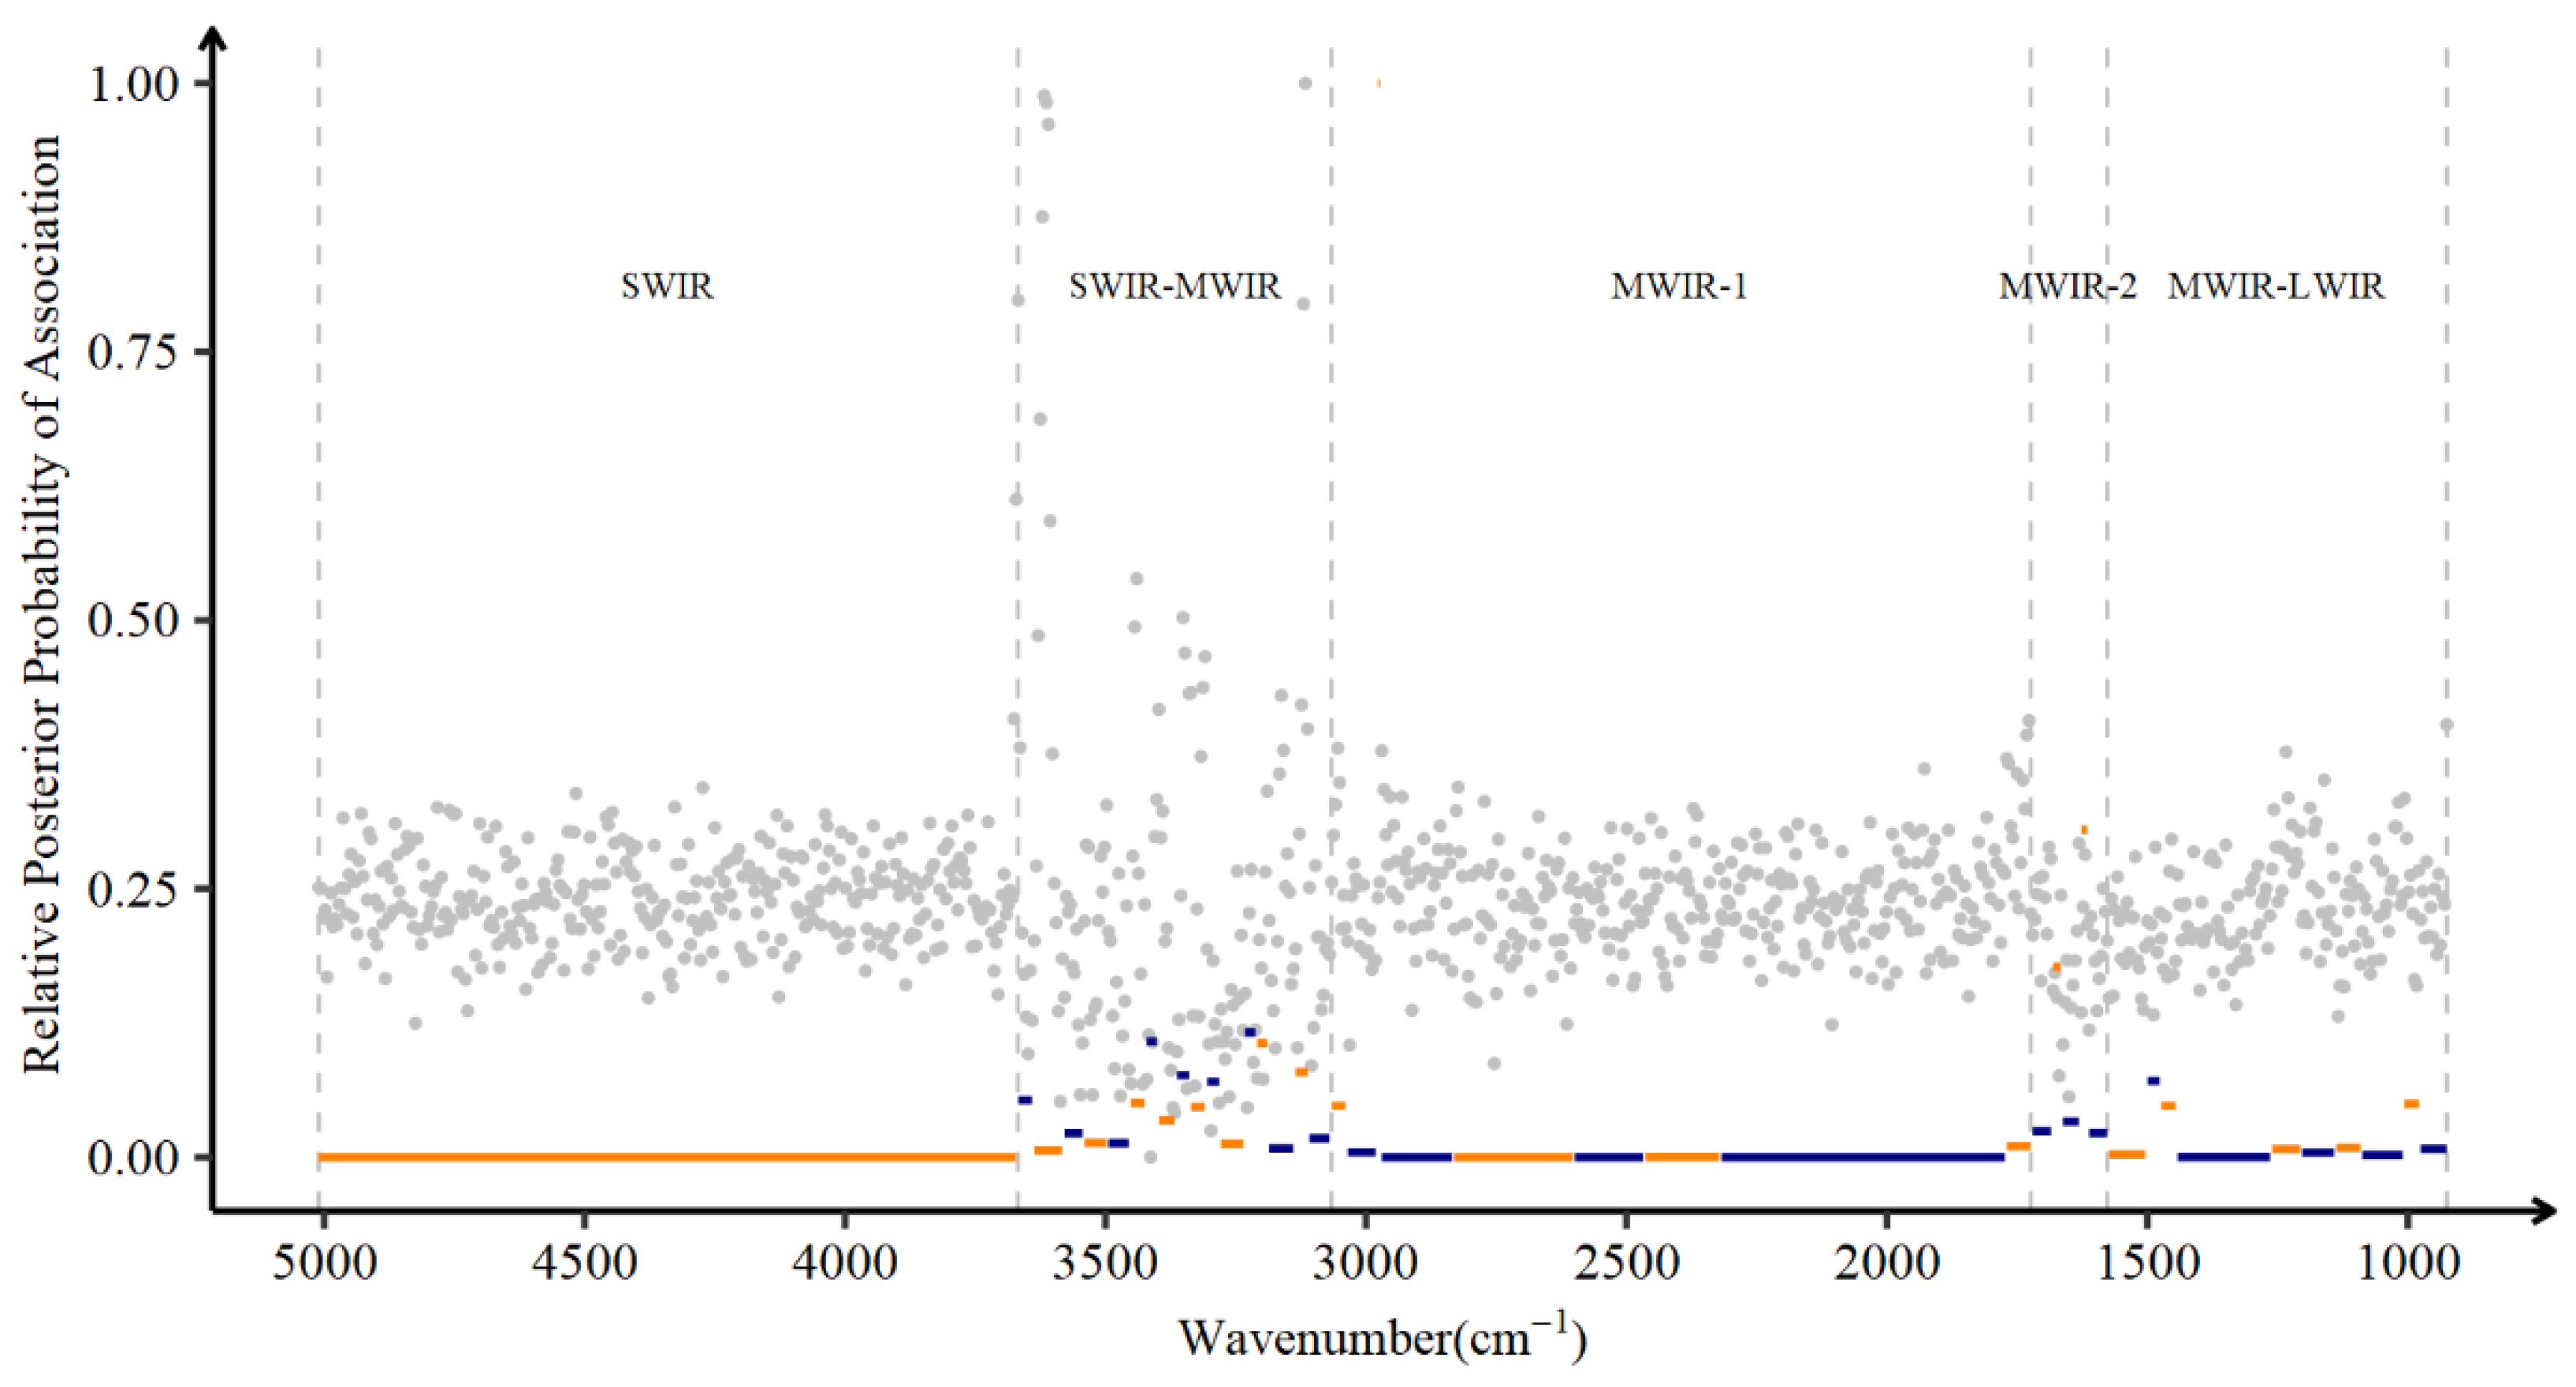
3.3. Marginal and Joint Associations between Wavenumbers and DO
4. Discussion
4.1. The Limitations of FT-MIR When Considering Complex Traits
4.2. Factors Affect Days Open and the Association of DO with Wavenumbers
5. Conclusions
Author Contributions
Funding
Institutional Review Board Statement
Informed Consent Statement
Data Availability Statement
Acknowledgments
Conflicts of Interest
References
- Mitchell, R.G.; Rogers, G.W.; Dechow, C.D.; Vallimont, J.E.; Cooper, J.B.; Sander-Nielsen, U.; Clay, J.S. Milk Urea Nitrogen Concentration: Heritability and Genetic Correlations with Reproductive Performance and Disease. J. Dairy Sci. 2005, 88, 4434–4440. [Google Scholar] [CrossRef]
- Bohmanova, J.; Jamrozik, J.; Miglior, F. Effect of Pregnancy on Production Traits of Canadian Holstein Cows. J. Dairy Sci. 2009, 92, 2947–2959. [Google Scholar] [CrossRef] [PubMed]
- Loker, S.; Miglior, F.; Bohmanova, J.; Jamrozik, J.; Schaeffer, L.R. Phenotypic Analysis of Pregnancy Effect on Milk, Fat, and Protein Yields of Canadian Ayrshire, Jersey, Brown Swiss, and Guernsey Breeds. J. Dairy Sci. 2009, 92, 1300–1312. [Google Scholar] [CrossRef] [PubMed]
- Bastin, C.; Berry, D.P.; Soyeurt, H.; Gengler, N. Genetic Correlations of Days Open with Production Traits and Contents in Milk of Major Fatty Acids Predicted by Mid-Infrared Spectrometry. J. Dairy Sci. 2012, 95, 6113–6121. [Google Scholar] [CrossRef] [PubMed]
- Oseni, S.; Tsuruta, S.; Misztal, I.; Rekaya, R. Genetic Parameters for Days Open and Pregnancy Rates in US Holsteins Using Different Editing Criteria. J. Dairy Sci. 2004, 87, 4327–4333. [Google Scholar] [CrossRef]
- Chang, Y.M.; Andersen-Ranberg, I.M.; Heringstad, B.; Gianola, D.; Klemetsdal, G. Bivariate Analysis of Number of Services to Conception and Days Open in Norwegian Red Using a Censored Threshold-Linear Model. J. Dairy Sci. 2006, 89, 772–778. [Google Scholar] [CrossRef]
- Martinez-Castillero, M.; Toledo-Alvarado, H.; Pegolo, S.; Vazquez, A.I.; de los Campos, G.; Varona, L.; Finocchiaro, R.; Bittante, G.; Cecchinato, A. Genetic Parameters for Fertility Traits Assessed in Herds Divergent in Milk Energy Output in Holstein-Friesian, Brown Swiss, and Simmental Cattle. J. Dairy Sci. 2020, 103, 11545–11558. [Google Scholar] [CrossRef]
- Barton, B.A.; Rosario, H.A.; Anderson, G.W.; Grindle, B.P.; Carroll, D.J. Effects of Dietary Crude Protein, Breed, Parity, and Health Status on the Fertility of Dairy Cows1. J. Dairy Sci. 1996, 79, 2225–2236. [Google Scholar] [CrossRef]
- Miller, R.H.; Clay, J.S.; Norman, H.D. Relationship of Somatic Cell Score with Fertility Measures. J. Dairy Sci. 2001, 84, 2543–2548. [Google Scholar] [CrossRef]
- Heuwieser, W.; Oltenacu, P.A.; Lednor, A.J.; Foote, R.H. Evaluation of Different Protocols for Prostaglandin Synchronization to Improve Reproductive Performance in Dairy Herds with Low Estrus Detection Efficiency1. J. Dairy Sci. 1997, 80, 2766–2774. [Google Scholar] [CrossRef]
- Goodling, R.C.J.; Shook, G.E.; Weigel, K.A.; Zwald, N.R. The Effect of Synchronization on Genetic Parameters of Reproductive Traits in Dairy Cattle. J. Dairy Sci. 2005, 88, 2217–2225. [Google Scholar] [CrossRef]
- Boonkum, W.; Misztal, I.; Duangjinda, M.; Pattarajinda, V.; Tumwasorn, S.; Buaban, S. Short Communication: Genetic Effects of Heat Stress on Days Open for Thai Holstein Crossbreds. J. Dairy Sci. 2011, 94, 1592–1596. [Google Scholar] [CrossRef]
- Choi, Y.S.; McDaniel, B.T. Heritabilities of Measures of Hooves and Their Relation to Other Traits of Holsteins1. J. Dairy Sci. 1993, 76, 1989–1993. [Google Scholar] [CrossRef]
- Dechow, C.D.; Rogers, G.W.; Klei, L.; Lawlor, T.J.; VanRaden, P.M. Body Condition Scores and Dairy Form Evaluations as Indicators of Days Open in US Holsteins. J. Dairy Sci. 2004, 87, 3534–3541. [Google Scholar] [CrossRef]
- Kuhn, M.T.; Hutchison, J.L.; Norman, H.D. Characterization of Days Dry for United States Holsteins. J. Dairy Sci. 2005, 88, 1147–1155. [Google Scholar] [CrossRef] [PubMed]
- Kuhn, M.T.; VanRaden, P.M.; Hutchison, J.L. Use of Early Lactation Days Open Records for Genetic Evaluation of Cow Fertility. J. Dairy Sci. 2004, 87, 2277–2284. [Google Scholar] [CrossRef] [PubMed]
- Wiggans, G.R.; Goodling, R.C.J. Accounting for Pregnancy Diagnosis in Predicting Days Open. J. Dairy Sci. 2005, 88, 1873–1877. [Google Scholar] [CrossRef]
- Grummer, R.R.; Mashek, D.G.; Hayirli, A. Dry Matter Intake and Energy Balance in the Transition Period. Vet. Clin. N. Am. Food Anim. Pract. 2004, 20, 447–470. [Google Scholar] [CrossRef]
- Grummer, R.R. Etiology of Lipid-Related Metabolic Disorders in Periparturient Dairy Cows. J. Dairy Sci. 1993, 76, 3882–3896. [Google Scholar] [CrossRef]
- Santschi, D.E.; Lefebvre, D.M.; Cue, R.I.; Girard, C.L.; Pellerin, D. Incidence of Metabolic Disorders and Reproductive Performance Following a Short (35-d) or Conventional (60-d) Dry Period Management in Commercial Holstein Herds. J. Dairy Sci. 2011, 94, 3322–3330. [Google Scholar] [CrossRef] [Green Version]
- Collard, B.L.; Boettcher, P.J.; Dekkers, J.C.M.; Petitclerc, D.; Schaeffer, L.R. Relationships between Energy Balance and Health Traits of Dairy Cattle in Early Lactation. J. Dairy Sci. 2000, 83, 2683–2690. [Google Scholar] [CrossRef] [PubMed]
- Civiero, M.; Cabezas-Garcia, E.H.; Ribeiro-Filho, H.M.N.; Gordon, A.W.; Ferris, C.P. Relationships between Energy Balance during Early Lactation and Cow Performance, Blood Metabolites, and Fertility: A Meta-Analysis of Individual Cow Data. J. Dairy Sci. 2021, 104, 7233–7251. [Google Scholar] [CrossRef]
- Reist, M.; Koller, A.; Busato, A.; Kupfer, U.; Blum, J.W. First Ovulation and Ketone Body Status in the Early Postpartum Period of Dairy Cows. Theriogenology 2000, 54, 685–701. [Google Scholar] [CrossRef] [PubMed]
- Martin, A.D.; Afseth, N.K.; Kohler, A.; Randby, Å.; Eknæs, M.; Waldmann, A.; Dørum, G.; Måge, I.; Reksen, O. The Relationship between Fatty Acid Profiles in Milk Identified by Fourier Transform Infrared Spectroscopy and Onset of Luteal Activity in Norwegian Dairy Cattle. J. Dairy Sci. 2015, 98, 5374–5384. [Google Scholar] [CrossRef]
- Dunshea, F.R.; Bell, A.W.; Trigg, T.E. Relations between Plasma Non-Esterified Fatty Acid Metabolism and Body Fat Mobilization in Primiparous Lactating Goats. Br. J. Nutr. 1989, 62, 51–61. [Google Scholar] [CrossRef] [PubMed]
- Esposito, G.; Irons, P.C.; Webb, E.C.; Chapwanya, A. Interactions between Negative Energy Balance, Metabolic Diseases, Uterine Health and Immune Response in Transition Dairy Cows. Anim. Reprod. Sci. 2014, 144, 60–71. [Google Scholar] [CrossRef] [PubMed]
- Negussie, E.; Strandén, I.; Mäntysaari, E.A. Genetic Associations of Test-Day Fat: Protein Ratio with Milk Yield, Fertility, and Udder Health Traits in Nordic Red Cattle. J. Dairy Sci. 2013, 96, 1237–1250. [Google Scholar] [CrossRef]
- Benedet, A.; Franzoi, M.; Penasa, M.; Pellattiero, E.; De Marchi, M. Prediction of Blood Metabolites from Milk Mid-Infrared Spectra in Early-Lactation Cows. J. Dairy Sci. 2019, 102, 11298–11307. [Google Scholar] [CrossRef] [PubMed]
- Rovere, G.; de los Campos, G.; Lock, A.L.; Worden, L.; Vazquez, A.I.; Lee, K.; Tempelman, R.J. Prediction of Fatty Acid Composition Using Milk Spectral Data and Its Associations with Various Mid-Infrared Spectral Regions in Michigan Holsteins. J. Dairy Sci. 2021, 104, 11242–11258. [Google Scholar] [CrossRef]
- ICAR Section 2—Guidelines for Dairy Cattle Milk Recording. Int. Comm. Anim. Record 2017. Available online: https://www.icar.org/Guidelines/02-Overview-Cattle-Milk-Recording.pdf (accessed on 14 December 2022).
- Grelet, C.; Dardenne, P.; Soyeurt, H.; Fernandez, J.A.; Vanlierde, A.; Stevens, F.; Gengler, N.; Dehareng, F. Large-Scale Phenotyping in Dairy Sector Using Milk MIR Spectra: Key Factors Affecting the Quality of Predictions. Methods 2021, 186, 97–111. [Google Scholar] [CrossRef] [PubMed]
- Dehareng, F.; Delfosse, C.; Froidmont, E.; Soyeurt, H.; Martin, C.; Gengler, N.; Vanlierde, A.; Dardenne, P. Potential Use of Milk Mid-Infrared Spectra to Predict Individual Methane Emission of Dairy Cows. Animal 2012, 6, 1694–1701. [Google Scholar] [CrossRef] [PubMed]
- Vanlierde, A.; Vanrobays, M.-L.; Gengler, N.; Dardenne, P.; Froidmont, E.; Soyeurt, H.; McParland, S.; Lewis, E.; Deighton, M.H.; Mathot, M.; et al. Milk Mid-Infrared Spectra Enable Prediction of Lactation-Stage-Dependent Methane Emissions of Dairy Cattle within Routine Population-Scale Milk Recording Schemes. Anim. Prod. Sci. 2016, 56, 258. [Google Scholar] [CrossRef]
- Vanlierde, A.; Dehareng, F.; Gengler, N.; Froidmont, E.; McParland, S.; Kreuzer, M.; Bell, M.; Lund, P.; Martin, C.; Kuhla, B.; et al. Improving Robustness and Accuracy of Predicted Daily Methane Emissions of Dairy Cows Using Milk Mid-Infrared Spectra. J. Sci. Food Agric. 2021, 101, 3394–3403. [Google Scholar] [CrossRef]
- Shetty, N.; Difford, G.; Lassen, J.; Løvendahl, P.; Buitenhuis, A.J. Predicting Methane Emissions of Lactating Danish Holstein Cows Using Fourier Transform Mid-Infrared Spectroscopy of Milk. J. Dairy Sci. 2017, 100, 9052–9060. [Google Scholar] [CrossRef]
- Engelke, S.W.; Daş, G.; Derno, M.; Tuchscherer, A.; Berg, W.; Kuhla, B.; Metges, C.C. Milk Fatty Acids Estimated by Mid-Infrared Spectroscopy and Milk Yield Can Predict Methane Emissions in Dairy Cows. Agron. Sustain. Dev. 2018, 38, 27. [Google Scholar] [CrossRef]
- Denninger, T.M.; Schwarm, A.; Dohme-Meier, F.; Münger, A.; Bapst, B.; Wegmann, S.; Grandl, F.; Vanlierde, A.; Sorg, D.; Ortmann, S.; et al. Accuracy of Methane Emissions Predicted from Milk Mid-Infrared Spectra and Measured by Laser Methane Detectors in Brown Swiss Dairy Cows. J. Dairy Sci. 2020, 103, 2024–2039. [Google Scholar] [CrossRef]
- Delhez, P.; Ho, P.N.; Gengler, N.; Soyeurt, H.; Pryce, J.E. Diagnosing the Pregnancy Status of Dairy Cows: How Useful Is Milk Mid-Infrared Spectroscopy? J. Dairy Sci. 2020, 103, 3264–3274. [Google Scholar] [CrossRef] [PubMed]
- Brand, W.; Wells, A.T.; Smith, S.L.; Denholm, S.J.; Wall, E.; Coffey, M.P. Predicting Pregnancy Status from Mid-Infrared Spectroscopy in Dairy Cow Milk Using Deep Learning. J. Dairy Sci. 2021, 104, 4980–4990. [Google Scholar] [CrossRef]
- Khanal, P.; Tempelman, R.J. The Use of Milk Fourier-Transform Mid-Infrared Spectroscopy to Diagnose Pregnancy and Determine Spectral Regional Associations with Pregnancy in US Dairy Cows. J. Dairy Sci. 2022, 105, 3209–3221. [Google Scholar] [CrossRef]
- Tiplady, K.M.; Trinh, M.-H.; Davis, S.R.; Sherlock, R.G.; Spelman, R.J.; Garrick, D.J.; Harris, B.L. Pregnancy Status Predicted Using Milk Mid-Infrared Spectra from Dairy Cattle. J. Dairy Sci. 2022, 105, 3615–3632. [Google Scholar] [CrossRef] [PubMed]
- McParland, S.; Banos, G.; Wall, E.; Coffey, M.P.; Soyeurt, H.; Veerkamp, R.F.; Berry, D.P. The Use of Mid-Infrared Spectrometry to Predict Body Energy Status of Holstein Cows. J. Dairy Sci. 2011, 94, 3651–3661. [Google Scholar] [CrossRef] [PubMed]
- McParland, S.; Banos, G.; McCarthy, B.; Lewis, E.; Coffey, M.P.; O’Neill, B.; O’Donovan, M.; Wall, E.; Berry, D.P. Validation of Mid-Infrared Spectrometry in Milk for Predicting Body Energy Status in Holstein-Friesian Cows. J. Dairy Sci. 2012, 95, 7225–7235. [Google Scholar] [CrossRef] [PubMed]
- Smith, S.L.; Denholm, S.J.; Coffey, M.P.; Wall, E. Energy Profiling of Dairy Cows from Routine Milk Mid-Infrared Analysis. J. Dairy Sci. 2019, 102, 11169–11179. [Google Scholar] [CrossRef]
- Daniloski, D.; McCarthy, N.A.; Markoska, T.; Auldist, M.J.; Vasiljevic, T. Conformational and Physicochemical Characteristics of Bovine Skim Milk Obtained from Cows with Different Genetic Variants of β-Casein. Food Hydrocoll. 2022, 124, 107186. [Google Scholar] [CrossRef]
- Xiao, S.; Wang, Q.; Li, C.; Liu, W.; Zhang, J.; Fan, Y.; Su, J.; Wang, H.; Luo, X.; Zhang, S. Rapid Identification of A1 and A2 Milk Based on the Combination of Mid-Infrared Spectroscopy and Chemometrics. Food Control 2022, 134, 108659. [Google Scholar] [CrossRef]
- Toledo-Alvarado, H.; Pérez-Cabal, M.A.; Tempelman, R.J.; Cecchinato, A.; Bittante, G.; de los Campos, G.; Vazquez, A.I. Association between Days Open and Milk Spectral Data in Dairy Cows. J. Dairy Sci. 2021, 104, 3665–3675. [Google Scholar] [CrossRef]
- Terry, M.; Grambsch, T.; Grambsch, P.M. Modeling Survival Data: Extending the Cox Model; Springer: New York, NY, USA, 2000; ISBN 0-387-98784-3. [Google Scholar]
- Harrington, D.P.; Fleming, T.R. A Class of Rank Test Procedures for Censored Survival Data. Biometrika 1982, 69, 553–566. [Google Scholar] [CrossRef]
- Bates, D.; Mächler, M.; Bolker, B.; Walker, S. Fitting Linear Mixed-Effects Models Using Lme4. J. Stat. Softw. 2015, 67, 1–48. [Google Scholar] [CrossRef]
- Meuwissen, T.H.; Hayes, B.J.; Goddard, M.E. Prediction of Total Genetic Value Using Genome-Wide Dense Marker Maps. Genetics 2001, 157, 1819–1829. [Google Scholar] [CrossRef]
- Pérez, P.; de los Campos, G. Genome-Wide Regression and Prediction with the BGLR Statistical Package. Genetics 2014, 198, 483–495. [Google Scholar] [CrossRef] [PubMed]
- Ambroise, C.; Dehman, A.; Neuvial, P.; Rigaill, G.; Vialaneix, N. Adjacency-Constrained Hierarchical Clustering of a Band Similarity Matrix with Application to Genomics. Algorithms Mol. Biol. 2019, 14, 22. [Google Scholar] [CrossRef] [PubMed]
- Kaylegian, K.E.; Houghton, G.E.; Lynch, J.M.; Fleming, J.R.; Barbano, D.M. Calibration of Infrared Milk Analyzers: Modified Milk Versus Producer Milk1. J. Dairy Sci. 2006, 89, 2817–2832. [Google Scholar] [CrossRef]
- Kaylegian, K.E.; Dwyer, D.A.; Lynch, J.M.; Bauman, D.E.; Fleming, J.R.; Barbano, D.M. Impact of Fatty Acid Composition on the Accuracy of Mid-Infrared Fat Analysis of Farm Milks1. J. Dairy Sci. 2009, 92, 2502–2513. [Google Scholar] [CrossRef]
- Lynch, J.M.; Barbano, D.M.; Schweisthal, M.; Fleming, J.R. Precalibration Evaluation Procedures for Mid-Infrared Milk Analyzers. J. Dairy Sci. 2006, 89, 2761–2774. [Google Scholar] [CrossRef]
- Karoui, R.; Hammami, M.; Rouissi, H.; Blecker, C. Mid Infrared and Fluorescence Spectroscopies Coupled with Factorial Discriminant Analysis Technique to Identify Sheep Milk from Different Feeding Systems. Food Chem. 2011, 127, 743–748. [Google Scholar] [CrossRef] [PubMed]
- Bittante, G.; Cipolat-Gotet, C. Direct and Indirect Predictions of Enteric Methane Daily Production, Yield, and Intensity per Unit of Milk and Cheese, from Fatty Acids and Milk Fourier-Transform Infrared Spectra. J. Dairy Sci. 2018, 101, 7219–7235. [Google Scholar] [CrossRef]
- Franzoi, M.; Niero, G.; Penasa, M.; De Marchi, M. Development of Infrared Prediction Models for Diffusible and Micellar Minerals in Bovine Milk. Animals 2019, 9, 430. [Google Scholar] [CrossRef]
- Christophe, O.S.; Grelet, C.; Bertozzi, C.; Veselko, D.; Lecomte, C.; Höeckels, P.; Werner, A.; Auer, F.-J.; Gengler, N.; Dehareng, F.; et al. Multiple Breeds and Countries’ Predictions of Mineral Contents in Milk from Milk Mid-Infrared Spectrometry. Foods 2021, 10, 2235. [Google Scholar] [CrossRef]
- Pinto, P.A.; Anconi, A.C.S.A.; de Abreu, L.R.; Magalhães, E.J.; Nunes, C.A. Strategies to Determine Lactose in Cow Milk by Mid Infrared Spectroscopy. J. Food Compos. Anal. 2021, 104, 104176. [Google Scholar] [CrossRef]
- de Roos, A.P.W.; van den Bijgaart, H.J.C.M.; Hørlyk, J.; de Jong, G. Screening for Subclinical Ketosis in Dairy Cattle by Fourier Transform Infrared Spectrometry. J. Dairy Sci. 2007, 90, 1761–1766. [Google Scholar] [CrossRef] [PubMed] [Green Version]
- Denholm, S.J.; Brand, W.; Mitchell, A.P.; Wells, A.T.; Krzyzelewski, T.; Smith, S.L.; Wall, E.; Coffey, M.P. Predicting Bovine Tuberculosis Status of Dairy Cows from Mid-Infrared Spectral Data of Milk Using Deep Learning. J. Dairy Sci. 2020, 103, 9355–9367. [Google Scholar] [CrossRef]
- Mensching, A.; Zschiesche, M.; Hummel, J.; Grelet, C.; Gengler, N.; Dänicke, S.; Sharifi, A.R. Development of a Subacute Ruminal Acidosis Risk Score and Its Prediction Using Milk Mid-Infrared Spectra in Early-Lactation Cows. J. Dairy Sci. 2021, 104, 4615–4634. [Google Scholar] [CrossRef]
- Shetty, N.; Løvendahl, P.; Lund, M.S.; Buitenhuis, A.J. Prediction and Validation of Residual Feed Intake and Dry Matter Intake in Danish Lactating Dairy Cows Using Mid-Infrared Spectroscopy of Milk. J. Dairy Sci. 2017, 100, 253–264. [Google Scholar] [CrossRef] [PubMed]
- Tedde, A.; Grelet, C.; Ho, P.N.; Pryce, J.E.; Hailemariam, D.; Wang, Z.; Plastow, G.; Gengler, N.; Froidmont, E.; Dehareng, F.; et al. Multiple Country Approach to Improve the Test-Day Prediction of Dairy Cows’ Dry Matter Intake. Animals 2021, 11, 1316. [Google Scholar] [CrossRef] [PubMed]
- Shadpour, S.; Chud, T.C.S.; Hailemariam, D.; Oliveira, H.R.; Plastow, G.; Stothard, P.; Lassen, J.; Baldwin, R.; Miglior, F.; Baes, C.F.; et al. Predicting Dry Matter Intake in Canadian Holstein Dairy Cattle Using Milk Mid-Infrared Reflectance Spectroscopy and Other Commonly Available Predictors via Artificial Neural Networks. J. Dairy Sci. 2022, 105, 8257–8271. [Google Scholar] [CrossRef]
- Tedde, A.; Grelet, C.; Ho, P.N.; Pryce, J.E.; Hailemariam, D.; Wang, Z.; Plastow, G.; Gengler, N.; Brostaux, Y.; Froidmont, E.; et al. Validation of Dairy Cow Bodyweight Prediction Using Traits Easily Recorded by Dairy Herd Improvement Organizations and Its Potential Improvement Using Feature Selection Algorithms. Animals 2021, 11, 1288. [Google Scholar] [CrossRef] [PubMed]
- Zhang, L.; Tedde, A.; Ho, P.; Grelet, C.; Dehareng, F.; Froidmont, E.; Gengler, N.; Brostaux, Y.; Hailemariam, D.; Pryce, J.; et al. Mining Data from Milk Mid-Infrared Spectroscopy and Animal Characteristics to Improve the Prediction of Dairy Cow’s Liveweight Using Feature Selection Algorithms Based on Partial Least Squares and Elastic Net Regressions. Comput. Electron. Agric. 2021, 184, 106106. [Google Scholar] [CrossRef]
- Mesgaran, S.D. The Use of Milk Fourier Transform Mid-Infrared Spectra and Milk Yield to Estimate Heat Production as a Measure of Efficiency of Dairy Cows. J. Anim. Sci. Biotechnol. 2020, 11, 43. [Google Scholar] [CrossRef]
- Baba, T.; Pegolo, S.; Mota, L.F.M.; Peñagaricano, F.; Bittante, G.; Cecchinato, A.; Morota, G. Integrating Genomic and Infrared Spectral Data Improves the Prediction of Milk Protein Composition in Dairy Cattle. Genet. Sel. Evol. 2021, 53, 29. [Google Scholar] [CrossRef]
- van den Berg, I.; Ho, P.N.; Luke, T.D.W.; Haile-Mariam, M.; Bolormaa, S.; Pryce, J.E. The Use of Milk Mid-Infrared Spectroscopy to Improve Genomic Prediction Accuracy of Serum Biomarkers. J. Dairy Sci. 2021, 104, 2008–2017. [Google Scholar] [CrossRef] [PubMed]
- van den Berg, I.; Ho, P.N.; Nguyen, T.V.; Haile-Mariam, M.; Luke, T.D.W.; Pryce, J.E. Using Mid-Infrared Spectroscopy to Increase GWAS Power to Detect QTL Associated with Blood Urea Nitrogen. Genet. Sel. Evol. 2022, 54, 27. [Google Scholar] [CrossRef] [PubMed]
- Friedrichs, P.; Bastin, C.; Dehareng, F.; Wickham, B.; Massart, X. Final OptiMIR Scientific and Expert Meeting: From Milk Analysis to Advisory Tools (Palais Des Congrès, Namur, Belgium, 16–17 April 2015). Biotechnol. Agron. Soc. Environ. 2015, 28, 97–124. [Google Scholar]
- Tiplady, K.M.; Sherlock, R.G.; Littlejohn, M.D.; Pryce, J.E.; Davis, S.R.; Garrick, D.J.; Spelman, R.J.; Harris, B.L. Strategies for Noise Reduction and Standardization of Milk Mid-Infrared Spectra from Dairy Cattle. J. Dairy Sci. 2019, 102, 6357–6372. [Google Scholar] [CrossRef]
- Shin, S.; Lee, Y.; Kim, S.; Choi, S.; Kim, J.G.; Lee, K. Rapid and Non-Destructive Spectroscopic Method for Classifying Beef Freshness Using a Deep Spectral Network Fused with Myoglobin Information. Food Chem 2021, 352, 129329. [Google Scholar] [CrossRef]
- Marti, C.F.; Funk, D.A. Relationship between Production and Days Open at Different Levels of Herd Production. J. Dairy Sci. 1994, 77, 1682–1690. [Google Scholar] [CrossRef] [PubMed]
- Eicker, S.W.; Gröhn, Y.T.; Hertl, J.A. The Association between Cumulative Milk Yield, Days Open, and Days to First Breeding in New York Holstein Cows. J. Dairy Sci. 1996, 79, 235–241. [Google Scholar] [CrossRef]


| Items | Samples | Mean | SD | CV | Min | Max |
|---|---|---|---|---|---|---|
| Yield, kg/d | 3712 | 40.3 | 10.9 | 27.11% | 5.2 | 79.3 |
| Fat, % | 3764 | 3.94 | 0.84 | 21.20% | 1.50 | 7.83 |
| Protein, % | 3769 | 3.18 | 0.38 | 11.92% | 2.06 | 5.31 |
| Lactose, % | 3769 | 5.23 | 0.23 | 4.38% | 4.08 | 5.90 |
| TS, % | 3766 | 13.09 | 1.07 | 8.21% | 9.74 | 17.56 |
| SCS, log2(SCC/100) + 3 | 3767 | 2.14 | 1.67 | 77.85% | −3.64 | 6.32 |
| Urea, mg/100 g | 3765 | 13.2 | 3.5 | 26.60% | 2.9 | 46.8 |
| SnF, % | 2743 | 9.04 | 0.43 | 4.74% | 7.02 | 11.00 |
| DO, d | 3771 | 105.1 | 57.2 | 54.41% | 27 | 396 |
| Items | Events | Median | 0.95 LCL | 0.95 UCL |
|---|---|---|---|---|
| Parity | ||||
| 1 | 869 | 69.0 | 68 | 76 |
| 2 | 726 | 77.0 | 69 | 88 |
| 3 | 380 | 69.5 | 67 | 89 |
| ≥4 | 282 | 67.0 | 66 | 70 |
| Calving Season | ||||
| Spring | 439 | 103 | 88 | 110 |
| Summer | 593 | 91 | 84 | 97 |
| Autumn | 767 | 67 | 66 | 67 |
| Winter | 458 | 68 | 67 | 70 |
| Window | Lower (cm−1) | Upper (cm−1) | NW | Window | Lower (cm−1) | Upper (cm−1) | NW |
|---|---|---|---|---|---|---|---|
| 1 | 925.66 | 975.80 | 14 | 22 | 2973.69 | 2977.55 | 2 |
| 2 | 979.66 | 1006.66 | 8 | 23 | 2981.40 | 3035.40 | 15 |
| 3 | 1010.51 | 1087.65 | 21 | 24 | 3039.26 | 3066.26 | 8 |
| 4 | 1091.51 | 1137.79 | 13 | 25 | 3070.11 | 3108.68 | 11 |
| 5 | 1141.65 | 1203.36 | 17 | 26 | 3112.54 | 3135.68 | 7 |
| 6 | 1207.22 | 1261.21 | 15 | 27 | 3139.54 | 3185.82 | 13 |
| 7 | 1265.07 | 1442.49 | 47 | 28 | 3189.68 | 3208.96 | 6 |
| 8 | 1446.35 | 1473.34 | 8 | 29 | 3212.82 | 3232.10 | 6 |
| 9 | 1477.20 | 1500.34 | 7 | 30 | 3235.96 | 3278.39 | 12 |
| 10 | 1504.20 | 1573.62 | 19 | 31 | 3282.24 | 3305.39 | 7 |
| 11 | 1577.48 | 1612.19 | 10 | 32 | 3309.24 | 3336.24 | 8 |
| 12 | 1616.05 | 1627.62 | 4 | 33 | 3340.10 | 3363.24 | 7 |
| 13 | 1631.48 | 1662.33 | 9 | 34 | 3367.10 | 3397.95 | 9 |
| 14 | 1666.19 | 1681.62 | 5 | 35 | 3401.81 | 3421.09 | 6 |
| 15 | 1685.48 | 1720.19 | 10 | 36 | 3424.95 | 3451.95 | 8 |
| 16 | 1724.04 | 1770.33 | 13 | 37 | 3455.81 | 3494.38 | 11 |
| 17 | 1774.18 | 2318.01 | 142 | 38 | 3498.23 | 3540.66 | 12 |
| 18 | 2321.87 | 2464.58 | 38 | 39 | 3544.52 | 3579.23 | 10 |
| 19 | 2468.43 | 2599.57 | 35 | 40 | 3583.09 | 3637.08 | 15 |
| 20 | 2603.43 | 2830.98 | 60 | 41 | 3640.94 | 3667.94 | 8 |
| 21 | 2834.84 | 2969.83 | 36 | 42 | 3671.79 | 5010.15 | 348 |
Disclaimer/Publisher’s Note: The statements, opinions and data contained in all publications are solely those of the individual author(s) and contributor(s) and not of MDPI and/or the editor(s). MDPI and/or the editor(s) disclaim responsibility for any injury to people or property resulting from any ideas, methods, instructions or products referred to in the content. |
© 2023 by the authors. Licensee MDPI, Basel, Switzerland. This article is an open access article distributed under the terms and conditions of the Creative Commons Attribution (CC BY) license (https://creativecommons.org/licenses/by/4.0/).
Share and Cite
Nan, L.; Du, C.; Fan, Y.; Liu, W.; Luo, X.; Wang, H.; Ding, L.; Zhang, Y.; Chu, C.; Li, C.; et al. Association between Days Open and Parity, Calving Season or Milk Spectral Data. Animals 2023, 13, 509. https://doi.org/10.3390/ani13030509
Nan L, Du C, Fan Y, Liu W, Luo X, Wang H, Ding L, Zhang Y, Chu C, Li C, et al. Association between Days Open and Parity, Calving Season or Milk Spectral Data. Animals. 2023; 13(3):509. https://doi.org/10.3390/ani13030509
Chicago/Turabian StyleNan, Liangkang, Chao Du, Yikai Fan, Wenju Liu, Xuelu Luo, Haitong Wang, Lei Ding, Yi Zhang, Chu Chu, Chunfang Li, and et al. 2023. "Association between Days Open and Parity, Calving Season or Milk Spectral Data" Animals 13, no. 3: 509. https://doi.org/10.3390/ani13030509