1. Introduction
The Murciano-Granadina (M-G) is one of the most popular goat breeds in Spain. It has a great distribution abroad too, exporting animals to Europe, Africa and South America [
1]. In Spain, the number census has been estimated around 500,000 animals that are distributed throughout the country, though mainly in Andalusia, Murcia and Castile-La Mancha [
2]. This breed, which owes its name to the provinces of its origin in Spain (Murcia and Granada), is made up of dairy goats with a black or auburn coat and a height of about 70–77 cm [
3]. It is easily adapted to different types of management and production, being able to develop optimally both in more intensive and technical systems as well as extensive and ecological ones [
4]. On the other hand, animals of the M-G breed can be kept in production in very extreme conditions, from dry and hot climates to cold and mountainous ones [
2].
Depending on the estrous cyclicity that they present, goats can be considered similar to seasonal polyestrous breeders with short days [
5]. In this way, it is known that goats present their sexual activity in intervals of several heats (of 21 days) in a row, which take place at the time of year when there is a decreasing photoperiod. This reproductive activity changes depending on environmental and physiological factors (latitude, climate, food availability, breed and husbandry systems) [
6]. However, the variations of the photoperiod are the most decisive influence on reproduction for this species. Thus, there are animals that, raised in areas whose latitude is closer to the equator, experience fewer changes in photoperiod and temperature, so they show a longer breeding season than those goats raised in temperate climates and polar regions [
7]. Therefore, in the case of the M-G breed, there is no seasonal anestrus. Temperatures and photoperiod in the southern latitudes of the Iberian Peninsula (36–38° N) allow bucks to have a high libido, and goats to are able to react to them without the need for hormonal treatments to control their photoperiod [
8].
For greater economic performance, farmers prefer to group the births of goats at the end of summer and in autumn, since this time coincides with the highest milk prices as well as the sale of kids between September and December, although it does not correspond to the reproductive seasonality of the goat [
4]. The M-G breed generally gives birth once a year, having an average of 1.9 kids in each birth. It may range from one to two kids and can even reach up to five or six, although in this case, special care is required in goats. The first mating of goats usually occurs between six and eight months of age [
4].
As previously mentioned, mating is usually scheduled to group births at the most favorable moment of the year from an economic point of view. For this, different reproductive methodologies are carried out for the synchronization of estrus in females, either non-hormonal such as the male or female effect (very marked in this species) or hormonal methods [
4]. Vaginal devices impregnated with progestogens have been commonly used in hormonal synchronization. In addition of the traditional sponges, newer progestogen-releasing devices such as CIDR
® have been used, followed by injections of equine chorionic gonadotropin (eCG) [
9]. Progestogens would have an inhibitory effect on the hypothalamic-pituitary-gonadal axis, and eCG would have a FSH-like activity, causing folliculogenesis in the ovary. Therefore, when progestogen is removed, there should be a well-developed follicle ready to ovulate [
10]. Single or double injections of PGF2α have also been employed to induce luteolysis [
9]. The administration of GnRH or its analogs produced a quick increase in the concentration of gonadotropins, which led to the discharge of LH with the end of follicular growth, and lastly, the ovulation [
11].
These methods of estrous synchronization lead to a control of the timing of pregnancies and births of our animals in order to facilitate productive management. For this, different practices have been developed to optimize the production and profitability of livestock, such as early pregnancy diagnoses. These groups of techniques allow to identify early and separate pregnant and non-pregnant animals, and act consequently [
12]. There are various tools for the early diagnosis of pregnancy in goats; however, not everyone achieves a level of sensitivity, accuracy, speed, security, simplicity and low cost. The development of ultrasonography has become one of the best available technologies for early pregnancy diagnosis [
13]. In this way, it not only allows the early checking of the presence of embryo vesicles in the uterus that confirm the pregnancy of the animal, but also offers the opportunity to check the number of fetuses to improve care and feeding if necessary [
12].
The B-mode of real-time ultrasonography is a non-invasive, simple, fast and accurate method for the diagnosis of pregnancy in small ruminants on the farm. In addition, it makes possible the study of the pregnancy evolution over time, through the generation of digital images in a gray scale [
14].
The ultrasound study has many applications in veterinary medicine, but it is especially interesting in the pregnancy study of animals. One of the most recurrent and researched uses for a long time is the study of the evolution of fetuses throughout pregnancy [
15]. The use of B-mode ultrasonography has been established as a good biometric and fetal morphology assessment system. It can correlate several parameters studied with pregnancy age, which allows the prediction of the gestational age of the animal [
16]. Several fetal growth parameters have been studied over time, which have shown to have a high correlation with pregnancy age: biparietal diameter, trunk diameter, crown-rump length, eye orbit diameter, cardiac axis length or femur length, among others [
17,
18,
19]. However, the fetal measurements that have been studied may be linked to the breed, so there would be variability in the data between them. This is why it is difficult to extrapolate the data from the studies between different breeds to predict more or less accurately the pregnancy age or the days to delivery (for example, the differences in fetal growth rates between European and Asian races) [
20].
Ultrasound resources have developed in order to fit to investigation needs, for instance, Doppler ultrasound [
21]. The Doppler effect in ultrasound is based on the fact that when ultrasound waves collide with moving structures, the frequency of the reflected waves is different from the emitted ones, unlike when these waves collide with static surfaces, whose reflection is the same that the emitted ones by the transducer. The Doppler effect is proportional to the speed of movement of the reflecting surface [
22]. In the case of ultrasonography, the moving structures that are analyzed are the cells that circulate through the blood vessels. Therefore, there will be positive parameters if the frequency of the reflected waves is higher than those emitted when the blood cells move towards the transducer and negative if the cells move away from the transducer, so the frequency of the reflected waves is lower than those emitted [
23].
Doppler can be continuous, without discriminating between depth field, and pulsed-wave, in which the depth of the studied field can be selected. On the other hand, three ways have been described to represent the Doppler signal: Color Doppler allows us to see the change in Doppler frequency in a red-blue color scale depending on the flow direction (red if it approaches the transducer and blue if it moves away). Power Doppler indicates the presence of flow in a structure more sensitively than color Doppler, without providing information on the speed or direction of the flow. Finally, spectral Doppler analyzes the velocity of the vessel flow in a specific period of time, showing a wave that represents the hemodynamics of the blood vessel [
24].
Doppler technology in ultrasonography makes it possible to study the vascular system of animals, in addition to some pathological processes such as cancer, edema or injuries recovery. This system is quite quiescent, except for the ovary and pregnancy-related vascular changes [
25]. Vessel flows such as uteroplacental arteries, umbilical cord, aorta, caudal vena cava and fetal venous ductus have been investigated by Doppler technology [
21]. Ultrasound analysis using Doppler technology has not been extensively studied in the goat species, as well as Doppler parameters in abnormal pregnancies [
26]. In small ruminants, Doppler ultrasound study of the waveforms in umbilical artery blood flow may have been performed in order to identify fetuses that may require monitoring during pregnancy or planning for delivery. On the other hand, the umbilical artery pulsations have been widely used as a marker of cardiac functionality as well as fetal health and development [
27].
The umbilical cord in small ruminants is described as floating in the amniotic fluid that surrounds the fetus, and it is formed by a bundle of blood vessels made up of two arteries and two umbilical veins arranged in a characteristic spiral position [
28]. The umbilical cord connects the growing fetus with the maternal placenta. It transports oxygenated blood and nutrients from the mother through the umbilical veins and removes waste materials and deoxygenated blood for elimination, so the fetal metabolism is assisted [
29]. Studies have determined that the vascular system in the umbilical cord adapts to hemodynamic changes to ensure a blood supply for the developing placenta and fetus [
26].
In order to study the correct placental function and the well-being of the fetus, a series of parameters have been analyzed by Doppler ultrasonography. These parameters provide information on the optimal course of pregnancy [
30]. Initially, the study of blood flow in the umbilical vessels relied on invasive Doppler measurements of the cord. However, the development and refinement of color Doppler ultrasonography techniques has allowed the non-invasive study of blood flow [
28]. The main Doppler parameters of blood flow studied are as follows: Arterial Pulse (AP), Peak Systolic Velocity (PSV), End Diastolic Velocity (EDV), Mean Velocity (MV), the Systolic velocity/Diastolic velocity ratio (S/D), Resistance Index (RI) and Pulsatility Index (PI). PSV is the maximum velocity of blood flow through the lumen of the examined vessel in one systole. EDV represents the blood velocity at the end of a cardiac cycle, just before systole. Finally, the MV is the speed of the blood that passes through the interior of the vessels at a specific moment [
27,
28,
31,
32,
33,
34,
35].
Because of the problems when analyzing blood flow velocity data, the indices that relate these data such as RI, PI and S/D have been used as more adjusted element [
27]. The RI is the ratio between the systolic and diastolic flow that reflects the resistance presented by the blood flow in its course through the lumen of the vessels, assuming the maximum value of the blood flow. RI has been described as being used in those vessels whose blood flow persists during diastole. The PI relates the PSV and the EDV to the MV during the cardiac cycle. It represents the speed of blood flow, suitable for vessels in which the flow is absent during diastole. Both RI and PI were influenced by heart rate and increase if blood perfusion decreases [
21,
27]. Finally, the S/D ratio is a studied measure of placental resistance in the blood flow circulation [
34].
Waveform recordings of the umbilical artery blood flow, such as vascular pulsatility and maternal-fetal vessel resistance, have been part of the routine analysis of fetal well-being, as it is largely related to some alteration in pregnancy [
21]. Nevertheless, the accuracy of Doppler measurements can sometimes be limited due to small vessels size or transducer distance [
30].
For all these reasons, the aim of this work was to study the evolution of these fetal growth rates and the hemodynamic characteristics of the umbilical artery during pregnancy. For this, in the present study, a group of goats of the M-G breed was synchronized and fetal growth rates and Doppler parameters mentioned were analyzed weekly over pregnancy, from 18- to 125-days post-mating.
2. Materials and Methods
2.1. Ethics
Through the experiments, animals were handled carefully, avoiding any unnecessary stress. All experiments were performed following relevant guidelines and regulations. The study was carried out in compliance with the ARRIVE guidelines (
https://arriveguidelines.org/, accessed on 20 January 2022).
2.2. Animals
The animals used in this study belong to Murcian Institute for Agricultural and Environmental Research and Development (IMIDA). IMIDA has a small experimental farm to carry out our research, and all the animals used were born in these facilities. All the goats used for the study were adult goats, which had calved more than once and with an average live weight of 45 kg. The animals have been subject to the sanitary hygienic program established in the Region of Murcia for goats. Initially, 13 healthy primiparous M-G goats were used in the study from February to July of 2022. These goats were located in the Veterinary Teaching Farm of the University of Murcia (Murcia, Spain, 38°0′15.3″ N, 1°10′31.3″ W). Goats were fed with 700 g of maintenance fodder per animal and hay ad libitum during the study. A supplementation of vitamins A, D3 and E (Labhidro® AD3E, Labiana, Barcelona, Spain) was also applied every 15 days. It was administered from 4 to 5 mL per animal at a concentration of: 500,000 IU/mL of vitamin A, 75,000 IU/mL of vitamin D3 and 50 mg/mL of vitamin E. On the other hand, those goats that presented pregnancies of three or more kids were also administered with a supplement of 25 mL of injectable calcium (Labiana, Barcelona, Spain) at a concentration of 216.18 mg/mL.
2.3. Synchronization and Mating
In order to facilitate the management of the animals, it was decided to carry out an estrus-synchronization treatment in the goats, so that the pregnant goats in our study could be grouped into one lot. On the first day, vaginal sponges impregnated with 0.03 g of fluorogestone acetate (Sincropart®, Ceva, Barcelona, Spain) were implanted using an applicator, leaving the cord of the sponge slightly protruding from the vulva so that it could be easily retrieved. Nine days after having applied the sponges, 2.5 mL of eCG (Foligon®, MSD, Madrid, Spain) was administered per goat at the level of the scapula at a concentration of 120 IU/mL. In addition, a dose of PGF2α (Dalmazin®, Fatro Ibérica, Barcelona, Spain) of 1 mL per goat (0.075 mg/mL) was also applied, next to the contralateral scapula. Finally, two days later, the sponges were removed from the goats.
The mating of the goats took place by natural mating. The appearance of the estrus between 36 and 48 h after the removal of the vaginal sponges was assumed. For this reason, from the afternoon following the end of the treatment, the bucks were joined with the goats, controlling those that were in estrus. That day was determined as day 0 of pregnancy. The goats were kept with the assigned buck for the following two days, controlling in each case which goats were allowed to be mounted by the bucks each day.
2.4. Ultrasonography Study
All ultrasound examinations were carried out at the facilities of the Veterinary Teaching Farm from the University of Murcia. For the ultrasound diagnoses, a General Electric Voluson® 730 PRO scanner was employed (GE Healthcare, Milwaukee, WI, USA). A sectorial abdominal transducer (2–7 MHz, mod. AB2-7) from this ultrasound device was used with an arrangement of the convex-shaped piezoelectric crystals to favor contact with the surface to be explored in the animal, as well as an intracavitary microconvex transducer aimed for endovaginal application (5–9 MHz, mod. IC5-9) (GE Healthcare, Milwaukee, WI, USA). The endovaginal transducer was used exclusively during the first six sessions, from day 18- to day-34 post-mating (dpm). The following two sessions alternated between vaginal and abdominal ultrasound (39–45 dpm). Finally, the abdominal transducer was used weekly in ultrasound examinations, from day 54 dpm, until the last examination carried out in this study (125 dpm).
To perform the ultrasound examinations, animals were placed in a supine position on a stretcher with limbs immobilized and stretched with the head and neck resting on a specific support.
In the first examinations, the endovaginal transducer was used, protected by a cover whose inner end was previously applied with an acoustic gel to allow ultrasound transmission. Before proceeding to introduce it into the goat, Vaseline was applied to lubricate the area and facilitate the introduction of the transducer. For the abdominal ultrasounds, which were carried out a few weeks later, the immobilization procedure for the animals was the same, but in this case the inguinal area close to the mammary gland was shaved with a peeler and cleaned. Subsequently, the acoustic gel was applied to the skin so that, in this way, the air that could exist between the transducer and the skin was eliminated. This way, the transmission of ultrasound through all the structures could be eased. All tests were performed without having to administer any type of sedation to the animals.
2.4.1. Fetal Growth Parameters
B-mode was performed in the ultrasound examinations for an initial search of the different structures, both with the endovaginal and abdominal transducer. This mode was used to take a series of measurements in the embryo/fetus throughout pregnancy: crown-rump length (CRL, from 24 dpm to 61 dpm), trunk diameter (TD, from 24 dpm to 34 dpm), biparietal diameter (BPD, from 28 dpm to 125 dpm) and eye orbit diameter (EOD, from 75 dpm to 125 dpm).
Crown-rump length (CRL) has been proven as a common and reliable measure to determine biometric parameters in fetuses during the first third of pregnancy [
36]. Measurements were taken from the highest part of the skull to the end of the sacrum (
Figure 1a) [
37]. On the other hand, the trunk diameter (TD) is the maximum diameter of the fetal body measured from the vertebral column to the ventral portion of the abdomen (
Figure 1b) [
19].
The biparietal diameter (BPD) is a measurement that is routinely performed in the prenatal examination of pregnancy to estimate the birth date in several goat breeds. For its measurement, a symmetrical view of the fetal skull must be obtained. When looking at the maximum oval-shaped size of the skull (looking at both eye sockets from the front), BPD was measured from one parietal end to the other (
Figure 1c) [
14]. Finally, the measurement of the eye orbit diameter (EOD) must be taken once it is observed to have a rounded shape at its maximum size, thus measuring the diameter of the circle formed (
Figure 1d) [
14].
2.4.2. Doppler Ultrasonographic Study of the Blood Flow in the Umbilical Artery
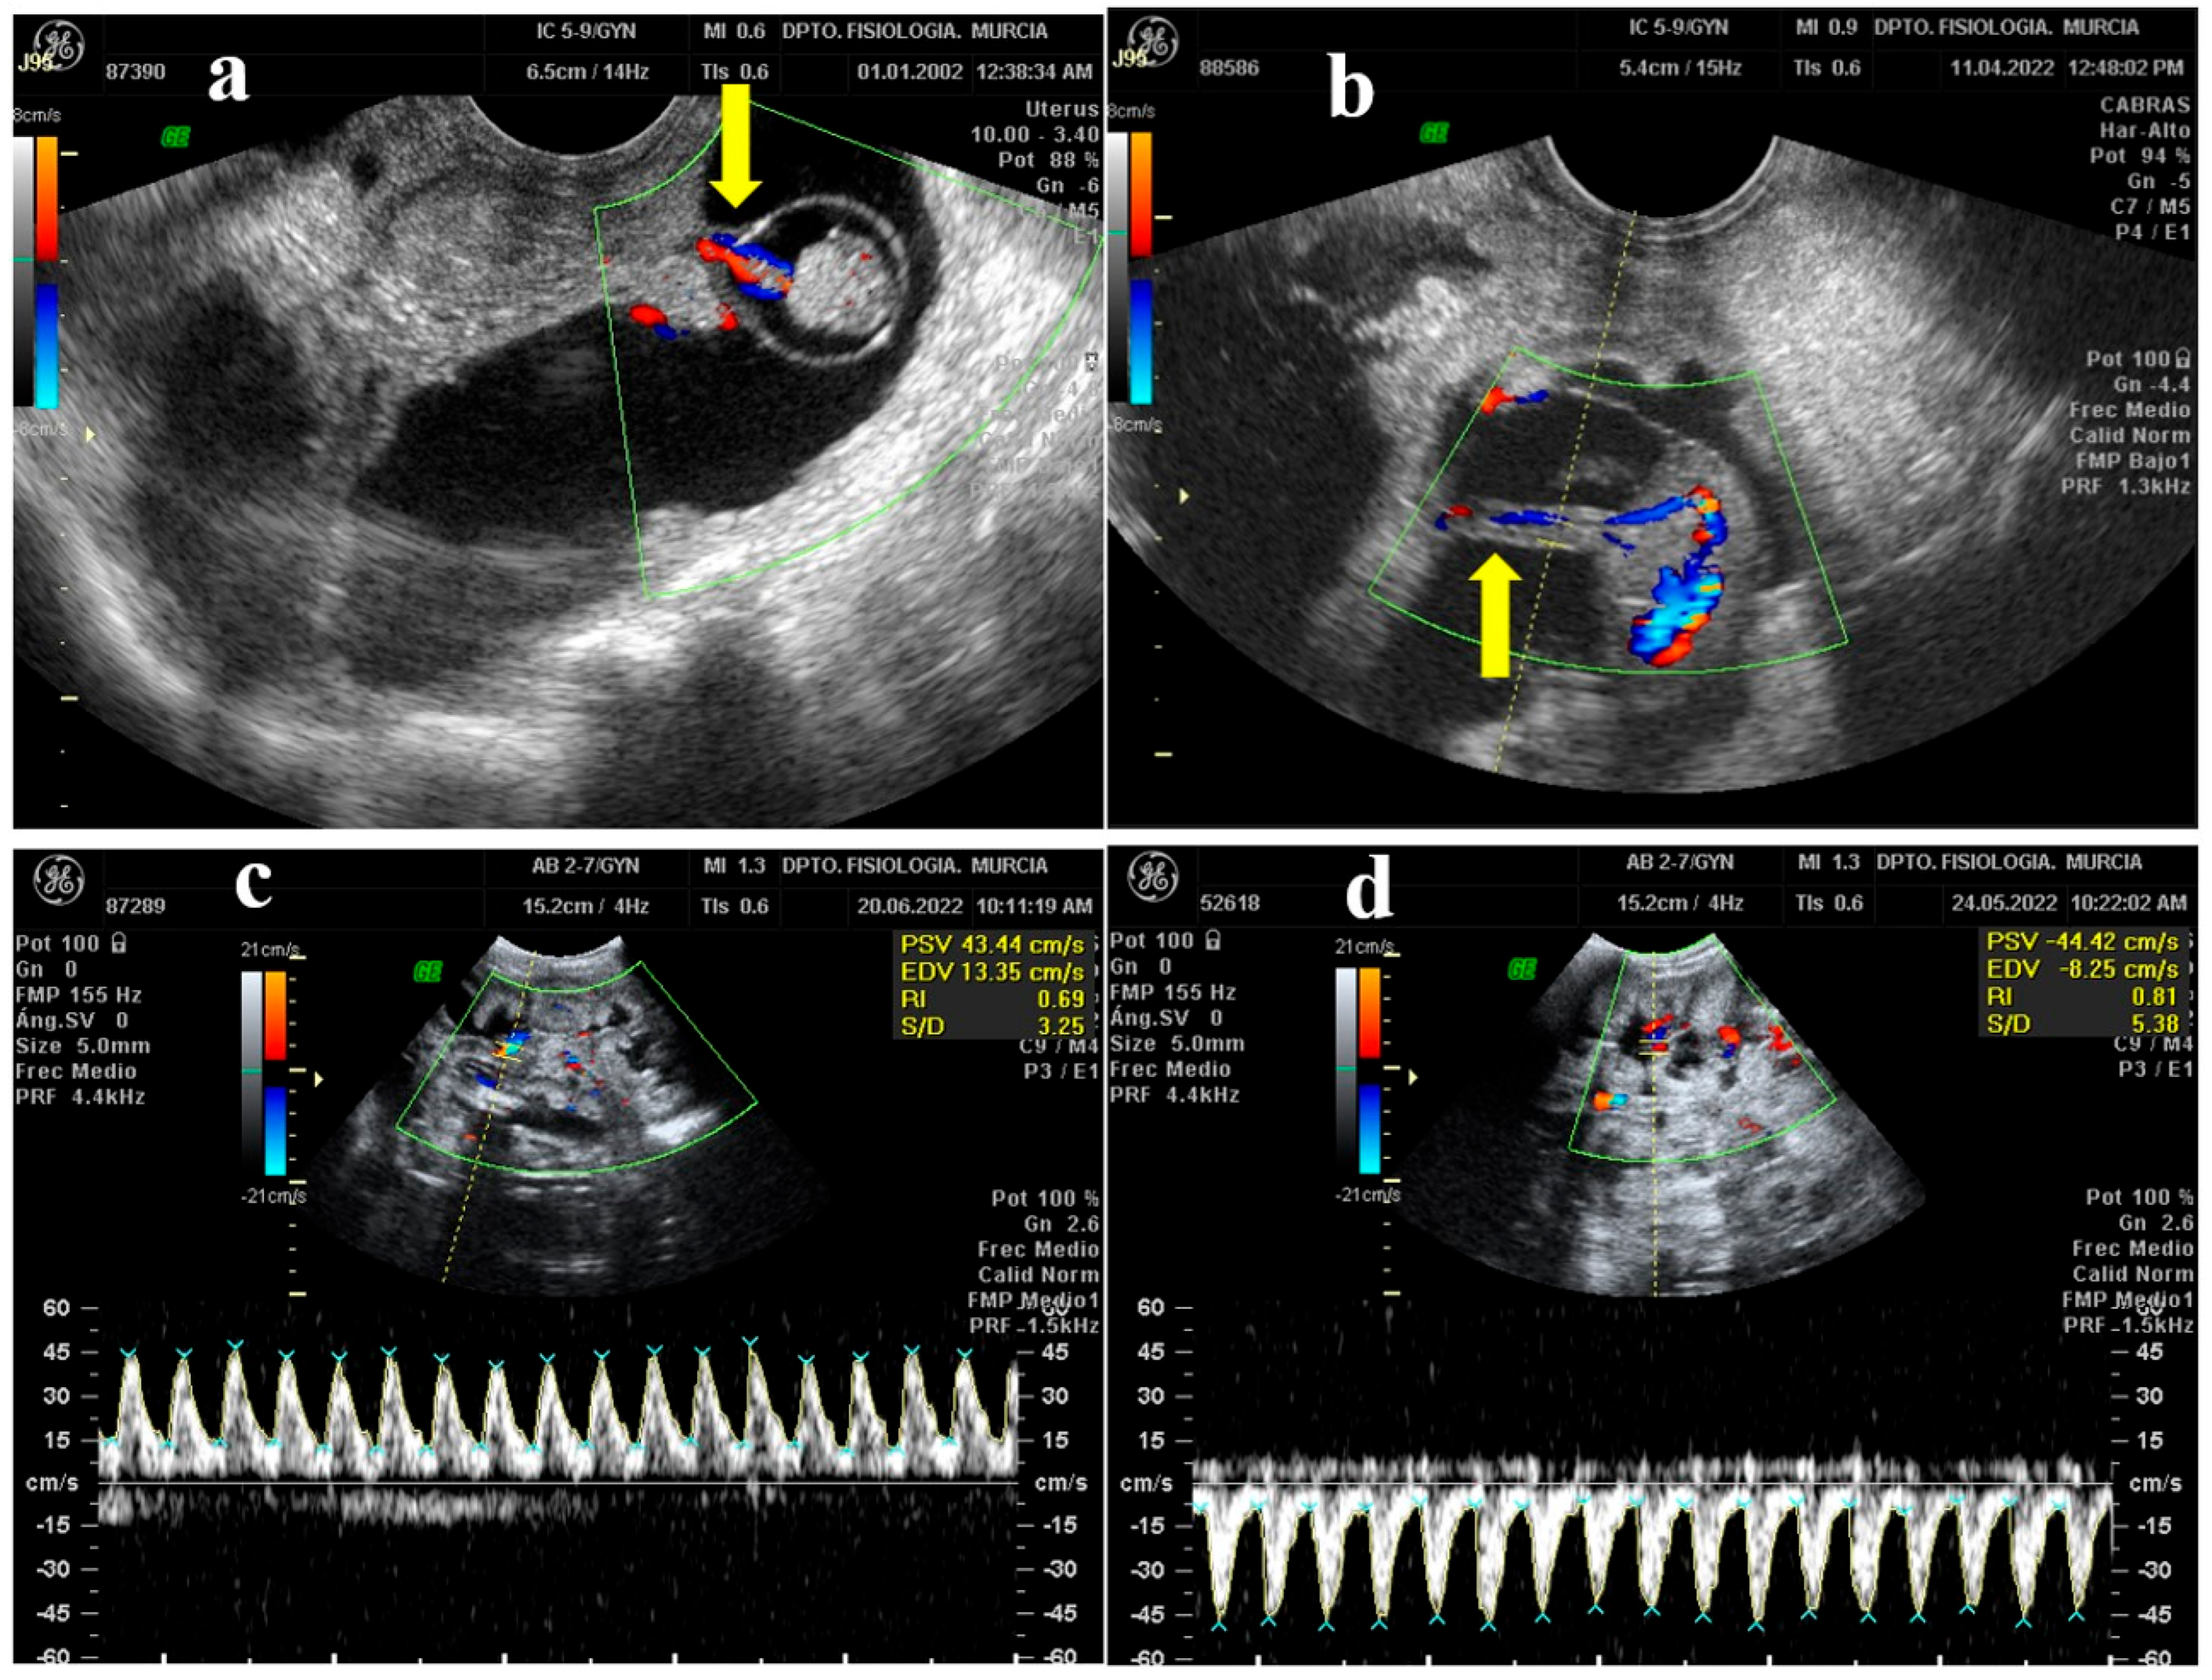
B-mode enables the capacity to study the moment in which the umbilical cord begins to be glimpsed for the first time (
Figure 2a). In the first cord sightings, a small structure was observed next to the embryo, so that it could be located with an elongated or rounded shape as the fetus grew (depending on whether the section we observed was longitudinal or transversal) and floated in the amniotic fluid.
Once the umbilical cord was found thanks to the B mode, it was verified that it was this structure using color Doppler and observing the red-blue color pattern that indicates the presence of positive or negative blood flow (
Figure 2b). Next, it was analyzed by spectral Doppler. To begin with, the Doppler caliper was placed over the umbilical artery and the examination began. The graph obtained with the spectral Doppler study on an artery showed the waveform systole and diastole for each cardiac cycle with a characteristic sawtooth shape. However, a vein gave a constant graph since it does not present a pulse pattern. Subsequently, while the graph is displayed, the ultrasound machine transforms the ultrasound into the sound of pulsations. In the case of arteries, this sound was rhythmic and pulsating, while the result of the veins was constant and without a defined pulse.
Firstly, AP measurements were recorded from 34 dpm until the end of the study, at 125 dpm. To do this, the systolic waves in 5 s marked by the spectral Doppler graph were taken and multiplied by 12 to calculate the pulsations per minute of the embryo/fetus. Secondly, umbilical cord blood flow was evaluated semi-quantitatively using Doppler indices. These are relative data obtained from the evaluated PSV and EDV measurements collected by the scanner software by which the MV was found. With these values, RI and PI can be calculated using the following equations: RI = (PSV − EDV)/PSV; PI = (PSV − EDV)/MV. Lastly, the S/D ratio was taken directly from the scanner software.
2.5. Experimental Design
A total of 13 goats were synchronized and subsequently inseminated by natural mating at the end of February (24–26 February 2022), with an average temperature and humidity during this month, of 13.1 °C and 62.6%, respectively. At 18 dpm, the first ultrasound was performed to confirm the pregnancy. Next, ultrasounds were performed every 3–4 days during the first six sessions. Subsequently, the ultrasound examinations were carried out once a week throughout the pregnancy (≈150 days), ending with the last test about 25 days before the expected date of deliveries (125 dpm in the last ultrasound) established for the last days of July. In this study, a total of 19 ultrasound sessions have been carried out for each pregnant goat.
2.6. Births
Goats were separated from the group once they gave birth. After deliveries, data were collected on the length of gestation of the goats until farrowing, the number of total kids, live births and the alive offspring percentage, as well as sex, birth weight, fetal growth and the color of the coat of the kids.
2.7. Statistical Analysis
At the end of each ultrasound examination, the images and videos obtained were collected for the data collection of each session. The collected data were subsequently reviewed, discarding those that did not provide sufficient information or were irregular because they had been taken during maternal and/or fetal movements. Next, the results corresponding to the different parameters analyzed were recorded in Excel sheets for their subsequent statistical treatment.
Statistical analysis was performed using the SPSS v.25 for Windows (IMB SPSS, Chicago, IL, USA). Data were represented by mean ± standard deviation. The different parameters were analyzed using a Shapiro–Wilk normality test. The data showed a normal distribution, so they were analyzed using an analysis of variance (ANOVA). When the data showed significant differences (p < 0.05), the values were compared between pairs using a post hoc test (Tukey).
4. Discussion
This is the first time that a detailed study of fetal growth indices and umbilical artery flow rates in fetuses from M-G goats has been performed throughout virtually the entire duration of gestation.
In the first place, the results obtained from estrus synchronization indicated that the protocol used, which is one of the most widely used, left too wide a range in the hours after sponge removal in which the goats were in estrus. It has been described that, after the end of the synchronization treatment, goats usually come into heat at approximately 36 h [
38]. However, a broader range was obtained in our study, covering the appearance of estrus from 36 to 72 h after the removal of sponges. In our case, this did not cause a decrease in female fertility rates because each male was left several days with a small group of goats to cover them at the time of the estrus. However, in the case of carrying out artificial insemination at a fixed time, for example, 50 h after sponge removal, as verified by López-Sebastian et al. [
39], and as usually happens in the reproductive management of farms, it could be possible to find very early ovulations where the oocyte would be too old when it is inseminated or that the semen remains too long in the reproductive tract of the goat waiting for ovulation.
In our study, a series of fetal growth signal indices were obtained in the M-G goat that could serve as a reference when studying fetal growth, or to identify the gestational age of an animal whose insemination date/covering is unknown. For this, the fetal growth indices CRL, TD, BPD and EOD were analyzed.
CRL measurements were taken between 24 and 61 dpm, as has been reported in other studies in Bulgarian goats [
36] and in Egyptian goats [
19] in which this parameter was mainly collected around the first trimester of pregnancy, since at this moment it is possible to easily distinguish both ends of the fetus. In the same way, during the remaining two thirds of the gestation, it was not possible to evaluate this measurement due to the difficulty of its complete visualization in the ultrasound image linked to the increase in the size of the fetus. In the case of Karen et al. [
19], the ultrasound study of the CRL was extended until 70 days of gestation, but from this moment they could no longer collect any more measurements. Regarding the differences in the values registered between breeds, the studies carried out in Egyptian goats [
19,
37] and Bulgarian goats [
36] showed that there are no large interracial differences for this parameter.
Nevertheless, in the case of TD measurements, while in our case they were analyzed from 24 to 34 dpm, other studies indicate that the period in which this measurement was taken was between days 39 and 85 of pregnancy approximately [
20]. This fact is repeated both in the studies reported by the groups of Lee et al. [
18] and Karadaev et al. [
36], in which these data have been recorded for the TD from 60 to 135 days of gestation in the first case and from 25 to 133 days of gestation in the second, assuming in the latter study that it was possible to take the measurement for a longer time. Observing the differences between breeds, it could be assumed that for the same gestational age there was a greater fetal development in crossbred Saanen [
20] and Egyptian [
19] goats than in black Korean [
18] and Bulgarian goats [
36]. However, these data cannot be associated with those obtained in our study, since the measurements were taken mainly on gestational days after ours. Comparing all these data, and despite the statistical association of our results, results of fetal TD measurements in our study should be taken with caution and future analysis of this parameter over a longer gestational period should be carried out.
Regarding the other fetal growth indices, the measurement that was taken in our study for the longest time during pregnancy was BPD, which coincides with other studies in which this parameter was established as one of the most easily detectable during a longer pregnancy period [
18,
19,
40]. Comparing the same days of gestational age, the M-G goat in our study presented similar measurements to Egyptian [
37] and Nubian [
17] goats, while this parameter was above the average in black Korean [
18], Angora [
17] and Saanen [
16], and below breeds such as Toggenburg [
17].
Finally, EOD is a fetal growth index that was measured from 75 to 125 dpm in our study, although the data reported by Karadaev et al. [
36] in Bulgarian goats and the group of Yazici et al. [
40] in the Saanen breed indicated that EOD measurements could be started from an earlier age (49 and 44 days of pregnancy, respectively), approximately one or two weeks after the measure of BPD began, since it was when the cranial structures could be identified with greater precision. It was noticed that EOD is a good way of fetal measurement, since it was possible to identify the fetal eye orbit for the first time by ultrasonography (which appears as an anechoic circumference in the skull). It was relatively easy to find and measure this orbital structure on successive ultrasound examinations. This is something that was also reported by other groups such as Lee et al. [
18], where a high correlation was found between this measure of fetal growth and gestational age.
In our study, the umbilical cord could be observed for the first time in goats between 32 and 35 dpm, which coincides with other studies where it has been identified between 28 and 35 dpm [
16,
19]. The AP during the first weeks showed unclear values. Firstly, the mean pulse increased, coinciding with the increase in fetal heart rate as the organ developed, and continued by falling after approximately two months of pregnancy. From this moment on, how the beats per minute fell progressively as the fetus grew (
p < 0.01,
Table 2) was observed.
Regarding the results obtained from umbilical artery flow using Doppler ultrasonography, in this study the velocimetric data of both PSV, EDV and MV experienced a significant increase (
p < 0.01) throughout pregnancy (
Table 2); thus, it was stated that the speed of blood flow increases as the fetus develops. The data recorded for PSV initially on day 45 of pregnancy and those for EDV and MV on day 68 agreed with the results reported by Kumar et al. [
26], who recorded the first PSV data on day 39 of pregnancy and did not obtain the first EDV data, and therefore MV, until 67 days of gestation. In the records taken by Elmetwally and Meinecke–Tillmann [
28], EDV was not measured until the 12th week of pregnancy, for which they proposed that it was able to be associated with the regulation of fetal cardiac cycles and the decrease in heart rate. The explanation for these results could be that, in the early stages of pregnancy, the vascular development at the level of elasticity in the umbilical arteries does not allow a correct recording of blood flow at the diastolic level, and it is from approximately at 2.5 months of pregnancy when these vessels have already acquired enough elasticity so that all the velocimetric parameters and Doppler indices can be determined properly and significantly. Throughout pregnancy, there was a progressive increase in diastolic velocity in the umbilical circulation, leading to a decrease in RI, PI and S/D ratio. This increase in EDV was associated with increased vascularization and decreased vascular resistance in the fetoplacental circulation [
35].
As these indicator values of blood flow velocity were not very explanatory by themselves, the different Doppler indices were obtained to correlate and interpret them [
27]. Our results with the Doppler indices of RI, PI and S/D indicate that all of them presented a pattern of decrease as the gestation progressed. This correlation was also observed by Irion and Clark [
32], who also demonstrated the presence of a statistical relationship between these parameters in their study carried out in sheep fetuses. Firstly, the S/D ratio decreased throughout the gestation, agreeing with the increase in the size of the fetus and the fall in its AP, a fact that was also reflected by Wright and Ridgway [
34] in their study in which they demonstrated a correlation between the drop in the S/D ratio and fetal heart rate. The decrease in PI values recorded in our study presented significant differences, as also reflected in the data provided by Martínez–Díaz et al. [
27].
The study on the pulsatility of the umbilical artery carried out by Surat and Adamson [
35] indicated a correlation between the vascular walls and the vascular resistance of the placenta on this parameter. In case of normal placental resistance, it is the radius of the vessel that is the most important parameter. Therefore, in the earliest stages of gestation from our study, proper EDV recordings were unable to be obtained due to the size of the vascular radius and the elasticity of the artery walls. This is because, as the fetal size increases, the arteries develop greater vascular musculature that decreases their radius and results in a progressive decrease in PI, like that obtained in our study [
35]. Such as in other studies [
21,
27], the RI values in our study decreased progressively and significantly throughout pregnancy. This could be caused by the increased requirements of the fetus due to its rapid growth. In this way, the decrease in the resistance of the umbilical vessels is favored to increase the blood flow of the umbilical cord.
The application of all these analyses of umbilical blood flow can be seen, for instance, in the association that has been demonstrated between the resistance of the umbilical artery determined by Doppler, with intrauterine growth retardation, congenital anomalies and other adverse results in the fetus. The finding of absent or reverse blood flow during umbilical artery systole is a late sign of increased placental vascular resistance [
21].
On the other hand, umbilical blood flow is associated with the size of the fetoplacental vascular bed (this one related to fetal size) and with the S/D ratio. This relationship can help us to detect abnormalities in size or function in the fetoplacental vascularization, beyond alterations that occur strictly in the umbilical cord. In the event of a vascular compromise in the fetus, there would be a redistribution of cardiac output focused towards different organs, which could be reflected when analyzing the different Doppler indices of the arterial flow of the umbilical cord [
32]. In the human species, the Doppler velocimetric study of the umbilical artery has also been found to be correlated with abnormalities in fetal growth, assuming an effective technique to reduce perinatal deaths associated with fetal growth restriction [
41].
Finally, in regard to the births of kids, multiple pregnancies could be related to the greater difficulty in maintaining the pregnancy and, therefore, an increased risk of miscarriage or birth and death postpartum. It should also be considered that the animals were not in the best seasonal conditions, since they were being born at the time of year with higher temperatures. Finally, it would be necessary to indicate the relationship between the days of gestation of the goats and the number of fetuses since it was observed that the greater the number of pregnant children, the shorter the pregnancy, in comparison with those pregnant goats with fewer kids.

 and
and 


