Simple Summary
The study evaluated the mutation effects of BSCL2 variants on slaughter and fattening characteristics and meat quality traits. These mutations were selected based on variant calling analysis and χ test results within subcutaneous fat RNA-seq data. Potential genetic markers revealed significant genotype/allele distribution variations between high- and low-fat pigs. We suggested that the proposed variant calling derived from RNA-seq data might help develop genetic markers for complex pig traits. The results pinpoint that the selection of the BSCL2 G allele (rs341493267) could increase backfat thickness in pigs. In addition, observed polymorphisms also affected meat percentage, loin mass, and eye area.
Abstract
BSCL2 encodes seipin, a transmembrane endoplasmic reticulum protein associated with lipodystrophy and severe metabolic complications, including diabetes and hepatic steatosis. In pigs, BSCL2 expression increases during adipocyte differentiation. In the present study, we identified significant gene variants associated with fat deposition (FD)-related processes based on subcutaneous fat tissue RNA-seq data. In the association study, to prove our hypothesis, three Polish pig breeds were included: Złotnicka White (ZW, n = 72), Polish Landrace (PL, n = 201), and Polish Large White (PLW, n = 169). Based on variant calling analysis and χ2 tests, BSCL2 mutations showing significantly different genotype/allele distribution between high- and low-fat pigs were selected for a comprehensive association study. Four interesting BSCL2 variants (rs346079334, rs341493267, rs330154033, and rs81333153) belonging to downstream and missense mutations were investigated. Our study showed a significant decrease in minor allele frequency for two BSCL2 variants (rs346079334 and rs341493267) in PL pigs in 2020–2021. In ZW, BSCL2 mutations significantly affected loin and ham fats, meat redness, and growth performance traits, such as feed conversion and daily feed intake. Similar observations were noted for PLW and PL, where BSCL2 mutations influenced fat depositions and meat traits, such as loin eye area, loin mass and fat, carcass yield, and growth performance traits. Based on the observation in pigs, our study supports the theory that BSCL2 expressed in subcutaneous fat is involved in the FD process.
1. Introduction
BSCL2 is the gene that encodes seipin, a transmembrane endoplasmic reticulum protein. Mutations in the BSCL2 gene cause congenital lipodystrophy, a rare recessive disorder that appears as a minimum adipose-tissue-level/fat deposition and severe insulin resistance [1]. The gene was discovered in 2001, and various cellular studies were carried out to elucidate its biological function [2]. Seipin is expressed in motor neurons of the spinal cord and cortical neurons of the frontal lobes, as well as adipose tissue (AT). It was shown that seipin deficiency alters lipid droplet morphology and influences adipocyte differentiation. However, the role of this protein remains unclear because the pathophysiology of BSCL2 in patients with BSCL2 function disorders is little studied [3]. Nevertheless, it was identified that mutations in BSCL2 are associated with distal hereditary motor neuropathy (dHMN) and with Charcot–Marie–Tooth disease type 2 (CMT2) in a Taiwanese cohort [4]. It was demonstrated that one of these mutations results in low seipin expression and decreased cell viability. Furthermore, in a family of Pakistani heritage, a mutation in BSCL2 caused lipodystrophy [5]. Individuals affected by mutations in BSCL2 develop severe metabolic complications, including hepatic steatosis and diabetes. Several mouse studies have shown that Bscl2-deficient mice almost entirely reproduced the lipodystrophy (CGL) phenotype. AT-specific loss due to Bscl2 deficiency was also sufficient to induce generalized early-onset lipodystrophy [6]. BSCL2 studies have also been conducted on farm animals, including pigs. Kociucka et al. [7] investigated genes (SNAP23, BSCL2, and COPA) involved in lipid droplet formation during porcine adipogenesis in vitro. They observed increased BSCL2 expression during differentiation and high bscl2 protein level in cells with accumulated lipids.
On the other hand, from a biomedical perspective, pigs are considered an important animal model, particularly for human obesity [8]. In studies predicting fat deposition events, these farm animals reflect human metabolism and fat tissue distribution better than small lab animals. Moreover, pigs are highly economically significant in the meat industry, and AT accumulation is one of the most essential studied processes. AT body expansion/accumulation is the result of two phenomena: hyperplasia, which is the production of new adipocytes, and hypertrophy, which is an increase in the size of existing adipocytes [9]. The excess of circulating fatty acids is converted to triglycerides and stored in adipocyte lipid droplets [10]. In previous years, the importance of the mechanism regulating the expression and formation of lipid droplets has been repeatedly highlighted due to the increasing prevalence of metabolic diseases in the human population, including the spread of obesity. To date, numerous studies searching the genetic background of fatness/obesity have identified many genes involved in significant cellular/molecular processes and pathways [11,12]. However, knowledge in this area still needs to be expanded.
RNA-seq analysis based on next-generation sequencing technology delivers valuable information about transcript levels, including non-coding RNA molecules such as long non-coding RNAs and miRNAs [13]. RNA-seq data can also be a source for identifying gene mutations for fat-storage-related molecular processes [14]. However, a variant calling test based on RNA-seq data requires a much more precise approach, including specialist filtration [15], than a Genome-Wide Association Study (GWAS). Nevertheless, gene variant identification based on RNA-seq data focuses only on genes expressed in this tissue of interest, which could be crucial. Moreover, RNA-seq data in a variant calling analysis can be called an added value because RNA sequencing usually has a different purpose.
Therefore, the present study aimed to identify significant gene variants associated with fat deposition (FD)-related processes based on subcutaneous fat tissue RNA-seq data and to perform an association study to indicate potential genetic markers in the BSCL2 gene.
2. Materials and Methods
The biological material used in the present study was collected after pig slaughtering. Pig slaughtering was performed in the Pig Test Station (PTS, Chorzelów, Poland) of the National Research Institute of Animal Production (NRIAP). The carcasses, after detailed dissection, were intended for sale and consumption. The collection method was non-invasive, so ethical review and approval were unnecessary for this study. However, Approving Experiment Committee of NRIAP (Krakow, Poland) approved all conducted research according to the Polish Act on the Protection of Animals Used for Scientific or Educational Purposes (15 January 2015), which implemented Directive 2010/63/EU of the European Parliament and Council (22 September 2010) on the protection of animals used for scientific purposes. All procedures/methods used in the present study followed the regulations and guidelines of the Local Ethics Committee for Experiments with Animals (Krakow).
2.1. Animals and Biological Materials
All Złotnicka White (ZW) female pigs (n = 72) were transported to the PTS at NRIAP with a 30 kg initial weight. Following local procedures, their diet and housing conditions were identical [16]. Pigs were fed ad libitum to a 100 ± 2.5 kg final weight. Since 2020, PTS procedures have been slightly changed, and since this year, all pigs are maintained until they reach 120 ± 2.5 kg final weight. This new treatment has been dictated by market demand. The remaining points of the procedure continue to follow the pre-2020 guidelines. Detailed growth information, such as feed conversion, daily gain, number of test days, and feed intake, was collected during a test. Before slaughter, pigs were starved for 24 h. After slaughter, carcasses were chilled for 24 h at 4 °C, and then, the right half-carcass was evaluated. During the dissection, several carcass characteristics were measured, including loin (kg) and ham mass (kg), average backfat thickness (cm) (from five measurements—backfat thickness over the shoulder blade, at the thoracic part, and three measures at the sacrum part of the spine), loin eye area (cm2) (between the last thoracic and first lumbar vertebras), carcass yield (%), and numerous other fat tissue related traits, including visceral and subcutaneous fat content (peritoneal fat, ham, knuckle and loin fat with skin) [16]. Meat quality characteristics (intramuscular fat, pH, meat color, and myowater exudation) were assessed according to Tyra and Żak protocol [17].
From all 72 ZW pigs, subcutaneous fat tissue and blood samples were collected up to 20 min after slaughter. The fat samples were stabilized in RNAlater™ Stabilization Solution (Applied Biosystems, Waltham, MA, USA), and the blood was stabilized in EDTA tubes; all was frozen at −20 °C. The pigs for the transcriptomic study were selected based on fat-related trait information collected during detailed dissection. We created two pig groups, showing low- (n = 8, LFD) and high-fat (n = 8 HFD) deposition levels, following the approach of Piórkowska et al. [18].
The association study included female ZW (n = 72), Polish Landrace (PL) (n = 201), and Polish Large White (PLW) (n = 169) pigs. The material for PLW and PL pigs was collected between 2020 and 2021 to show selective potential in the present populations. ZW is a native Polish breed, and PL and PLW belong to maternal components in Polish breeding. DNA was isolated from tissue and blood samples depending on the available biological material. Blood samples from PLW and PL pigs were collected by the Department of Pig Breeding of NRIAP as part of other research projects.
2.2. RNA Sequencing and Transcript Variant Identification
RNA isolation from fat tissue, next-generation sequencing, and raw data processing were described previously by Piórkowska et al. [18]. Alignment of raw reads to the pig transcriptome was performed with the pig reference genome Sscrofa11.1 (GCA_000003025.6, Ensembl 106: Apr 2022). In our previous study [19], where variant calling used liver RNA-seq data to identify transcript variants, we used GATK v. 4.1.9 and Picard [20] tools. In the present study, a similar approach was applied. The current RNA-seq data was deposited in Gene Expression Omnibus NCBI (GSE160436). The functional gene annotation clustering and protein–protein interaction (PPI) analyses (for genes with identified missense variants) were performed using DAVID Functional Annotation Bioinformatics Microarray Analysis [21] and String database [22], respectively. Moreover, we estimated the gene expression pattern for each BSCL2 isoform (ENSSSCT00000025488, ENSSSCT00000057466, ENSSSCT00000055749, ENSSSCT00000061218) (Ensembl release 106: Apr 2022) based on Fragments Per Kilobase of transcript per Million mapped reads (FPKM) generated in RNA-seq analyses.
Four interesting BSCL2 variants (rs346079334, rs341493267, rs330154033, and rs81333153) belonging to downstream (ds) and missense mutations (ms) were selected for association study because they presented the most significant differences in allele/genotype distribution according to the χ2 test. Moreover, identified BSCL2 ms variants were analyzed by the GERP [23] and SIFT tools [24], which defined the detriment of these mutations. Furthermore, these results were validated by DNA sequencing using the Sanger method. All BSCL2 primers are presented in Table S1.
2.3. BSCL2 Genotyping, Frequency Calculation and Statistical Analyses
PCR-RFLP (AluI restriction enzyme) and Sanger sequencing were used for genotyping BSCL2 downstream (rs346079334) and three missense (rs341493267, rs330154033, and rs81333153) mutations, respectively. The association study included ZW (n = 72), PL (n = 201), and PLW (n = 169) pigs. Examining BSCL2 variant frequencies allowed us to determine the selection potential targeted to increase the pork quality lost in the previous intense breeding.
The first test included 16 ZW pigs and used the ANOVA procedure (SAS v. 7.1 with default settings; SAS Institute, Cary, NC, USA) with a post-hoc Duncan test to indicate differences in pig production traits dependent on BSCL2 genotypes.
Next, comprehensive association analysis including 72 ZW, 201 PL, and 169 PLW pigs was conducted based on the GLM procedure (SAS v. 8.02 with default settings; SAS Institute, Cary, NC, USA). All pigs involved in analyses were free of a deleterious mutation in the RYR1 gene [25].
In this analysis, we used the presented linear model:
Yijkl = μ+di + cj + fj + α(xijk ) + eijkl
The model’s terms are as follows:
- Yijkl—observation;
- µ—mean;
- di—fixed effect of genotype group;
- cj—fixed effect of sire;
- fj—fixed effect of farm origin;
- α(xijk)—covariate for the weight of the right side of the carcass;
- eijkl—random error.
The model did not include the effect of the slaughter season because temperature, humidity, and feeding conditions were the same for all pigs, independent of the season. The means were presented as least-square means (LSM ± SE) to determine significant differences between genotype groups. Each breed was analyzed individually. Moreover, additive and dominance effects were calculated (regression procedure, SAS v. 8.02, default setting, SAS Institute, Cary, NC, USA). The additive effect oscillated between −1 and 1 for AA and GG genotypes, and the dominance impact oscillated between −1 and 1 for AG and both homozygotes.
3. Results
3.1. Animals Characteristics and Variant Calling Results
Animal groups (HFD and LFD) used in RNA-seq analysis were significantly different in the context of fat deposition traits, which was previously described [18].
The information about read numbers after NGS, mapping, annotation, and also clustering into low- and high-fat groups was presented in a previous study [18]. GATK analysis showed that based on fat RNA-seq data, over 60,000 mutations were identified, and 5870 were found to be significant according to the χ2 test, which means that these differences in genotype/allele distribution between HFD and LFD were crucial. Over 70% of identified variants were known (deposited in the dbSNP NCBI and Ensembl databases). Insertions and deletions constituted 8.4%, of which 289 were significant following the χ2 test. In total, 323 and 2500 significant gene mutations were found in the 5′UTRs and 3′UTRs, respectively. Off-gene variants (down- and upstream and intergenic) were numerous: over 40,000 (Table 1).

Table 1.
Variant calling results generated based on subcutaneous fat transcriptome data.
3.2. Genes with Missense Variants Functional Analysis
The functional analysis performed by DAVID indicated that genes with missense mutations are involved in the regulation of inflammatory response (GO:0050727)(AKNA, TNIP1, SETD6, DROSHA, ADAMTS12), fat cell differentiation (GO:0045444)(BBS1, TMEM120B, MED1, MKKS), cellular response to insulin stimulus (GO:0032869)(DENND4C, SLC2A4, COMMD6, LPIN1), calcium ion binding (GO:0005509)(CEMIP2, CLSTN3, VWCE, PKD2, ZZEF1, VCAN, EGFLAM, SGCA, S100A16, CDHR4, SPARCL1, DCHS1, MAN1A1, CAPN1, PAMR1, NINL, NUCB2, SLC25A24, FBN1), and cell adhesion molecules (ssc04514)(SLA-DRB1, VCAN, ITGAM, CD6, SLA-7, SLA-3) (Figure 1A). Moreover, the top 15 genes based on a chi2 test, which contained missense variants, were associated with lipid metabolic processes, fat cell structure, and adipocyte differentiation (BSCL2, DHRS11, TMEM120B) (Figure 1B). For further analysis, the BSCL2 mutations were chosen. PPI STRING analysis confirmed a significant BSCL2 role and its involvement in lipid droplet formation (Figure 2A). Moreover, based on RNA-seq data, we compared the expression of BSCL2 isoforms dependent on FD, and we found significant differences and trends (Figure 2C). Thus, we concluded that these isoforms could play slightly distinct molecular roles.
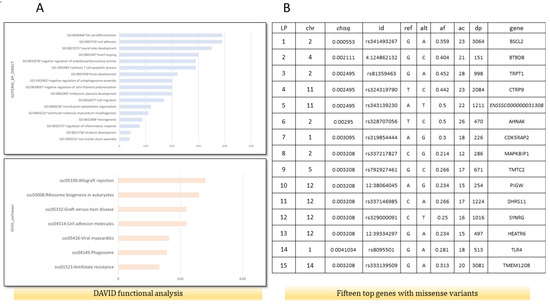
Figure 1.
Functional analysis for genes containing missense variants (ms) and genes with the lowest corrected p-value in χ2 test drawn from variant calling analysis. (A) Functional analysis using DAVID, including GO biological process and KEGG pathways on 363 genes with identified missense mutations in fat RNA-seq data. (B) Top 15 genes with ms according to χ2 test. Chr—chromosomal, id—Ensembl number, reference and alternate alleles, af—alternate allele frequency, dp—depth of sequencing, and gene names.
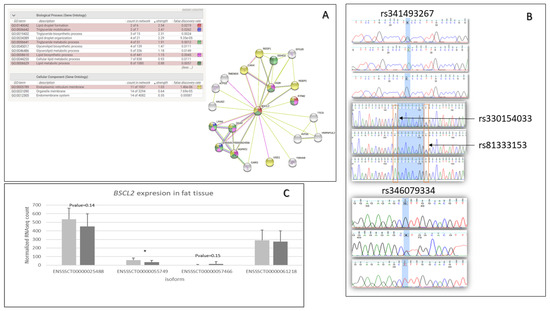
Figure 2.
BSCL2 gene information about the gene function, BSCL2 isoform expression, and BSCL2 identified polymorphisms. (A) PPI analysis for BSCL2 gene using STRING tool. (B) Chromatograms present Sanger sequencing results for three missense mutations (rs341493267, rs330154033, rs81333153) and one downstream gene variant (rs346079334). The chromatograms were visualized by FinchTV vs. 1.4.0 chromatogram viewer (Geospiza, Inc.; Seattle, WA, USA; http://www.geospiza.com), accessed on 20 April 2022. (C) BSCL2 isoform expression dependent on fat tissue deposition based on fat RNA-seq results. Light grey—LFD group, dark grey—HFD.
3.3. Influence of BSCL2 Mutations on Pig Phenotypes
We identified 42 BSCL2 variants, including missense and synonymous mutations in the 3′UTR, 5′UTR, upstream, downstream, intergenic, and intron regions. Nevertheless, only 15 were significant, according to the χ test. All three ms (rs341493267, rs330154033, rs81333153) variants and one ds (rs346079334) variant were selected for further association analysis; they showed 0.00055, 0.037581251, 0.192933798, and 0.00055 p-values, respectively. The presence of these variants was also confirmed by Sanger sequencing (Figure 2B). Moreover, GERP pinpointed a low score of −6.34 for the rs330154033 mutation, and the SIFT defined it as deleterious.
In ANOVA analysis of 16 ZW pigs, it was shown that fully coupled rs341493267 and rs346079334 BSCL2 variants significantly affected body composition traits, mainly associated with fat storage, such as subcutaneous fats measured in numerous carcass points and also peritoneal fat (p-value = 0.001) (Table 2). In addition, missense variants rs330154033 and rs81333153 were also related to body traits, including meat percentage, carcass yield, and mass of primary cuts (Table 3 and Table 4).
Table 2.
Means with standard deviation (SD), calculated based on ANOVA test (SAS) for pig production traits dependent on rs341493267 and rs346079334 BSCL2 variants, for 16 Złotnicka White pigs included in RNA sequencing analysis.
Table 3.
Means with standard deviation (SD), calculated based on ANOVA test (SAS) for pig production traits dependent on rs330154033 BSCL2 variant, for 16 Złotnicka White pigs included in RNA sequencing analysis.
Table 4.
Means with standard deviation (SD), calculated based on ANOVA test (SAS) for pig production traits dependent on rs81333153 BSCL2 variant, for 16 Złotnicka White pigs included in RNA sequencing analysis.
3.4. BSCL2 Frequency in Polish Pig Populations and Comprehensive Association Analysis
After genotyping, there were high differences in BSCL2 variant frequency between ZW, PL, and PLW pigs. The C allele of rs81333153 mutation was dominant in Złotnicka White, and in maternal breeds, the G allele prevailed (Supplementary Tables S3 and S4). Moreover, during two years (2020–2021) observation, the number of pigs with TT (rs346079334) and AA (rs341493267) genotypes in Polish Landrace decreased twofold (14–7%) and fourfold (8–2%) (Supplementary Table S3), respectively. In turn, the number of pigs with CC genotype (rs81333153) increased both in PL and PLW.
Analysis of BSCL2 haplotypes showed that the two most numerous haplotypes in ZW pigs were GG/GG/GG/CC and GT/AG/AG/CG (31%); in PL, the most numerous haplotype was GG/GG/GG/GG (21%), and in PLW pigs, the most frequent haplotype was under 15%.
The association study in Złotnicka White pigs demonstrates that the ds variant (rs346079334) significantly affected loin and ham fats, with TT pigs showing 10 and 4% higher values than CC, respectively. Moreover, a significant influence on meat redness was observed, where heterozygote meat was the reddest. The three missense variants of the BSCL2 gene also significantly affected loin and ham fat depositions; rs330154033 and rs81333153 mutations also changed growth traits, such as feed conversion and daily feed intake, respectively (Table 5). In the Supplementary Materials, we also attach tables presenting trends that suggest that BSCL2 influences fat deposition in Złotnicka White (Table S5). Association analysis, including two maternal breeds PL and PLW, demonstrated numerous dependencies between BSCL2 variants and fat deposition, though statistical analysis in these breeds was complicated due to the low number of alternate homozygotes. In these breeds used in Polish breeding, BSCL2 variants, in addition to affecting fat characteristics, also influenced meat traits such as mass and eye area of loin and carcass yield (Table 6 and Table 7). In addition, in PLW, numerous relationships between BSCL2 and growth performance traits (daily gain, feed conversion, and slaughter age) were observed (rs341493267–AA, rs330154033–AA, and rs81333153–CC, respectively). Supplementary Tables presenting trends for PLW and PL pigs also suggest that BSCL2 regulates fat deposition processes (Tables S6 and S7). In PL pigs, TT_rs346079334 and AA_rs341493267 genotypes correlated with a higher subcutaneous fat level; nevertheless, decreasing the number of pigs with these genotypes suggests the still-unfavorable direction of the conducted selection.
Table 5.
Means as least-square means (LSM) with standard error (SE) for pig production traits dependent on BSCL2 genotypes for Złotnicka White.
Table 6.
Means as least-square means (LSM) with standard error (SE) for pig production traits dependent on BSCL2 genotypes for Polish Landrace.
Table 7.
Means as least-square means (LSM) with standard error (SE) for pig production traits dependent on BSCL2 genotypes for Polish Large White.
4. Discussion
4.1. Adipogenesis in Terms of the Role of the BSCL2 Gene in Fat Deposition
Adipose tissue (AT) is crucial to the body’s energy and metabolic processes because it stores fatty acids. This tissue is involved in the effective functioning of the endocrine and immune systems (producing or activating hormones) and in tissue regeneration processes due to the presence of progenitor cells with multipotent differentiation potential [26]. AT can be divided into two types: white adipose tissue (WAT), which plays a role in metabolic and energy processes, as it contains large and single localized lipid droplets, and brown adipose tissue (BAT), which is involved in thermoregulation of the body and is morphologically rich in mitochondria, in which uncoupling protein-1 (UCP-1) is localized [27]. The expansion of AT due to hyperplasia is the basis of adipogenesis, a process actively controlled by many genes and signaling pathways. Adipocytes make up to 40% of cells in the WAT [28]. Adipogenesis occurs in two stages: in the first, mesodermal stem cells (MSCs) with multipotent differentiation potential are transformed into pre-adipocytes [29]. In the subsequent phase of late differentiation, the pre-adipocytes differentiate into mature adipocytes upon activation of the PPAR-gamma (Peroxisome proliferator-activated receptor gamma) receptor. The maintenance of expression of adipocyte marker genes is controlled by PPAR-gamma interacting with C/EBP (CCAAT/enhancer-binding protein) [30]. However, adipogenesis involves many more genes and signaling pathways—such as Wnt, Hedgehog, c-AMP (cyclic adenosine monophosphate), IGF-1 (insulin growth factor 1), and BMP-2, -4 (bone morphogenetic protein 2, 4) [31].
In the present study, mutations in the BSCL2 gene were significantly associated with fat deposition in ZW pigs, which was suggested based on variant calling analysis using RNA-seq data. In the BSCL2 gene, 42 single-nucleotide mutations (including 15 that were significant according to χ2 test) were identified across pigs with different fat deposition. This observation could support the hypothesis that BSCL2 plays a crucial role during adipogenesis. BSCL2, through the cAMP/PKA pathway, participates in regulating the processes in WAT and the differentiation and maintenance of adipocytes [32]. Zhou et al. [33] suggest that in vivo BSCL2 controls, at least to some extent, the adipogenesis process through the enzyme ATGL (adipose triglyceride lipase), which is involved in the initial phase of lipogenesis. ATGL was previously studied in the context of fat management and food intake regulation, and the authors found a significant effect on fattening traits in pigs [34]. The knockout of the BSCL2 gene in mice in vitro disrupted the late adipogenesis process and expressed an increase in lipid droplet formation. It seems likely that BSCL2-knockout mice did not show adipogenesis inhibition but showed lipogenesis suppression [35]. Our analysis using the STRING to predict PPI indicates that the BSCL2 gene is involved in forming lipid droplets. Moreover, the present study found that the expression of particular BSCL2 isoforms in SAT varied dependent on fat deposition level. Regarding BSCL2 mutations investigated in the present study, two missense variants (rs330154033 and rs81333153) are located in the IPR009617 protein domain, which is the seipin family domain, whose primary function is to control the adipogenesis process by regulating lipolysis in a cell-independent manner [32]. Therefore, these mutations can play a crucial role in the proper function of BSCL2 protein; in addition, one of them (rs330154033) was defined by SIFT and GERP as highly unfavorable or deleterious. Moreover, two others located in the last exon (rs341493267) and downstream of the gene (rs346079334) can play a regulatory role during expression.
BSCL2 was investigated regarding processes related to obesity/fatness, which is defined as excessive accumulation of triacylglycerol in WAT, specifically in lipid droplets. Our study also contributes to knowledge about the connection between BSCL2 and the FD process using pigs as an animal model. It supports the hypothesis that porcine adipocytes are excellent and reliable material for studying adipogenesis due to remarkably high similarity to human adipocytes, overtaking small lab animals in this competition [36].
4.2. BSCL2 Variants as Potential Selective Markers for Complex Pig Traits
The accumulation of AT considerably impacts the growth efficiency and quality of meat in pig livestock, and understanding the molecular basis of this process is critical to improving production [8]. In previous liver RNA-seq studies, we proved that the FGL1 (fibrinogen-like 1) gene is associated with FD in pigs, and the rs340465447_A allele may be a selectable marker for fat level [19]. By analogy, this study searched for confirmation that the BSCL2 gene variants may also play a similar role, and we found numerous relationships in all investigated pig breeds, though statistical analysis in PLW and PL breeds was complicated due to the low number of individuals in alternate homozygote groups. Our results pinpoint that the selection of the BSCL2 G allele (rs341493267) could increase backfat thickness in pigs.
The porcine BSCL2 gene is located on chromosome 2 in the p-arm (SSC2p) region, which was identified as a region of QTL distribution for traits such as the diameter of adipocytes [5], which was supported by the report of Kociucka et al. [7]. To date, many fat-related loci in pigs have been mapped to SSC2. In Landrace and Korean native pigs, QTL on SSC2 was correlated with backfat thickness (BFT) [37]. A study in Duroc pigs showed the presence of QTLs for attributes such as total cholesterol content, low-density lipoprotein (LDL), and triacylglycerol content [38]. Returning to BSCL2, in a genome-wide detection of copy number variation (CNV) study, several CNVs associated with daily gain overlapped with the BSCL2 gene, supporting the theory that BSCL2 is a promising functional candidate gene for complex pig traits [39].
5. Conclusions
The present report shows that individual variants of the BSCL2 gene were related to features of fat and meat in three Polish pig breeds. Our study supports the hypothesis that BSCL2 is involved in determining fat deposition in pigs and can be used as a selective marker to modulate fat levels in this species. However, our observation in PL pigs concerning the number of TT_rs346079334 and AA_rs341493267 genotypes, which have been correlated with a higher subcutaneous fat level, still suggests the unfavorable direction of the conducted selection, despite the boosted awareness of insufficient fatness in pigs. Moreover, the present study confirms that RNA sequencing could be adequate data for variant calling analysis, combined with comprehensive association analysis, which validates the observations.
Supplementary Materials
The following supporting information can be downloaded at https://www.mdpi.com/article/10.3390/ani13040641/s1. Table S1: Primers used in study. Table S2: Frequencies of alleles and genotypes of SNP rs341493267 and rs346079334 of the BSCL2 gene in Złotnicka White and pigs active in Polish breeding. Table S3: Frequencies of alleles and genotypes of SNP rs341493267 and rs346079334 of BSCL2 gene in Złotnicka White and pigs active in Polish breeding. Table S4: Least-square means (LSM) ± SE for important pig traits dependent on BSCL2 genotypes for Złotnicka White. Table S5: Least-square means (LSM) ± SE for important pig traits dependent on BSCL2 genotypes for Polish Landrace. Table S6: Least-square means (LSM) ± SE for important pig traits dependent on BSCL2 genotypes for Polish Large White.
Author Contributions
Conceptualization, K.P.; methodology, K.P., M.T. and K.Ż.; validation, M.T.; formal analysis, J.S., K.P., K.Ż. and K.Z.; investigation, M.T.; resources, K.R.-M.; data curation, K.P. and K.R.-M.; writing—original draft preparation, J.S., K.P., K.Ż. and K.Z.; writing—review and editing, K.P. and K.R-M.; supervision, K.P.; project administration, M.T.; funding acquisition, K.P. and M.T. All authors have read and agreed to the published version of the manuscript.
Funding
This study was supported by the statutory activity of the National Research Institute of Animal Production no. 01-18-05-21 and The National Centre for Research and Development in Poland—BIOSTRATEG2/297267/14/NCBR/2016.
Institutional Review Board Statement
Ethical review and approval were waived for this study, due to the non-invasive method of collecting blood and tissue samples after pig slauther. Pig slaughtering was performed in the Pig Test Station (PTS, Chorzelów, Poland) of the National Research Institute of Animal Production (NRIAP). The carcasses, after detailed dissection, were intended for sale and consumption.
Informed Consent Statement
Not applicable.
Data Availability Statement
The sequence data for RNA libraries have been submitted to public database the Gene Expression Omnibus with the accession number GSE160436.
Conflicts of Interest
The authors declare no conflict of interest. The funders had no role in the design of the study; in the collection, analyses, or interpretation of data; in the writing of the manuscript; or in the decision to publish the results.
References
- Roumane, A.; McIlroy, G.D.; Balci, A.; Han, W.; Delibegović, M.; Baldassarre, M.; Newsholme, P.; Rochford, J.J. Bscl2 Deficiency Does Not Directly Impair the Innate Immune Response in a Murine Model of Generalized Lipodystrophy. J. Clin. Med. 2021, 10, 441. [Google Scholar] [CrossRef]
- Magré, J.; Delépine, M.; Khallouf, E.; Gedde-Dahl, T.; Van Maldergem, L.; Sobel, E.; Papp, J.; Meier, M.; Mégarbané, A.; Bachy, A.; et al. Identification of the gene altered in Berardinelli-Seip congenital lipodystrophy on chromosome 11q13. Nat. Genet. 2001, 28, 365–370. [Google Scholar] [CrossRef]
- Dollet, L.; Magré, J.; Cariou, B.; Prieur, X. Function of seipin: New insights from Bscl2/seipin knockout mouse models. Biochimie 2014, 96, 166–172. [Google Scholar] [CrossRef]
- Hsiao, C.T.; Tsai, P.C.; Lin, C.C.; Liu, Y.T.; Huang, Y.H.; Liao, Y.C.; Huang, H.W.; Lin, K.P.; Soong, B.W.; Lee, Y.C. Clinical and Molecular Characterization of BSCL2 Mutations in a Taiwanese Cohort with Hereditary Neuropathy. PLoS ONE 2016, 11, e0147677. [Google Scholar] [CrossRef]
- Rahman, O.U.; Khawar, N.; Khan, M.A.; Ahmed, J.; Khattak, K.; Al-Aama, J.Y.; Naeem, M.; Jelani, M. Deletion mutation in BSCL2 gene underlies congenital generalized lipodystrophy in a Pakistani family. Diagn. Pathol. 2013, 8, 1–7. [Google Scholar] [CrossRef]
- McIlroy, G.D.; Mitchell, S.E.; Han, W.; Delibegović, M.; Rochford, J.J. Ablation of Bscl2/seipin in hepatocytes does not cause metabolic dysfunction in congenital generalised lipodystrophy. Dis. Model. Mech. 2020, 13, dmm042655. [Google Scholar] [CrossRef] [PubMed]
- Kociucka, B.; Flisikowska, T.; Mróz, D.; Szczerbal, I. Expression of genes involved in lipid droplet formation (BSCL2, SNAP23 and COPA) during porcine in vitro adipogenesis. J. Appl. Genet. 2016, 57, 505–510. [Google Scholar] [CrossRef] [PubMed]
- Switonski, M.; Stachowiak, M.; Cieslak, J.; Bartz, M.; Grzes, M. Genetics of fat tissue accumulation in pigs: A comparative approach. J. Appl. Genet. 2010, 51, 153–168. [Google Scholar] [CrossRef] [PubMed]
- Houpt, K.A.; Houpt, T.R.; Pond, W.G. The pig as a model for the study of obesity and of control of food intake: A review. Yale J. Biol. Med. 1979, 52, 307–329. [Google Scholar]
- Jo, J.; Gavrilova, O.; Pack, S.; Jou, W.; Mullen, S.; Sumner, A.E.; Cushman, S.W.; Periwal, V. Hypertrophy and/or Hyperplasia: Dynamics of Adipose Tissue Growth. PLoS Comput. Biol. 2009, 5, e1000324. [Google Scholar] [CrossRef]
- Rutkowski, J.M.; Stern, J.H.; Scherer, P.E. The cell biology of fat expansion. J. Cell Biol. 2015, 208, 501–512. [Google Scholar] [CrossRef] [PubMed]
- Szczerbal, I.; Chmurzynska, A. Chromosomal localization of nine porcine genes encoding transcription factors involved in adipogenesis. Cytogenet. Genome Res. 2008, 121, 50–54. [Google Scholar] [CrossRef]
- Szczerbal, I.; Chmurzynska, A.; Switonski, M. Cytogenetic mapping of eight genes encoding fatty acid binding proteins (FABPs) in the pig genome. Cytogenet. Genome Res. 2007, 118, 63–66. [Google Scholar] [CrossRef]
- Xing, K.; Zhu, F.; Zhai, L.; Chen, S.; Tan, Z.; Sun, Y.; Hou, Z.; Wang, C. Identification of genes for controlling swine adipose deposition by integrating transcriptome, whole-genome resequencing, and quantitative trait loci data. Sci. Rep. 2016, 6, 23219. [Google Scholar] [CrossRef]
- Piskol, R.; Ramaswami, G.; Li, J.B. Reliable identification of genomic variants from RNA-seq data. Am. J. Hum. Genet. 2013, 93, 641–651. [Google Scholar] [CrossRef]
- Różycki, M.; Tyra, M. Rules at evaluating the pigs in Pig Slaughter Testing Station. In State of Pig Breeding and Pig Evaluation Results; Instytut Zootechniki: Kraków, Poland, 1996; pp. 69–82. [Google Scholar]
- Tyra, M.; Żak, G. Analysis of the possibility of improving the indicators of pork quality through selection with particular consideration of intramuscular fat (imf) conntenttent*. Ann. Anim. Sci. 2013, 13, 33–44. [Google Scholar] [CrossRef]
- Piórkowska, K.; Żukowski, K.; Ropka-Molik, K.; Tyra, M. New long-non coding RNAs related to fat deposition based on pig model. Ann. Anim. Sci. 2022, 22, 1211–1224. [Google Scholar] [CrossRef]
- Piórkowska, K.; Zukowski, K.; Ropka-Molik, K.; Tyra, M. Variations in Fibrinogen-like 1 (FGL1) Gene Locus as a Genetic Marker Related to Fat Deposition Based on Pig Model and Liver RNA-Seq Data. Genes 2022, 13, 1419. [Google Scholar] [CrossRef] [PubMed]
- McKenna, A.; Hanna, M.; Banks, E.; Sivachenko, A.; Cibulskis, K.; Kernytsky, A.; Garimella, K.; Altshuler, D.; Gabriel, S.; Daly, M.; et al. The genome analysis toolkit: A MapReduce framework for analyzing next-generation DNA sequencing data. Genome Res. 2010, 20, 1297–1303. [Google Scholar] [CrossRef] [PubMed]
- Jiao, X.; Sherman, B.; Huang, D.W.; Stephens, R.; Baseler, M.; Lane, H.; Lempicki, R. DAVID-WS: A stateful web service to facilitate gene/protein list analysis. Bioinformatics 2012, 28, 1805–1806. [Google Scholar] [CrossRef]
- Szklarczyk, D.; Gable, A.L.; Lyon, D.; Junge, A.; Wyder, S.; Huerta-Cepas, J.; Simonovic, M.; Doncheva, N.T.; Morris, J.H.; Bork, P.; et al. STRING v11: Protein-protein association networks with increased coverage, supporting functional discovery in genome-wide experimental datasets. Nucleic Acids Res. 2019, 47, D607–D613. [Google Scholar] [CrossRef]
- Huber, C.D.; Kim, B.Y.; Lohmueller, K.E. Population genetic models of GERP scores suggest pervasive turnover of constrained sites across mammalian evolution. PLoS Genet. 2020, 16, e1008827. [Google Scholar] [CrossRef] [PubMed]
- Sim, N.L.; Kumar, P.; Hu, J.; Henikoff, S.; Schneider, G.; Ng, P.C. SIFT web server: Predicting effects of amino acid substitutions on proteins. Nucleic Acids Res. 2012, 40, W452. [Google Scholar] [CrossRef]
- Škrlep, M.; Kavar, T.; Čandek-Potokar, M. Comparison of PRKAG3 and RYR1 gene effect on carcass traits and meat quality in Slovenian commercial pigs. Czech J. Anim. Sci. 2010, 55, 149–159. [Google Scholar] [CrossRef]
- Tchkonia, T.; Morbeck, D.E.; Von Zglinicki, T.; Van Deursen, J.; Lustgarten, J.; Scrable, H.; Khosla, S.; Jensen, M.D.; Kirkland, J.L. Fat tissue, aging, and cellular senescence. Aging Cell 2010, 9, 667–684. [Google Scholar] [CrossRef] [PubMed]
- Lee, Y.H.; Mottillo, E.P.; Granneman, J.G. Adipose tissue plasticity from WAT to BAT and in between. Biochim. Biophys. Acta 2014, 1842, 358–369. [Google Scholar] [CrossRef]
- Rosen, E.D.; Spiegelman, B.M. What we talk about when we talk about fat. Cell 2014, 156, 20–44. [Google Scholar] [CrossRef]
- Rosen, E.D.; Spiegelman, B.M. Molecular regulation of adipogenesis. Annu. Rev. Cell Dev. Biol. 2000, 16, 145–171. [Google Scholar] [CrossRef]
- Cristancho, A.G.; Lazar, M.A. Forming functional fat: A growing understanding of adipocyte differentiation. Nat. Rev. Mol. Cell Biol. 2011, 12, 722–734. [Google Scholar] [CrossRef]
- Ambele, M.A.; Dhanraj, P.; Giles, R.; Pepper, M.S. Adipogenesis: A Complex Interplay of Multiple Molecular Determinants and Pathways. Int. J. Mol. Sci. 2020, 21, 4283. [Google Scholar] [CrossRef]
- Chen, W.; Chang, B.; Saha, P.; Hartig, S.M.; Li, L.; Reddy, V.T.; Yang, Y.; Yechoor, V.; Mancini, M.A.; Chan, L. Berardinelli-seip congenital lipodystrophy 2/seipin is a cell-autonomous regulator of lipolysis essential for adipocyte differentiation. Mol. Cell. Biol. 2012, 32, 1099–1111. [Google Scholar] [CrossRef] [PubMed]
- Zhou, H.; Lei, X.; Yan, Y.; Lydic, T.; Li, J.; Weintraub, N.L.; Su, H.; Chen, W. Targeting ATGL to rescue BSCL2 lipodystrophy and its associated cardiomyopathy. JCI Insight 2019, 4, e129781. [Google Scholar] [CrossRef] [PubMed]
- Ropka-Molik, K.; Piórkowska, K.; Piestrzyńska-Kajtoch, A.; Fornal, A.; Zyskowska, Z.; Pruś, A.; Tyra, M. The Potential Role of MYOM1 and ATGL Genes in Pig Production Improvement. Ann. Anim. Sci. 2021, 21, 833–842. [Google Scholar] [CrossRef]
- Prieur, X.; Dollet, L.; Takahashi, M.; Nemani, M.; Pillot, B.; Le May, C.; Mounier, C.; Takigawa-Imamura, H.; Zelenika, D.; Matsuda, F.; et al. Thiazolidinediones partially reverse the metabolic disturbances observed in Bscl2/seipin-deficient mice. Diabetologia 2013, 56, 1813–1825. [Google Scholar] [CrossRef]
- Bahmad, H.F.; Daouk, R.; Azar, J.; Sapudom, J.; Teo, J.C.M.; Abou-Kheir, W.; Al-Sayegh, M. Modeling Adipogenesis: Current and Future Perspective. Cells 2020, 9, 2326. [Google Scholar] [CrossRef] [PubMed]
- Yoo, C.K.; Lim, H.T.; Han, S.H.; Lee, S.S.; Ko, M.S.; Kang, T.; Lee, J.H.; Park, H.B.; Cho, I.C. QTL analysis of back fat thickness and carcass pH in an F2 intercross between Landrace and Korean native pigs. Mol. Biol. Rep. 2012, 39, 8327–8333. [Google Scholar] [CrossRef] [PubMed]
- Chen, R.; Ren, J.; Li, W.; Huang, X.; Yan, X.; Yang, B.; Zhao, Y.; Guo, Y.; Mao, H.; Huang, L. A genome-wide scan for quantitative trait loci affecting serum glucose and lipids in a White Duroc x Erhualian intercross F(2) population. Mamm. Genome 2009, 20, 386–392. [Google Scholar] [CrossRef]
- Qiu, Y.; Ding, R.; Zhuang, Z.; Wu, J.; Yang, M.; Zhou, S.; Ye, Y.; Geng, Q.; Xu, Z.; Huang, S.; et al. Genome-wide detection of CNV regions and their potential association with growth and fatness traits in Duroc pigs. BMC Genom. 2021, 22, 332. [Google Scholar] [CrossRef]


Disclaimer/Publisher’s Note: The statements, opinions and data contained in all publications are solely those of the individual author(s) and contributor(s) and not of MDPI and/or the editor(s). MDPI and/or the editor(s) disclaim responsibility for any injury to people or property resulting from any ideas, methods, instructions or products referred to in the content. |
© 2023 by the authors. Licensee MDPI, Basel, Switzerland. This article is an open access article distributed under the terms and conditions of the Creative Commons Attribution (CC BY) license (https://creativecommons.org/licenses/by/4.0/).