Article

Protein Content in the Diet Influences Growth and Diarrhea in Weaning Piglets

1
Council for Agricultural Research and Economics, Research Centre for Animal Production and Aquaculture, Via Beccastecca 345, 41018 Modena, Italy
2
Associazione Nazionale Allevatori Suini, Via Nizza 53, 00198 Rome, Italy
3
Fondazione Edmund Mach (FEM), Research and Innovation Centre, Via E. Mach 1, 38010 Trento, Italy
4
Council for Agricultural Research and Economics, Research Centre for Animal Production and Aquaculture, Via Salaria 31, 00015 Rome, Italy
*
Authors to whom correspondence should be addressed.
Animals 2023, 13(5), 795; https://doi.org/10.3390/ani13050795
Submission received: 2 February 2023 / Revised: 17 February 2023 / Accepted: 20 February 2023 / Published: 22 February 2023
(This article belongs to the Section Animal Nutrition)

Abstract

:

Simple Summary

Weaning (that is, removal from the sow) and the following two months are the riskiest periods in a pig’s life, especially for pig’s gastrointestinal health. The change in diet due to the suspension of the mother’s milk, accompanied by an acceleration of both morphological and enzymatic maturation of the intestinal mucosa of the piglets, can worsen digestion and absorption. In this context, the protein requirement of piglets, which are in a phase of rapid growth, may be greater than the intestine’s ability to digest proteins. Undigested proteins are the best pabulum for the proliferation of the pathogenic bacterial flora that causes diarrhea. Since these problems can no longer be resolved with prophylactic use of antibiotics, the best balance between intestinal health and growth performance must be found. A diet low in crude protein and supplemented with synthetic amino acids can help achieve this goal.

Abstract

The aim of this research has been to assess the effect of the dietary protein level on piglet growth and post-weaning diarrhea (PWD) incidence. Piglet fecal microbiota and feces composition were also assessed. The experiment was carried out on 144 weaned piglets (Duroc × Large White; 72 piglets per treatment) and lasted from weaning (at 25 days of age) until the end of the post-weaning phase (at 95 days). Two dietary protein levels were compared: high (HP; 17.5% crude protein on average, during the experiment) and low (LP; 15.5% on average). Lower (p < 0.01) average daily gain and feed conversion ratio were observed in LP piglets in the first growth phase. However, at the end of the post-weaning period, the growth parameters were not significantly different in the two diets. Diarrhea scores were lower in piglets fed LP diets than in piglets fed HP diets (28.6% of the total vs. 71.4% in the HP piglets). Fibrobacteres, Proteobacteria, and Spirochaetes were more abundant in the feces of the piglets fed LP diets. Feces nitrogen content was lower in piglets fed LP diets. In conclusion, low protein levels in the diet can reduce the incidence of PWD while only marginally affecting growth parameters.

1. Introduction

The period between weaning (i.e., removal from the mother) and reaching the bodyweight for transfer to the fattening boxes (at about three months of age and 35–40 kg of body weight) is more delicate from the point of view of health and functioning of the piglet digestive system. Among the numerous factors that can intervene to destabilize the delicate balance of the piglet’s intestine, linked to an acceleration phase of both morphological and enzymatic maturation, diet-linked factors undoubtedly play a fundamental role [1].
Among the dietary factors, the quantity of protein fed to piglets plays a leading role. In fact, in this phase, the coverage of nutritional needs requires a protein level higher than the digestive potential of the piglet. According to Kim et al. [2], a protein level of between 21.5% and 24% is required for modern fast-growing lines, a level that, in fact, is higher than the piglet’s digestive capacity; these authors suggest a protein level not higher than 18% in the first days after weaning and with a consistent addition of synthetic amino acids. De Lange et al. [3] pointed out that low protein levels are beneficial for the gut health of piglets because the presence of undigested proteins, as it can occur with high dietary protein levels, allows the proliferation of a bacterial flora producing toxins capable of altering the intestinal barrier. This alteration implies: the colonization of the intestinal epithelium by pathogenic microorganisms; the acceleration of the production of enterocytes that, being immature, have an exudative rather than absorbent attitude; greater ease of crossing the cellular barrier by specific bacterial toxins (edema disease). Zhang et al. [4] highlighted that high-protein diets increase the microbial fermentation of proteins, peptides, and amino acids. According to Gao et al. [1], high protein levels favor the production of ammonia and branched-chain-fatty acids and, therefore, the proliferation of pathogenic bacterial flora, while low protein levels favor the production of short-chain fatty acids (SCFAs), primarily butyric acid, which favors the proliferation of beneficial bacterial flora. The same authors, comparing two protein levels (17% vs. 30%), both obtained exclusively with casein, highlighted that with a high protein level, the bacterial diversity of the microbiota is reduced. The increase in ammonia can negatively affect the formation of intestinal epithelial cells [5]. The reduction of beneficial Lactobacilli that accompanies the maturation of the pig’s intestine and the variations in the buffering effect of pH due to protein fermentation can make the intestinal environment more susceptible to the emergence of opportunistic pathogens, such as Bacteroides and Clostridium species [6]. Opapeju et al. [7] compared four diets administered to piglets with an initial weight of about 6.5 kg: control feed with 21% crude protein (CP); feed with 19% CP and deficient in isoleucine; 19% raw protein feed supplemented with synthetic isoleucine to reach the isoleucine level of the control feed; 17% raw protein feed supplemented with isoleucine and valine to reach the ratio indicated by the ideal protein. The control group showed better production performance in terms of growth and conversion index, although they showed softer feces, a greater amount of ammonia in the feces, and a greater depth of the crypts of the intestinal mucosa, indicating an acceleration of production of enterocytes; essentially, better production performance, but greater susceptibility to the onset of a syndrome affecting the gastrointestinal system.
This situation of precarious equilibrium could be easily kept under control only with targeted antibiotic prophylaxis, which, however, is no longer allowed, and even the spaces for metaphylaxis, albeit careful, become increasingly restricted. Therefore, it is necessary to identify feeding strategies that reduce the risk of the appearance of alterations in the gastrointestinal function of the pig [8] and reserve the use of antibiotics for clinically overt pathological situations.
Knowledge of the relationship between pig microbiota and diet can be used to orient the intestinal microbial dynamics in the desired direction by diet manipulation [9]. The microbiota of healthy piglets susceptible to post-weaning diarrhea (PWD) has been the subject of numerous investigations [10,11], which highlighted how the state of health of the pig and its susceptibility to diseases, such as PWD, can be related to the change in the composition of the microbiota during the early stages of growth.
All factors affecting PWD susceptibility also affect microbiota composition. Among these, pig feeding plays a primary role. Heo et al. [12] observed a reduction in PWD in piglets challenged with an enterotoxigenic strain of Escherichia coli, when fed with lower protein levels. Rist et al. [13] suggested reducing proteins and increasing fermentable carbohydrates in the diet to reduce harmful protein fermentations. Luise et al. [14] showed that lower dietary protein levels could reduce the intestinal fermentation of undigested proteins and the consequent risk of diarrhea. The aim of this research has been to assess the effect of the dietary protein level on piglet growth and PWD incidence. Piglet fecal microbiota and feces composition were also assessed to support the understanding of the results.

2. Materials and Methods

2.1. Animal Ethics

All animal procedures were performed in strict accordance with the Code of Ethics of the World Medical Association (https://ec.europa.eu/environment/chemicals/lab_animals/legislation_en.htm. Accessed on 19 February 2023).

2.2. Experimental Design

The experiment was carried out at our experimental pig farm in San Cesario sul Panaro (Modena, Italy), on Duroc Italiana × Large White Italiana crossing lines. A total of 144 weaned piglets was used, half barrows and half females. The experiment lasted from weaning, when the age of the piglets was 25 ± 1.5 days, until the end of the post-weaning phase, corresponding to 70 days of trial and 95 days of age of the animals (Table 1).
Two dietary protein levels were compared (Table 2): high (HP) and low (LP), in two growth phases characterized by different diet compositions. The diet composition (Table 3) was changed 25 days after the start of the experiment, at the expected piglet body weight of 15 kg (and actual weight of 17 kg). Synthetic amino acids were also supplemented to ensure a balanced feed formulation. Specifically, total lysine levels in the first and second feeding periods were set at 1.40% and 1.20% of the feed, respectively. The percentages of methionine, cystine, threonine, and tryptophan were balanced according to the proportion of the ideal protein [15] with the addition of synthetic amino acids.
After separation from the mother, the piglets were housed in cages of 12 individuals each, distributed as evenly as possible within each cage by body weight, age, and litter of origin. Since it was not possible to accommodate 12 cages (3.3 m2 each) within the same room, the males were housed in one room (6 cages) and the females in another (6 cages). In this way, it was necessary to accept that we were dealing with a confused effect (room and sex), while the factor of interest of the experiment (protein level) was homogeneously represented in both rooms. Each cage was equipped with a hard-plastic floor. The complete feed was administered ad libitum in a hopper feeder with 4 places to ensure sufficient access to feed for all piglets; in each cage, there was a nipple drinker. The temperature of the air in the rooms was 23 °C ± 1 °C, whereas the humidity was not controlled.
Forty-six days after weaning, the piglets were moved to larger pens in the fattening area and housed in 12 pens (9 m2 each) of 12 piglets each. The floor was thermally insulated concrete. The pens were arranged in 2 rows of 6 pens (3 adjacent pens for males and 3 adjacent pens for females), one row for each protein level. The animals were given 1 kg of feed per animal and per day in two daily meals. In this phase, the administration of feed was limited to reduce the risk of diarrhea related to the stress of the change of housing. In the first two days, the meal was dry and distributed on the ground, gradually passing to a wet meal in the trough over the next three days. In each pen, the water was still available through a nipple drinker. The assignment of the treatment to the pens followed the criterion of minimizing the possibility of mixing feces from pigs fed different protein levels. In the fattening area, 21 °C was always ensured during the experiment.
The effects of dietary protein level on piglet growth, health status, and feces microbiota were considered for the following periods (Table 1):
-
Period I: From the start of the experiment until the change of feed;
-
Period II: From the change of feed until the change of housing;
-
Period III: From the change of housing to the end of the post-weaning period (end of the experiment).

2.3. Growth Parameters

The animals were weighed individually at the start of the experiment, at the day of diet change, at the day of change in housing, and at the end of the experiment. For each period, average daily gain (ADG = [body weight at the end of the period—body weight at the beginning of the period]/day), average daily feed intake (ADFI = feed consumption in the period/day), and feed conversion rate (FCR = ADFI/ADG) were calculated. Since feed consumption was known only at the cage/pen level, the values of the ADFI and FCR variables were not known at the individual level and thus were calculated at the cage/pen level. For homogeneity, the ADG values, although individually known, were also processed at the cage/pen level, with six replicates in total for each treatment.

2.4. Diarrhea Scores and Corrective Interventions

The health of the piglets was monitored daily. A score was assigned to each cage/pen based on the number of cases and the extent (mild, medium, severe) of diarrheal phenomena in piglets, visually assessed from the consistency of the feces (Table 4). For each growth period, individual diarrhea scores were summed for each treatment and related to the period’s total diarrhea score.
Piglets suffering from diarrhea before the change of diet (Table S1) were treated (Table S2) parenterally with the antibiotics enrofloxacin or marbofloxacin. No antibiotics were administered between the time of the diet change and the date of transfer to the pens because there were no cases of diarrhea. After the transfer, all individuals were treated orally with colistin sulfate, starting 5 days after the transfer and for 8 days. It was decided to resort to oral mass therapy because the appearance of overt diarrhea (score 4 or higher) occurred five days after the moving, in four out of six boxes of the HP treatment and in one out of six boxes of the LP treatment (Table S3). No treatment was applied in the last 12 days before the third and final sampling of feces.

2.5. Feces Chemical Characterization

Feces samples were collected at the end of each growth period by piglet rectal ampoule stimulation. For each cage/pen, individual samples were pooled into a composite sample. Samples were immediately frozen and stored at −20 °C until analysis.
Dry matter, organic matter, total (Kjeldahl) nitrogen and ammonium nitrogen contents, and pH, were determined according to the APHA methods [16]. Crude fiber (CF) and fiber fractions were determined on fecal samples dried at 60 °C. Crude fiber was determined according to [17]. Hemicellulose and cellulose concentrations were estimated by determining neutral-detergent (NDF) and acid-detergent (ADF) fiber fractions and acid-detergent lignin (ADL) according to [18]. The difference between NDF and ADF is an estimate of the hemicellulose content; that between ADF and ADL of the cellulose content.
For volatile fatty acid determination, 1 g of the sample was diluted with 3 mL distilled water, then centrifuged at 4000 rpm for 15 min. The supernatant was used for the analyses. Half mL of sample supernatant was added to 0.25 mL 4% H3PO4 and 0.25 mL internal standard to a final volume of 1 mL. A microliter of this mixture was injected in the injection port of the gas-chromatograph (Shimadzu GC 2010 Pro), equipped with a NukolTM capillary column (Supelco, cat. no. 24107), 30 m × 0.25 mm internal diameter, 0.25 μm film thickness. Total volatile fatty acid content (mg L−1) was calculated as the sum of the individual concentrations of acetic, propionic, butyric and iso-butyric, valeric and iso-valeric, and caproic and iso-caproic acids.

2.6. DNA Extraction, Library Construction, and Sequencing

Total DNA was extracted from the fecal samples after thawing using the QIAamp PowerFecal Pro DNA Kit (QIAGEN, The Netherlands) according to the manufacturer’s instructions. The V3-V4 regions of the 16S rRNA gene were amplified using the 341F (5′-CCTACGGGNGGCWGCAG-3′) and 805Rmod (5′-GACTACNVGGGTWTCTAATCC-3′) (based on [19], with degenerate bases) primers.
Library construction and sequencing were performed at the Sequencing Platform, Fondazione Edmund Mach, Italy. More in detail: each sample was amplified by PCR using a 25 µL reaction mixture with 1 µM of each primer. More in detail, 12.5 µL of 2× KAPA HiFi HotStart ReadyMix and 10 µL forward and reverse primers, were used in combination with 2.5 µL of template DNA (5 ng/µL). The PCR reactions were carried out by GeneAmp PCR System 9700 (Thermo Fisher Scientific) and the following cycling conditions: initial denaturation step at 95 °C for 3 min (one cycle); 25 cycles at 95 °C for 30 s, 55 °C for 30 s, 72 °C for 30 s; final extension step at 72 °C for 5 min (1 cycle).
The amplification products were checked on 1.5% agarose gel and purified using the CleanNGS beads (CleanNA, Waddinxveen, The Netherlands) following the manufacturer’s instructions. Afterward, a second PCR was used to apply dual indices and Illumina sequencing adapters Nextera XT Index Primer (Illumina), by 7 cycles PCR (16S Metagenomic Sequencing Library Preparation, Illumina). The amplicon libraries were purified using the CleanNGS beads (CleanNA, The Netherlands), and the quality control was performed on a Typestation 2200 platform (Agilent Technologies, Santa Clara, CA, USA). Finally, all barcoded libraries were pooled in an equimolar way and sequenced on an Illumina® MiSeq (PE300) platform (MiSeq Control Software 2.5.0.5 and Real-Time Analysis software 1.18.54.0). A total of 3.093.548 raw reads were detected across the samples by the Illumina MiSeq sequencing platform (PE300) (Illumina, Santa Monica, CA, USA).

2.7. Statistical Analysis

The estimate of the effect of the protein level in the diet on growth performance was carried out by means of a one-factor analysis of variance. The effect of the sex/room factor was included in the block effect. Values of F with p > 0.05 were considered not significant (NS).
The analysis of variance (ANOVA) for the effect of diet on diarrhea incidence was applied to the sum of the scores of the period for each treatment replication. Since in the second period the sum of the scores was very low, for the purposes of ANOVA, the first two periods were merged into a single period.
Two-way ANOVA (fixed sources of variation: time of sampling, protein level, time of sampling × protein level) was applied to operational taxonomic units (OTU) percentages to estimate the effect of diet and growth period on the relative abundance of phyla, families, and genera in the analyzed samples, using the procedure MIXED, SAS language [20]. A threshold equal to 0.1% of the total reads was adopted to include the phylum, family, or genus in the analysis. Mean multiple comparisons were performed using the statement LSMEANS and the Tukey HSD test.
The same two-way ANOVA design was applied to the statistical analysis of feces composition.

2.8. Bioinformatic Analyses

Data were pre-processed using the MICCA v. 1.7 [21] pipeline and rarefied to an equal depth of 45.225 reads per sample. OTUs were created de novo by clustering sequences with 97% sequence identity and classified using the RDP [22] software version 2.11.
The alpha diversity of the populations, the relative abundance (%) of microbial components down to the family and sex level, and their grouping based on the sources of variation were estimated. Alpha diversity is an index of the richness (number) and diversity (relative abundance) of OTUs in a population. The richness of species is indicated by the total number of OTUs (“Observed”) in the microbial community: the higher the number, the more species are present. The CHAO1 index estimates the richness of species, giving more weight to the less abundant ones. The value of CHAO1 is at least equal to “Observed” and increases as the number of rarer species increases. It can be calculated as follows:
CHAO1 = Sobs + F1(F1 − 1)/(2 × (F2 + 1))
where Sobs is the number of observed species and F1 and F2 are the count of singletons and doubletons, respectively.
The Shannon index is calculated as follows:
Shannon Index = −∑(pi ln(pi))
where: Σ is the summation from 1 to the total number of OTUs, and pi is the proportion of the community represented by the OTU i. It increases with increasing species richness, uniformity, and uncertainty of the estimate.
The samples were grouped for compositional similarity (beta diversity) using Principal Coordinate Analysis (PcoA), which is a multivariate method of data analysis used to explore and to visualize similarities or dissimilarities of data [23].

3. Results

3.1. Growth Performance

The piglets fed HP level showed a greater ADG (p < 0.01) than those fed LP (Table 5) in the first 25 days of the experiment until the change of diet, while the increases were the same for the two protein levels in the period from the change of diet to the change of housing. The difference remained significant (p < 0.05) during the entire phase in the cages. The FCR value was also significantly better in HP. Conversely, ADFI was not significantly different in piglets fed different protein levels. In the pen housing, no differences were detected between the two treatments as the feed was rationed. The body weight of the piglets at the end of the post-weaning period was not different in the two diets.

3.2. Health Status

Diarrhea cases started to occur in the early post-weaning period (Table S1). They were concentrated in the period between weaning and change of feed (Period I; score summation: 107 out of 234, i.e., 45.7% of the total; Table 6) and in the period between change of housing and the conclusion of the post-weaning period (Period III; 121 out of 234: 51.7% of the total). In Period II, overall, feces had normal consistency, as well as in the first and last part of Period III (Tables S1 and S3).
The overall incidence of diarrhea in the LP treatment was 28.6% of the total (67 out of 234 scores) and 71.4% in the HP treatment. Specifically, from weaning until feed change (Period I), the diarrhea scores in the LP treatment were 15.0% of the total (16 out of 107); after feed change (Period II), they were 16.7% of the total (1 out of 6), while after the change of housing (Period III) they rose to 41.3% (50 out of 121). The effect of the dietary protein level on diarrhea score summations was highly significant (p < 0.01) until change of housing (Period I + Period II), whereas it was not significant (p = 0.140) from the change of housing until the end of the experiment (Period III).
Poor feces consistency was noted in all the boxes in the HP treatment, starting from the twelfth day of the experiment (Table S1). The phenomenon initially extended to the whole pen in three out of six pens and then progressively became reduced, presumably due to therapeutic interventions (Table S2), until it disappeared two days after the change of feed.

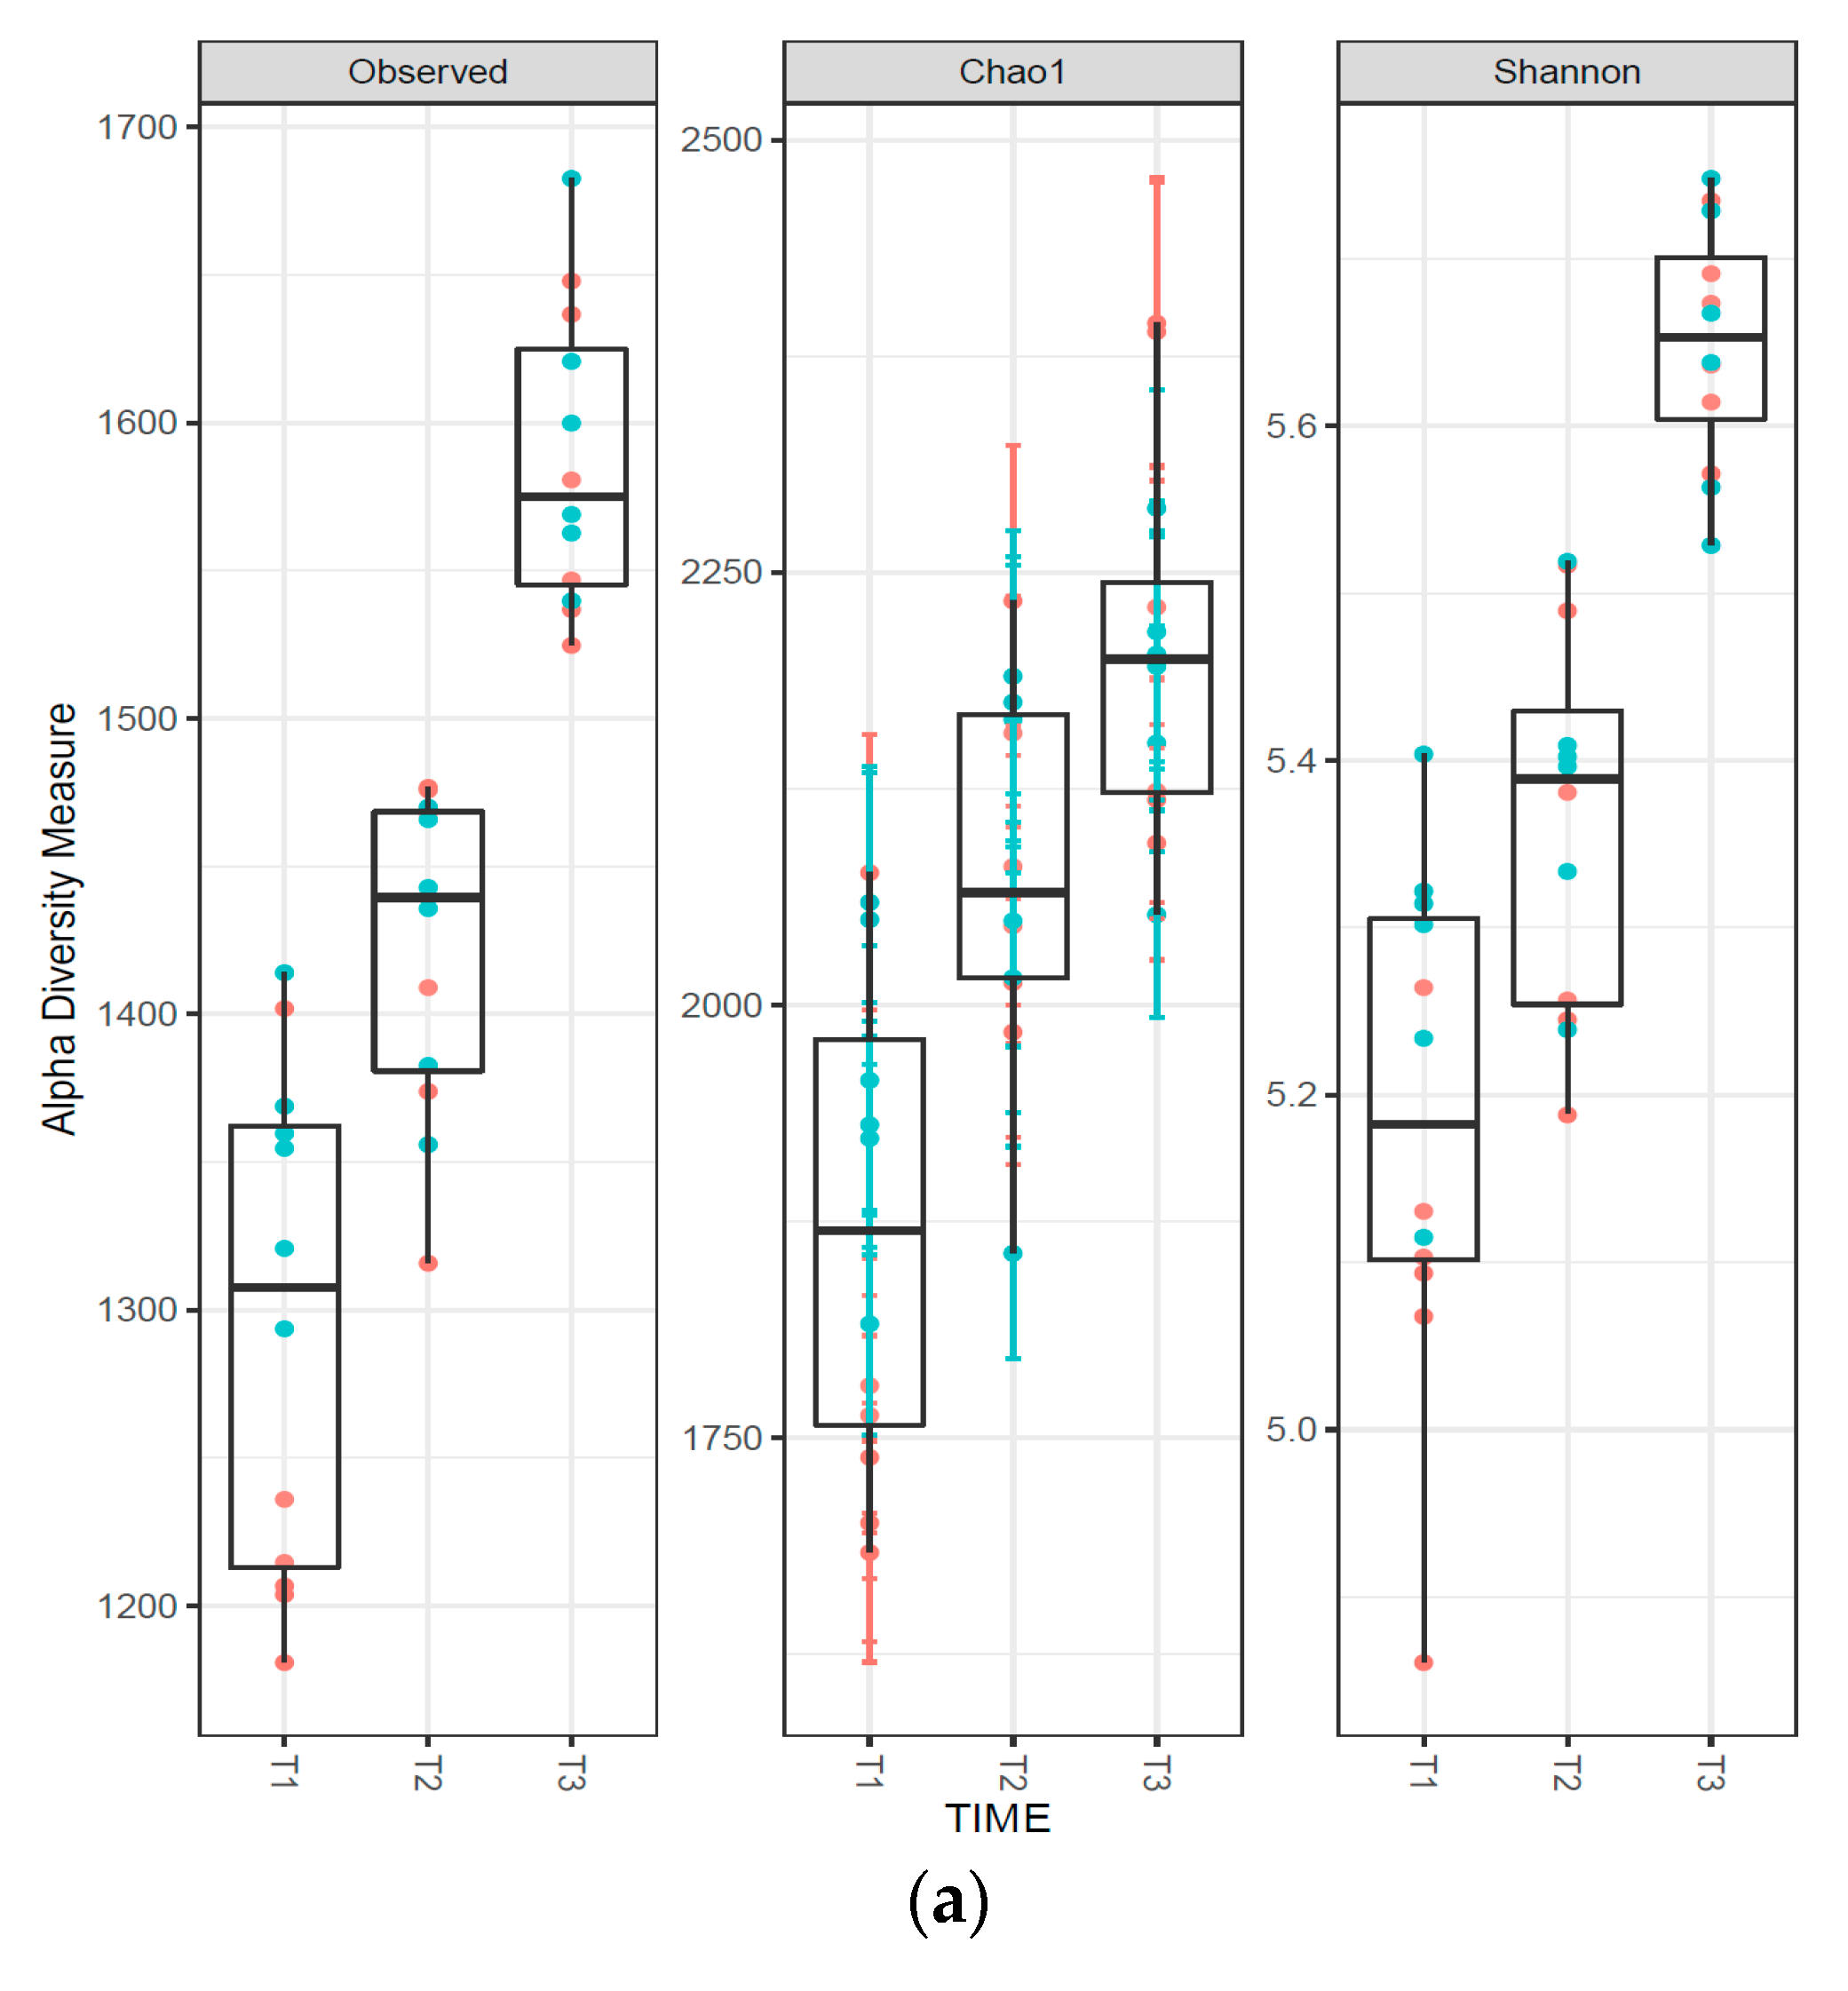
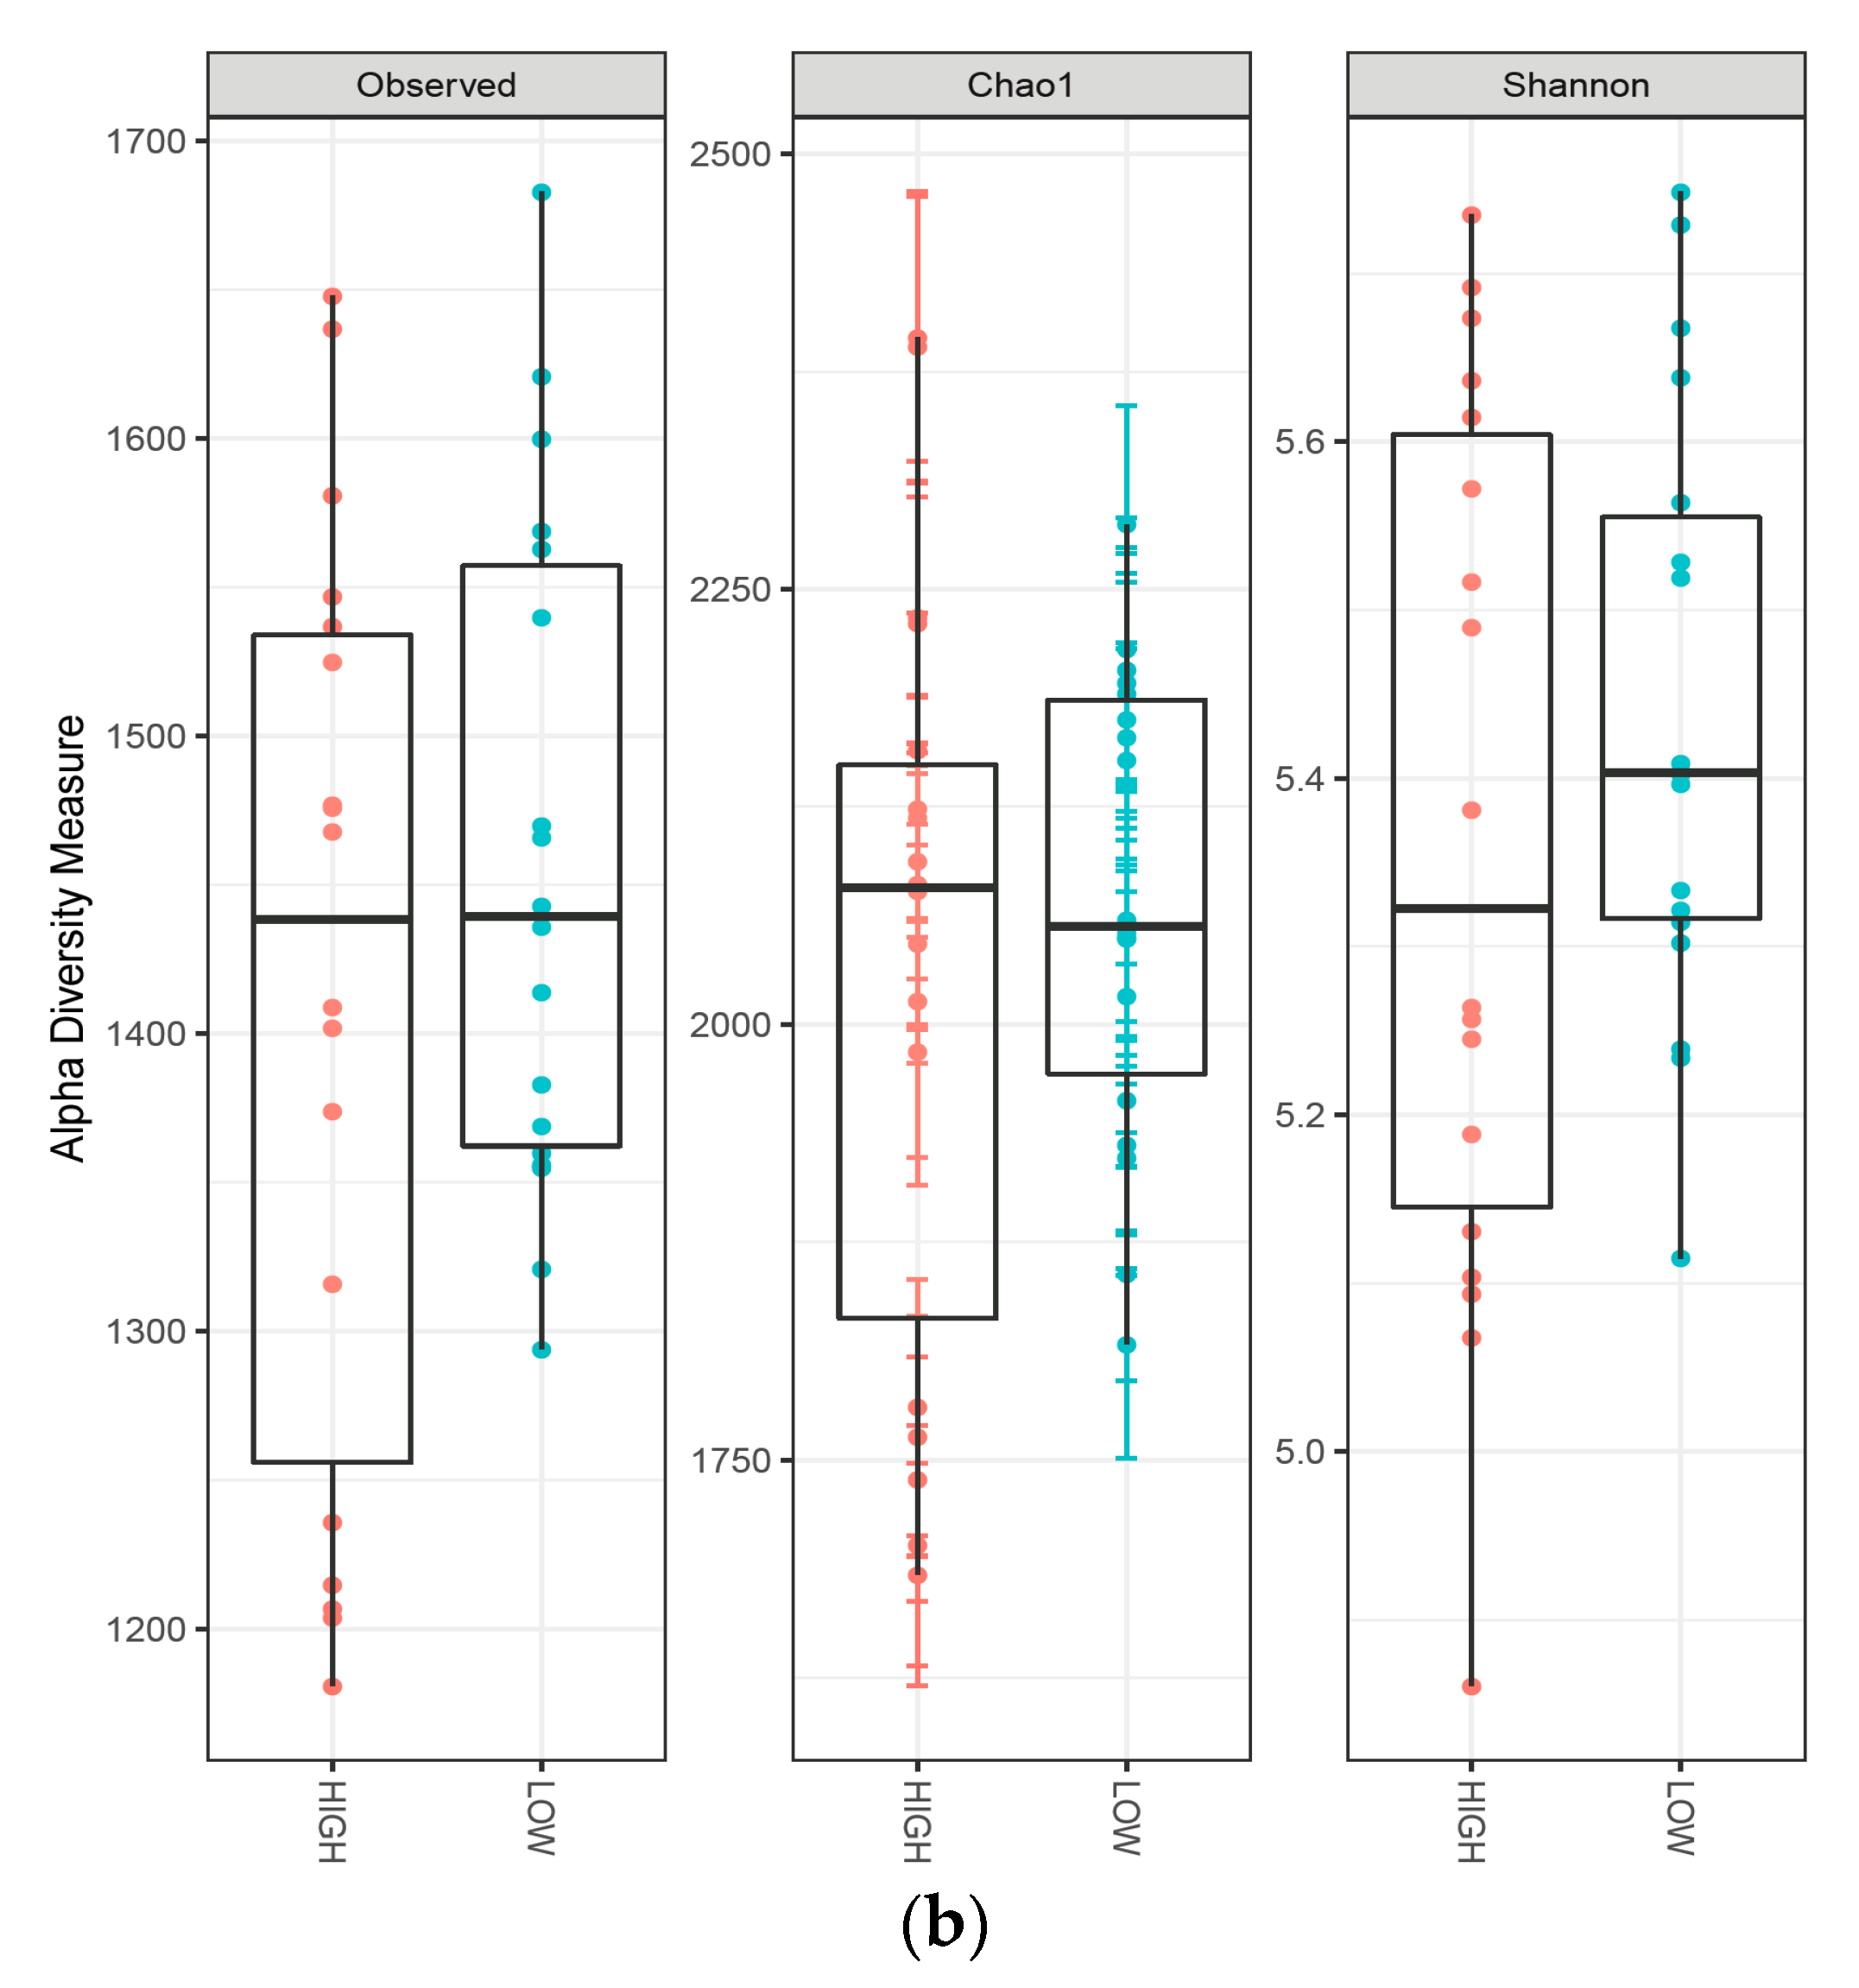
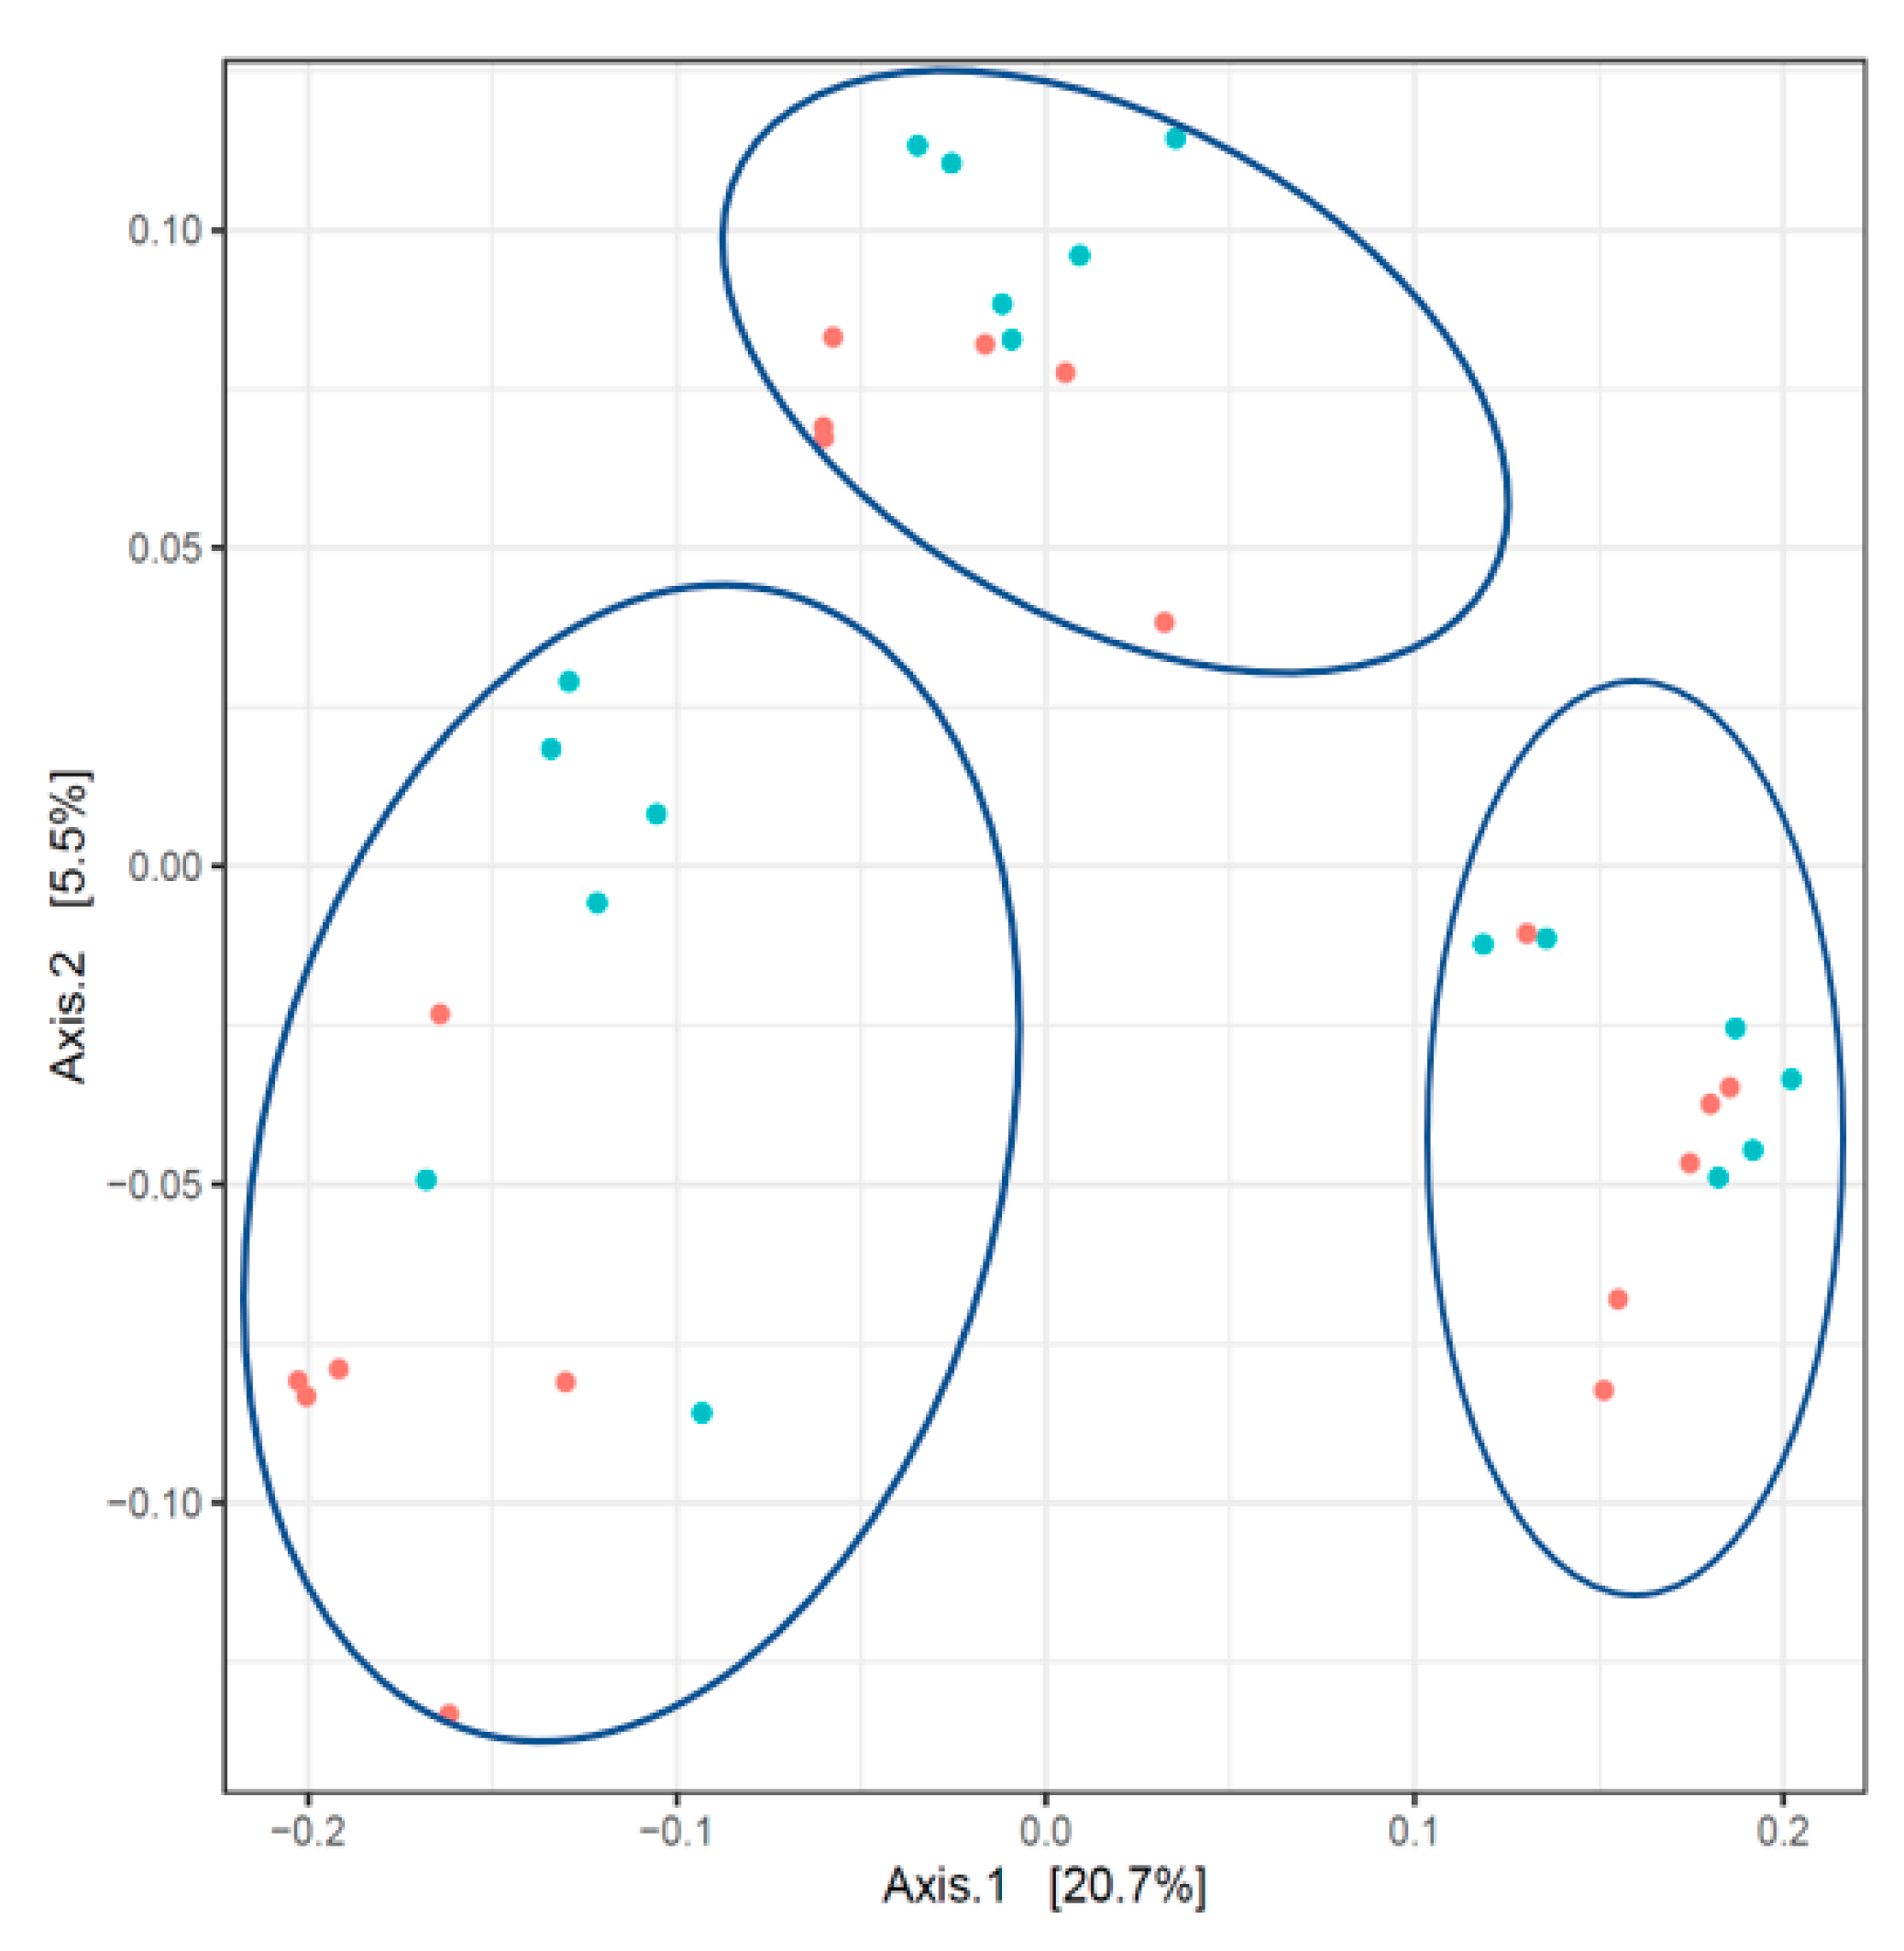
3.3. Composition of the Fecal Microbiota

The alfa diversity of the microbiota (intra-sample diversity) increased after the change of feed and further increased after the change of housing (Figure 1a), while it was not influenced by the protein level in the diet (Figure 1b).
The analysis of beta diversity (inter-sample diversity) using the PCoA tool allowed the clustering of the fecal samples into three groups, corresponding to the three times of sampling (Figure 2). The protein level in the diet allowed only partial separation of the treatments.
The most represented phyla in the piglet fecal samples (Table 7) were Bacteroidetes and Firmicutes, which together accounted for 90.6% of reads. The relative abundance of phyla changed in relation to the sampling date: at the first sampling, 25 days after weaning, Firmicutes and Actinobacteria were more abundant than in the two subsequent samplings, whereas the other classified phyla: Bacteroidetes, Spirochaetes, Proteobacteria, and Fibrobacteres were more abundant in the two samplings following the first, without significant differences between the second sampling, at the end of a period characterized by a change of feed, and the third sampling, at the end of a period that had begun with the change of housing. Fibrobacteres, Proteobacteria, and Spirocheaetes were, on average, more represented in the feces of piglets on a low-protein diet, whereas Firmicutes were more abundant in the feces of piglets on a high-protein diet.
Overall, the most represented bacterial families were: Prevotellaceae, Lachnospiraceae, Ruminococcaceae, and Porphyromonadaceae (65.1% of the total reads). While the influence of the sampling time was evident, the same cannot be said for that of the treatment (Table S4). Low protein levels in the diet were associated with a higher abundance of Fibrobacteraceae, Succinivibrionaceae, Sutterellaceae, and Spirochetaceae, whereas Firmicutes-belonging families prevailed in the HP fecal samples: Lachnospiraceae and Eubacteriaceae were more abundant along all the post-weaning period, whereas Erisipelotrichaceae, Clostridiaceae 1, and Peptostreptococcaceae were more abundant only in the first sampling event. Lactobacillaceae were the only Firmicutes more abundant in the feces of piglets on a low-protein diet and only in the first sampling event (significant interaction effect: Sampling time × Protein level). A few classified families were little or not at all influenced by both the period of growth and the protein level; among these, Enterobacteriaceae.
Among the classified genera, the most abundant were Prevotella (27.2%), followed by Clostridium sensu strictu (3.9%), Lactobacillus (3.3%), Alloprevotella (3.2%), Treponema (3.1%) (Table S5). Selected genera were more represented in the families significantly influenced by the dietary protein level, alone or in interaction with the sampling time (Table 8). Lactobacillus and Treponema were more represented in the LP fecal microbiota, whereas Roseburia, Blautia, and some Clostridium genera were more abundant in HP.

3.4. Feces Composition

Almost all the traits analyzed varied significantly over time (Table 9). More specifically, the concentration of dry matter, organic matter, crude fiber, and fiber fractions increased over time, whereas total and ammonium nitrogen concentrations decreased. The pH slightly increased after the feed change. The dietary protein level also affected the feces composition. Piglets fed low protein had feces that were richer in dry and organic matter and lower in total and ammonium nitrogen all over the experiment period. Even though crude fiber concentration was not affected by the dietary protein level, however, the fiber fractions were. In fact, hemicellulose and cellulose concentrations were higher in the LP fecal samples.
As for volatile fatty acids, the concentrations of propionic, valeric, and especially isovaleric acid slightly increased after the change of feeding. No effect on the protein level was detected, except for the isovaleric acid concentration, which tended to be lower in low-protein diets.

4. Discussion

4.1. Dietary Protein Level, Growth Performance, and Susceptibility to PWD

In our experiment, the low protein level negatively affected the growth of the piglets (ADG and FCR) only in the first post-weaning period (up to the change of diet), whereas it had a clear positive impact on diarrhea intensity reduction. Literature on the matter reports contrasting results, as also highlighted by Wang et al. [24]. Heo et al. [12] reported a higher incidence of PWD when feeding weaned piglets at a high (24.3%) compared with a low (17.3%) CP diet. Wen et al. [25] observed a higher incidence of PWD for piglets fed higher protein levels (up to 23%). Rattigan et al. [26] obtained contrasting results by working in sanitary vs. unsanitary conditions. Reducing the dietary CP level did not affect growth performance; however, in sanitary conditions, it increased the Enterobacteriaceae abundance in the colon and the incidence of diarrhea occurrence, whereas the opposite occurred in unsanitary conditions. Limbach [27] tested the effect on growth and PWD incidence in piglets fed soybean-maize diets at three protein levels (22% AA-balanced, 19% AA-balanced, and 16% protein AA-unbalanced) and concluded that low CP diets may be used for the initial post-weaning period to reduce piglet susceptibility to PWD without largely impacting growth performance. Lynegaard et al. [28] overall reduced CP in the first weaning phase (6–9 kg) from 19.1% to 16.6 and 14%, and from 18.4% to 16.2–17.4%, in the second phase (9–15 kg), depending on the treatment, while they left the protein almost constant in the third phase (15–30 kg) of growth. Under these conditions, they observed a decrease in PWD incidence for treatments with reduced dietary protein, as well as lower ADG and FCR values in piglets fed lower protein levels up to 15 kg body weight. The disadvantage, especially in terms of ADG, also remained in the following period. In their experiment, however, the reduction of CP in the early post-weaning growth period was more pronounced than in our experiment. According to [29], CP levels too low (i.e., 3% below average: 17%) are considered harmful in consideration of maladaptive changes to small intestinal morphology and pepsin activity in weaned piglets.

4.2. Piglet Fecal Microbiota in the Post-Weaning Period

The observed increase in the microbiota’s alfa diversity during piglet growth has also been reported by other authors [30], and it can be linked to changes in diet as well as to the progressive maturation of the intestinal system [31]. On the contrary, dietary protein levels have been reported not to influence alpha diversity in pigs [32,33]. Our results confirm these findings.
The most represented phyla (Table 7) are Bacteroidetes, Firmicutes, Spirochaetes, and Proteobacteria (96.9% relative abundance), and the most abundant bacterial families: Prevotellaceae, Lachnospiraceae, Ruminococcaceae, and Porphyromonadaceae in the piglet fecal samples of this experiment are those recurring in the feces of healthy piglets [34,35]. Clostridium sensu stricto, Roseburia, Paraprevotella, Clostridium XIVa, and Blautia have been reported as major representative genera after weaning [36,37].
In general, the results in the literature refer to piglets stressed on purpose or younger than those in this experiment. The considered microbiota is more often that of the intestinal system, different from the fecal one [38]. In our experiment, we considered the microbiota of the feces of piglets raised in protected conditions, which should be the most likely or, in any case, desired in real farms. This protection has been applied both at the environmental level (attention to the absence of causes of stress) and at the health level (preventive interventions with drugs). This may explain the low presence of Enterobacteriaceae, which is normally associated with stressful conditions.

4.3. Dietary Protein Level, Composition of the Fecal Microbiota, and PWD Susceptibility

The effect of dietary protein level on the composition of gut microbiota has mainly been studied for finishing pigs. Moderate protein levels in the diet have been found to modify the gut microbiota composition and to improve the ileal barrier function [39,40]. On the contrary, information on piglets is scarce, especially when referring to the composition of the fecal microbiota. In our experiment, differences in the composition of the fecal microbiota due to the protein level in the diet were found above all in the first sampling, that is, at the end of the first period after weaning and before the change of feed, just when the effect of protein intake on the incidence of diarrhea phenomena was most evident. Given this coincidence, we can think of associating the higher susceptibility of the piglets to PWD with the greater presence of Firmicutes-belonging families (with the exclusion of Lactobacillaceae), which were more abundant in T1 in the fecal microbiota of piglets fed HP diets. Conversely, a lower incidence of PWD can be associated with the prevailing abundance in LP diets of families belonging to Lactobacillaceae (gen. Lactobacillus), Fibrobacteraceae (gen. Fibrobacter), Succinivibrionaceae, and Spirochetaceae (gen. Treponema).
Yang et al. [30] compared the fecal microbiota of healthy piglets and that of diarrheal piglets in three stages of growth: lactation, intermediate stage, and weaning (solid diet for piglets) and noted that, with the transition to solid feeding, the incidence of Lactobacillus and E. coli decreased while that of Prevotella increased. They related reduced numbers of Bacteroides, Ruminococcus, Bulleidia, and Treponema, which are responsible for the digestion of solid foods, to the onset of post-weaning piglet diarrhea.
The genera prevalent in the fecal microbiota of piglets fed HP diets, such as Roseburia, Blautia, Eubacterium, and selected Clostridium species, are commonly found in piglet fecal microbiota and are all fermentative. Their greater abundance in the HP feces can be the consequence of the incomplete digestion of complex fermentable substrates because less digestible feed components are more available for microbial activities in the gut terminal tract. The greater presence of Clostridia in the microbiota of piglets fed HP diets can be related to their ability to metabolize amino acids [4]. Conversely, the increased presence of Fibrobacter in low-protein diets can be related to the availability of higher amounts of undigested cellulose in the final intestinal tract. In fact, Fibrobacter is a fibrolytic bacterial species commonly present in the pig intestinal microbiota [41], although it is a typical colonizer of the rumen. Fibrobacter uses glucose, cellulose, and cellobiose as carbon and energy sources with the production of succinate, acetate, and formate [42]. Fibrobacter and Treponema have been reported as more abundant in diets of ruminants fed with higher amounts of lignocellulosic components [43].

4.4. Dietary Protein Level and Feces Composition

Feces composition clearly depends on the type of food ingested and on the use that the animal can make of the food. The less digestible the food, and the worse the digestive abilities of the animal, the higher the quantity of feed that remains undigested in the feces. Higher crude fiber contents accompanying the change of feed can be the reason for worse digestibility: a higher crude fiber content was, in fact, found in the piglet feces at the second and third sampling (i.e., at the change of housing and at the end of the post-weaning period).
An important side effect of the reduction in dietary protein was the lower concentration of nitrogen in the feces, possibly because a greater quantity of ingested nitrogen was assimilated instead of wasted. This result has been reported by several authors. Zhao et al. [44] found a significant reduction in N excretion in 90-day-old pigs fed protein diets 3.5% lower than standard. Yang et al. [45] observed a linear decrease in fecal total nitrogen for decreasing dietary protein levels in the diet of growing pigs.
Other components in the diet may interfere with nitrogen metabolism. In fact, in maize, the nitrogen-free extractives consist of starch, whereas in soybeans, the starch is less than 1%, and soluble carbohydrates are mainly sucrose, raffinose, and stachyose [46]. High amounts of raffinose and stachyose from soybean in the diet are supposed to reduce the digestibility of nitrogen and amino acids in growing pigs [47]. Therefore, in HP-fed piglets, the greater nitrogen excretion can also derive from a lower digestibility due to the higher percentages of soybean oligosaccharides. Interestingly, Zhang et al. [48] showed a higher incidence of diarrhea cases in piglets fed with soybean flour as is or with added stachyose compared to the control consisting of corn with concentrated soybean protein.
Short-chain fatty acids are final metabolites of the intestinal microbiota, produced mainly in the large intestine, where they are used by mono-gastrics as a source of energy. The energy contribution of the SCFA in pig metabolism is important. Weaning has been reported to affect the concentrations of SCFA in the intestine [49]. In our experiment, the dietary protein level did not affect the SCFA content, apart from the case of isovaleric acid, which was less abundant in LP diets.
Some confirmations and some interesting insights emerge from this experience. The first of these is whether the body weight differences found in the experiment cancel out during the subsequent stages of growth of the animals and, once this has been established, how far one can go with the reduction of the protein content in particularly critical phases (first 15 days after weaning, sudden changes in the environment) without compromising the subsequent productive career. The second interesting point is to investigate the evolution of the microbiota to identify moments in which an analysis of this can serve as an indicator of the evolution of the state of health of the gastrointestinal system. From our results, it appears that the phase immediately following weaning is the most subject to changes in the fecal microbiota composition and most suitable for earlier identification of possible stress conditions. Everything must be understood in terms of optimizing individual and mass therapeutic interventions in order both to improve the profitability of breeding and to reduce the risk of the appearance of antibiotic-resistance phenomena.

5. Conclusions

This research confirms that a reduction in the protein content of feed can reduce the appearance and severity of gastrointestinal syndromes in piglets in particularly stressful stages of rearing (removal from the mother, change of housing) while only marginally affecting growth performance. Low-protein diets, resulting in excreta with lower quantities of nitrogen than those of standard diets, may allow for potential environmental benefits.
The variations in the microbiota are largely determined by the growth phase, which in turn is accompanied by an evolution of the diet. The different protein levels at the same age caused slight but significant variations in some components of the intestinal microbiota. Further research is needed to ascertain whether microorganisms found in low-protein diets can be considered indicators of lower susceptibility to diarrhea in piglets.

Supplementary Materials

The following supporting information can be downloaded at: https://www.mdpi.com/article/10.3390/ani13050795/s1, Table S1: Number of interventions with parenteral therapy on piglets, from the onset of diarrhea to change of housing; Table S2: Diarrhea scores from the start of the experiment until the change of housing; Table S3: Diarrhea scores from the change of housing until the end of the experiment; Table S4. Bacterial families with relative abundance greater than 0.1% in the piglet fecal microbiota, depending on sampling time and protein level; Table S5: More abundant (>1% reads) bacterial genera in the fecal microbiota of weaning piglets.

Author Contributions

Conceptualization, M.G., L.B. and G.D.C.; methodology, G.D.C. and L.B.; validation, G.D.C. and D.B.; formal analysis, R.M. and M.P.; investigation, V.F.; resources, M.G. and L.B.; data curation, V.F. and R.M.; writing—original draft preparation, G.D.C., R.M. and L.B.; writing—review and editing, R.M. and G.D.C.; visualization, R.M.; supervision, L.B.; project administration, V.F.; funding acquisition, L.B. All authors have read and agreed to the published version of the manuscript.

Funding

This research was funded by the ASSOCIAZIONE NAZIONALE ALLEVATORI SUINI (www.anas.it; accessed on 19 February 2023) within the framework of an agreement between ANAS and CREA to evaluate the effect of different dietary protein levels on piglets from weaning to 30 kg.

Institutional Review Board Statement

Ethical review and approval were waived for this study due to the fact that no practices were applied likely to cause pain, suffering, distress or prolonged damage equivalent to or greater than that caused by inserting a needle. In fact, our trial consisted in comparing diets with different levels of protein, within a range that well represents the normal uses in Italian pig farming. The only practice different from those normally used on farms was the sampling of feces from the rectum. It is a minimally invasive and very fast manipulation, likely to cause less pain, suffering or distress than that caused by inserting a needle. No animals were slaughtered in the course of the trial.

Informed Consent Statement

Not applicable.

Data Availability Statement

Data are contained within the article or supplementary material.

Acknowledgments

Authors wish to thank Antonio Marino, Ciro Vasmara, Gianni Marchetto, and Anna Orsi for their valuable technical support. The activity of Rosa Marchetti was carried out in the context of her association with CREA-ZA.

Conflicts of Interest

The authors declare no conflict of interest.

References

  1. Gao, J.; Yin, J.; Xu, K.; Han, H.; Liu, Z.M.; Wang, C.Y.; Li, T.J.; Yin, Y.L. Protein level and infantile diarrhea in a postweaning piglet model. Med. Inflamm. 2020, 2020, 1937387. [Google Scholar] [CrossRef]
  2. Kim, J.C.; Hansen, C.F.; Mullan, B.P.; Pluske, J.R. Nutrition and pathology of weaner pigs: Nutritional strategies to support barrier function in the gastrointestinal tract. Anim. Feed Sci. Technol. 2012, 172, 3–16. [Google Scholar] [CrossRef] [Green Version]
  3. de Lange, C.F.M.; Pluske, J.; Gong, J.; Nyachoti, C.M. Strategic use of feed ingredients and feed additives to stimulate gut health and development in young pigs. Livest. Sci. 2010, 134, 124–134. [Google Scholar] [CrossRef]
  4. Zhang, H.; Wielen, N.V.; Hee, B.V.; Wang, J.; Hendriks, W.; Gilbert, M. Impact of fermentable protein, by feeding high protein diets, on microbial composition, microbial catabolic activity, gut health and beyond in pigs. Microorganisms 2020, 8, 1735. [Google Scholar] [CrossRef]
  5. Gaskins, H.R. Intestinal bacteria and their influence on swine growth. In Swine Nutrition; Lewis, A.J., Southern, L.L., Eds.; PCRC Press LLC: Boca Raton, FL, USA, 2000; pp. 585–608. [Google Scholar]
  6. Macfarlane, G.T.; Macfarlane, S. Bacteria, colonic fermentation, and gastrointestinal health. J. AOAC Int. 2012, 95, 50–60. [Google Scholar] [CrossRef]
  7. Opapeju, F.O.; Rademacher, M.; Blank, G.; Nyachoti, C.M. Effect of low-protein amino acid-supplemented diets on the growth performance, gut morphology, organ weights and digesta characteristics of weaned pigs. Animal 2008, 2, 1457–1464. [Google Scholar] [CrossRef] [Green Version]
  8. Rhouma, M.; Fairbrother, J.M.; Beaudry, F.; Letellier, A. Post weaning diarrhea in pigs: Risk factors and non-colistin-based control strategies. Acta Vet. Scand. 2017, 59, 31. [Google Scholar] [CrossRef] [Green Version]
  9. Fouhse, J.M.; Zijlstra, R.T.; Willing, B.P. The role of gut microbiota in the health and disease of pigs. Anim. Front. 2016, 6, 30–36. [Google Scholar] [CrossRef] [Green Version]
  10. Gresse, R.; Chaucheyras-Durand, F.; Fleury, M.A.; Van de Wiele, T.; Forano, E.; Blanquet-Diot, S. Gut microbiota dysbiosis in postweaning piglets: Understanding the keys to health. Trends Microbiol. 2017, 25, 851–873. [Google Scholar] [CrossRef]
  11. Guevarra, R.B.; Lee, J.H.; Lee, S.H.; Seok, M.J.; Kim, D.W.; Kang, B.N.; Johnson, T.J.; Isaacson, R.E.; Kim, H.B. Piglet gut microbial shifts early in life: Causes and effects. J. Anim. Sci. Biotechnol. 2019, 10, 1. [Google Scholar] [CrossRef] [Green Version]
  12. Heo, J.M.; Kim, J.C.; Hansen, C.F.; Mullan, B.P.; Hampson, D.J.; Pluske, J.R. Feeding a diet with decreased protein content reduces indices of protein fermentation and the incidence of postweaning diarrhea in weaned pigs challenged with an enterotoxigenic strain of Escherichia coli. J. Anim. Sci. 2009, 87, 2833–2843. [Google Scholar] [CrossRef] [Green Version]
  13. Rist, V.T.; Weiss, E.; Eklund, M.; Mosenthin, R. Impact of dietary protein on microbiota composition and activity in the gastrointestinal tract of piglets in relation to gut health: A review. Animal 2013, 7, 1067–1078. [Google Scholar] [CrossRef] [Green Version]
  14. Luise, D.; Chalvon-Demersay, T.; Lambert, W.; Bosi, P.; Trevisi, P. Meta-analysis to evaluate the impact of the reduction of dietary crude protein on the gut health of post-weaning pigs. Ital. J. Anim. Sci. 2021, 20, 1386–1397. [Google Scholar] [CrossRef]
  15. Van Milgen, J.; Dourmad, J.Y. Concept and application of ideal protein for pigs. J. Anim. Sci. Biotechnol. 2015, 6, 15. [Google Scholar] [CrossRef] [Green Version]
  16. APHA. Standard Methods for the Examination of Water and Wastewater, 18th ed.; American Public Health Association: Washington DC, USA, 1992. [Google Scholar]
  17. AOAC. Official Method 978.10-1979 (1996), Fiber (Crude) in Animal Feed and Pet Food. Available online: http://www.aoacofficialmethod.org/index.php?main_page=product_info&products_id=366 (accessed on 19 February 2023).
  18. Van Soest, P.J.; Robertson, J.B.; Lewis, B.A. Methods for dietary fiber, neutral-detergent fiber and non-starch polysaccharides in relation to animal nutrition. J. Dairy Sci. 1991, 74, 3583–3597. [Google Scholar] [CrossRef]
  19. Klindworth, A.; Pruesse, E.; Schweer, T.; Peplies, J.; Quast, C.; Horn, M.; Glöckner, F.O. Evaluation of general 16S ribosomal RNA gene PCR primers for classical and next-generation sequencing-based diversity studies. Nucleic Acids Res. 2013, 41, 1. [Google Scholar] [CrossRef]
  20. Littell, R.C.; Henry, P.R.; Ammerman, C.B. Statistical analysis of repeated measures data using SAS procedures. J. Anim. Sci. 1998, 76, 1216–1231. [Google Scholar] [CrossRef] [Green Version]
  21. Albanese, D.; Fontana, P.; De Filippo, C.; Cavalieri, D.; Donati, C. MICCA: A complete and accurate software for taxonomic profiling of metagenomic data. Sci. Rep. 2015, 5, 9743. [Google Scholar] [CrossRef] [Green Version]
  22. Wang, Q.; Garrity, G.M.; Tiedje, J.M.; Cole, J.R. Naïve Bayesian classifier for rapid assignment of rRNA sequences into the new bacterial taxonomy. Appl. Environ. Microbiol. 2007, 73, 5261–5267. [Google Scholar] [CrossRef] [Green Version]
  23. Goodrich, J.K.; Di Rienzi, S.C.; Poole, A.C.; Koren, O.; Walters, W.A.; Caporaso, J.G.; Knight, R.; Ley, R.E. Conducting a microbiome study. Cell 2014, 158, 250–262. [Google Scholar] [CrossRef] [Green Version]
  24. Wang, Y.; Zhou, J.; Wang, G.; Cai, S.; Zeng, X.; Qiao, S. Advances in low-protein diets for swine. J. Anim. Sci. Biotechnol. 2018, 9, 60. [Google Scholar] [CrossRef] [Green Version]
  25. Wen, X.; Wang, L.; Zheng, C.; Yang, X.; Ma, X.; Wu, Y.; Chen, Z.; Jiang, Z. Fecal scores and microbial metabolites in weaned piglets fed different protein sources and levels. Anim. Nutr. 2018, 4, 31–36. [Google Scholar] [CrossRef]
  26. Rattigan, R.; Sweeney, T.; Maher, S.; Ryan, M.T.; Thornton, K.; O’Doherty, J.V. Effects of reducing dietary crude protein concentration and supplementation with either laminarin or zinc oxide on the growth performance and intestinal health of newly weaned pigs. Anim. Feed Sci. Technol. 2020, 270, 114693. [Google Scholar] [CrossRef]
  27. Limbach, J.R. Reducing Crude Protein Levels in Diets Fed to Young Pigs to Optimize Growth Performance and Intestinal Health. Ph.D. Thesis, University of Illinois, Champaign, IL, USA, 2020. Available online: http://hdl.handle.net/2142/108563 (accessed on 24 March 2022).
  28. Lynegaard, J.C.; Kjeldsen, N.J.; Bache, J.K.; Weber, N.R.; Hansen, C.F.; Nielsen, J.P.; Amdi, C. Low protein diets without medicinal zinc oxide for weaned pigs reduced diarrhea treatments and average daily gain. Animal 2021, 15, 100075. [Google Scholar] [CrossRef]
  29. Yu, D.; Zhu, W.; Hang, S. Effects of low-protein diet on the intestinal morphology, digestive enzyme activity, blood urea nitrogen, and gut microbiota and metabolites in weaned pigs. Arch. Anim. Nutr. 2019, 73, 287–305. [Google Scholar] [CrossRef]
  30. Yang, Q.; Huang, X.; Wang, P.; Yan, Z.; Sun, W.; Zhao, S.; Gun, S. Longitudinal development of the gut microbiota in healthy and diarrheic piglets induced by age-related dietary changes. Microbiologyopen 2019, 8, e923. [Google Scholar] [CrossRef] [Green Version]
  31. Yu, D.; Zhu, W.; Hang, S. Effects of long-term dietary protein restriction on intestinal morphology, digestive enzymes, gut hormones, and colonic microbiota in pigs. Animals 2019, 9, 180. [Google Scholar] [CrossRef] [Green Version]
  32. Seradj, A.R.; Balcells, J.; Sarri, L.; Fraile, L.J.; de la Fuente, O.G. The impact of producing type and dietary crude protein on animal performances and microbiota together with greenhouse gases emissions in growing pigs. Animals 2020, 10, 1742. [Google Scholar] [CrossRef]
  33. Dou, S.; Gadonna-Widehem, P.; Rome, V.; Hamoudi, D.; Rhazi, L.; Lakhal, L.; Larcher, T.; Bahi-Jaber, N.; Pinon-Quintana, A.; Guyonvarch, A.; et al. Characterisation of early-life fecal microbiota in susceptible and healthy pigs to post-weaning diarrhoea. PLoS ONE 2017, 10, e0169851. [Google Scholar] [CrossRef] [Green Version]
  34. Guevarra, R.B.; Hong, S.H.; Cho, J.H.; Kim, B.R.; Shin, J.; Lee, J.H.; Kang, B.N.; Kim, Y.H.; Wattanaphansak, S.; Isaacson, R.E.; et al. The dynamics of the piglet gut microbiome during the weaning transition in association with health and nutrition. J. Anim. Sci. Biotechnol. 2018, 30, 9–54. [Google Scholar] [CrossRef] [Green Version]
  35. Chen, L.; Xu, Y.; Chen, X.; Fang, C.; Zhao, L.; Chen, F. The maturing development of gut microbiota in commercial piglets during the weaning transition. Front. Microbiol. 2017, 8, 1688. [Google Scholar] [CrossRef] [Green Version]
  36. Yang, Y.; Liu, Y.; Liu, J.; Wang, H.; Guo, Y.; Du, M.; Cai, C.; Zhao, Y.; Lu, C.; Guo, X.; et al. Composition of the fecal microbiota of piglets at various growth stages. Front. Vet. Sci. 2021, 8, 661671. [Google Scholar] [CrossRef]
  37. de Vries, H.; Smidt, H. Microbiota development in piglets. In The Suckling and Weaned Piglet; Chantal Farmer Editor; Wageningen Academic Publishers: Wageningen, The Netherlands, 2020; pp. 179–205. [Google Scholar] [CrossRef]
  38. Pollock, J.; Hutchings, M.R.; Hutchings, K.E.K.; Gally, D.L.; Houdijk, J.G.M. Changes in the ileal, but not fecal, microbiome in response to increased dietary protein level and enterotoxigenic Escherichia coli exposure in pigs. Appl. Environ. Microbiol. 2019, 85, e01252. [Google Scholar] [CrossRef] [Green Version]
  39. Fan, P.; Liu, P.; Song, P.; Chen, X.; Ma, X. Moderate dietary protein restriction alters the composition of gut microbiota and improves ileal barrier function in adult pig model. Sci. Rep. 2017, 7, 43412. [Google Scholar] [CrossRef] [Green Version]
  40. González-Prendes, R.; Pena, R.N.; Solé, E.; Seradj, A.R.; Estany, J.; Ramayo-Caldas, Y. Modulatory effect of protein and carotene dietary levels on pig gut microbiota. Sci. Rep. 2019, 9, 14582. [Google Scholar] [CrossRef] [Green Version]
  41. Varel, V.H.; Yen, J.T. Microbial perspective on fiber utilization by swine. J. Anim. Sci. 1997, 75, 2715–2722. [Google Scholar] [CrossRef] [Green Version]
  42. Stewart, C.S.; Flint, H.J. Bacteroides (Citrobacter) succinogenes, a cellulolytic anaerobic bacterium from the gastrointestinal tract. Appl. Microbiol. Biotechnol. 1989, 30, 433–439. [Google Scholar] [CrossRef]
  43. Xie, X.; Yang, C.; Guan, L.L.; Wang, J.; Xue, M.; Liu, J.X. Persistence of cellulolytic bacteria Fibrobacter and Treponema after short-term corn stover-based dietary intervention reveals the potential to improve rumen fibrolytic function. Front. Microbiol. 2018, 9, 1363. [Google Scholar] [CrossRef]
  44. Zhao, Y.; Tian, G.; Chen, D.; Zheng, P.; Yu, J.; He, J.; Mao, X.; Yu, B. Effects of varying levels of dietary protein and net energy on growth performance, nitrogen balance and faecal characteristics of growing-finishing pigs. R. Bras. Zootec. 2019, 48, e20180021. [Google Scholar] [CrossRef] [Green Version]
  45. Yang, Z.; He, T.; Bumbie, G.Z.; Hu, H.; Chen, Q.; Lu, C.; Tang, Z. Effects of dietary crude protein levels on fecal crude protein, amino acids flow amount, fecal and ileal microbial amino acids composition and amino acid digestibility in growing pigs. Animals 2020, 10, 2092. [Google Scholar] [CrossRef]
  46. Choct, M.; Dersjant-Li, Y.; McLeish, J.; Peisker, M. Soy oligosaccharides and soluble non-starch polysaccharides: A review of digestion, nutritive and anti-nutritive effects in pigs and poultry. Anim. Biosci. 2010, 23, 1386–1398. [Google Scholar] [CrossRef]
  47. Smiricky, M.R.; Grieshop, C.M.; Albin, D.M.; Wubben, J.E.; Gabert, V.M.; Fahey, G.C., Jr. The influence of soy oligosaccharides on apparent and true ileal amino acid digestibilities and fecal consistency in growing pigs. J. Anim. Sci. 2002, 80, 2433–2441. [Google Scholar] [CrossRef]
  48. Zhang, L.; Li, D.; Qiao, S.; Wang, J.; Bai, L.; Wang, Z.; Han, I.K. The effect of soybean galacto-oligosaccharides on nutrient and energy digestibility and digesta transit time in weanling piglets. Anim. Biosci. 2001, 14, 1598–1604. [Google Scholar] [CrossRef]
  49. Nakatani, M.; Inoue, R.; Tomonaga, S.; Fukuta, K.; Tsukahara, T. Production, absorption, and blood flow dynamics of short-chain fatty acids produced by fermentation in piglet hindgut during the suckling-weaning period. Nutrients 2018, 10, 1220. [Google Scholar] [CrossRef] [Green Version]
Figure 1. Box plots of the alpha diversity indexes (observed, Chao1 and Shannon) as a function of (a) sampling time and (b) protein level (high, red dots; or low, blue dots). T1, T2, and T3 correspond to fecal samplings after weaning and before the change of feeding, before the change of housing, and at the end of the experiment (end of the post-weaning period), respectively.
Animals 13 00795 g001aAnimals 13 00795 g001b
Figure 2. Principal coordinate analysis of the piglet fecal microbiota. Red dots: high protein level, blue dots: low protein level. Contour lines highlight the 3 sampling times, T1, T2, and T3, from left to right.
Animals 13 00795 g002
Table 1. Time sequence of events from weaning to the end of the experiment.
Growth PeriodEvent (Initial and Final of the Period)Time from the Start of the Experiment (Days)Piglet Age (Days)Measurement of Piglet Body WeightFecal Sampling
Weaning025+
Period I
Change of feed2550+T1
Period II
Change of housing4671+T2
Period III
End of post-weaning7095+T3
+ and – signs indicate that the actions have or have not been done, respectively.
Table 2. Growth phases based on piglet body weight and overall crude protein percentage in the diet, depending on growth phase and protein level.
Growth PhaseProtein Level (% CP)
HighLow
From the start of weaning to 15 kg (Period I and II)18.516.5
From 15 kg to the end of the experiment (Period III)16.514.5
Table 3. Feed ingredients, depending on the growth phase and dietary protein level.
Protein Level
Feed Composition, as Is 1 From 8 to 15 kg Body WeightFrom 15 to 30 kg Body Weight
HighLowHighLow
Ingredients
Corn %18.823.726.635.0
Barley %20.020.015.015.0
Expanded wheat %10.010.06.006.00
Soybean meal (48% CP 2)%8.872.738.433.07
Wheat middlings, durum%0.000.008.134.60
Bakery byproducts%8.008.004.004.00
Whey powder, sweet%6.006.000.000.00
Soybean protein concentrate (65% CP)%5.005.002.002.00
Mineral vitamin premix%5.005.002.502.50
Wheat bran, soft%4.235.004.004.00
Wheat%4.004.008.008.00
Wheat middlings, soft%0.000.008.008.00
Fish meal (68% CP)%3.003.002.002.00
Dextrose%2.502.501.001.00
Monodicalcium phosphate%1.571.640.000.21
Chicory pulp, dehydrated%1.201.201.001.00
Coconut oil%0.960.831.161.04
Soybean oil%0.000.000.500.50
Acidifiers%0.800.800.800.80
DL-Methionine%0.050.120.180.25
L-Valine%0.050.170.000.08
L-lysine HCl%0.010.220.470.68
L-tryptophan%0.010.040.050.09
L-threonine%0.000.020.140.23
Calculated values
Crude protein%18.516.616.514.6
Crude fat%5.005.004.504.50
Crude fiber%2.962.853.903.50
Ash%6.075.875.505.31
Digestible Energykcal kg−13472345033243320
Metabolizable Energykcal kg−13289327731763180
Net energykcal kg−12480251024012447
Lysine%1.401.401.201.20
Methionine%0.540.580.450.49
Methionine + Cystine%0.840.840.720.72
Threonine%0.920.840.720.72
Tryptophan%0.280.280.240.24
Valine%0.980.980.860.84
Isoleucine%0.780.650.680.56
Calcium%0.650.650.590.62
Phosphorus%0.780.770.500.50
1 Amino acid and phosphorus composition is reported as total content. 2 Crude protein.
Table 4. Scores for diarrhea incidence assigned to each cage/pen on the basis of the fraction of litter suffering from diarrhea and diarrhea intensity.
Fraction of Litter 1 Suffering from DiarrheaDiarrhea Intensity
MildMediumSerious
0000
1/3147
2/3258
3/3369
1 12 piglets per cage/pen.
Table 5. Average value of selected growth parameters during the experiment and significance of the difference between high-protein and low-protein diets (n = 6 per treatment).
Protein Level
Growth Parameter HighLowSignificance of the Difference
Initial body weight (kg)7.807.77NS
From weaning to change of housing
Period I 117.215.6NS
Period II 229.828.0NS
Period I + Period II23.521.8NS
Average daily gain (g)
Period I377313p < 0.01
Period II599593NS
Period I + Period II479440p < 0.05
Average daily feed intake (g)
Period I585536NS
Period II11811138NS
Period I + Period II857810NS
Feed conversion ratio (-/-)
Period I1.551.72p < 0.01
Period II1.971.92NS
Period I + Period II1.791.84p < 0.05
From change of housing to the end of post-weaning (period III) 3
Average daily gain (g)457437NS
Average daily feed intake (g)952952NS
Feed conversion ratio (-/-)2.112.18NS
Final body weight (kg)40.738.5NS
1 Period I: From the start of the experiment until the change of diet; 2 Period II: From the change of diet until the change of housing; Period I + Period II: From the start of the experiment until the change of housing; 3 Period III: From the change of housing until the end of the experiment.
Table 6. Influence of dietary protein level on the diarrhea score summations. The percentages of the scores are shown in parentheses with respect to the total score, referring both to the protein level in the period and to the whole period.
Diarrhea Score Summations 1
Protein Level Significance of the Difference
Growth periodHighLowTotal in the Period
Period I91 (85.0)16 (15.0)107 (45.7)
Period II5 (83.3)1 (16.7)6 (2.6)
Total (Period I + Period II)96 (85.0)17 (15.0)113 (48.3)p < 0.01
Period III71 (58.7)50 (41.3)121 (51.7)NS
Total score167 (71.4)67 (28.6)234
1 Scores were calculated as reported in Table 4. NS: not significant.
Table 7. Relative abundance of bacterial phyla in the piglet fecal microbiota depending on sampling time and protein level 1,2.
PhylumSampling Time and Protein LevelProtein LevelSignificance Level 3
T1T2T3
HighLowMeanHighLowMeanHighLowMeanHighLowOverall MeanSampling TimeProtein LevelSampling Time × Protein Level
Actinobacteria0.500.370.43A0.230.180.21B0.200.200.20B0.31A0.25A0.28**NSNS
Bacteroidetes40.741.941.3B49.450.750.1A46.648.647.6A45.6A47.0A46.3**NSNS
Fibrobacteres0.150.280.22B0.380.720.55A0.350.520.43A0.29B0.51A0.38****NS
Firmicutes54.450.652.5A40.637.238.9B43.039.741.4B46.0A42.5B44.3***NS
Proteobacteria1.552.401.97B3.023.273.14A2.523.152.83A2.36B2.94A2.67***NS
Spirochaetes0.902.431.67B3.935.384.66A4.254.834.54A3.03B4.27A3.60***NS
Unclassified1.631.781.71B1.731.831.78AB1.981.971.97A1.78A1.86A1.82*NSNS
Verrucomicrobia0.000.080.04C0.250.350.30B0.570.570.57A0.27A0.33A0.32**NSNS
1 T1: sampling after weaning, before the change of feed, T2: sampling after the change of feed and before changing of housing, T3: sampling after the change of housing and before the end of the experiment (end of the post-weaning period). 2 Values of relative abundance greater than 0.1% were considered. 3 Means sharing common letters within the phylum are not significantly different. Capital letters refer to the main factor effects, sampling time, and protein level. Underscore letters for interaction effects are omitted. NS: not significant, *, p < 0.05, **, p < 0.01.
Table 8. Bacterial genera differentially abundant in fecal samples of piglets fed low- or high-protein diets. The notation (T1) indicates that the effect was present only at the sampling time T1.
PhylumFamilyGenusProtein Level of Prevalent Abundance
Classes of Relative Abundance
>1%0.1–1%LowHigh
FibrobacteresFibrobacteraceae Fibrobacter+
FirmicutesClostridiaceae 1Clostridium sensu stricto + (T1)
FirmicutesEubacteriaceae Eubacterium +
FirmicutesLachnospiraceaeRoseburia Blautia Clostridium XlVaLachnospiracea_incertae_sedis, Coprococcus, Anaerostipes, Ruminococcus2, Dorea, Fusicatenibacter +
FirmicutesLactobacillaceaeLactobacillus + (T1)
FirmicutesPeptostreptococcaceaeClostridium XI + (T1)
FirmicutesErysipelotrichaceae Catenibacterium, Turicibacter, Erysipelotrichaceae_incertae_sedis + (T1)
ProteobacteriaSuccinivibrionaceae Succinivibrio+
SpirochaetesSpirochaetaceaeTreponemaSphaerochaeta+
Table 9. Composition of the fecal samples depending on sampling time (T1, T2, and T3) and protein level in the diet 1.
ParameterSampling TimeProtein LevelSignificance Level 2
T1T2T3
HighLowMeanHighLowMeanHighLowMeanHighLowSampling TimeProtein LevelSampling Time × Protein Level
Physico-chemical parameters:
Dry matter (DM)24.226.125.2C26.527.627.1B27.829.428.6A26.2B27.7A****NS
Organic matter (% DM)87.688.888.2B89.189.189.1A89.289.889.5A88.7B89.2A******
Total N (% DM)4.534.084.30A3.583.293.43B3.012.942.98C3.70A3.44B****NS
Ammonium N (% DM)0.610.560.59A0.610.510.56A0.490.450.47B0.57A0.51B****NS
pH6.316.326.31B6.596.556.57A6.626.526.57A6.51A6.46A**NSNS
Crude fiber (% DM)15.414.815.1B16.417.116.7A17.617.217.4A16.5A16.4A**NSNS
Hemicellulose19.923.021.4C25.027.926.1B30.332.131.1A25.0B27.7A****NS
Cellulose14.415.615.0B16.516.616.6A16.116.316.2A15.7B16.5A***NS
Volatile fatty acids (mmol kg−1 DM):
Acetic183197190A237214225A181189185A200A200ANSNSNS
Propionic62.160.361.2B76.775.376.0A66.166.166.1AB68.3A67.2A*NSNS
Iso-butyric13.526.621.1A29.722.626.1A18.520.219.4A21.2A23.1ANSNSNS
Butyric51.343.447.3A53.747.250.5A40.742.741.7A48.5A44.4ANSNSNS
Isovaleric10.712.111.4B17.214.115.6A15.112.713.9A14.3A13.0B****
Valeric10.111.310.7B14.011.712.9A10.910.310.6B11.6A11.1A*NSNS
Isocaproic4.386.135.26A4.425.434.92A3.924.804.36A4.24A5.46ANSNSNS
Caproic3.183.183.18A4.102.483.29A2.332.322.32A3.21A2.66ANSNSNS
Total341361351A441395418A344358351A400A367ANSNSNS
1 T1: sampling after weaning, before the change of feed, T2: sampling after the change of feed and before changing of housing, T3: sampling after the change of housing and before the end of the experiment (end of the post-weaning period). 2 Means sharing commons letters within the phylum are not significantly different. Capital letters refer to the main factor effects, sampling time, and protein level. Underscore letters for interaction effects are omitted. NS: not significant, *, p < 0.05, **, p < 0.01.
Disclaimer/Publisher’s Note: The statements, opinions and data contained in all publications are solely those of the individual author(s) and contributor(s) and not of MDPI and/or the editor(s). MDPI and/or the editor(s) disclaim responsibility for any injury to people or property resulting from any ideas, methods, instructions or products referred to in the content.

