Article

Responses of Urban Bird Assemblages to Land-Sparing and Land-Sharing Development Styles in Two Argentinian Cities

by
Maximiliano A. Cristaldi
,
Ianina N. Godoy
and
Lucas M. Leveau
*
Departamento de Ecología, Genética y Evolución, Facultad de Ciencias Exactas y Naturales, Universidad de Buenos Aires-IEGEBA (CONICET-UBA), Ciudad Universitaria, Pab 2, Piso 4, Buenos Aires 1426, Argentina
*
Author to whom correspondence should be addressed.
Animals 2023, 13(5), 894; https://doi.org/10.3390/ani13050894
Submission received: 23 December 2022 / Revised: 14 February 2023 / Accepted: 23 February 2023 / Published: 1 March 2023
(This article belongs to the Section Birds)

Abstract

:

Simple Summary

Urbanization negatively affects biodiversity worldwide. As cities are expected to grow in the future, alternative urban developments which allow the conservation of biodiversity within cities are required. Our main aim was to compare the response of bird assemblages to two alternative urban development styles (land-sparing vs. land-sharing) in two Argentinian cities: Santa Fe and Buenos Aires. Additionally, we assessed the response of bird assemblages to landscape features (the coverage of vegetation and distance to the main rivers) and human activity (represented by pedestrian rate and environmental noise). In Buenos Aires, land-sparing enhanced species richness, whereas land-sharing favored the Shannon diversity and Simpson diversity. The pedestrian traffic was negatively associated with bird diversity. We found that each urban development style supported different bird assemblages during the breeding season. Bird species composition was also related to the surrounding coverage of vegetation. Therefore, our study shows that both urban development styles support different bird assemblages, especially during the breeding season, and indicate the need of reducing pedestrian traffic and increasing the coverage of vegetation to enhance species diversity and composition in both cities.

Abstract

Urbanization negatively affects biodiversity worldwide. Consequently, alternative urban development styles are required for an eco-friendlier urbanization process. Thus, two development styles have been suggested: land-sharing (buildings mixed with dispersed green space) and land-sparing (buildings interspersed with large green patches). We assessed differences in species diversity and composition of bird assemblages between both development styles in two Argentinian cities: Santa Fe and Buenos Aires. We surveyed birds in land-sharing and land-sparing areas during the breeding and non-breeding seasons. As a control, we also surveyed birds in areas dominated by impervious surfaces. At a local scale, we also measured the environmental noise and pedestrian traffic. At a landscape scale, we measured the percent vegetation cover surrounding development styles and their distance to the main river. In Buenos Aires, species richness was higher in land-sparing than in land-sharing. However, the Shannon diversity and Simpson diversity were higher in land-sharing. In Santa Fe, both urban development styles supported similar species richness and diversity. Species composition varied between land-sharing and land-sparing in both cities during the breeding season. The pedestrian traffic was negatively associated with species diversity. Therefore, both development styles and strategies to reduce pedestrian traffic should be taken into account to enhance different components of species diversity and composition within the urban matrix.

1. Introduction

Urbanization is a complex socioeconomic process that has grown globally in recent decades [1]. The world urban population increased by about 1.973 million inhabitants and the global urban surface area grew by about 80% between 1985 and 2015 [1,2]. This accelerated urban development is leading to a strong transformation of the landscape and natural ecosystems [3,4]. Numerous studies at a global scale have indicated that urbanization impacts biological communities causing changes in their ecological interactions, the behavior of individuals, and their biodiversity [5,6,7]. Intensive urban development leads to the loss of species, mainly native species [7,8]. Due to the negative impacts of urbanization on natural ecosystems, it is necessary to seek an alternative urban landscape planning that allows for biodiversity conservation [9].
A multidisciplinary debate was recently raised between two models of urban development: land-sharing vs. land-sparing [10,11]. The land-sharing model refers to the expansion of low-intensity urban areas that contain relatively small green spaces in a dispersed manner [11]. In contrast, the land-sparing model promotes urban densification in some sectors to the extent that relatively large green spaces are established [11]. Several studies have discussed the relevance of each model in different cities and taxonomic groups such as vegetation, beetles, mammals, and birds [11,12,13,14]. Particularly for birds, the most current understanding of the response of bird assemblages to land-sparing and land-sharing development styles in urban environments is spatially biased towards a few cities [15,16] or regions [14] and with contrasting results. Additionally, urban landscapes are spatially and temporally heterogeneous, and consequently, the response of biological communities to land-sharing/land-sparing models may depend on factors such as the geographical, biological, and social context [13,14]. The extent to which the patterns are generalizable remains unclear. Therefore, this highlights the importance of conducting studies in different cities to regionally differentiate the suitability of each urban development style for bird diversity [17].
In urban areas, birds are one of the most frequently studied taxa, since they rapidly respond to anthropogenic changes, are easy to survey, and can function as surrogates of diversity for other taxa [18]. Birds also provide ecosystem services such as pollination, seed dispersal, and pest control, and bird species richness may have a positive impact on human well-being [19,20,21,22]. Although in recent years the study of urban birds has grown rapidly in highly biodiverse regions of Latin America such as Brazil, Argentina, and Mexico [23], gaps in the knowledge of the effect of urbanization on bird assemblages still remain [23,24]. Additionally, as in many works from temperate zones (i.e., North America, Europe, and Australia) [25], studies from Latin America have reported a negative effect of urbanization and a positive influence of green space size on bird diversity [26,27,28,29,30]. Since this region is one of the most diverse in avian species, but at the same time it is experiencing an unplanned lower-density growth in many cites [23], knowledge about the effect of urban development styles on urban bird assemblages is imperative as a base to guide future eco-friendlier urbanization.
The effect of urbanization on bird diversity constitutes a process that varies according to different spatial scales [17,31]. At the local scale, an increase in bird diversity is usually associated with greater plant diversity and stratification, the presence of natural or artificial waterbodies, and low levels of human disturbance such as pedestrian traffic and noise [31,32]. At the landscape scale, greater species richness has been associated with greater proximity to waterbodies or green spaces in different cities [33]. However, the relation between bird diversity and land-sharing/land-sparing models has not been analyzed considering the distance to other waterbodies or green areas.
Moreover, the relationship between bird diversity and urbanization may change between seasons [34,35]. In general, birds have a more restricted home range during the breeding season since they are associated to a nesting territory, whereas during the non-breeding season, birds have a more flexible home range because they are mainly influenced by the abundance and distribution of food [36,37]. Therefore, the relationship between bird diversity and land-sharing/land-sparing models needs to be analyzed in different seasons [14].
In this study, our aims were (1) to compare bird communities in land-sharing and land-sparing landscapes; (2) to analyze the role of human disturbance represented by pedestrian traffic and level of noise on bird communities; (3) to analyze the role of the amount of green cover and the distance to the main watercourses of urban landscapes on bird communities; and (4) to compare the relation between bird communities and different landscapes during breeding and non-breeding seasons. We expected higher bird diversity in land-sharing during the breeding season due to the presence and higher abundance of species that can nest on manmade structures and use the surrounding natural resources. In addition, we expected higher bird diversity in landscapes surrounded by more green cover and next to watercourses. Finally, we expected differences in bird diversity and species composition related to environmental variables only during the breeding season.

2. Materials and Methods

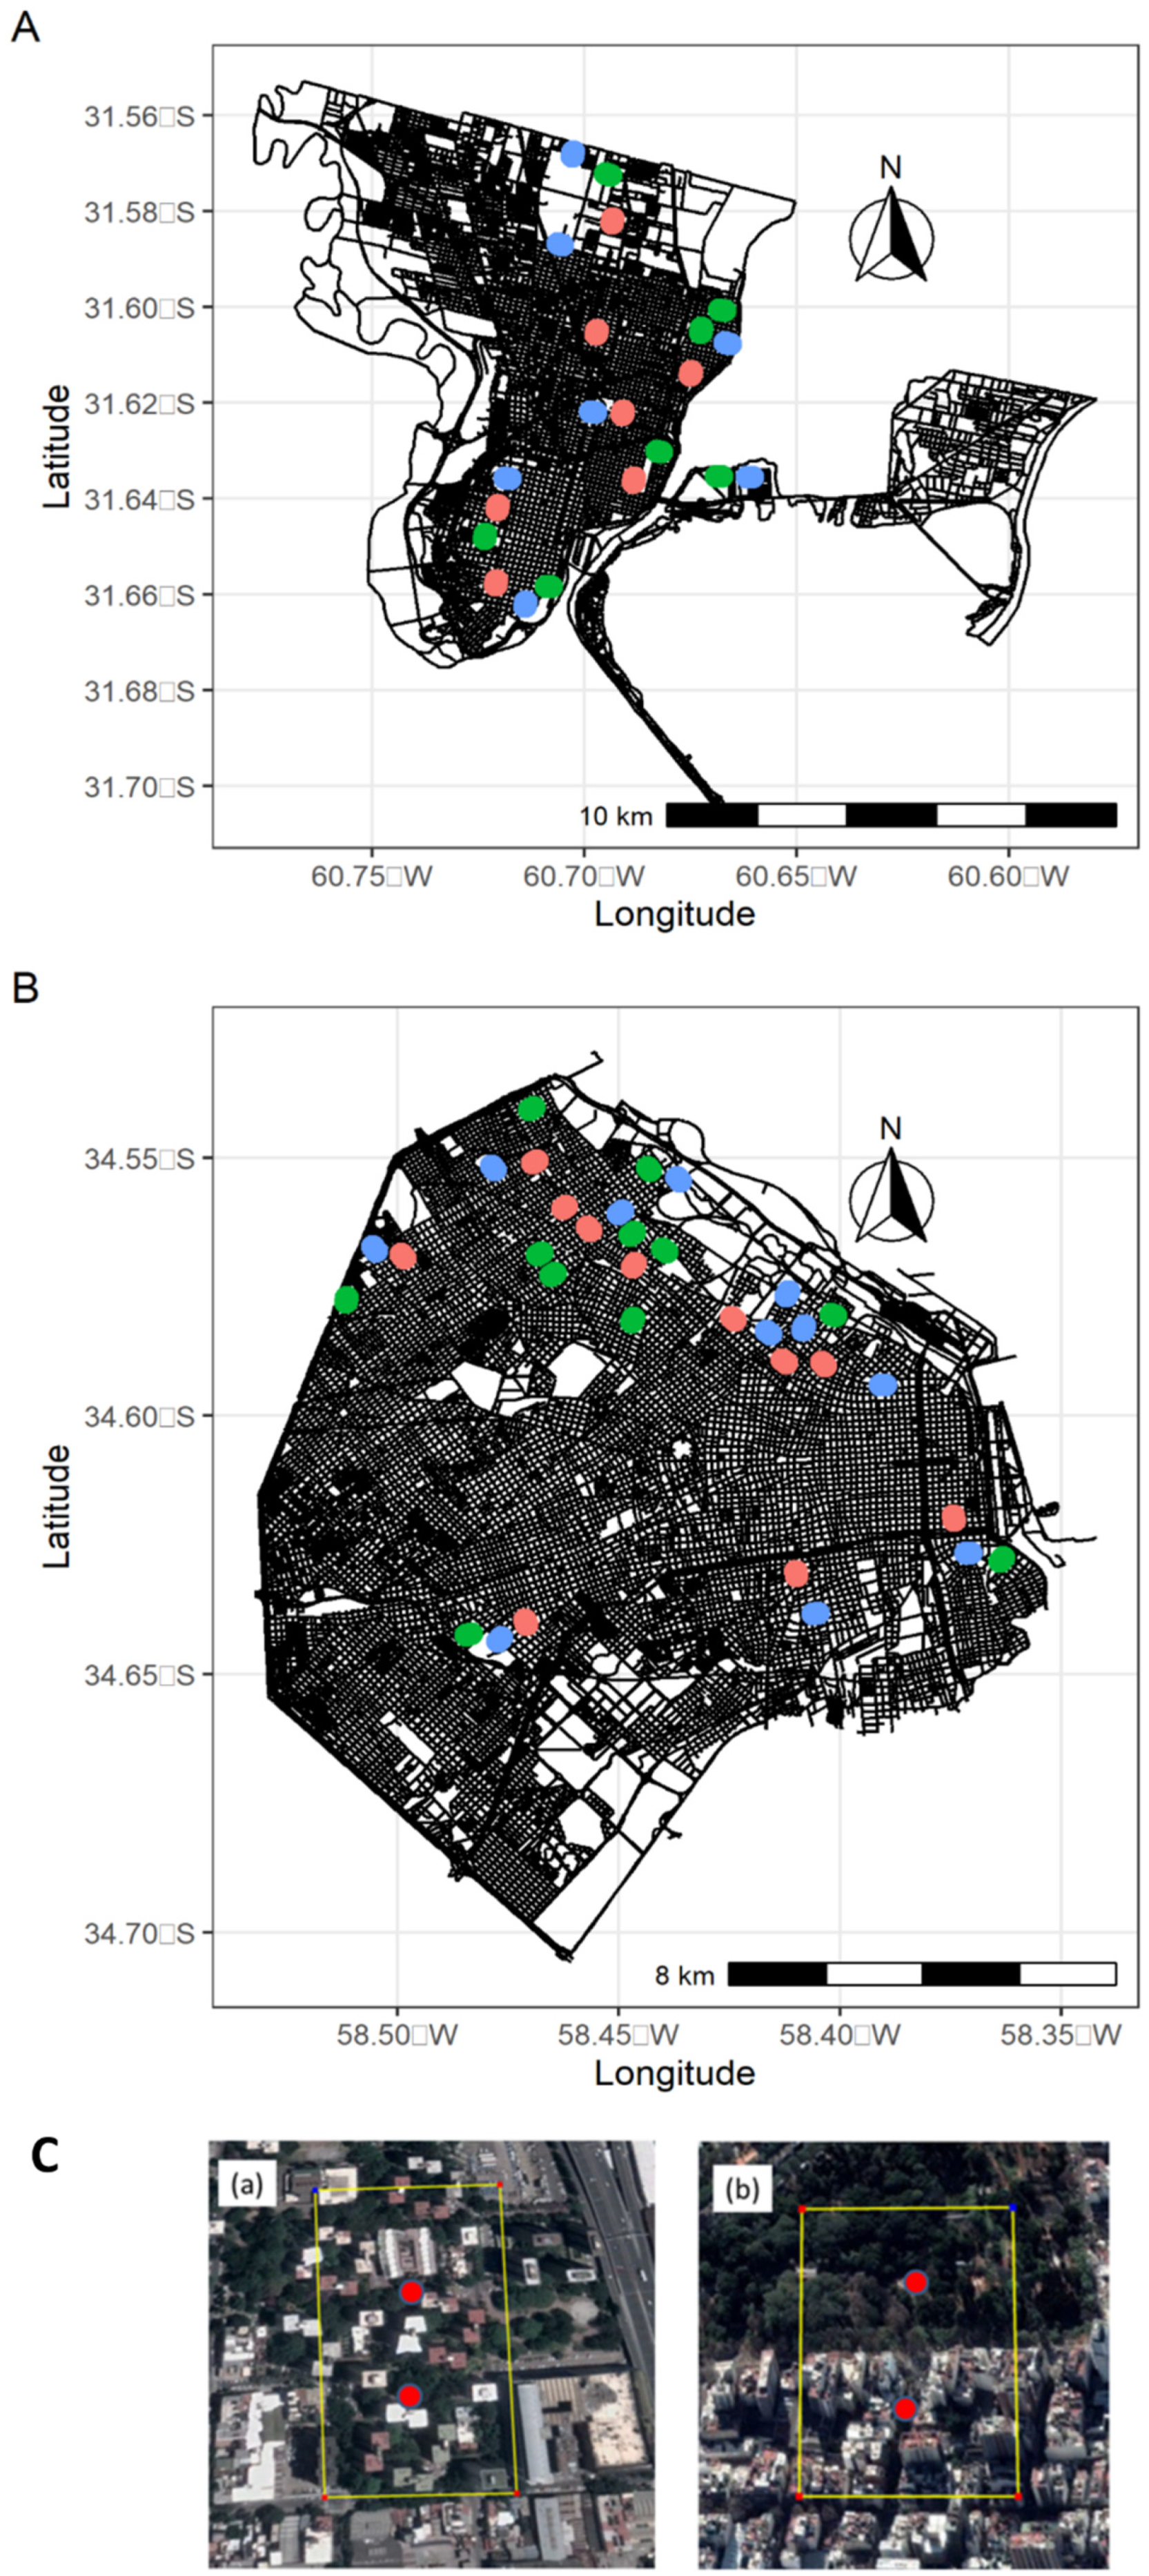
2.1. Study Area and Preliminary Classification of Urban Areas

We assessed the taxonomic diversity and composition of bird assemblages in two cities from central Argentina, Buenos Aires (34°35′59″ S 58°22′55″ W, 3,075,646 inhabitants, 25 masl) and Santa Fe (31°38′00″ S 60°42′00″ W, 401,544 inhabitants, 25 masl) (Figure 1A,B). Buenos Aires is located in an ecotone between the Pampean and the Paranaense phytogeographic regions [38]. The Pampean region was originally dominated by grasslands, whereas the Paranaense region is composed of deltaic forests. Santa Fe is located in the ecotone between the wooded Espinal and the Paranaense phytogeographic regions. However, the surroundings of both cities are heavily impacted by human activities, being dominated by crops and exotic tree plantations.
In each city, we selected 200 m × 300 m sampling units depending on the availability of landscapes with land-sharing or land-sparing (14 in Santa Fe city and 22 in Buenos Aires city) (Figure 1A,B). Half of them presented a land-sharing urban development and the other half, a land-sparing urban development (Figure 1A–C). To recommend a land-sharing or land-sparing urban development style for future urban planning, we need to provide evidence that at least one of them supports a different bird assemblage from highly urbanized areas. Thus, we considered 200 m × 300 m rectangles where pavement and buildings predominated (>50% impervious cover) and hereafter referred to them as “control” (7 in Santa Fe city and 11 in Buenos Aires city). Sampling units were separated by a minimum distance of 200 m to secure data independence. Sampling units were initially assigned to either one or another urban development style by visual inspection of satellite images available on Google Earth. Land-sharing units consisted of fragmented green areas interspersed by buildings, while land-sparing units corresponded with the majority (>50%) of their green surfaces aggregated into a single patch (Figure 1C). All green spaces presented a certain level of management or human intervention, such as lawn mowing, irrigation, or pruning. Due to a positive relationship between the size of green areas and animal biodiversity (including birds) that has been extensively reported in urban landscapes [29,39], every land-sharing square in a given city was paired with another land-sparing square of the same city holding a similar overall green area. This procedure allowed us to test for the effect of urban landscape organization, avoiding bias associated with the size of green areas.

2.2. Classification of Urban Areas

In order to confirm the initial assignment of each sampling unit to one of three urban development styles, we followed Ibáñez-Álamo et al. [14]. Using the satellite images from Google Earth and ImageJ package [40], we divided each 200 m × 300 m rectangle into 96 cells (25 m × 25 m) and estimated the percentage of vegetated and non-vegetated surface for each cell (Figure S1). Then, we used this information to calculate the following variables for each rectangle: (Single_patch), percentage of high vegetation cover cells (those with more than 50% green area) in a single patch (contiguous cells); (N_patches), number of green patches (a green patch was defined as having at least one high vegetation cover cell); (Per_built_cells), percentage of built cells of all vegetated cells; (Per_veg_cells) percentage of fully vegetated cells of all vegetated cells; (N_veg_cells), number of cells with vegetated surfaces; and (Per_veg_cover), percentage of vegetation cover in the sampling unit. Variables Single_patch and N_patches provide information on the land-sharing/sparing urban development style at the 200 m × 300 m square level with high values of variable Single_patch associated with land-sparing urban areas (i.e., vegetation in a single patch), while high values of variable N_patches are associated with land-sharing urban areas (i.e., vegetation distributed into many patches). Variables Per_built_cells and Per_veg_cells provide information on the within-cell land-sharing or land-sparing urban development, respectively, and variables N_veg_cells and Per_veg_cover estimate the overall amount of vegetation in the square [14]. Since the width of greenways is often positively associated to the flow of individuals of many urban bird species [41,42,43], we used the Rook contiguity criteria to determine contiguous cells. With the previous six variables, we ran a principal component analysis (PCA) using the FactoMineR package version 2.7 [44] from R [45]. The first two PCA axes retained more than 80% of data variation for both cities (Figure S2A,B). For both cities, the first axis contrasted control, land-sparing, and land-sharing rectangles based on variables: Single_patch, Per_veg_cover, Per_built_cells, and Per_veg_cells. The second axes contrasted land-sharing from land-sparing and control rectangles based on N_patches and N_veg_cells (Figure S2A,B). Thus, we confirmed the suitability of our initial classification (Figure S2).

2.3. Bird Survey

Data on bird species were collected using fixed-radius point counts [46] carried out during the 2020 non-breeding season (May–August) and breeding season (October–December). Standardized point count surveys have been recommended to provide data resulting in indices of abundance that are comparable across years, habitats, and studies [47]. In urban environments, point counts are as effective as other widely used techniques in determining patterns of relative abundance [48]. Two professional ornithologists from Santa Fe and Buenos Aires with more than 10 years of bird-survey experience in their respective regions carried out all the surveys in each city. Within each 200 m × 300 m rectangle, 2 point counts were settled with a minimum of 100 m distance between them and from the border of the rectangle to avoid counting the same individual twice (Figure 1C). At each point count, we recorded all birds seen and heard for 5 min within a 30 m radius. We considered all individuals perching, nesting, or feeding within the point counts for further analyses. Point counts were carried out during the morning (up to 4 h after local sunrise), only in working days to avoid excessive variation in the circulation of vehicles and people and with similar weather conditions (without rain and heavy winds). To capture potential temporal changes in bird assemblages within season, we carried out three surveys separated by a month in each season.

2.4. Environmental Variables

Environmental variables were established at two different scales. At a landscape scale, we analyzed the distance to the nearest river and the vegetation coverage surrounding the sampling units. Landscape variables were estimated using a global land cover map with 10 m pixel resolution [49]. In order to measure the distance to the nearest river, we calculated the Euclidean distance between the centroid of each sampling unit and the nearest river using the raster package version 3.6-11 [50] (Hijmans, 2022). In order to calculate the vegetation coverage, we performed the following steps. First, the original 23 land use types were reclassified into 2 broad categories: vegetated and non-vegetated areas. Second, we made buffers of 500 m width from sampling units using the rgeos package version 0.6-1 [51]. Finally, we calculated the vegetation coverage using the landscapemetrics package version 0 [52].
At the sampling unit scale, we measured the pedestrian traffic and the environmental noise. To measure the pedestrian traffic, we recorded the number of people passing through the point count surface during bird surveys. Environmental noise was measured using the cellphone application “Sound Meter” [53] as per de Camargo Barbosa et al. [31]. The mean decibels per 30 s immediately before and after bird counts were estimated. Due to the fact that the sound meter was not calibrated, decibels measures should be taken only for relative comparisons between urban development styles.

2.5. Data Analysis

2.5.1. Taxonomic Diversity per Urban Development Style

For each season, we measured taxonomic bird diversity using Hill numbers, which are the effective numbers of equally abundant species [54]. Hill numbers differ by a parameter q that reflects their respective sensitivity to the relative frequency of a species. We used the hillR package version 0.5.1 [55] to calculate Hill numbers with q = 0, q = 1, and q = 2, which can be interpreted as bird species richness (BSR), Shannon–Wiener (H), and Simpson’s (S) index of diversity, respectively [56]. Bird species richness was the total number of species, whereas Shannon–Wiener and Simpson diversities reflected the number of common and dominant species, respectively [56]. To ensure our survey effort was comparable between urban development styles, we calculated rarefaction curves for each urban development style and city in relation to sample completeness using 999 bootstraps [57] with the iNEXT package version 3.0.0 in R [58]. Sample completeness is the proportion of the total individuals that belong to the species detected in the sampling unit [58]. Significant differences between curves were established when 95% confidence intervals did not overlap (Figure S3).

2.5.2. Taxonomic Diversity per Sampling Unit

BSR was calculated as the maximum number of recorded bird species at each sampling unit considering the three surveys within each season, whereas Hill numbers for Shannon–Wiener and Simpson diversities were calculated with the maximum individuals for each species recorded during the three visits. Environmental variables included urban development styles, cities, pedestrian traffic, noise, and landscape variables. The interactions between urban development styles and city and between urban development styles and landscape vegetation cover also were explored. Generalized linear models (GLMs) were performed to analyze association patterns between bird diversity (Hill numbers) and environmental variables. Models were obtained by backward elimination of non-significant variables (p > 0.05) from the full model using the anova function. Final models were compared with null models using a likelihood ratio test (LRT test) (p < 0.05). Differences of means between types of urban development styles were explored with Tukey tests using the function glht of the multcomp package version 1.4.20 [59]. Multicollinearity among predictor variables was explored using the vif function of the car package version 3.1.1 [60]. As gvif values were lower than 5, all variables were retained for further analyses. The pseudo-rsquare of final models were obtained using piecewiseSEM package version 2.1.2 [61]. The final models were plotted with the visreg package version 2.7.0 [62]. For species richness (q = 0) (count data), we assumed a Poisson distribution of errors and we checked for over- and sub-dispersion. For the Shannon–Wiener and Simpson index (q = 1 and q = 2, respectively) (continuous data), we assumed a Gaussian distribution of errors, and homoscedasticity and normality were checked. All diagnostic analyses were carried out with the DHARMa package version 0.4.6 [63] (see Figure S4 for model diagnostics).

2.5.3. Taxonomic Composition

To estimate the variation in species composition explained by environmental variables in each season, we used a distance-based redundancy analysis (dbRDA) using the vegan package version 2.6.2 [64,65]. db-RDA is an ordination method which arranges data objects in a space defined by the linear combinations of explanatory (environmental) variables and, at the same time, quantifies the variation in species composition explained by the environmental variables [64,65]. dbRDA is a reliable test for analyzing species–environment relations, especially with linear environmental gradients [66]. The variation of species composition in db-RDA has to be expressed on the basis of a non-Euclidean distance response matrix. We examined a Bray–Curtis dissimilarity matrix along with urban development styles and environmental variables. Environmental variables included urban development style, cities, pedestrian traffic, noise, and landscape variables. Models were obtained by backward variable selection and comparisons with null models using a likelihood ratio test (LRT test) (p < 0.05). A db-RDA with the variable “Urban development style” as significant makes it possible to determine that species composition is different in at least one of the urban styles. However, our main objective was to determine the variation in bird species composition between land-sharing and land-sparing. Thus, if db-RDA showed significant differences between development styles, we would perform a new db-RDA considering only land-sharing and land-sparing (hereafter, “db-RDA2”).

3. Results

In Buenos Aires city, we recorded a total of 6001 individuals of 48 species (Table 1). The most abundant species were Columba livia and Zenaida auriculata. In Santa Fe city, we recorded a total of 4391 individuals of 63 species (Table 1). The most abundant species were Zenaida auriculata and Passer domesticus.

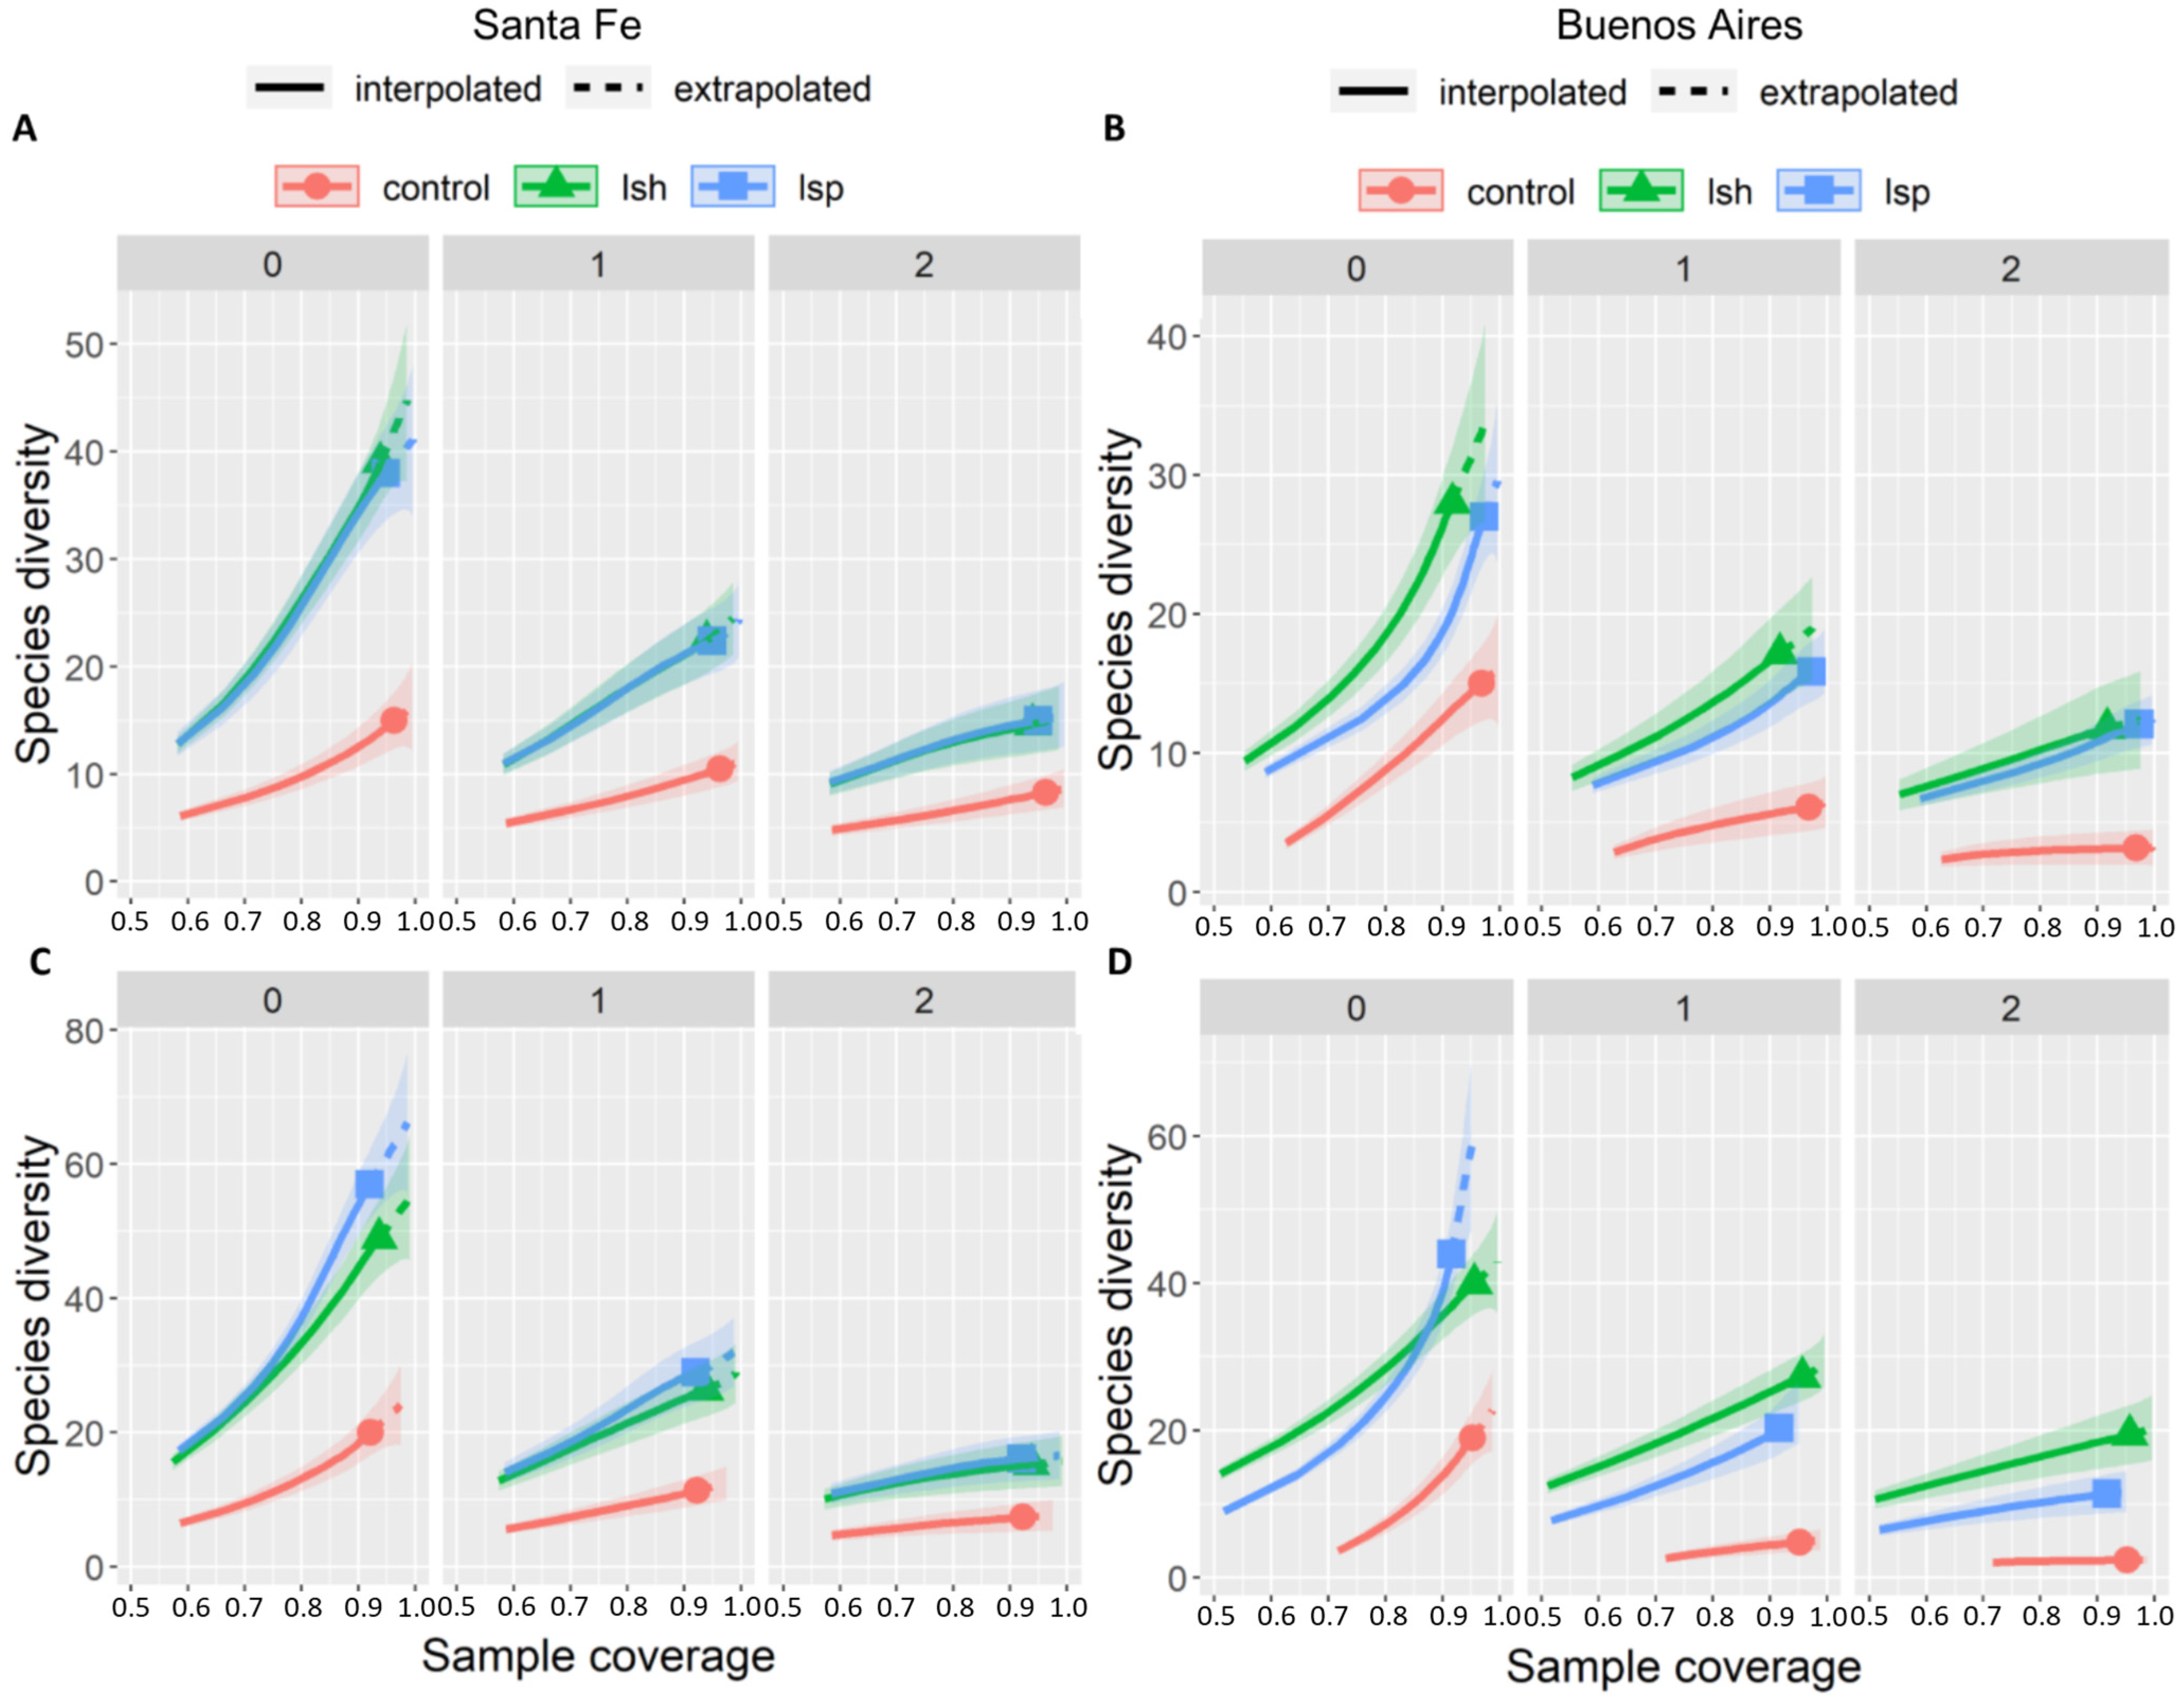
3.1. Taxonomic Diversity per Urban Development Style

During both seasons, species diversity in control was lower than in land-sharing and land-sparing for all Hill numbers (Figure 2A–D). In Santa Fe city, species diversity did not differ between land-sparing and land-sharing during both seasons (Figure 2A,C). Although we observed a higher species richness and Shannon diversity in land-sparing than in land-sharing during the breeding season, we did not find significant differences (Figure 2C).
In Buenos Aires city, species diversity did not differ between land-sparing and land-sharing during the non-breeding season (Figure 2B). During the breeding season, species richness was higher in land-sparing than in land-sharing, whereas Simpson diversity was higher in land-sharing than in land-sparing (Figure 2D). Shannon diversity did not differ between these two landscapes during both seasons (Figure 2B,D).

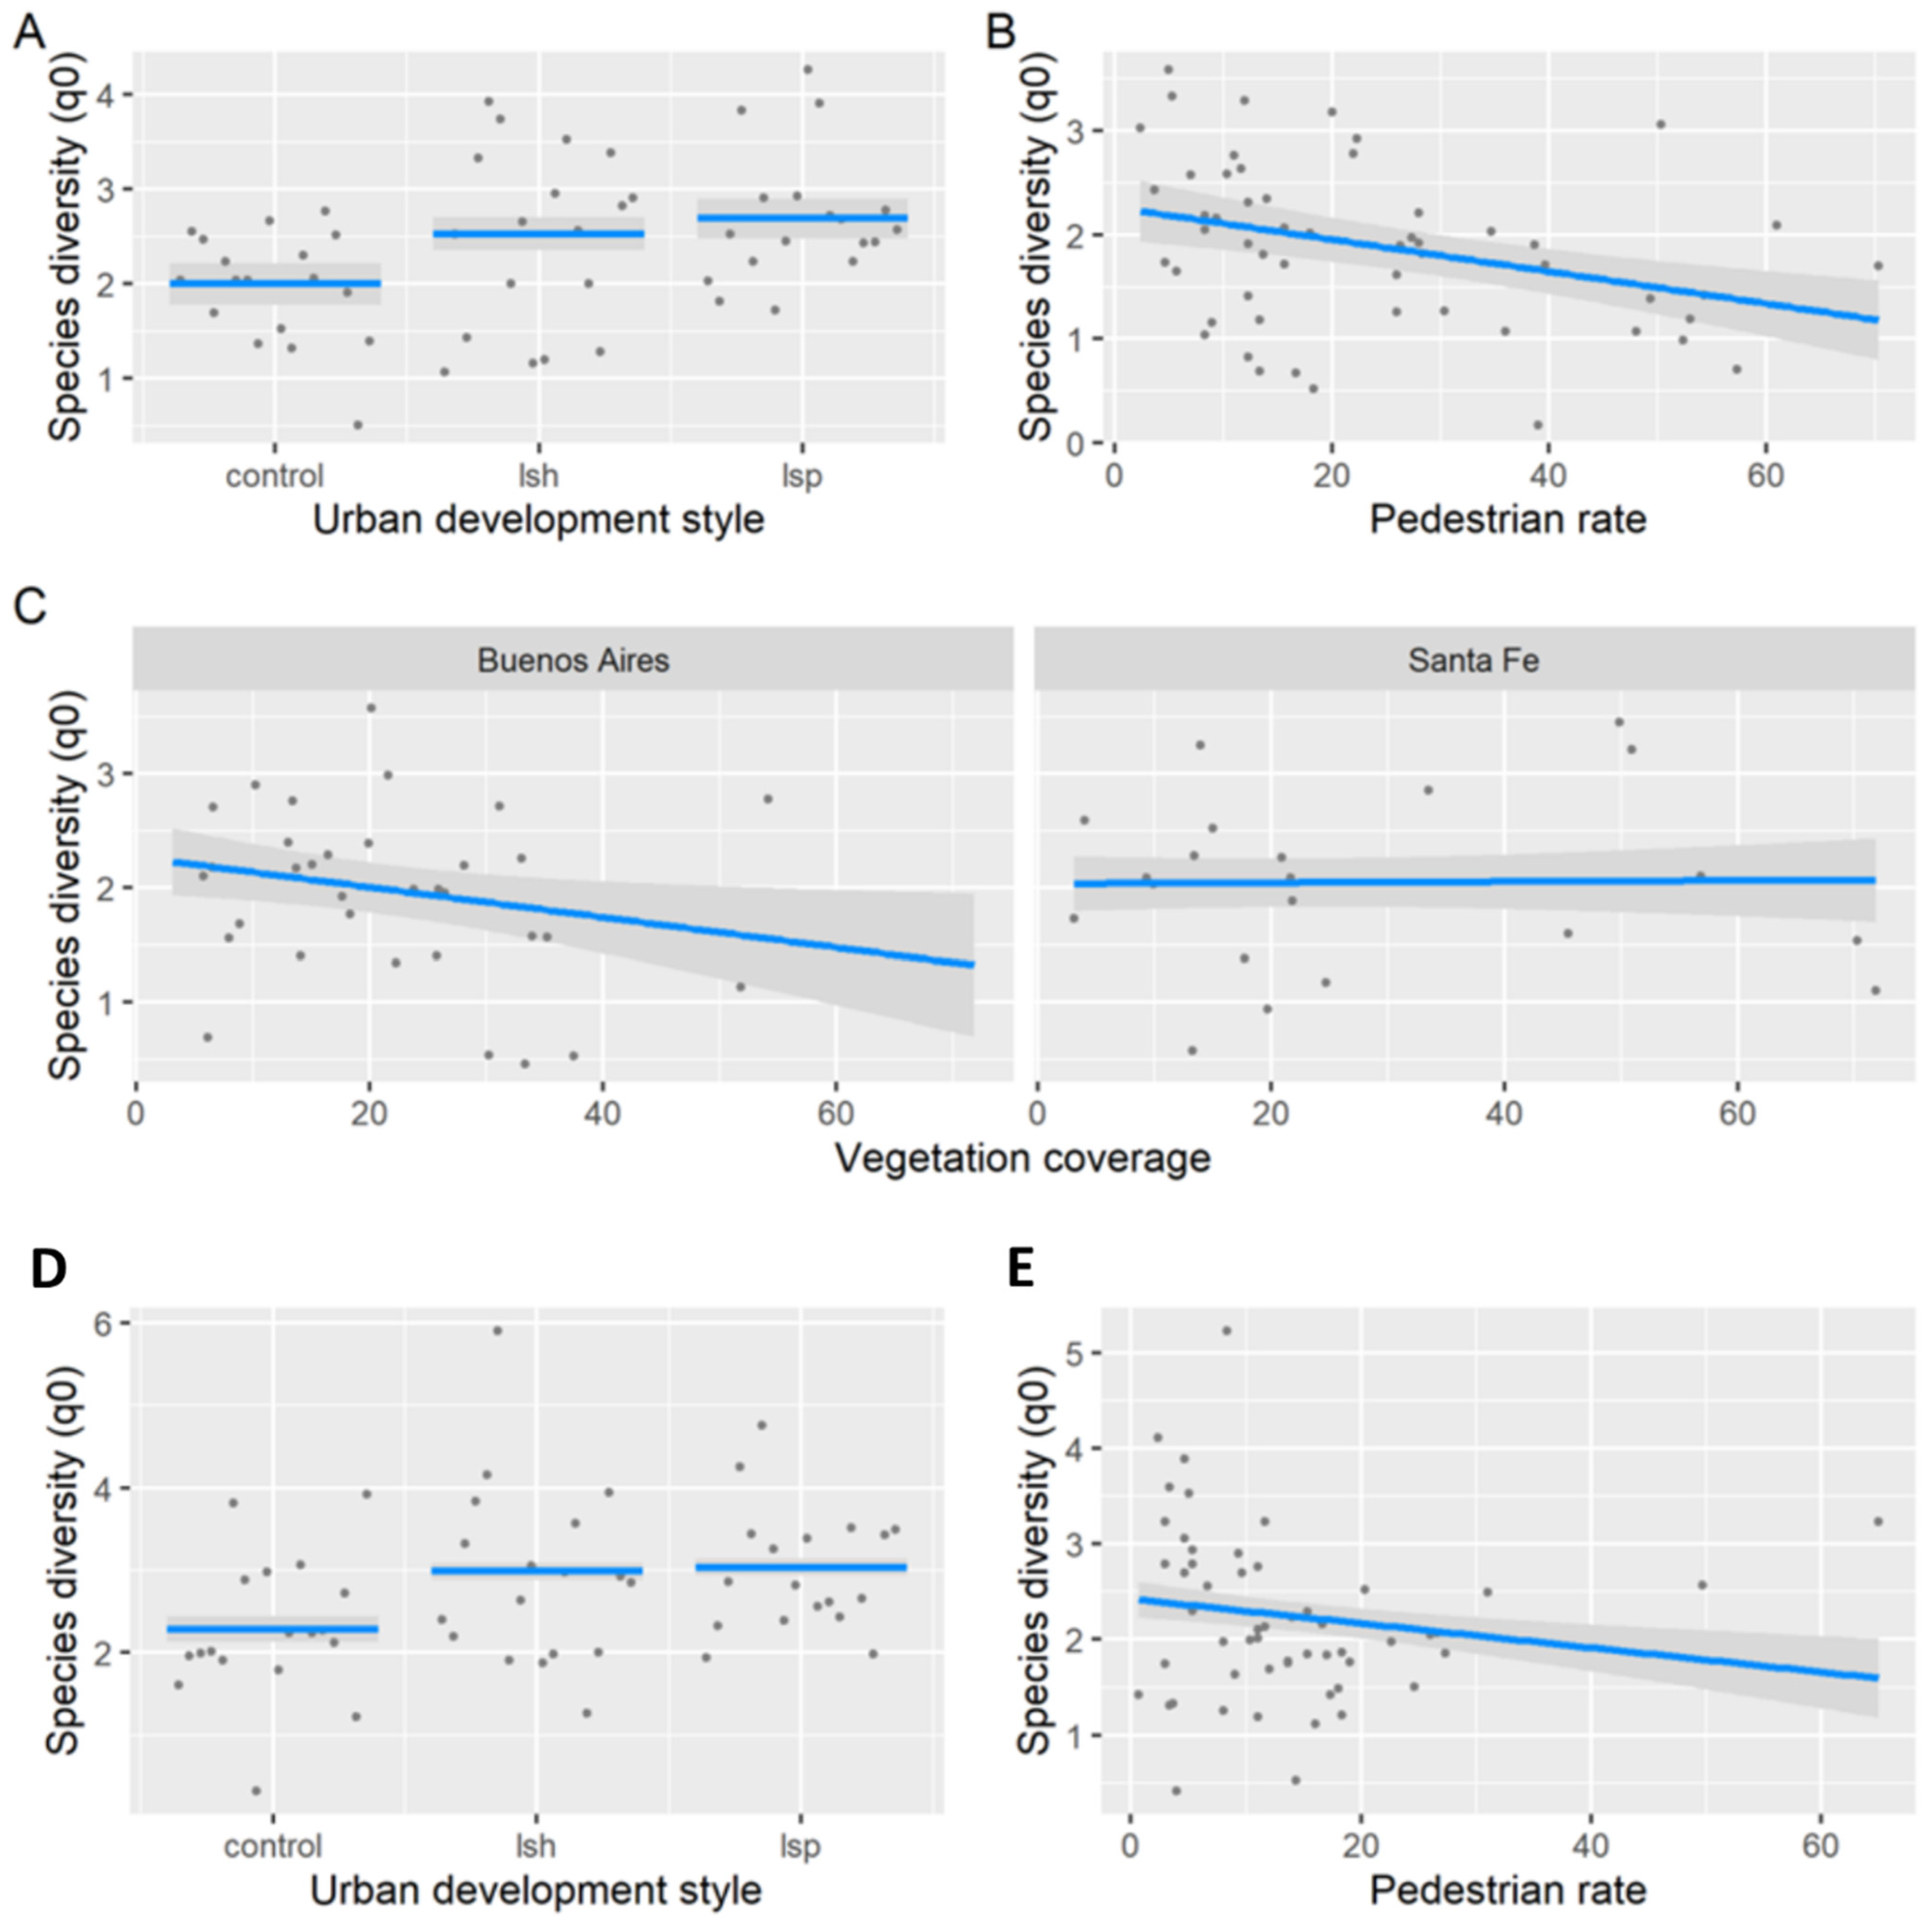
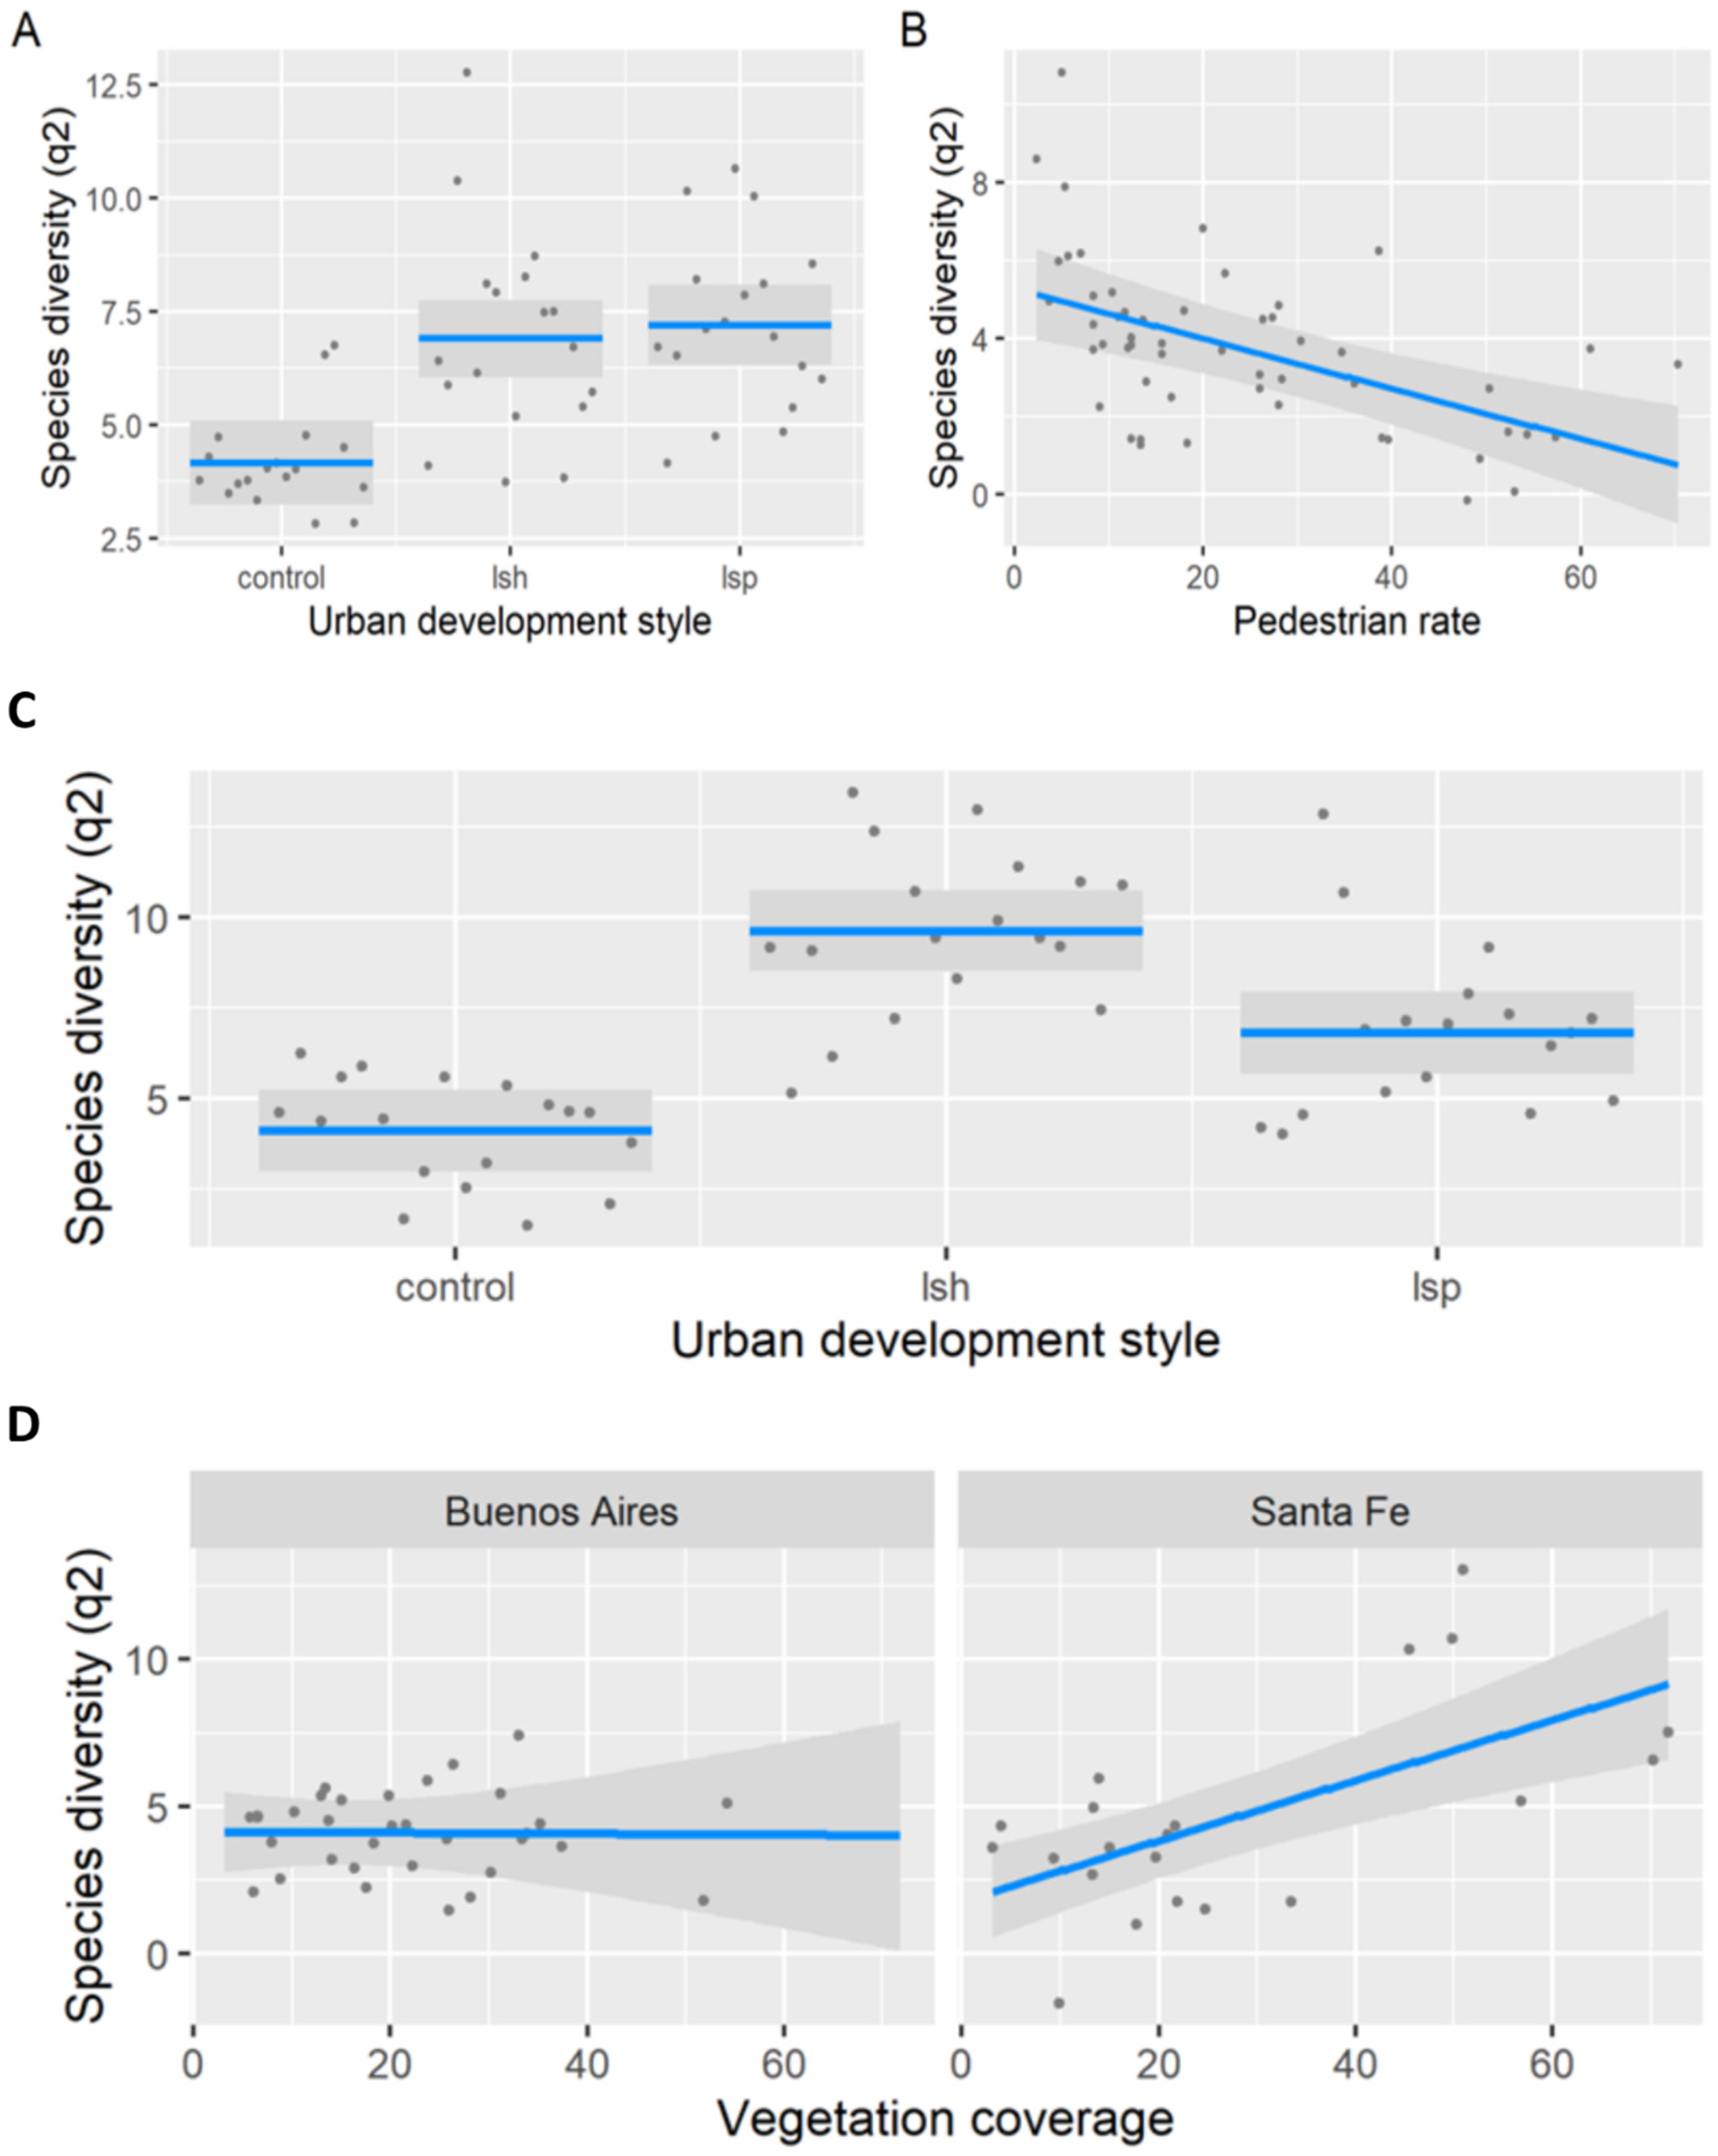
3.2. Taxonomic Diversity per Sampling Unit

Taxonomic diversity responded differently to environmental predictors at both landscape and local scales between seasons. During the non-breeding season, species richness was related to urban development styles, pedestrian rate, and the percentage of surrounding vegetation coverage (LRT = 79.69, df = 6, p < 0.001, pseudo-R2 = 0.77). Species richness was lower in control than in land-sparing and land-sharing, whereas we did not find significant differences between land-sparing and land-sharing (Tukey test, p > 0.05) (Figure 3A). Pedestrian traffic was negatively associated with species richness (Figure 3B). The relationships between species richness and surrounding vegetation coverage varied between cities (Figure 3C). In Buenos Aires, species richness related negatively to vegetation coverage, whereas in Santa Fe, there was no clear relationship between variables (Figure 3C). During the breeding season, we also found lower species richness in control landscapes and negative relationships with pedestrian rate (LRT = 110.26, df = 3, p < 0.001, pseudo-R2= 0.87, Table 2, Figure 3D,E).
During the non-breeding season, Shannon diversity was related to urban development styles, pedestrian rate, and the percentage of surrounding vegetation coverage (LRT = 367.73, df = 6, p < 0.001, pseudo-R2 = 0.63; Table 2; Figure 4A–C). Shannon diversity was lower in control than in land-sparing and land-sharing (Tukey tests, p < 0.05; Figure 4A). We did not find significant differences between land-sparing and land-sharing (Tukey test, p > 0.05). Pedestrian traffic was negatively associated with Shannon diversity (Figure 4B). The association between the surrounding vegetation coverage and Shannon diversity varied between cities, being negative in Buenos Aires and positive in Santa Fe (Figure 4C). During the breeding season, Shannon diversity was related to urban development styles and the percentage of vegetation coverage (LRT = 744.4, df = 7, p < 0.001, pseudo-R2 = 0.71; Table 2; Figure 4D–F). Shannon diversity was higher in land-sharing than in land-sparing and control (Tukey tests, p < 0.05; Figure 4D). The association between Shannon diversity and surrounding vegetation coverage varied between urban development styles and cities (Figure 4E,F). Control and land-sharing had a negative relationship, whereas land-sparing had a positive relationship (Figure 4E). On the other hand, the relationship between Shannon diversity and vegetation cover was negative in Buenos Aires and positive in Santa Fe (Figure 4F).
During the non-breeding season, Simpson diversity was related to urban development styles and pedestrian rate (LRT = 197.39, df = 3, p < 0.001, pseudo-R2 = 0.53; Table 2; Figure 5A,B). Simpson diversity was lower in control than in land-sparing and land-sharing (Tukey tests, p < 0.05; Figure 5A). We did not find significant differences between land-sparing and land-sharing (Tukey test, p > 0.05). Pedestrian traffic was negatively associated to Simpson diversity (Figure 5B). During the breeding season, Simpson diversity was related to urban development styles and the percentage of surrounding vegetation coverage (LRT = 419.93, df = 5, p < 0.001, pseudo-R2 = 0.66; Table 2; Figure 5C,D). Simpson diversity was higher in land-sharing than in land-sparing and control (Tukey tests, p < 0.05; Figure 5C). The association between Simpson diversity and surrounding vegetation coverage was negative in Buenos Aires city and positive in Santa Fe city (Figure 5D).

3.3. Taxonomic Composition

The results of the db-RDA showed that over 40% of the variation in species composition was associated to urban development style, city, and surrounding vegetation coverage during the non-breeding and breeding seasons (non-breeding season: F = 8.5, p = 0.001, breeding season: F = 8.4, p = 0.001; Figure 6A,C). In ordinations for both the non-breeding and breeding seasons, the first axis showed differences in species composition between cities. The second axis was correlated with surrounding coverage of vegetation and urban development styles. The abundance of Columba livia and Passer domesticus tended to be higher in control from Buenos Aires and Santa Fe, respectively, and areas with the lowest landscape vegetation coverage (Figure 6A,C). By contrast, the abundance of Pitangus sulphuratus, Furnarius rufus, Myiopsitta monachus, Turdus rufiventris, and Patagioenas picazuro tended to be higher in land-sharing and land-sparing areas and in areas with the highest surrounding vegetation coverage (Figure 6A,C).
However, species composition changed between land-sparing and land-sharing landscapes during the breeding season. During the non-breeding season, db-RDA2 only showed significant associations between bird composition and surrounding vegetation coverage and cities (F = 8.1, p = 0.001; Figure 6B), but no bird composition differences between land-sparing and land-sharing development styles. During the breeding season, species composition was related to urban development style, cities, and surrounding vegetation coverage (F = 6.6, p = 0.001; Figure 6D). The abundance of Zenaida auriculata, Myiopsitta monachus, Columba livia, Passer domesticus, and Turdus rufiventris was higher in the land-sparing landscape, whereas Patagioenas picazuro, Progne chalybea, Furnarius rufus, Molothrus bonariensis, Pitangus sulphuratus, Troglodytes aedon, Zonotrichia capensis, and Agelaioides badius were more abundant in the land-sharing landscape (Figure 6D, Table 1). The abundance of Zenaida auriculata and Passer domesticus was higher in Santa Fe city, whereas the abundance of Columba livia, Turdus rufiventris, and Patagioenas picazuro was higher in Buenos Aires city (Figure 6D, Table 1). Finally, Columba livia and Zenaida auriculata dominated sites with the lowest surrounding vegetation coverage (Figure 6D).

4. Discussion

Spatial configuration of green cover can affect bird assemblages. Land-sparing and land-sharing development styles supported bird assemblages with different species diversity and composition during the breeding season in the cities of Santa Fe and Buenos Aires. In Buenos Aires, land-sparing favored species richness while land-sharing enhanced the Shannon diversity and the Simpson diversity during the breeding season. In Santa Fe, both urban development styles supported similar species richness and diversity. Thus, our results support that both urban development styles can influence the diversity and composition of birds in Argentinian urban environments. On the other hand, differences in the response of bird assemblages between cities suggest that local knowledge about the effect of urbanization on bird assemblages is required for planning conservation strategies. In addition, pedestrian traffic and the amount of green cover surrounding sites affected bird communities.
Our study showed that the relationship between urban development style and species richness varied according to cities and seasons. In Buenos Aires, land-sparing had higher species richness than land-sharing during the breeding season. Land-sparing may favor the presence of specialist bird species that require contiguous extensions of green cover [16]. Simpson diversity, which represents the number of dominant species, was higher in land-sharing. Land-sharing has more edge habitats due to the impervious surface interspersed with a wide range of small public and private urban green spaces such as small parks, gardens, and wooded streets. This habitat structure may favor a greater number of dominant species than in land-sparing. In contrast, in Santa Fe city, species diversity had similar values between urban development styles. The lack of association between bird assemblages and the spatial configuration of vegetation was also reported in a previous work performed in another Latin-American city [15]. Our results suggest that the underlying ecological processes that shape bird assemblages in both cities may be different. Further studies are required to provide more conclusive insights about the ecological processes that take place in both cities. Additionally, comparisons with previous studies are difficult because of the differences of methodological approaches, the scale of the study, and the attribute of the bird assemblage analyzed [14,15,16]. In this sense, we followed the methodological approach applied in Ibañez-Álamo et al. [14] and the response of bird assemblages in European cities is different from that of Argentinian cities. Therefore, it is recommended to extend the same methodological approach to different cities to analyze which patterns can be generalizable.
Distinct urban development styles supported bird assemblages with different species composition. In land-sparing, there was a greater abundance of ground feeder species with a high propensity to form flocks for feeding and breeding such as Zenaida auriculata and Columba livia [67,68]. These species may require contiguous extensions of lawn for feeding. Turdus rufiventris, which feeds on worms and insects on the ground, also was more abundant in land-sparing. In Argentinian cities, high abundances of these species were often reported in large urban parks, which resemble land-sparing development style [69,70,71]. On the other hand, land-sharing can provide a mixture of artificial and natural resources. The highest abundances of species such as Furnarius rufus, Troglodytes aedon, and Progne chalybea may be associated with their ability to nest on artificial structures and feed on the surrounding vegetation or air [69,72,73,74]. Other species more common in land-sharing, such as Pitangus sulphuratus, Molothrus bonariensis, Agelaioides badius, and Zonotrichia capensis, were often reported in residential areas along urbanization gradients [69,75,76] and can use artificial structures for nesting (L. M. Leveau pers. obs.). Moreover, additional mechanisms, such as inter-specific interactions, have been associated with changes in species occurrences and abundances between land-sparing and land-sharing development styles in European cities [14,77]. Studies aiming to analyze the ecological processes that shape species composition in urban environments are strongly encouraged due to gaps of knowledge in urban areas of Latin America [78].
The relationship between bird communities and urban development styles varied according to seasons. We found differences in species diversity and composition between land-sparing and land-sharing development styles only during the breeding season. Most of the species recorded in both cities can exploit resources present in urban environments [73,79]. As the home range of most of the bird species tends to be larger during the non-breeding season, the availability of resources and not their spatial arrangement in urban environments may influence the presence and abundance of species. However, the spatial arrangement of resources in urban environments may become relevant when species reduce their home range during the breeding season [37,80]. For instance, birds may prefer to nest on sites where they can find resources without getting far from their offspring [37,80]. However, in European cities, differences in the bird assemblage supported by land-sparing and land-sharing development styles were found during the non-breeding season [14]. These patterns highlight the importance of conducting studies during the breeding and non-breeding seasons since the response of bird assemblages to urban development styles may be heterogeneous not only spatially, i.e., between urban development styles, but also temporally [18].
Human disturbance is another factor that can influence bird diversity in urban development styles. It can be described in terms of pedestrian traffic, human density, and speed of approaching humans to birds [81,82]. We found a negative relationship between pedestrian traffic and bird diversity [83]. Pedestrian rate can reduce species occupation and persistence and affect the feeding activity of birds [81,84,85]. According to our results, urban planners should take into account strategies for pedestrian traffic calming to enhance species diversity and composition of bird assemblages in any urban development style [34,83]. However, additional mechanisms should be taken into account in further studies. During the survey, we recorded people that occurred within the point count, but we did not record their activity. It has been shown that patterns of human activity, such as bird feeding, can shape the presence and abundance of birds in urban green spaces [86]. Therefore, future studies should shed light on this topic that is still poorly understood. On the other hand, no association pattern was found between species diversity and environmental noise. This result was unexpected since it has been shown that vehicle traffic, which is one of the most frequently cited sources of environmental noise, affected attributes of bird assemblages in both cities [69,83]. However, environmental noise is often associated to changes in urban land use, i.e., urban cores (administrative and commercial areas) usually present higher levels of noise than suburban and peri-urban areas [79]. In our study, changes in bird diversity associated to changes in environmental noise may not be significant since paired samples of urban development styles were located across the urban matrix. In this sense, bird diversity in control was always lower than land-sparing and land-sharing development styles, even if rectangles were located in the urban core or in suburban/peri-urban areas.
It is often reported that bird diversity is negatively associated to distance to the surrounding natural habitats [87,88]. Natural habitats can act as source habitats, and consequently, the flow of individuals from different species towards the urban landscape can take place. Riparian corridors of the La Plata basin represent highly dynamic and heterogeneous habitats with high levels of biodiversity as a result of an ecotone of species assemblages from tropical and temperate regions [89]. In this sense, Santa Fe and Buenos Aires city are surrounded by these riparian environments, and consequently, we hypothesized a negative distance effect. The lack of association between the distance to the main watercourses and bird diversity may be related to the following ecological processes. First, bird assemblages within the urban matrix of both cities present a subset of native species than in surrounding riparian corridors [90]. It has been shown that urban systems can filter bird species according to their ecological traits [75,91]. In both cities, bird assemblages were composed of species that were often considered as urban exploiters and urban adapters, i.e., species that are able to inhabit and exploit urban habitats [92]. In addition, the success of colonizing urban systems may also be associated with the abundance of species in surrounding non-urban areas [93]. Since knowledge about ecological processes that shape bird assemblages can help to define conservation strategies within cities (e.g., Leveau [94]), future studies aiming to understand the effect of surrounding non-urban habitats on urban bird assemblages are required.
Bird diversity was influenced by the coverage of vegetation at both the local and landscape level. It has been widely documented that the coverage of vegetation is positively associated to bird diversity since it implies more resources to species [94,95]. Our results agree with these previous findings. However, in Buenos Aires, we found a negative association between the coverage of vegetation and bird diversity at the landscape level. Although these results were unexpected, this negative association may be caused by the low variability in the coverage of vegetation at the landscape scale between sample sites. Most of the landscapes surrounding our sites (>90%) presented a vegetation coverage lower than 40%. Buenos Aires is a compact city where impervious surfaces predominate over vegetation across the urban matrix [96]. In this context, urban green spaces with the highest vegetation coverage within the city may support the highest levels of bird diversity because of a greater availability of resources than surrounding areas [70]. On the other hand, not only the coverage of vegetation is a determinant of resources for birds in urban environments, but also the vegetation diversity and composition [97], which were not assessed in our study.
The abundance of Zenaida auriculata, Furnarius rufus, Myiopsitta monachus, Turdus rufiventris, and Patagioenas picazuro was higher in land-sparing/land-sharing urban development styles than in controls and in areas with higher percentage of vegetation coverage at the landscape scale. These species can inhabit cities such as Buenos Aires and Santa Fe, where urban green spaces are characterized by a mixture of non-vegetated infrastructure and vegetation mainly composed of non-native and ornamental species [69,73,83]. By contrast, the abundance of Columba livia and Passer domesticus increased in control sites with low vegetation coverage at the landscape scale. These species were often considered as urban exploiters in cities worldwide because of generalist habits which allow them to feed on food discarded by humans and nest in buildings [28,69,98].
Land-sparing and land-sharing strategies should be taken into account in future urban planning to enhance biodiversity within the urban matrix in both cities. However, we emphasize three important potential extensions of our work. Firstly, we have considered taxonomic diversity and composition of bird assemblages. Follow-up work needs to examine other attributes of bird assemblages such as functional and phylogenetic diversity and abundance of native and exotic species to reduce gaps of information in the association between urban development style and bird assemblages [14,15,16]. Secondly, it is necessary to analyze the potential synergistic and interactive role that the two urban development styles can play. For example, the inclusion of two urban development styles may have positive ecological impacts by increasing connectivity within the urban matrix. Habitats more typical of a land-sharing development style such as small urban parks and wooded streets were often reported as urban corridors, favoring connectivity between large urban parks and increasing bird diversity [99,100,101]. Thirdly, enhancement of biodiversity in urban ecosystems can be quite important as some evidence suggests that personal exposure to natural features in everyday life is a major determinant of sensitivity to environmental issues [102,103]. Consequently, the third worthwhile extension would examine how the diversity and composition of bird assemblages in each urban development style influence human well-being [104,105,106,107].
Our conceptualization and spatial representation of land-sparing and land-sharing development styles corresponded to urban habitats with structural differences, i.e., differences in spatial configuration of vegetation cover. However, the association pattern between the urban development style and bird assemblages may vary according to land use. For example, the configuration of vegetation cover can be analyzed in different land uses, such as commercial and industrial areas. Previous works have shown differences in the diversity and composition of bird assemblages in urban areas related to differences in land use and/or land cover [32,108]. This is an important extension of research since planning strategies generally reflect decisions based on both land use and land cover.

5. Conclusions

We found that the response of bird assemblages to urban development styles varied according to the season and the city. Differences in species diversity between land-sparing and land-sharing were restricted to Buenos Aires city during the breeding season. In contrast, differences in species composition were found in both cities during the breeding season. Due to the fact that both development styles benefit different species, the design of equal proportions of land-sharing and land-sparing landscapes will enhance the total bird diversity in the cities of Santa Fe and Buenos Aires. However, differences in these association patterns with other studies question the extent to which these patterns can be generalizable, and consequently, further studies are required to shed light on the local ecological processes that shape bird assemblages in cities. Additionally, strategies for calming pedestrian traffic and increasing vegetation coverage should be taken into account in future urban planning in order to enhance bird diversity within the urban matrix.

Supplementary Materials

The following supporting information can be downloaded at: https://www.mdpi.com/article/10.3390/ani13050894/s1, Figure S1: Image processing for the classification of sampling units as an urban development style; Figure S2: Ordination of sampling units from the city of Santa Fe and Buenos Aires obtained from a Principal Component Analysis; Figure S3: Sample completeness curves for each urban development style in the city of Santa Fe and Buenos Aires; Figure S4: Diagnostics of fitted generalized linear models for all response variables.

Author Contributions

Conceptualization, L.M.L. and M.A.C.; methodology, L.M.L. and M.A.C.; software, M.A.C.; validation, M.A.C.; formal analysis, M.A.C.; investigation, M.A.C., L.M.L. and I.N.G.; resources, M.A.C., L.M.L. and I.N.G.; data curation, M.A.C.; writing—original draft preparation, M.A.C.; writing—review and editing, M.A.C., L.M.L. and I.N.G.; visualization, L.M.L. and M.A.C.; supervision, L.M.L.; project administration, L.M.L.; funding acquisition, L.M.L. All authors have read and agreed to the published version of the manuscript.

Funding

This research was funded by the Agencia Nacional de Promoción de la Investigación, el Desarrollo Tecnológico y la Innovación, PICT 2018-03871.

Institutional Review Board Statement

Not applicable.

Informed Consent Statement

Not applicable.

Data Availability Statement

The datasets generated and/or analyzed during the current study are available upon request to the corresponding author.

Acknowledgments

The comments made by three anonymous reviewers greatly improved a first draft of the manuscript. The English writing was revised by Paloma Garcia Orza.

Conflicts of Interest

The authors have no relevant financial or non-financial interests to disclose.

References

  1. United Nations. World Urbanization Prospects 2018: Highlights; ST/ESA/SER.A/421; Department of Economic and Social Affairs, Population Division: New York, NY, USA, 2019. [Google Scholar]
  2. Liu, X.; Huang, Y.; Xu, X.; Li, X.; Li, X.; Ciais, P.; Lin, P.; Gong, K.; Ziegler, A.D.; Chen, A.; et al. High-spatiotemporal-resolution mapping of global urban change from 1985 to 2015. Nat. Sustain. 2020, 3, 564–570. [Google Scholar] [CrossRef]
  3. Grimm, N.B.; Faeth, S.H.; Golubiewski, N.E.; Redman, C.L.; Wu, J.; Bai, X.; Briggs, J.M. Global change and the ecology of cities. Science 2008, 319, 756–760. [Google Scholar] [CrossRef] [PubMed] [Green Version]
  4. Seto, K.C.; Güneralp, B.; Hutyra, L.R. Global forecasts of urban expansion to 2030 and direct impacts on biodiversity and carbon pools. Proc. Natl. Acad. Sci. USA 2012, 109, 16083–16088. [Google Scholar] [CrossRef] [PubMed] [Green Version]
  5. Pickett, S.T.; Cadenasso, M.L.; Grove, J.M.; Boone, C.G.; Groffman, P.M.; Irwin, E.; Kaushal, S.S.; Marshall, V.; McGrath, B.P.; Nilon, C.H.; et al. Urban ecological systems: Scientific foundations and a decade of progress. J. Environ. Manag. 2011, 92, 331–362. [Google Scholar] [CrossRef]
  6. Lowry, H.; Lill, A.; Wong, B.B. Behavioural responses of wildlife to urban environments. Biol. Rev. 2013, 88, 537–549. [Google Scholar] [CrossRef]
  7. Aronson, M.F.J.; La Sorte, F.A.; Nilon, C.H.; Katti, M.; Goddard, M.A.; Lepczyk, C.A.; Warren, P.S.; Williams, N.S.G.; Cilliers, S.; Clarckson, B.; et al. A global analysis of the impacts of urbanization on bird and plant diversity reveals key anthropogenic drivers. Proc. R. Soc. B 2014, 281, 20133330. [Google Scholar] [CrossRef]
  8. McKinney, M.L. Effects of urbanization on species richness: A review of plants and animals. Urban Ecosyst. 2008, 11, 161–176. [Google Scholar] [CrossRef]
  9. Norton, B.A.; Evans, K.L.; Warren, P.H. Urban biodiversity and landscape ecology: Patterns, processes and planning. Curr. Landsc. Ecol. Rep. 2016, 1, 178–192. [Google Scholar] [CrossRef] [Green Version]
  10. Lin, B.B.; Fuller, R.A. Sharing or sparing? How should we grow the world’s cities? J. Appl. Ecol. 2013, 50, 1161–1168. [Google Scholar] [CrossRef]
  11. Soga, M.; Yamaura, Y.; Koike, S.; Gaston, K.J. Land sharing vs. land sparing: Does the compact city reconcile urban development and biodiversity conservation? J. Appl. Ecol. 2014, 51, 1378–1386. [Google Scholar] [CrossRef]
  12. Guida-Johnson, B.; Faggi, A.M.; Zuleta, G.A. Effects of Urban Sprawl on Riparian Vegetation: Is Compact or Dispersed Urbanization Better for Biodiversity? River Res. Appl. 2017, 33, 959–969. [Google Scholar] [CrossRef]
  13. Caryl, F.M.; Lumsden, L.F.; van der Ree, R.; Wintle, B.A. Functional responses of insectivorous bats to increasing housing density support ‘land-sparing’ rather than ‘land-sharing’ urban growth strategies. J. Appl. Ecol. 2016, 53, 191–201. [Google Scholar] [CrossRef]
  14. Ibáñez-Álamo, J.D.; Morelli, F.; Benedetti, Y.; Rubio, E.; Jokimäki, J.; Pérez-Contreras, T.; Sprau, P.; Suhonen, J.; Tryjanowski, P.; Kaisanlahti-Jokimäki, M.-L.; et al. Biodiversity within the city: Effects of land sharing and land sparing urban development on avian diversity. Sci. Total. Environ. 2020, 707, 135477. [Google Scholar] [CrossRef] [PubMed] [Green Version]
  15. Villaseñor, N.R.; Escobar, M.A.H.; Hernández, H.J. Can Aggregated Patterns of Urban Woody Vegetation Cover Promote Greater Species Diversity, Richness and Abundance of Native Birds? Urban For. Urban Green. 2021, 61, 127102. [Google Scholar] [CrossRef]
  16. Sushinsky, J.R.; Rhodes, J.R.; Possingham, H.P.; Gill, T.K.; Fuller, R.A. How Should We Grow Cities to Minimize Their Biodiversity Impacts? Glob. Change Biol. 2013, 19, 401–410. [Google Scholar] [CrossRef]
  17. Leveau, L.M. Desde el árbol al bioma: Una solución multiescala para las aves urbanas. Hornero 2022, 37, 13–22. [Google Scholar] [CrossRef]
  18. Lepczyk, C.A.; La Sorte, F.A.; Aronson, M.F.; Goddard, M.A.; MacGregor-Fors, I.; Nilon, C.H.; Warren, P.S. Global patterns and drivers of urban bird diversity. In Ecology and Conservation of Birds in Urban Environments; Springer International Publishing: New York, NY, USA, 2017; pp. 13–33. [Google Scholar]
  19. Fuller, R.A.; Irvine, K.N.; Devine-Wright, P.; Warren, P.H.; Gaston, K.J. Psychological benefits of greenspace increase with biodiversity. Biol. Lett. 2007, 3, 390–394. [Google Scholar] [CrossRef] [Green Version]
  20. Luck, G.W.; Davidson, P.; Boxall, D.; Smallbone, L. Relations between Urban Bird and Plant Communities and Human Well-Being and Connection to Nature. Conserv. Biol. 2011, 25, 816–826. [Google Scholar] [CrossRef]
  21. Sekercioglu, C. Increasing awareness of avian ecological function. Trends Ecol. Evol. 2006, 21, 464–471. [Google Scholar] [CrossRef]
  22. Whelan, C.J.; Wenny, D.G.; Marquis, R.J. Ecosystem services provided by birds. Ann. N. Y. Acad. Sci. 2008, 1134, 25–60. [Google Scholar] [CrossRef]
  23. Leveau, L.M.; Villaseñor, N.R.; Lambertucci, S.A. Ornitología urbana en el Neotrópico: Estado de situación y desafíos. Hornero 2022, 37, 5–11. [Google Scholar] [CrossRef]
  24. Escobar-Ibáñez, J.F.; MacGregor-Fors, I. What’s New? An Updated Review of Avian Ecology in Urban Latin America. In Avian Ecology in Latin American Cityscapes; MacGregor-Fors, I., Escobar-Ibáñez, J.F., Eds.; Springer: Cham, Switzerland, 2017; pp. 11–31. [Google Scholar]
  25. Marzluff, J.M. A decadal review of urban ornithology and a prospectus for the future. IBIS 2016, 159, 1–13. [Google Scholar] [CrossRef]
  26. MacGregor-Fors, I.; Schondube, J.E. Gray vs. green urbanization: Relative importance of urban features for urban bird communities. Basic Appl. Ecol. 2011, 12, 372–381. [Google Scholar] [CrossRef]
  27. Silva, C.P.; García, C.E.; Estay, S.A.; Barbosa, O. Bird Richness and Abundance in Response to Urban Form in a Latin American City: Valdivia, Chile as a Case Study. PLoS ONE 2015, 10, e0138120. [Google Scholar] [CrossRef] [PubMed] [Green Version]
  28. Leveau, L.M.; Leveau, C.M.; Villegas, M.; Cursach, J.A.; Suazo, C.G. Bird communities along urbanization gradients: A comparative analysis among three neotropical cities. Ornitol. Neotrop. 2017, 28, 77–87. [Google Scholar] [CrossRef]
  29. Leveau, L.M.; Ruggiero, A.; Matthews, T.J.; Bellocq, M.I. A global consistent positive effect of urban green area size on bird richness. Avian Res. 2019, 10, 30. [Google Scholar] [CrossRef] [Green Version]
  30. Melo, M.A.; Campos-Silva, L.A.; Piratelli, A.J. Red clay roof and NDVI drive changes in bird species composition and functional evenness in housing areas of São Paulo megacity, Brazil. Hornero 2022, 37, 87–103. [Google Scholar] [CrossRef]
  31. De Camargo Barbosa, K.V.; Rodewald, A.D.; Ribeiro, M.C.; Jahn, A.E. Noise level and water distance drive resident and migratory bird species richness within a Neotropical megacity. Landsc. Urban Plan. 2020, 197, 103769. [Google Scholar] [CrossRef]
  32. Leveau, L.M.; Leveau, C.M. Street design in suburban areas and its impact on bird communities: Considering different diversity facets over the year. Urban For. Urban Green. 2020, 48, 126578. [Google Scholar] [CrossRef]
  33. Melo, M.A.; Sanches, P.M.; Filho, D.F.S.; Piratelli, A.J. Influence of habitat type and distance from source area on bird taxonomic and functional diversity in a Neotropical megacity. Urban Ecosyst. 2022, 25, 545–560. [Google Scholar] [CrossRef]
  34. Leveau, L.M.; Leveau, C.M. Does Urbanization Affect the Seasonal Dynamics of Bird Communities in Urban Parks? Urban Ecosyst. 2016, 19, 631–647. [Google Scholar] [CrossRef]
  35. Leveau, L.M.; Bocelli, M.L.; Quesada-Acuña, S.G.; González-Lagos, C.; Tapia, P.G.; Dri, G.F.; Delgado, C.A.; Garitano-Zavala, A.; Campos, J.; Benedetti, Y.; et al. Bird diversity-environment relationships in urban parks and cemeteries of the Neotropics during breeding and non-breeding seasons. PeerJ 2022, 10, e14496. [Google Scholar] [CrossRef]
  36. Hilden, O. Habitat Selection in Birds: A Review. Ann. Zool. Fenn. 1965, 2, 53–75. [Google Scholar]
  37. Sagario, M.C.; Cueto, V.R. Seasonal Space use and Territory Size of Resident Sparrows in the Central Monte Desert, Argentina. Ardeola 2014, 61, 153–159. [Google Scholar] [CrossRef]
  38. Oyarzabal, M.; Clavijo, J.; Oakley, L.; Biganzoli, F.; Tognetti, P.; Barberis, I.; Maturo, H.M.; Aragón, R.; Campanello, P.I.; Prado, D.; et al. Unidades de vegetación de la Argentina. Ecol. Austral 2018, 28, 40–63. [Google Scholar] [CrossRef] [Green Version]
  39. Beninde, J.; Veith, M.; Hochkirch, A. Biodiversity in cities needs space: A meta-analysis of factors determining intra-urban biodiversity variation. Ecol. Lett. 2015, 18, 581–592. [Google Scholar] [CrossRef]
  40. Schneider, C.A.; Rasband, W.S.; Eliceiri, K.W. NIH Image to ImageJ: 25 Years of image analysis. Nat. Methods 2012, 9, 671–675. [Google Scholar] [CrossRef]
  41. Mason, J.; Moorman, C.; Hess, G.; Sinclair, K. Designing suburban greenways to provide habitat for forest-breeding birds. Landsc. Urban Plan. 2007, 80, 153–164. [Google Scholar] [CrossRef]
  42. Sieving, K.E.; Willson, M.F.; De Santo, T.L. Defining Corridor Functions for Endemic Birds in Fragmented South-Temperate Rainforest. Conserv. Biol. 2000, 14, 1120–1132. [Google Scholar] [CrossRef]
  43. Tremblay, M.A.; Clair, C.C.S. Factors affecting the permeability of transportation and riparian corridors to the movements of songbirds in an urban landscape. J. Appl. Ecol. 2009, 46, 1314–1322. [Google Scholar] [CrossRef]
  44. Lê, S.; Josse, J.; Husson, F. FactoMineR: An R package for multivariate analysis. J. Stat. Softw. 2008, 25, 1–18. [Google Scholar] [CrossRef] [Green Version]
  45. R Core Team. R: A Language and Environment for Statistical Computing; R Foundation for Statistical Computing: Vienna, Austria, 2019; Available online: https://www.R-project.org/ (accessed on 20 January 2023).
  46. Bibby, C.J.; Hill, D.A.; Burgess, N.D.; Mustoe, S. Bird Census Techniques, 2nd ed.; Academic Press: London, UK, 2000. [Google Scholar]
  47. Ralph, J.C.; Droege, S.; Sauer, J.R. Managing and Monitoring Birds Using Point Counts: Standards and Applications. In Monitoring bird populations by point counts; Ralph, J.C., Sauer, J.R., Droege, S., Eds.; Department of Agriculture, Forest Service, Pacific Southwest Research Station: Albany, CA, USA, 1995; pp. 161–168. [Google Scholar]
  48. DeGraaf, R.M.; Geis, A.D.; Healy, P.A. Bird population and habitat surveys in urban areas. Landsc. Urban Plan. 1991, 21, 181–188. [Google Scholar] [CrossRef]
  49. Zanaga, D.; Van De Kerchove, R.; De Keersmaecker, W.; Souverijns, N.; Brockmann, C.; Quast, R.; Wevers, J.; Grosu, A.; Paccini, A.; Vergnaud, S.; et al. ESA WorldCover 10 m 2020 v100. 2021. Available online: https://doi.org/10.5281/zenodo.5571936 (accessed on 20 January 2023). [CrossRef]
  50. Hijmans, R. raster: Geographic Data Analysis and Modeling. R Package Version 3.6-11. 2022. Available online: https://CRAN.R-project.org/package=raster (accessed on 22 December 2022).
  51. Bivand, R.; Rundel, C. rgeos: Interface to Geometry Engine—Open Source (‘GEOS’). R Package Version 0.6-1. 2022. Available online: https://CRAN.R-project.org/package=rgeos (accessed on 22 December 2022).
  52. Hesselbarth, M.H.K.; Sciaini, M.; With, K.A.; Wiegand, K.; Nowosad, J. Landscapemetrics: An open-source R tool to calculate landscape metrics. Ecography 2019, 42, 1648–1657. [Google Scholar] [CrossRef] [Green Version]
  53. ToolsDev. Sound Meter–Decibel Meter & Noise Meter. 2016. Available online: https://play.google.com/store/apps/details?id=app.tools.soundmeter.decibel.noisedetector&hl=en_US (accessed on 14 February 2023).
  54. Jost, L.; González-Oreja, J. Midiendo la diversidad biológica: Más allá del índice de Shannon. Acta Zool. Lilloana 2012, 56, 3–14. [Google Scholar]
  55. Li, D. hillR: Taxonomic, functional, and phylogenetic diversity and similarity through Hill Numbers. J. Open Source Softw. 2018, 3, 1041. [Google Scholar] [CrossRef]
  56. Chao, A.; Chiu, C.-H.; Jost, L. Unifying Species Diversity, Phylogenetic Diversity, Functional Diversity, and Related Similarity and Differentiation Measures Through Hill Numbers. Annu. Rev. Ecol. Evol. Syst. 2014, 45, 297–324. [Google Scholar] [CrossRef] [Green Version]
  57. Chao, A.; Jost, L. Coverage-based rarefaction and extrapolation: Standardizing samples by completeness rather than size. Ecology 2012, 93, 2533–2547. [Google Scholar] [CrossRef]
  58. Chao, A.; Gotelli, N.J.; Hsieh, T.C.; Sander, E.L.; Ma, K.H.; Colwell, R.K.; Ellison, A.M. Rarefaction and extrapolation with Hill numbers: A framework for sampling and estimation in species diversity studies. Ecol. Monogr. 2014, 84, 45–67. [Google Scholar] [CrossRef] [Green Version]
  59. Hothorn, T.; Bretz, F.; Westfall, P. Simultaneous Inference in General Parametric Models. Biom. J. 2008, 50, 346–363. [Google Scholar] [CrossRef] [Green Version]
  60. Fox, J.; Weisberg, S. An {R} Companion to Applied Regression, 3rd ed.; Sage: Thousand Oaks, CA, USA, 2019; Available online: https://socialsciences.mcmaster.ca/jfox/Books/Companion/ (accessed on 14 February 2023).
  61. Lefcheck, J.S. piecewiseSEM: Piecewise structural equation modelling in r for ecology, evolution, and systematics. Methods Ecol. Evol. 2016, 7, 573–579. [Google Scholar] [CrossRef]
  62. Breheny, P.; Burchett, W. Visualization of Regression Models Using visreg. R J. 2017, 9, 56–71. [Google Scholar] [CrossRef]
  63. Hartig, F. DHARMa: Residual Diagnostics for Hierarchical (Multi-Level/Mixed) Regression Models. R Package Version 0.4.6. 2022. Available online: https://CRAN.R-project.org/package=DHARMa (accessed on 22 December 2022).
  64. Legendre, P.; Anderson, M.J. Distance-Based Redundancy Analysis: Testing Multispecies Responses in Multifactorial Ecological Experiments. Ecol. Monogr. 1999, 69, 1–24. [Google Scholar] [CrossRef]
  65. Oksanen, J.; Simpson, G.; Blanchet, F.; Kindt, R.; Legendre, P.; Minchin, P.; O’Hara, R.; Solymos, P.; Stevens, M.; Szoecs, E.; et al. Vegan: Community Ecology Package. R Package Version 2.6-2. 2022. Available online: https://CRAN.R-project.org/package=vegan (accessed on 22 December 2022).
  66. Jupke, J.F.; Schäfer, R.B. Should Ecologists Prefer Model- over Distance-Based Multivariate Methods? Ecol. Evol. 2020, 10, 2417–2435. [Google Scholar] [CrossRef] [PubMed]
  67. Baldaccini, N.E.; Giunchi, D.; Mongini, E.; Ragionieri, L. Foraging Flights of Wild Rock Doves (Columba l. livia): A Spatio-Temporal Analysis. Ital. J. Zool. 2000, 67, 371–377. [Google Scholar] [CrossRef] [Green Version]
  68. Murton, R.K.; Bucher, E.H.; Nores, M.; Reartes, J. The Ecology of the Eared Dove (Zenaida auriculata) in Argentina. Condor 1974, 76, 80–88. [Google Scholar] [CrossRef]
  69. Cristaldi, M.A.; Giraudo, A.R.; Arzamendia, V.; Bellini, G.P.; Claus, J. Urbanization impacts on the trophic guild composition of bird communities. J. Nat. Hist. 2017, 51, 2385–2404. [Google Scholar] [CrossRef]
  70. Curzel, F.; Leveau, L. Bird Taxonomic and Functional Diversity in Three Habitats in Buenos Aires City, Argentina. Birds 2021, 2, 217–229. [Google Scholar] [CrossRef]
  71. Lucero, M.M.; Brandán, Z.J.; Chani, J.M. Composición y Variación Anual de La Avifauna de Los Tres Grandes Parques Urbanos de San Miguel de Tucumán (Tucumán, Argentina). Acta Zool. Lilloana 2005, 49, 43–48. [Google Scholar]
  72. Fernandes, F.R.; Cruz, L.D.; Rodrigues, A.A.F. Molt Cycle of the Gray-Breasted Martin (Hirundinidae: Progne chalybea) in a Wintering Area in Maranhão, Brazil. Rev. Bras. Ornitol. 2007, 15, 436–438. [Google Scholar]
  73. Leveau, L.; Leveau, C. Comunidades de Aves En Un Gradiente Urbano de La Ciudad de Mar Del Plata, Argentina. Hornero 2004, 19, 13–21. [Google Scholar]
  74. Marreis, Í.T.; Sander, M. Preferência Ocupacional de Ninhos de João-de-Barro (Furnarius rufus, Gmelin) Entre Área Urbanizada e Natural. Biodivers. Pampeana 2006, 4, 29–31. [Google Scholar]
  75. Leveau, L.M. Consistency in bird community assembly over medium-term along rural-urban gradients in Argentina. Ecol. Process. 2021, 10, 34. [Google Scholar] [CrossRef]
  76. Perepelizin, P.V.; Faggi, A.M. Diversidad de Aves En Tres Barrios de La Ciudad de Buenos Aires, Argentina. Multequina 2009, 18, 71–85. [Google Scholar]
  77. Jokimäki, J.; Suhonen, J.; Benedetti, Y.; Diaz, M.; Kaisanlahti-Jokimäki, M.-L.; Morelli, F.; Pérez-Contreras, T.; Rubio, E.; Sprau, P.; Tryjanowski, P.; et al. Land-Sharing vs. Land-Sparing Urban Development Modulate Predator–Prey Interactions in Europe. Ecol. Appl. 2020, 30, e02049. [Google Scholar] [CrossRef] [PubMed]
  78. Leveau, M.L.; Zuria, I. Flocking the City: Avian Demography and Population Dynamics in Urban Latin America. In Avian Ecology in Latin American Cityscapes; Escobar-Ibáñez, J.F., MacGregor-Fors, I., Eds.; Springer: Berlin, Germany, 2017; pp. 57–78. [Google Scholar] [CrossRef]
  79. Cristaldi, M.A.; Sarquis, J.A.; Leveau, L.M.; Giraudo, A.R. Bird community responses to urbanization in a medium-sized Argentine city: Santo Tomé (Santa Fe Province) as a case study. Hornero 2022, 37, 105–120. [Google Scholar] [CrossRef]
  80. Rolando, A. On the ecology of home range in birds. Rev. Ecol. Terre Vie Soc. Natl. Prot. Nat. 2002, 57, 53–73, hal-03530065. [Google Scholar] [CrossRef]
  81. Blumstein, D.T.; Fernández-Juricic, E.; Zollner, P.A.; Garity, S.C. Inter-specific variation in avian responses to human disturbance. J. Appl. Ecol. 2005, 42, 943–953. [Google Scholar] [CrossRef]
  82. Mikula, P. Pedestrian Density Influences Flight Distances of Urban Birds. Ardea 2014, 102, 53–60. [Google Scholar] [CrossRef] [Green Version]
  83. Curzel, F.E.; Bellocq, M.I.; Leveau, L.M. Local and landscape features of wooded streets influenced bird taxonomic and functional diversity. Urban For. Urban Green. 2021, 66, 127369. [Google Scholar] [CrossRef]
  84. Fernández-Juricic, E.; Jokimäki, J. A habitat island approach to conserving birds in urban landscapes: Case studies from southern and northern Europe. Biodivers. Conserv. 2001, 10, 2023–2043. [Google Scholar] [CrossRef]
  85. Fernández-Juricic, E.; Tellería, J.L. Effects of Human Disturbance on Spatial and Temporal Feeding Patterns of Blackbird Turdus Merula in Urban Parks in Madrid, Spain. Bird Study 2000, 47, 13–21. [Google Scholar] [CrossRef]
  86. Seas, C.; Quesada-Acuña, S.G.; Barrientos, Z. Efecto de la infraestructura y usuarios de parques urbanos en las poblaciones de la Paloma Columba livia (Columbiformes: Columbidae) en Costa Rica (2014–2020). Hornero 2022, 37, 237–242. [Google Scholar] [CrossRef]
  87. Haas, A.R.; Kross, S.M.; Kneitel, J.M. Avian community composition, but not richness, differs between urban and exurban parks. J. Urban Ecol. 2020, 6, juaa028. [Google Scholar] [CrossRef]
  88. Ives, C.D.; Lentini, P.E.; Threlfall, C.G.; Ikin, K.; Shanahan, D.F.; Garrard, G.E.; Bekessy, S.A.; Fuller, R.A.; Mumaw, L.; Rayner, L.; et al. Cities are hotspots for threatened species. Glob. Ecol. Biogeogr. 2016, 25, 117–126. [Google Scholar] [CrossRef]
  89. Arzamendia, V.; Giraudo, A.R. Influence of large South American rivers of the Plata Basin on distributional patterns of tropical snakes: A panbiogeographical analysis. J. Biogeogr. 2009, 36, 1739–1749. [Google Scholar] [CrossRef]
  90. Rossetti, M.A.; Giraudo, A.R. Comunidades de aves de bosques fluviales habitados y no habitados por el hombre en el río Paraná medio, Argentina. Hornero 2003, 18, 89–96. [Google Scholar]
  91. Croci, S.; Butet, A.; Clergeau, P. Does urbanization filter birds on the basis of their biological traits? Condor 2008, 110, 223–240. [Google Scholar] [CrossRef]
  92. Leveau, L.M. Bird traits in urban–rural gradients: How many functional groups are there? J. Ornithol. 2013, 154, 655–662. [Google Scholar] [CrossRef]
  93. Leveau, L.M.; Gorleri, F.C.; Roesler, I.; González-Táboas, F. What makes an urban raptor? IBIS 2022, 164, 1213–1226. [Google Scholar] [CrossRef]
  94. Leveau, L.M. Primary productivity and habitat diversity predict bird species richness and composition along urban-rural gradients of central Argentina. Urban For. Urban Green. 2019, 43, 126349. [Google Scholar] [CrossRef]
  95. Escobar-Ibáñez, J.F.; Rueda-Hernández, R.; MacGregor-Fors, I. The Greener the Better! Avian Communities Across a Neotropical Gradient of Urbanization Density. Front. Ecol. Evol. 2020, 8, 500791. [Google Scholar] [CrossRef]
  96. Baxendale, C.; Buzai, G.D. Dinámica de crecimiento urbano y pérdida de suelos productivos en el Gran Buenos Aires (Argentina), 1869–2011. Análisis espacial basado en sistemas de información geográfica. Ser. Geogr. 2011, 17, 77–95. [Google Scholar]
  97. Yang, G.; Xu, J.; Wang, Y.; Wang, X.; Pei, E.; Yuan, X.; Li, H.; Ding, Y.; Wang, Z. Evaluation of microhabitats for wild birds in a Shanghai urban area park. Urban For. Urban Green. 2015, 14, 246–254. [Google Scholar] [CrossRef]
  98. Gorosito, C.A.; Cueto, V.R. Do small cities affect bird assemblages? An evaluation from Patagonia. Urban Ecosyst. 2020, 23, 289–300. [Google Scholar] [CrossRef]
  99. Aronson, M.F.; Lepczyk, C.A.; Evans, K.L.; A Goddard, M.; Lerman, S.B.; MacIvor, J.S.; Nilon, C.H.; Vargo, T. Biodiversity in the city: Key challenges for urban green space management. Front. Ecol. Environ. 2017, 15, 189–196. [Google Scholar] [CrossRef] [Green Version]
  100. Goddard, M.A.; Dougill, A.J.; Benton, T.G. Scaling up from gardens: Biodiversity conservation in urban environments. Trends Ecol. Evol. 2010, 25, 90–98. [Google Scholar] [CrossRef]
  101. Graviola, G.R.; Ribeiro, M.C.; Pena, J.C. Reconciling humans and birds when designing ecological corridors and parks within urban landscapes. AMBIO 2021, 51, 253–268. [Google Scholar] [CrossRef]
  102. Rohde, C.L.E.; Kendle, A.D. Human well-being, natural landscapes and wildlife in urban areas. A review. Engl. Nat. Sci. 1994, 22. [Google Scholar]
  103. Sebba, R. The Landscapes of Childhood: The Reflection of Childhood’s Environment in Adult Memories and in Children’s Attitudes. Environ. Behav. 1991, 23, 395–422. [Google Scholar] [CrossRef]
  104. Aerts, R.; Honnay, O.; Van Nieuwenhuyse, A. Biodiversity and human health: Mechanisms and evidence of the positive health effects of diversity in nature and green spaces. Br. Med Bull. 2018, 127, 5–22. [Google Scholar] [CrossRef] [Green Version]
  105. Dallimer, M.; Irvine, K.N.; Skinner, A.M.J.; Davies, Z.G.; Rouquette, J.R.; Maltby, L.; Warren, P.H.; Armsworth, P.; Gaston, K.J. Biodiversity and the Feel-Good Factor: Understanding Associations between Self-Reported Human Well-being and Species Richness. Bioscience 2012, 62, 47–55. [Google Scholar] [CrossRef] [Green Version]
  106. Hedblom, M.; Heyman, E.; Antonsson, H.; Gunnarsson, B. Bird song diversity influences young people’s appreciation of urban landscapes. Urban For. Urban Green. 2014, 13, 469–474. [Google Scholar] [CrossRef]
  107. Methorst, J.; Rehdanz, K.; Mueller, T.; Hansjürgens, B.; Bonn, A.; Böhning-Gaese, K. The importance of species diversity for human well-being in Europe. Ecol. Econ. 2021, 181, 106917. [Google Scholar] [CrossRef]
  108. Lerman, S.B.; Narango, D.L.; Avolio, M.L.; Bratt, A.R.; Engebretson, J.M.; Groffman, P.M.; Hall, S.J.; Heffernan, J.B.; Hobbie, S.E.; Larson, K.L.; et al. Residential yard management and landscape cover affect urban bird community diversity across the continental USA. Ecol. Appl. 2021, 31, e02455. [Google Scholar] [CrossRef] [PubMed]
Figure 1. Location of control (red circles), land-sharing (green), and land-sparing (blue) landscapes in Santa Fe (A) and Buenos Aires (B) city. Examples of sample units used in this study: (C(a)) land-sharing and (C(b)) land-sparing landscapes. The yellow line indicates the limits of the sample unit (300 × 200 m), whereas red points indicate the location of point counts.
Animals 13 00894 g001
Figure 2. Rarefaction curves of Hill numbers (species richness, q = 0; Shannon diversity, q = 1; and Simpson diversity, q = 2) in relation to sample coverage for control, land-sharing (lsh), and land-sparing (lsp) landscapes during the non-breeding (above) and breeding seasons (below) in Santa Fe and Buenos Aires city (AD, respectively), Argentina. Shaded bands indicate 95% confidence intervals.
Animals 13 00894 g002
Figure 3. Representation of the best generalized linear model for species richness (q = 0) in Buenos Aires and Santa Fe (Argentina). Species richness in relation to urban development style (A), pedestrian rate (B), and the interaction between the percentage of surrounding vegetation coverage and city (C) during the non-breeding season. Species richness in relation to urban development style (D) and pedestrian rate (E) during the breeding season. Abbreviations: lsh—land-sharing; lsp—land-sparing. Grey dots refer to sampling units (200 m × 300 m rectangles). Blue lines indicate the parameter estimates with 95% confidence intervals represented by the grey area.
Animals 13 00894 g003
Figure 4. Representation of the best generalized linear model for Shannon diversity (q = 1) in Buenos Aires and Santa Fe (Argentina). Shannon diversity in relation to urban development style (A), pedestrian rate (B), and the interaction between the percentage of surrounding vegetation coverage and city (C) during the non-breeding season. Shannon diversity in relation to urban development style (D), the interaction between the urban development style and the percentage of surrounding vegetation coverage (E), and the interaction between the surrounding vegetation coverage and city (F) during the breeding season. Abbreviations: lsh—land-sharing; lsp—land-sparing. Grey dots refer to sampling units (200 m × 300 m rectangles). Grey dots refer to sampling units (200 m × 300 m rectangles). Blue lines indicate the parameter estimates with 95% confidence intervals represented by the grey area.
Animals 13 00894 g004
Figure 5. Representation of the best generalized linear model for Simpson diversity (q = 2) in Buenos Aires and Santa Fe (Argentina). Simpson diversity in relation to urban development style (A) and pedestrian rate (B) during the non-breeding season. Simpson diversity in relation to urban development style (C) and the interaction between the percentage of surrounding vegetation coverage and city (D). Abbreviations: lsh—land-sharing; lsp—land-sparing. Blue lines indicate the parameter estimates with 95% confidence intervals represented by the grey area.
Animals 13 00894 g005
Figure 6. Distance-based redundancy analysis triplots showing the relationship between urban development styles (UDS) (points), species (code), and selected environmental variables (blue arrows) in Santa Fe and Buenos Aires city during the non-breeding (A,B) and breeding seasons (C,D). The right column shows analysis without control sites (B,D). The lines represent the direction (orientation with respect to the axis) and strength (length of the line) of the correlations between environmental variables and variation in species composition. Abbreviations: CITYstafe—Santa Fe city; CITYbsas—Buenos Aires city; VEGCOV—percentage vegetation cover surrounding sites; UDSc—control sites; UDSlsh—land-sharing sites; UDSlsp—land-sparing sites; coli—Columba livia; pado—Passer domesticus; zeau—Zenaida auriculata; mobo—Molothrus bonariensis; pisu—Pitangus sulphuratus; furu—Furnarius rufus; papi—Patagioenas picazuro; pama—Patagioenas maculosa; mymo—Myiopsitta monachus; brch—Brotogeris chiriri; psle—Psittacara leucophthalmus.
Animals 13 00894 g006
Table 1. List of species observed in control, land-sharing, and land-sparing landscapes during breeding (BS) and non-breeding (NBS) seasons in Santa Fe and Buenos Aires, Argentina. The sum of the highest number of individuals recorded during three visits in each urban development style and season is shown for each species. Nomenclature follows the South American Classification Committee of the American Ornithologists’ Union (Remsen et al., 2022).
Scientific NameSanta Fe CityBuenos Aires City
ControlLand-SharingLand-SparingControlLand-SharingLand-Sparing
NBSBSNBSBSNBSBSNBSBSNBSBSNBSBS
Columba livia12527324850927123132
Patagioenas maculosa2034105000020
Patagioenas picazuro0032323512103212
Leptotila verreauxi000001000000
Zenaida auriculata17242026264671211251749
Columbina picui0111162320001
Guira guira803858000000
Tapera naevia000001000000
Chlorostilbon lucidus030201010301
Hylocharis chrysura001011112211
Vanellus chilensis002332000000
Cathartes aura000001000000
Rostrhamus sociabilis000010000000
Rupornis magnirostris001110000000
Parabuteo unicinctus000000002301
Athene cunicularia002100000000
Picumnus cirratus000100000000
Melanerpes cactorum002120000000
Dryobates mixtus000101001000
Colaptes melanochloros000231001221
Colaptes campestris001101000000
Caracara plancus201020000222
Falco sparverius001201000000
Myiopsitta monachus421571117202472212
Brotogeris chiriri0000000024216
Amazona aestiva000000000232
Pyrrhura frontalis00000061414125
Pyrrhura molinae000000000002
Aratinga nenday000000000554
Psittacara leucophthalmus0000000201108
Taraba major000010000000
Lepidocolaptes angustirostris002211002111
Furnarius rufus5565128225954
Phacellodomus ruber000022000000
Pseudoseisura lophotes003132000000
Schoeniophylax phryganophilus002021000000
Camptostoma obsoletum001111000000
Serpophaga subcristata000000001211
Serpophaga griseicapilla001000000000
Pitangus sulphuratus354649334533
Machetornis rixosa112213001314
Myiodynastes maculatus000000000001
Tyrannus melancholicus000102000100
Tyrannus savana000203000101
Sublegatus modestus000100000000
Cyclarhis gujanensis011111000000
Progne tapera000504000101
Progne chalybea040607050604
Tachycineta leucorrhoa013204015503
Troglodytes aedon133322223424
Polioptila dumicola003222000001
Turdus rufiventris10222234117128
Turdus amaurochalinus005121000101
Mimus saturninus425230014223
Mimus triurus001000000001
Sturnus vulgaris0042020103716
Passer domesticus1318159111265251213
Spinus magellanicus010022000321
Zonotrichia capensis223223111211
Icterus pyrrhopterus002000000101
Molothrus rufoaxillaris000011001203
Molothrus bonariensis575521151014121
Agelaioides badius004440007374
Geothlypis aequinoctialis000001000000
Setophaga pitiayumi000101001111
Piranga flava000001001200
Sicalis flaveola011332002102
Sicalis luteola000002000000
Saltator coerulescens000001000000
Paroaria coronata020423000001
Paroaria capitata000101000000
Thraupis sayaca011222221202
Table 2. Final generalized linear models between bird diversity and environmental variables during (a) non-breeding and (b) breeding seasons: indicates interaction between variables.
Response VariablePredictorEstimateStandard Errorz Test/ t-testp
(a) Non-breeding season
Species richnessIntercept3.230.2313.6<0.001
Landscape_control−0.690.12−5.66<0.001
Landscape_land-sharing−0.160.1−1.630.1
Pedestrians−0.010.004−3.77<0.001
Vegetation−0.010.01−2.260.02
City_SantaFe−0.240.2−1.170.24
Vegetation:City_SantaFe0.010.012.230.026
Shannon diversityIntercept12.391.557.97<0.001
Landscape_control−4.290.79−5.4<0.001
Landscape_land-sharing−0.60.75−0.810.42
Pedestrians−0.090.03−3.55<0.001
Vegetation−0.070.04−1.870.07
City_SantaFe−2.191.3−1.680.1
Vegetation:City_SantaFe0.110.042.660.01
Simpson diversityIntercept8.320.5914.07<0.001
Landscape_control−3.030.62−4.93<0.001
Landscape_land-sharing−0.290.63−0.470.64
Pedestrians−0.060.02−4.17<0.001
(b) Breeding season
Species richnessIntercept3.170.0744.97<0.001
Landscape_control−0.750.09−7.92<0.001
Landscape_land-sharing−50.07−0.660.51
Pedestrians−0.010.003−3.240.001
Shannon diversityIntercept8.631.366.36<0.001
Landscape_control−2.211.52−1.450.15
Landscape_land-sharing5.251.872.80.007
Vegetation0.040.050.90.37
City_SantaFe−2.021.36−1.480.14
Landscape_control:Vegetation−0.130.06−2.070.04
Landscape_land-sharing:Vegetation−0.090.06−1.60.11
Vegetation:City_SantaFe0.130.052.670.01
Simpson diversityIntercept6.841.026.69<0.001
Landscape_control−2.710.79−3.420.001
Landscape_land-sharing2.820.713.99<0.001
Vegetation−0.0020.03−0.050.96
City_SantaFe−2.351.11−2.120.04
Vegetation:City_SantaFe0.10.042.670.01
Disclaimer/Publisher’s Note: The statements, opinions and data contained in all publications are solely those of the individual author(s) and contributor(s) and not of MDPI and/or the editor(s). MDPI and/or the editor(s) disclaim responsibility for any injury to people or property resulting from any ideas, methods, instructions or products referred to in the content.

