Article

Insights into Early Ontogenesis of Salmo salar: RNA Extraction, Housekeeping Gene Validation and Transcriptional Expression of Important Primordial Germ Cell and Sex-Determination Genes

by
Irfan Ahmad Bhat
1,*,
Milena Malgorzata Dubiel
1,
Eduardo Rodriguez
2 and
Zophonías Oddur Jónsson
1
1
Institute of Life and Environmental Sciences, School of Engineering and Natural Sciences, University of Iceland, 101 Reykjavik, Iceland
2
Benchmark Genetics, 220 Hafnarfjordur, Iceland
*
Author to whom correspondence should be addressed.
Animals 2023, 13(6), 1094; https://doi.org/10.3390/ani13061094
Submission received: 6 February 2023 / Revised: 10 March 2023 / Accepted: 17 March 2023 / Published: 19 March 2023

Abstract

:

Simple Summary

The development of primordial germ cells (PGCs) and sex determination (SD) is governed by a complex interplay of genes that can be targeted to hinder sexual development in fish. Obtaining high-quality ribonucleic acid (RNA) from Atlantic salmon embryos, especially after fertilization, can be extremely challenging due to the presence of a substantial amount of yolk. The objective of this research was to extract high-quality RNA from developing salmon embryos for use in downstream applications. The study also aimed to validate different housekeeping genes (HKGs) for a quantitative polymerase chain reaction (qPCR)-based assessment of PGC and SD genes during developmental stages in salmon. We isolated RNA from the developing embryos, and we present the validation of HKGs as well as the mRNA expression levels of important PGC and SD genes during the fertilization to hatching stage. The findings of this study could prove beneficial for researchers seeking to extract high-quality RNA from salmonids. Moreover, the transcript results may offer insights not only into the function of transcripts at specific developmental stages but also in identifying the stage with the highest expression levels, during which treatment to disrupt the function of the transcripts and ultimately the growth of PGCs could be administered.

Abstract

The challenge in extracting high-quality RNA impedes the investigation of the transcriptome of developing salmonid embryos. Furthermore, the mRNA expression pattern of important PGC and SD genes during the initial embryonic development of Salmo salar is yet to be studied. So, in the present study, we aimed to isolate high-quality RNA from eggs and developing embryos to check vasa, dnd1, nanos3a, sdf1, gsdf, amh, cyp19a, dmrt1 and foxl2 expression by qPCR. Additionally, four HKGs (GAPDH, UB2L3, eEf1a and β-actin) were validated to select the best internal control for qPCR. High-quality RNA was extracted, which was confirmed by spectrophotometer, agarose gel electrophoresis and Agilent TapeStation analysis. UB2L3 was chosen as a reference gene because it exhibited lower intra- and inter-sample variation. vasa transcripts were expressed in all the developmental stages, while dnd1 was expressed only up to 40 d°C. Nanos3a was expressed in later stages and remained at its peak for a shorter period, while sdf1 showed an irregular pattern of mRNA expression. The mRNA expression levels of SD genes were observed to be upregulated during the later stages of development, prior to hatching. This study presents a straightforward methodology for isolating high-quality RNA from salmon eggs, and the resulting transcript profiles of significant PGC and SD genes in S. salar could aid in improving our comprehension of reproductive development in this commercially important species.

1. Introduction

Atlantic salmon (Salmo salar of the Salmonidae family) is an anadromous fish that is native to rivers flowing into the North Atlantic Ocean from Northern Europe as far south as Spain, the Baltics, Canada and Northeastern USA [1]. Many natural Atlantic salmon populations have declined significantly due to overexploitation [2] and other anthropogenic factors [3]. Due to its popularity as food and overexploitation in the wild, there has been a considerable shift towards the farming of the species under controlled conditions. Ocean pen and land-based farming of A. salmon has grown into a billion-dollar industry [4,5], and they are currently experiencing exponential growth. However, the farming of salmon can have negative impacts on wild populations, as the farmed fish exhibit different breeding and feeding behavior and aggressive tendencies, while also potentially transmitting harmful diseases to wild populations [6,7,8].
Different policies, guidelines and procedures have been formulated to prevent the escape of farmed salmon [9,10]. Physical and environmental containment is not secure enough to prevent fish from escaping into the wild [11], which necessities focusing more on biological containment. In biological containment, sexual reproduction is disrupted so that the fish produced is completely sterile, and this is the best safeguard against the spread of cultured stocks by eliminating their reproductive interaction with wild fish [12]. Moreover, the sterile population also has better production time, flesh quality and growth by eliminating energy costs associated with breeding [13,14]. Triploid fish are sterile, but at the same time, their disease resistance and tolerance to the changing environment is low [15,16] making them sub-optimal for aquaculture. Disruption of the growth of primordial germ cells (PGC), which are required to produce germ cells in both sexes during embryonic stages, is becoming a popular way to achieve sterility in fish [17,18,19]. The most effective approach to prevent the formation of PGCs is to silence the genes responsible for their growth and migration. [20]. Surprisingly, the mRNA expression profile of most of the genes involved in the development of PGCs in A. salmon during the initial embryonic stages is yet to be studied in detail. Gaining knowledge of the mRNA expression levels of these genes can aid in tracking the effectiveness of treatments used to induce sterility by eliminating PGCs during the embryonic stage. The bottleneck for the analysis of transcript levels of different genes during embryonic stages is the extraction of quality mRNA from the large yolk-filled eggs. The RNA extraction from cyprinid eggs [mostly used as model organisms] is quite different from other fish species such as salmonids because of the larger egg diameter of the latter [21]. The larger egg diameter coincides with higher yolk content, making it difficult to isolate pure RNA from them. Additionally, due to the low cell-to-lipid ratio in fish eggs, RNA isolation from eggs is challenging, especially when it needs to be used for downstream applications [22]. In molecular biological and diagnostic applications, it is preferable to use high-quality RNA as a starting point. The quantity and quality of starting RNA are recognized to have an impact on the accuracy of gene expression evaluation. The difficulty in isolating pure RNA hinders the study of transcriptomic changes in unfertilized eggs and during the initial embryonic development of fishes, especially salmonids.
The most important step for the analysis of quantitative polymerase chain reaction (qPCR) data is normalization with the proper housekeeping gene (HKG) to eliminate pre-PCR and PCR processing variations [23,24]. The choice of an appropriate HKG is crucial for accurate and reliable results in qPCR analysis, as any variability or bias in their expression can affect the normalization and interpretation of the target gene expression. An ideal reference gene should be constantly expressed in the testing samples to prevent erroneous results [25]. Often, however, HKGs under different experimental conditions or developmental stages show variable results [26,27]. It is advised to validate more than one HKG for the normalization of qPCR data to avoid misleading results [28,29]. By validating housekeeping genes, we can ensure the reliability and reproducibility of qPCR experiments and minimize the risk of misinterpreting gene expression data.
In the present study, we developed an efficient way to extract cells from the developing embryo for RNA extraction. Additionally, the expression of four reference genes—glyceraldehyde 3-phosphate dehydrogenase (GAPDH), ubiquitin-conjugating enzyme E2 L3 (UB2L3), elongation factor 1-alpha (eEf1a) and beta-actin (β-actin)—to select the best internal control was assessed by qPCR. The stability in mRNA expression of the reference genes was validated using different statistical algorithms.
In addition, we examined the mRNA expression levels of several key genes, including vasa, dead-end gene (dnd1), nanos3a and stromal cell-derived factor 1 (sdf1), which are involved in the growth, development and migration of PGCs [30]. vasa belongs to the ATP-dependent RNA helicase of the DEAD (Asp–Glu–Ala–Asp)-box family and performs roles in germ cell origination, migration and development [31,32]. The dnd gene encodes an RNA-binding protein that is essential for PGC migration and prevents the degradation of germplasm RNAs by binding with microRNA that targets it [33,34]. nanos3a plays an important role in the migration and maintenance of germ cells [35,36,37,38]. sdf1 (chemokine ligand 1) is secreted by the somatic cells surrounding PGCs and provides chemoattractant signals, which are sensed by its receptor CXCR4B expressed on the PGCs itself and help in their migration [39]. Knockdown studies of sdf1 genes in fish disrupted the migration of PGC [40].
Similarly, the transcript profile of some important transcription factors required in SD and gonadal development in fish were analyzed during embryogenesis in A. salmon. The genes included gonadal somatic derived factor (gsdf), doublesex and mab-3 related transcription factor (dmrt1)), anti-Mullerian hormone (amh), forkhead box protein L2 (foxl2) and cytochrome P450arom (cyp19a) [41,42,43].

2. Materials and Methods

2.1. Fertilization and Embryo Development of S. salar

Fertilization of salmon eggs was carried out in the Vogar fish farm of Benchmark Genetics, Iceland, following a standard operating protocol of the company. Eggs were collected from mature S. salar by an abdominal cavity excision after being anesthetized with 2- phenoxyethanol (at 0.1 to 0.6 mL∙L−1). An equal volume of eggs from four different females along with the ovarian fluid were obtained and kept in the same container and mixed with cryopreserved milt for fertilization. At three hours post-fertilization, the eggs were transported to the wet lab of the Institute for Experimental Pathology, University of Iceland, Keldur. The fertilized eggs were subsequently moved to glass tanks (capacity 50 L) to undergo development. The water temperature (10 °C), water flow and dissolved oxygen were maintained throughout the experiment. A water temperature of 10 °C is considered optimum for the development of S. salar eggs [44]. Dead eggs (whitish) were constantly removed from the tanks to maintain the water quality and to prevent the growth of any fungal infection.

2.2. Sampling

The unfertilized eggs at day one and fertilized eggs during developmental stages (fertilization to hatching) (Table 1) were collected for RNA extraction. Ten eggs/embryos until 40 degree days (d°C), six embryos up to 340 d°C and three yolk sac fry or alevins (only the trunk portion was collected) were collected and pooled together, and four such pools were used to study gene expression. The detailed sampling is presented in Table 1.

2.3. Cell Extraction from the Embryo during Different Developmental Stages

After each sampling, the developing eggs were treated with 5% acetic acid for 5 min (to make the chorion transparent). The chorion was then carefully removed, and the cell mass was separated from the yolk using a pipette. The collected cells were placed into a 1.5 mL tube with 500 µL of ice-cold PBS. The cells were centrifuged at 12,000× g for 7 min, and the supernatant was removed without disturbing the cells. The step was repeated two times to remove any remaining yolk. The unfertilized eggs were immersed in water for 1–3 h and were then placed into acetic acid to remove the cell by dissection.

2.4. RNA Extraction and cDNA Synthesis

Total RNA from the embryonic cells was extracted using the TRI reagent (Sigma-Aldrich, St. Louis, MO, USA) extraction method. The samples were homogenized (Mini-Beadbeater, Sigma-Aldrich) using stainless steel beads of 3 mm diameter, and following the phase separation, precipitation and washing steps, the pellet obtained was dissolved in water. RNA integrity and yield were confirmed by NanoDrop™ 2000/2000c Spectrophotometer (ThermoFisher Scientific, Waltham, MA, USA) gel electrophoresis, TapeStation (Agilent 2200 TapeStation system, Agilent, St. Clara, CA, USA) and nanodrop spectrophotometer (Thermofisher Scientific), respectively. The RNA samples were prepared as per the protocol suggested by Agilent RNA ScreenTape System Quick Guide, run on 2200 TapeStation instrument and analyzed with 2200 TapeStation Controller Software. RNA was treated with DNase 1 to remove any DNA contamination. RNA was transcribed to complementary deoxyribonucleic acid (cDNA) using ProtoScript® II First Strand cDNA Synthesis Kit (New England Biolabs Inc., Ipswich, MA, USA) by oligo dT priming following the manufacturer’s instructions. The cDNA samples were stored at −20 °C prior to analysis.

2.5. Primers

All the primers except for dnd1 used in the present study were designed by Gene Runner software version 6.5.52 Beta. The mRNA sequences of all the genes of S. salar were retrieved from GenBank, NCBI, and the primer set was designed from the coding (cds) region. The dimers, hairpin loops, bulge loops, internal loops and match site were checked by the oligo analysis option of Gene Runner software. The primers were supplied by Microsynth AG company (Balgach, Switzerland) in a lyophilized form, which was dissolved in water and stored at −20 °C for further use. The primers were used to amplify the cDNA from S. salar embryos in RT-PCR, and the product was run on a 2% agarose gel. Only one band could be found at an expected size, which allowed us to use them in qPCR. In addition, a melting curve analysis was also performed to check the presence of only a single peak. The correlation coefficient (R2) of the primers was determined by serial dilution (10-fold) to generate the standard curve, and a value above 0.98 was accepted. The primer set for dnd1 was taken from the previous report [19]. The primer sequences used in the present study are presented in Table 2.

2.6. Quantitative PCR (qPCR) Analysis

Real-time PCR was performed in 96-well PCR plates on a QuantStudio Real-Time PCR Systems (Thermo Fisher Scientific) using SYBR green, Luna® Universal qPCR Master Mix (New England Biolabs Inc.) following manufacturers protocol with a slight modification in volume. Each sample was run in duplicate with a final volume of 10 µL reaction mixture per well. For each gene, a non-template control was also included in duplicate with 10 µL in volume. The qPCR program started with a 2 min hold at 50 °C followed by a 10 min hot start at 95 °C. It was followed by 40 cycles at 95 °C for 15 s and then the annealing temperature optimized for each primer set for 30 s. The melt curve analysis confirmed the presence of no dimer in the primers. The primer and PCR efficiency was also calculated from the slope of a standard curve generated by serials dilution of primers and cDNA. The expression analysis of the genes during different developmental stages was performed by using the 2−ΔCt method [45] using the UB2L3 gene as an internal control.

2.7. Validation of HKGs

The validation of the four HKGs, GAPDH, UB2L3, eEf1a and β-actin, was conducted to select the best internal control for the present study.

2.8. Data Analysis

Statistical analysis for the difference in expression levels of genes was carried out by a one-way ANOVA using SPSS 22.0 software (SPSS Inc., Chicago, IL, USA). Significant differences in mRNA expression of the genes were tested by one-way ANOVA, followed by Tukey’s HSD test (p < 0.05). Data are presented as mean ± standard deviation (SD), and p < 0.05 was considered statistically significant. To determine the stability of selected reference genes, different statistical algorithms were employed to analyze the set of data, i.e., the comparative delta Ct method [46], BestKeeper (version 1) [47], NormFinder (version 0.953) [48] and geNorm [49]. To select the most suitable reference gene, the results from the four methods were combined and screened by RefFinder [http://150.216.56.64/referencegene.phpm accessed on 20 September 2022], which gives comprehensive stability of HKGs and ranks them as per the stability [50].

3. Results

3.1. Embryonic Development

The fertilized eggs were allowed to develop at 10 °C, and their development was constantly monitored under the microscope. The embryos did not show any abnormalities that could vary the mRNA expression results.

3.2. RNA Quality

The nanodrop spectrophotometer showed a 260/280 ratio close to 2.0. The RNA in gel electrophoresis showed well-defined bands of 28s rRNA and 18s rRNA representing good-quality RNA, and TapStation results presented an RNA integrity number (RIN) value of more than eight. The figures of gel electrophoresis and the TapStation system are presented in Figure 1.

3.3. Validation of HKG

3.3.1. Expression Level of Selected Candidate Reference Genes by Cycle Threshold (Ct) Value Analysis

The Ct values obtained from the qPCR assay across various samples were utilized to assess the expression levels and variability of all potential reference genes. eEf1a was expressed the most (Ct values 18 to 25), followed by UB2L3 (Ct values 20 to 24), β-actin (Ct values 21–25) and GAPDH (Ct values 24–28). UB2L3 exhibited the least variation of Ct values in different samples than other HKGs (Figure 2).

3.3.2. Gene Stability Analysis of HKGs

The use of Ct values alone may not adequately indicate the stability of reference genes, highlighting the need to employ diverse statistical algorithms for data analysis. These algorithms can help determine the most robust reference genes that exhibit consistent expression levels across various experimental conditions and sample types. The stability analysis, which is based on the values generated from the delta Ct method, BestKeeper, NormFinder and geNorm algorithms, was used to generate the compressive stability (RefFinder) by which the best internal control was selected.
The analysis of the comparative delta Ct method is based on the average standard deviation, with a greater value indicating less stability and vice versa. UB2L3 showed the lowest average standard deviation (1.64), followed by GAPDH (1.96), β-actin (2.09) and eEf1a (2.30). This method indicates UB2L3 as the most stable HSK and eEf1a least stable.
The BestKeeper algorithm calculates the standard deviation of the data to predict the stability. The gene that shows the lowest value of standard deviation is considered the most stable internal control. In the present study, the lowest value was calculated for UB2L3 (0.89), and the highest value was calculated for eEf1a (1.64), indicating the former as the more stable candidate reference gene. For GAPDH, the calculated value was 1.23, and for β-actin, it was 1.28. The statistical analysis of HKGs by the BestKeeper algorithm is presented in Table 3. So according to the BestKeeper algorithm, the order of ranking of the HKGs was UB2L3, GAPDH, β-actin and eEf1a.
The NormFinder algorithm calculates the stability value of each HKG and ranks them accordingly, i.e., a gene with the lowest value is the most stable and vice versa. Based on this analysis, the decreasing order of values calculated for different HSK genes was 0.65 > 1.42 > 1.57 > 1.97 for UB2L3, GAPDH, β-actin and eEf1a, respectively. The data from the NormFinder algorithm indicated UB2L3 as the most stable and eEf1a as the least stable candidate reference genes.
Similarly, geNorm calculates the stability value and ranks the reference genes accordingly. The lowest value indicates more stability, and, in our case, UB2L3 and GAPDH showed a similar lowest value (1.291), indicating that they were more stable candidate reference genes than β-actin (1.698) and eEf1a (1.997). The stability analysis calculated by the delta CT method, BestKeeper, NormFinder and geNorm algorithms is presented in Figure 3.
The average stability of the three HKGs was finally elucidated by the comprehensive gene stability calculated from the RefFinder, with the lower values representing the most stable genes (Figure 4). Here, UB2L3 was reported to be the most stable candidate gene (average stability value of 1.0), followed by GAPDH (1.68), β-actin (3) and eEf1a (4).
Thus, from the above results, UB2L3 was the most stable HKG and was selected as an internal control to study the mRNA expression of different PGC and SD genes during the ontogenetic development of S. salar.

3.4. mRNA Expression of Genes Involved in PGC Development of S. salar Collected from Fertilization to Hatching Stages

3.4.1. vasa

The vasa transcript was found to be expressed significantly (p < 0.05) more in the embryos collected at 20 and 30 d°C. Up to 50 d°C, vasa mRNA expression was observed to be higher compared to unfertilized eggs. The mRNA expression was observed to be downregulated between 40 °C to 340 d°C, followed by an increase in expression at 430 d°C.

3.4.2. dnd1

The expression of dnd1 transcripts was found to be significantly higher (p < 0.05) in developed embryos collected at 10 d°C compared to unfertilized eggs. However, there was no significant difference (p < 0.05) in the transcript level between samples collected at 20 d°C and 30 d°C. The transcript was downregulated after 40 d°C and was almost absent in the later stages analyzed in this study.

3.4.3. nanos3a

The expression of nanos3a transcripts was found to be significantly (p < 0.05) upregulated at 40 d°C and 50 d°C. A moderate level of expression was also observed at 30 d°C, 70 d°C and 80 d°C. However, a decreasing trend in nanos3a expression was observed from 110 d°C onwards, reaching levels similar to those observed in unfertilized eggs and the initial two stages analyzed in this study.

3.4.4. sdf1

The expression pattern of the sdf1 transcript was irregular, with significantly higher expression observed at 10 d°C, followed by 30 d°C and 20 d°C. The expression level was drastically downregulated up to 210 d°C, followed by an upward trend in the subsequent stages analyzed in this study.
The graphical representation of different PGC genes during the developmental stages of S. salar is presented in Figure 5.

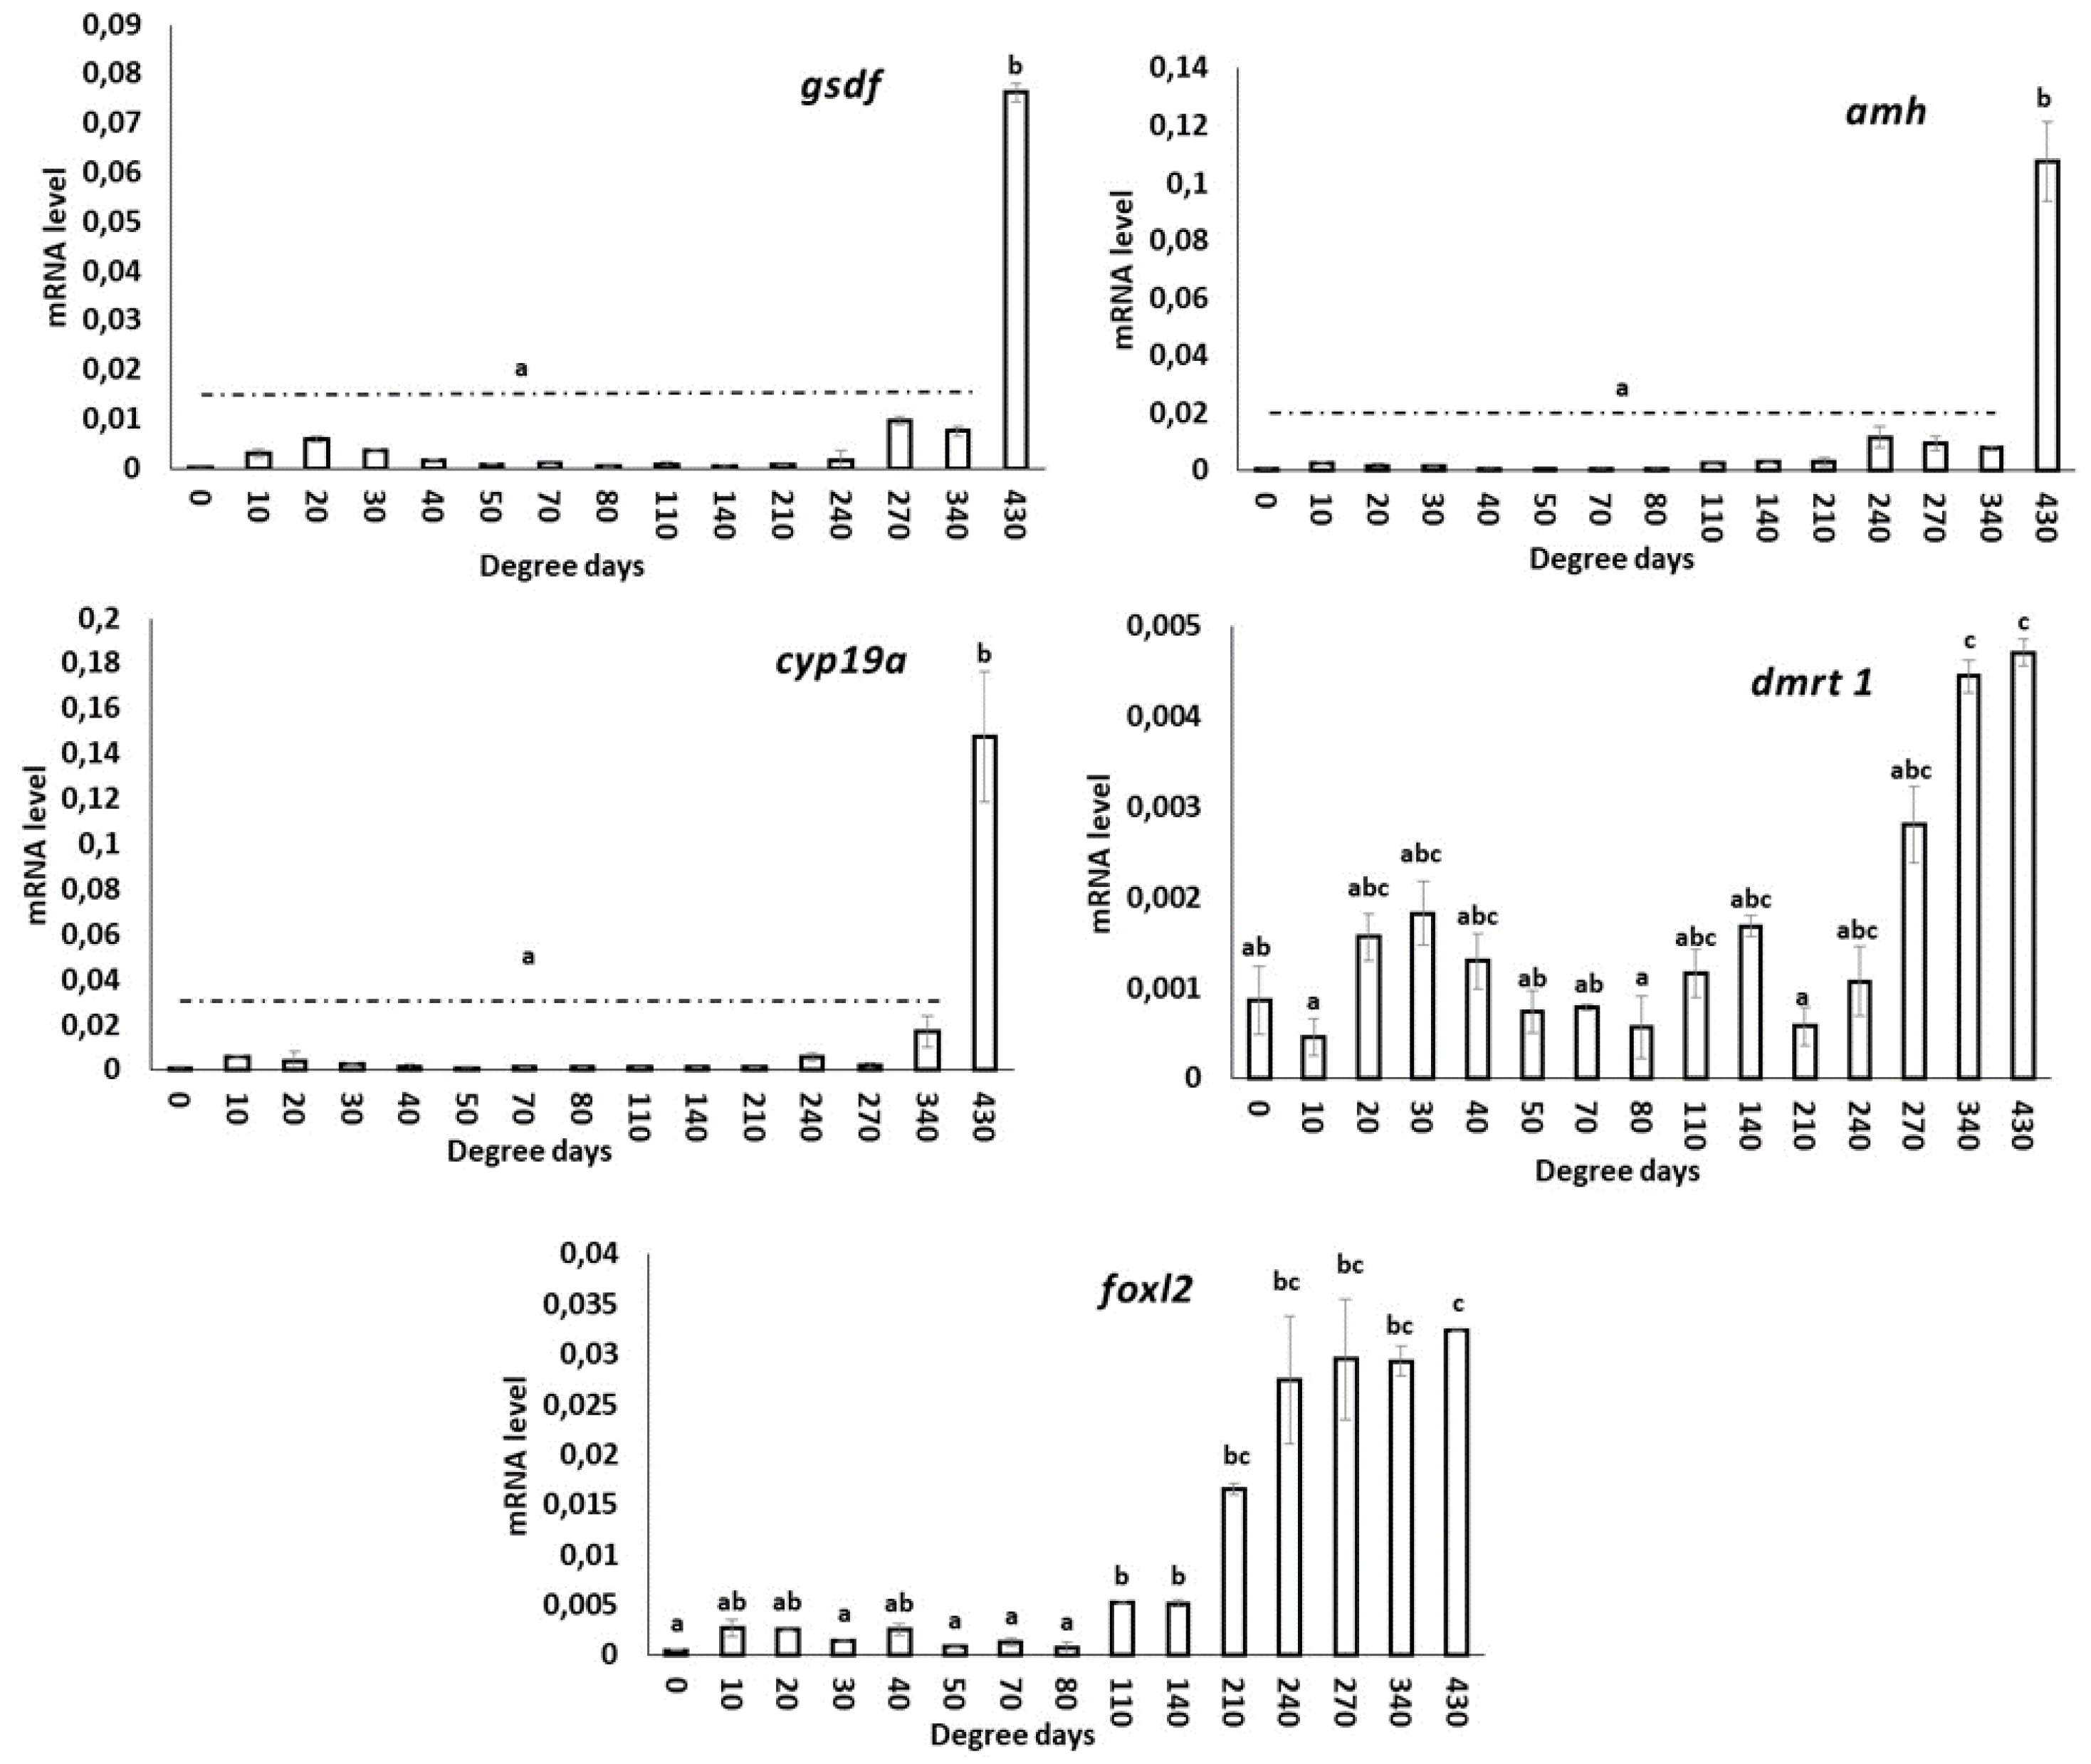
3.5. Expression of SD Genes in S. salar during Embryonic Developmental Stages

3.5.1. gsdf

The expression of this transcript was not detected until the late stages, beginning at 270 d°C. Significantly higher (p < 0.05) expression was observed in the hatching stage.

3.5.2. amh

The expression of amh was not detected until 210 d°C, after which it was expressed in the subsequent stages analyzed in this study. Significantly higher (p < 0.05) expression was observed at 430 d°C.

3.5.3. cyp19a

The expression pattern of cyp19a mRNA was similar to that of amh, with significantly higher (p < 0.05) expression observed at 430 d°C. No expression was detected in the unfertilized egg, and very low mRNA expression was detected up to 210 d°C.

3.5.4. dmrt1

The expression of dmrt1 showed a non-significant (p < 0.05) mRNA expression trend from the unfertilized egg to 270 d°C. However, in the 340 d°C and 430 d°C stages, the expression of dmrt1 was significantly increased compared to the other stages analyzed in this study.

3.5.5. foxl2

The expression of foxl2 mRNA was very low in unfertilized eggs and developing embryos up to 80 d°C. However, an increasing trend in mRNA expression was observed from 110 d°C onwards, with significantly higher expression observed at 430 d°C.
The graphical representation of different SD/sex-differentiation genes during the developmental stages of S. salar is presented in Figure 6.

4. Discussion

Gonadal SD is a significant event that occurs during embryogenesis to form a bipotential gonad, and its fate to turn into testes or ovaries is determined by different genetic or environmental cues [51,52]. Similarly, gametes originate from specialized cells known as PGCs that are formed in the early stages of embryonic development and migrate to the developing gonads under the influence of different molecular factors [30,43,53,54]. Deviation in the programming of gene expression of PGC and sex-determining factors in fish by artificial means can lead to either sex reversal or sterility [17,19,55,56,57]. In the present study, we measured the basal mRNA expression of some important genes involved in the development of PGCs and SD in S. salar by qPCR.
The high sensitivity, reproducibility, precise quantification, fast readout and easy operation make qPCR one of the most popular and commonly used tools for measuring gene expression analysis in molecular biology [58,59,60]. However, the output results of qPCR are affected by many factors such as RNA quality and quantity, reverse transcription, HKGs and PCR efficiencies [61,62], meaning careful attention must be paid during nucleic acid isolation from the tissue. Good-quality RNA is essential for qPCR analysis because it serves as the starting material for reverse transcription, which generates cDNA templates for qPCR amplification [63]. RNA degradation, fragmentation, or contamination can lead to inaccurate results and unreliable gene expression analysis. Techniques such as RNA quantification, quality assessment, and sample preparation are important for obtaining high-quality RNA for qPCR analysis.
As discussed in the introductory section, RNA extraction from salmon eggs is very difficult, and in this study, we isolated the embryonic cells by dechorionation. The immersion in acetic acid made the eggs transparent, facilitating easy cell collection, while centrifugation in PBS did not alter cellular physiology. Agarose gel electrophoresis results demonstrated the two bands, i.e., 28s rRNA and 18s rRNA, which is an indicator of high-quality and intact RNA [64]. The RIN quantifies the fragmentation of the RNA sample [65], and high-quality RNA should fall in the range of a value of eight. In the present study, the RIN value was more than eight, which indicates that the isolated RNA had good integrity.
Housekeeping genes are constitutively expressed and assumed to have stable expression levels across different samples and experimental conditions. However, in reality, the expression of housekeeping genes may vary depending on the tissue type, developmental stage or experimental treatments. Therefore, it is important to validate the expression stability of housekeeping genes under specific experimental conditions before using them for normalization. This can be achieved by using statistical algorithms such as geNorm, NormFinder, BestKeeper etc. The delta-CT method used in the present study compares ΔCt of the HKGs in pairs, thereby bypassing the need for accurate RNA quantification [46]. The average SD index is used to rank the housekeeping genes based on their stability in this method. BestKeeper, which is an Excel-based statistical algorithm, uses pairwise correlations to determine the most suitable internal control gene [47]. NormFinder uses a model-based approach, provides a distinct analysis of the sample subgroups and includes both intra and inter-group variation estimations to calculate a gene stability value [48,66]. geNorm calculates the average expression stability value (M), a pairwise variation between one HKG and other candidate reference genes. During analysis, it excludes the gene with a high M value in each step, and the process is repeated until the most stable gene (least M value) is selected. GeNorm estimates pairwise variation (Vn/n + 1) to determine the optimal number of candidate reference genes, and they should satisfy Vn/Vn + 1 below the threshold value of 0.15 [49]. Finally, the comprehensive stability was estimated on the basis of output results from other validation algorithms as discussed in the data analysis section to select the HKG as an internal control.
In the present study, UB2L3 was found to be the most stable HKG in the developing embryos of S. salar as per all the algorithms. Most of the ontogenetic studies on S. salar used the elongation factor gene [27,67,68] or 18s rRNA [69,70] as an internal control for qPCR studies. Additionally, in various gene expression studies of S. salar, the reference genes behave differently, as in immunity-related studies, where β-actin was stable [71,72,73,74] while the internal controls changed based on the stress factor (temperature stress, sea lice etc.) in an experiment [75,76,77,78]. So, the present results on HKG validation support the statement that a researcher should not rely on the so-called “golden standard” term and assume that the well-known housekeeping gene will work for every gene expression study [29].
The vasa transcript in the present study was expressed in unfertilized eggs and almost in all stages analyzed, but a significant decreasing trend was observed after 80 d°C. Moreover, after 430 d°C, the mRNA expression was significantly higher. Similarly, the dnd1 transcript was expressed in unfertilized eggs until 30 d°C and was either negligible or absent in the remaining stages. The semi-quantitative PCR results in S. salar revealed that the vasa transcript was expressed up to the 10-somite stage, and dnd1 was expressed up to the early blastula stage, which corresponds to 162 d°C and 30 d°C [at 6 °C], respectively [79]. In summer flounder (Paralichthys dentatus) and Nile tilapia (Oreochromis niloticus), both the transcripts were expressed up to the blastula stage [30,80]. The mRNA expression pattern of the two transcripts suggests that they are maternally inherited [79,81] and play an important role in the PGC specification and development. The sudden drop in mRNA expression between the blastula and gastrula stage is due to the degradation of the transcripts through an unknown mechanism, although some studies suggest that microRNAs are involved in degrading the maternal mRNAs [82,83,84]. Additionally, the genes could have been methylated because they have no role in certain stages [85]. In our study, the increase in vasa expression at 430 d°C, which corresponds to the yolk sac larval stage in S. salar, is in contrast with the results of the other teleost, in which low expression was detected [86,87,88]. In situ hybridization and immunohistochemistry detected the presence of vasa at a higher level in hatched larvae, which corroborates with the present results [79].
In the present study, the S. salar nanos3a was detected in the unfertilized egg, which suggests its maternal inheritance. The transcript began being expressed at 30 d°C and was drastically downregulated after 50 d°C, which suggests its role in PGCs for a shorter duration. This could indicate a role in migration or maintenance, but it needs to be further evaluated. Like our results, nanos3a expression declined in the later stages and was almost absent in the hatching stage in Atlantic cod (Gadus morhua) [89]. Similarly, nanos3a expression declined in zebrafish after 5 days post-fertilization [35].
In the present study, sdf1 was expressed in all embryonic developmental stages except 80–210 d°C, which is in accordance with the expression results in medaka [40]. The expression of this transcript is high after hatching, which suggests its role in the later stages of development of PGCs or with other somatic cells such as pigment cells or muscle cells [90,91].
A network of genes is involved during embryonic stages to guide the bipotential gonad to change into either the testis or ovary [92]. The most common SD genes identified in teleosts include gsdf, amh, cyp19a1a, foxl2 and dmrt variants [93,94]. gsdf and amh belong to the TGF-β superfamily of genes and control cell proliferation [95] and are mainly involved in male SD [96]. gsdf interacts with other male-specific genes such as sex dmy or dmrt1, and it affects estradiol production, a major female-specific hormone [97,98]. Its role in the regulation of PGC proliferation and germ cell differentiation has also been validated [99,100]. The role of amh in fish is to regulate male germ cell accumulation and prevent female-biased sex ratios [101]. Our results showed that gsdf and amh are weakly expressed during the embryonic development stages, and the mRNA expression was greater after hatching. In rainbow trout (Oncorhynchus mykiss), the RT-PCR results show that gsdf started being expressed at 2.5 dpf, and in zebrafish, the transcript was expressed after 16 dpf [99,102]. Our results of gsdf suggest that it is involved in later stages of PGC development in S. salar, which is supported by the fact that this transcript is restricted to somatic cells of the genital ridge surrounding PGCs in rainbow trout, and in gsdf morphants, the PGC proliferation was suppressed [99]. Similarly, amh expression is initiated in somatic cells when the PGCs are migrating in the somatic gonadal precursors [103,104]; therefore, it may play an important role in the maintenance of PGC in later developmental stages.
cyp19a1 is a member of the aromatase family of genes that are involved in the conversion of androgens to estrogens [105], and blocking its activity by aromatase inhibitors or gene editing results in a female-to-male sex reversal [106,107]. Like gsdf and amh, cyp19a1 was not expressed much in the embryonic stages in the present study, and the transcript started being expressed in hatched larvae, which is in consistent with the earlier reports stating its late-stage expression in fish [108,109]. The results indicate an unimportant role in the maintenance of PGC and its involvement mostly in the SD in fish [110].
dmrt1 belongs to the family of genes characterized by having a highly conservative zinc-finger DNA-binding motif [DM domain], and it plays an important role in male SD [111,112]. On the other hand, foxl2 is a member of the Fox gene family and is involved in ovarian differentiation and oogenesis in females [113]. Mutations in dmrt1 resulted in male-to-female sex reversal, and the opposite is true for fox12 mutations [111,114]. In the present study, dmrt1 mRNA was expressed in all stages of embryonic development as well in the yolk sac larvae. In Yellow catfish (Pelteobagrus fulvidraco), dmrt1 is expressed in all embryonic stages [115], while in ayu (Plecoglossus altivelis), it was expressed from day two post-fertilization [116]. dmrt1 has been found to be expressed in the somatic cells surrounding PGC, hence playing a crucial role in germ cell development [117], which may be the reason for its wide expression in embryonic developmental stages. foxl2 mRNA expression in the present study was weakly expressed up to 80 d°C and was increased from 110 d°C. In Celebes medaka (Oryzias celebensis), the foxl2 transcript started being expressed from the late blastula stage and increased in the subsequent stages [118]. The available data on the role of foxl2 in PGCs is limited, and the present study suggests that it may have a function prior to the onset of sexual differentiation. However, further investigation is required to fully understand its role in PGC development.

5. Conclusions

To summarize, the study successfully extracted high-quality RNA from developing S. salar embryos, which was then used to analyze the expression of PGC genes during embryogenesis. The results provide insights into the expression patterns of key PGC transcripts during early development and could serve as a reference for future studies on gene editing efficiency in S. salar.

Author Contributions

Conceptualization, I.A.B. and E.R.; methodology, I.A.B. and M.M.D.; software, I.A.B.; formal analysis, I.A.B. and M.M.D.; validation, I.A.B. and M.M.D.; writing—original draft preparation, I.A.B.; supervision, Z.O.J.; project administration, E.R. All authors have read and agreed to the published version of the manuscript.

Funding

The research was funded by Benchmark Genetics, Iceland.

Institutional Review Board Statement

Ethics committee approval is not needed for regular or scientific fishing in Iceland (The Icelandic law on Animal protection, Law 15/1994, last updated with Law 55/2013).

Informed Consent Statement

Not applicable.

Data Availability Statement

The data presented in this study are available on request from the corresponding author.

Acknowledgments

The authors thank Benchmark Genetics Iceland for providing grants to carry out the work. Additionally, we would like to thank the University of Iceland for providing the necessary facilities to carry out the work. M.M.D. would like to thank Yehwa Jin and Katarzyna Miedzinska-Bielecka for their help in performing RNA analysis by TapeStation at the Roslin Institute, University of Edinburgh, Scotland. The authors express their gratitude to Árni Kristmundsson, who provided valuable support by generously offering space in the wet lab at the Institute for Experimental Pathology, University of Iceland, located at Keldnavegur 3, 112 Reykjavik, Iceland. This space was used for rearing the eggs, and the authors are thankful for this opportunity.

Conflicts of Interest

The authors declare no conflict of interest.

References

  1. Claytor, R.R.; MacCrimmon, H.R. Partitioning Size from Morphometric Data: A Comparison of Five Statistical Procedures Used in Fisheries Stock Identification Research; Fisheries and Oceans: Ottawa, On, Canada, 1987. [Google Scholar]
  2. International Council for the Exploration of the Sea (ICES). Working Group on North Atlantic Salmon (WGNAS). ICES Scientific Reports. 2019. Available online: https://www.ices.dk/sites/pub/Publication%20Reports/Expert%20Group%20Report/Fisheries%20Resources%20Steering%20Group/2019/WGNAS/WGNAS_2019.pdf (accessed on 10 December 2020).
  3. Forseth, T.; Barlaup, B.T.; Finstad, B.; Fiske, P.; Gjøsæter, H.; Falkegård, M.; Hindar, A.; Mo, T.A.; Rikardsen, A.H.; Thorstad, E.B.; et al. The major threats to Atlantic salmon in Norway. ICES J. Mar. Sci. 2017, 74, 1496–1513. [Google Scholar] [CrossRef]
  4. Lorentzen, T. Modeling climate change and the effect on the Norwegian salmon farming industry. Nat. Resour. Model. 2008, 21, 416–435. [Google Scholar] [CrossRef]
  5. Bjarnason, A.; Magnusdottir, K.S. The Salmon Sea Fish Farming Industry in Iceland. A review. Fish Aqua J. 2021, 10, 2. [Google Scholar] [CrossRef]
  6. Thorstad, E.B.; Fleming, I.A.; McGinnity, P.; Soto, D.; Wennevik, V.; Whoriskey, F. Incidence and impacts of escaped farmed Atlantic salmon Salmo salar in nature. In NINA Special Report 36; NINA: Trondheim, Norway, 2008. [Google Scholar]
  7. Naylor, R.L.; Hindar, K.; Fleming, I.A.; Goldburg, R.J.; Williams, S.E.I.; Volpe, J.P.; Whoriskey, F.G.; Eagle, J.; Kelso, D.J.; Mangel, M. Fugitive salmon: Assessing the risks of escaped fish from net-pen aquaculture. BioScience 2005, 55, 427–437. [Google Scholar] [CrossRef]
  8. Johansen, L.H.; Jensen, I.; Mikkelsen, H.; Bjørn, P.A.; Jansen, P.A.; Bergh, Ø. Disease interaction and pathogens ex-change between wild and farmed fish populations with special reference to Norway. Aquaculture 2011, 315, 167–186. [Google Scholar] [CrossRef] [Green Version]
  9. NASCO. Guidelines on Containment of Farm Salmon. The Guidelines Are Attached as Annex 3 to the Williamsburg Resolution, Adopted at the Twentieth Annual Meeting of NASCO in June 2003. Available online: https://nasco.int/wpcontent/uploads/2020/09/slg_containmentguidelines.pdf (accessed on 13 December 2022).
  10. Bailey, J.L.; Eggereide, S.S. Indicating sustainable salmon farming: The case of the new Norwegian aquaculture management scheme. Mar. Policy 2020, 117, 103925. [Google Scholar] [CrossRef]
  11. Wong, A.C.; Van Eenennaam, A.L. Transgenic approaches for the reproductive containment of genetically engineered fish. Aquaculture 2008, 275, 1–12. [Google Scholar] [CrossRef]
  12. Devlin, R.H.; Donaldson, E.M. Containment of genetically altered fish with emphasis on salmonids. In Transgenic Fish; World Scientific press: Singapore, 1992; pp. 229–265. [Google Scholar]
  13. Ihssen, P.E.; McKay, L.R.; McMillan, I.; Phillips, R.B. Ploidy manipulation and gynogenesis in fishes: Cytogenetic and fisheries applications. Trans. Am. Fish. Soc. 1990, 119, 698–717. [Google Scholar] [CrossRef]
  14. McClure, C.A.; Hammell, K.L.; Moore, M.; Dohoo, I.R.; Burnley, H. Risk factors for early sexual maturation in Atlantic salmon in seawater farms in New Brunswick and Nova Scotia, Canada. Aquaculture 2007, 272, 370–379. [Google Scholar] [CrossRef]
  15. Jhingan, E.; Devlin, R.H.; Iwama, G.K. Disease resistance, stress response and effects of triploidy in growth hormone transgenic coho salmon. J. Fish Biol. 2003, 63, 806–823. [Google Scholar] [CrossRef]
  16. Sambraus, F.; Olsen, R.E.; Remen, M.; Hansen, T.J.; Torgersen, T.; Fjelldal, P.G. Water temperature and oxygen: The effect of triploidy on performance and metabolism in farmed Atlantic salmon (Salmo salar L.) post-smolts. Aquaculture 2017, 473, 1–12. [Google Scholar] [CrossRef]
  17. Wong, T.T.; Zohar, Y. Production of reproductively sterile fish by a non-transgenic gene silencing technology. Sci. Rep. 2015, 5, 15822. [Google Scholar] [CrossRef] [PubMed] [Green Version]
  18. Zhang, Y.; Chen, J.; Cui, X.; Luo, D.; Xia, H.; Dai, J.; Zhu, Z.; Hu, W. A controllable on-off strategy for the reproductive containment of fish. Sci. Rep. 2015, 5, 7614. [Google Scholar] [CrossRef] [PubMed] [Green Version]
  19. Wargelius, A.; Leininger, S.; Skaftnesmo, K.O.; Kleppe, L.; Andersson, E.; Taranger, G.L.; Schulz, R.W.; Edvardsen, R.B. Dnd1 knockout ablates germ cells and demonstrates germ cell independent sex differentiation in Atlantic salmon. Sci. Rep. 2016, 6, 21284. [Google Scholar] [CrossRef] [PubMed] [Green Version]
  20. Wong, T.T.; Zohar, Y. Production of reproductively sterile fish: A mini-review of germ cell elimination technologies. Gen. Comp. Endocrinol. 2015, 221, 3–8. [Google Scholar] [CrossRef]
  21. Bonisławska, M.; Formicki, K.; Korzelecka-Orkisz, A.; Winnicki, A. Fish egg size variability: Biological significance. Differences 2001, 40, 55. [Google Scholar]
  22. Cirera, S. Highly efficient method for isolation of total RNA from adipose tissue. BMC Res. Notes 2013, 6, 472. [Google Scholar] [CrossRef] [Green Version]
  23. Ahi, E.P.; Guðbrandsson, J.; Kapralova, K.H.; Franzdóttir, S.R.; Snorrason, S.S.; Maier, V.H.; Jónsson, Z.O. Vali-dation of reference genes for expression studies during craniofacial development in arctic charr. PLoS ONE 2013, 8, e66389. [Google Scholar] [CrossRef] [Green Version]
  24. Köhsler, M.; Leitsch, D.; Müller, N.; Walochnik, J. Validation of reference genes for the normalization of RT-qPCR gene expression in Acanthamoeba spp. Sci. Rep. 2020, 10, 10362. [Google Scholar] [CrossRef]
  25. McCurley, A.T.; Callard, G.V. Characterization of housekeeping genes in zebrafish: Male-female differences and effects of tissue type, developmental stage and chemical treatment. BMC Mol. Biol. 2008, 9, 102. [Google Scholar] [CrossRef] [Green Version]
  26. Schmittgen, T.D.; Zakrajsek, B.A. Effect of experimental treatment on housekeeping gene expression: Validation by real-time, quantitative RT-PCR. J. Biochem. Biophys. Methods 2000, 46, 69–81. [Google Scholar] [CrossRef]
  27. Olsvik, P.A.; Lie, K.K.; Jordal, A.E.O.; Nilsen, T.O.; Hordvik, I. Evaluation of potential reference genes in real-time RT-PCR studies of Atlantic salmon. BMC Mol. Biol. 2005, 6, 21. [Google Scholar] [CrossRef] [Green Version]
  28. Bustin, S.A.; Benes, V.; Garson, J.A.; Hellemans, J.; Huggett, J.; Kubista, M.; Mueller, R.; Nolan, T.; Pfaffl, M.W.; Shipley, G.L.; et al. The MIQE Guidelines: M inimum I nformation for Publication of Quantitative Real-Time PCR E xperiments. Clin. Chem. 2009, 55, 611–622. [Google Scholar] [CrossRef] [Green Version]
  29. Kozera, B.; Rapacz, M. Reference genes in real-time PCR. J. Appl. Genet. 2013, 54, 391–406. [Google Scholar] [CrossRef] [Green Version]
  30. Jin, Y.H.; Davie, A.; Migaud, H. Expression pattern of nanos, piwil, dnd1, vasa and pum genes during ontogenic development in Nile tilapia Oreochromis niloticus. Gene 2019, 688, 62–70. [Google Scholar] [CrossRef] [PubMed] [Green Version]
  31. Knaut, H.; Pelegri, F.; Bohmann, K.; Schwarz, H.; Nüsslein-Volhard, C. Zebrafish vasa RNA but not its protein is a component of the germ plasm and segregates asymmetrically before germline specification. J. Cell Biol. 2000, 149, 875–888. [Google Scholar] [CrossRef] [Green Version]
  32. Zhou, L.; Wang, X.; Du, S.; Wang, Y.; Zhao, H.; Du, T.; Yu, J.; Wu, L.; Song, Z.; Liu, Q.; et al. Germline Specific Expression of a vasa Homologue Gene in the Viviparous Fish Black Rockfish (Sebastes schlegelii) and Functional Analysis of the vasa 3′ Untranslated Region. Front. Cell Dev. Biol. 2020, 8, 575788. [Google Scholar] [CrossRef]
  33. Kedde, M.; Strasser, M.J.; Boldajipour, B.; Vrielink, J.A.F.O.; Slanchev, K.; le Sage, C.; Nagel, R.; Voorhoeve, P.M.; van Duijse, J.; Ørom, U.A.; et al. RNA-binding protein Dnd1 inhibits microRNA access to target mRNA. Cell 2007, 131, 1273–1286. [Google Scholar] [CrossRef] [PubMed] [Green Version]
  34. Wang, X.; Liu, Q.; Xiao, Y.; Yang, Y.; Wang, Y.; Song, Z.; You, F.; An, H.; Xiao, Z.; Xu, S.; et al. The dnd RNA identifies germ cell origin and migration in olive flounder (Paralichthys olivaceus). BioMed Res. Int. 2015, 2015, 428591. [Google Scholar] [PubMed] [Green Version]
  35. Köprunner, M.; Thisse, C.; Thisse, B.; Raz, E. A zebrafish nanos-related gene is essential for the development of pri-mordial germ cells. Genes Dev. 2001, 15, 2877–2885. [Google Scholar] [CrossRef]
  36. Tsuda, M.; Sasaoka, Y.; Kiso, M.; Abe, K.; Haraguchi, S.; Kobayashi, S.; Saga, Y. Conserved role of nanos proteins in germ cell development. Science 2003, 301, 1239–1241. [Google Scholar] [CrossRef]
  37. Saga, Y. Function of Nanos2 in the male germ cell lineage in mice. Cell. Mol. Life Sci. 2010, 67, 3815–3822. [Google Scholar] [CrossRef]
  38. Han, K.; Chen, S.; Cai, M.; Jiang, Y.; Zhang, Z.; Wang, Y. Nanos3a not nanos1 and nanos2 is a germ cell marker gene in large yellow croaker during embryogenesis. Comp. Biochem. Physiol. Part B Biochem. Mol. Biol. 2018, 218, 13–22. [Google Scholar] [CrossRef]
  39. Saito, T.; Goto-Kazeto, R.; Kawakami, Y.; Nomura, K.; Tanaka, H.; Adachi, S.; Arai, K.; Yamaha, E. The mechanism for primordial germ-cell migration is conserved between Japanese eel and zebrafish. PLoS ONE 2011, 6, e24460. [Google Scholar] [CrossRef] [Green Version]
  40. Herpin, A.; Fischer, P.; Liedtke, D.; Kluever, N.; Neuner, C.; Raz, E.; Schartl, M. Sequential SDF1a and b-induced mobility guides Medaka PGC migration. Dev. Biol. 2008, 320, 319–327. [Google Scholar] [CrossRef] [Green Version]
  41. Guiguen, Y.; Fostier, A.; Piferrer, F.; Chang, C.F. Ovarian aromatase and estrogens: A pivotal role for gonadal sex differentiation and sex change in fish. Gen. Comp. Endocrinol. 2010, 165, 352–366. [Google Scholar] [CrossRef] [PubMed]
  42. Hsu, C.W.; Chung, B.C. Evolution, Expression, and Function of Gonadal Somatic Cell-Derived Factor. Front. Cell Dev. Biol. 2021, 9, 1600. [Google Scholar] [CrossRef]
  43. Bhat, I.A.; Dar, J.Y.; Ahmad, I.; Mir, I.N.; Bhat, H.; Bhat, R.A.; Ganie, P.A.; Sharma, R. Testicular development and sper-matogenesis in fish: Insights into molecular aspects and regulation of gene expression by different exogenous factors. Rev. Aquac. 2021, 13, 2142–2168. [Google Scholar] [CrossRef]
  44. Gunnes, K. Survival and development of Atlantic salmon eggs and fry at three different temperatures. Aquaculture 1979, 16, 211–218. [Google Scholar] [CrossRef]
  45. Livak, K.J.; Schmittgen, T.D. Analysis of relative gene expression data using real-time quantitative PCR and the 2− ΔΔCT method. Methods 2001, 25, 402–408. [Google Scholar] [CrossRef] [PubMed]
  46. Silver, N.; Best, S.; Jiang, J.; Thein, S.L. Selection of housekeeping genes for gene expression studies in human reticu-locytes using real-time PCR. BMC Mol. Biol. 2006, 7, 33. [Google Scholar] [CrossRef] [Green Version]
  47. Pfaffl, M.W.; Tichopad, A.; Prgomet, C.; Neuvians, T.P. Determination of stable housekeeping genes, differentially regulated target genes and sample integrity: BestKeeper–Excel-based tool using pair-wise correlations. Biotechnol. Lett. 2004, 26, 509–515. [Google Scholar] [CrossRef]
  48. Andersen, C.L.; Jensen, J.L.; Ørntoft, T.F. Normalization of real-time quantitative reverse transcription-PCR data: A model-based variance estimation approach to identify genes suited for normalization, applied to bladder and colon cancer data sets. Cancer Res. 2004, 64, 5245–5250. [Google Scholar] [CrossRef] [PubMed] [Green Version]
  49. Vandesompele, J.; De Preter, K.; Pattyn, F.; Poppe, B.; Van Roy, N.; De Paepe, A.; Speleman, F. Accurate normalization of real-time quantitative RT-PCR data by geometric averaging of multiple internal control genes. Genome Biol. 2002, 3, 1–12. [Google Scholar] [CrossRef] [PubMed] [Green Version]
  50. Xie, F.; Xiao, P.; Chen, D.; Xu, L.; Zhang, B. miRDeepFinder: A miRNA analysis tool for deep sequencing of plant small RNAs. Plant Mol. Biol. 2012, 80, 75–84. [Google Scholar] [CrossRef]
  51. Trukhina, A.V.; Lukina, N.A.; Wackerow-Kouzova, N.D.; Smirnov, A.F. The variety of vertebrate mechanisms of sex determination. BioMed Res. Int. 2013, 2013, 587460. [Google Scholar] [CrossRef]
  52. Estermann, M.A.; Major, A.T.; Smith, C.A. Gonadal sex differentiation: Supporting versus steroidogenic cell lineage specification in mammals and birds. Front. Cell Dev. Biol. 2020, 8, 616387. [Google Scholar] [CrossRef]
  53. Cinalli, R.M.; Rangan, P.; Lehmann, R. Germ cells are forever. Cell 2008, 132, 559–562. [Google Scholar] [CrossRef] [Green Version]
  54. Robles, V.; Riesco, M.F.; Psenicka, M.; Saito, T.; Valcarce, D.G.; Cabrita, E.; Herraez, P. Biology of teleost primordial germ cells (PGCs) and spermatogonia: Biotechnological applications. Aquaculture 2017, 472, 4–20. [Google Scholar] [CrossRef]
  55. Kobayashi, T.; Kajiura-Kobayashi, H.; Guan, G.; Nagahama, Y. Sexual dimorphic expression of DMRT1 and Sox9a during gonadal differentiation and hormone-induced sex reversal in the teleost fish Nile tilapia (Oreochromis niloticus). Dev. -Ment. Dyn. Off. Publ. Am. Assoc. Anat. 2008, 237, 297–306. [Google Scholar]
  56. Li, M.; Yang, H.; Zhao, J.; Fang, L.; Shi, H.; Li, M.; Sun, Y.; Zhang, X.; Jiang, D.; Zhou, L.; et al. Efficient and heritable gene targeting in tilapia by CRISPR/Cas9. Genetics 2014, 197, 591–599. [Google Scholar] [CrossRef] [PubMed] [Green Version]
  57. Liu, X.; Dai, S.; Wu, J.; Wei, X.; Zhou, X.; Chen, M.; Tan, D.; Pu, D.; Li, M.; Wang, D. Roles of anti-Müllerian hormone and its duplicates in sex determination and germ cell proliferation of Nile tilapia. Genetics 2022, 220, iyab237. [Google Scholar] [CrossRef] [PubMed]
  58. Huggett, J.; Dheda, K.; Bustin, S.; Zumla, A. Real-time RT-PCR normalisation; strategies and considerations. Genes Immun. 2005, 6, 279–284. [Google Scholar] [CrossRef] [PubMed] [Green Version]
  59. Wong, M.L.; Medrano, J.F. Real-time PCR for mRNA quantitation. Biotechniques 2005, 39, 75–85. [Google Scholar] [CrossRef] [PubMed]
  60. Pabinger, S.; Rödiger, S.; Kriegner, A.; Vierlinger, K.; Weinhäusel, A. A survey of tools for the analysis of quantitative PCR (qPCR) data. Biomol. Detect. Quantif. 2014, 1, 23–33. [Google Scholar] [CrossRef] [Green Version]
  61. Bustin, S.A. Absolute quantification of mRNA using real-time reverse transcription polymerase chain reaction assays. J. Mol. Endocrinol. 2000, 25, 169–193. [Google Scholar] [CrossRef] [PubMed] [Green Version]
  62. Szabo, A.; Perou, C.M.; Karaca, M.; Perreard, L.; Quackenbush, J.F.; Bernard, P.S. Statistical modeling for selecting housekeeper genes. Genome Biol. 2004, 5, R59. [Google Scholar] [CrossRef] [Green Version]
  63. Fleige, S.; Pfaffl, M.W. RNA integrity and the effect on the real-time qRT-PCR performance. Mol. Asp. Med. 2006, 27, 126–139. [Google Scholar] [CrossRef]
  64. Sambrook, J.; Fritsch, F.F.; Maniatis, T. Molecular Cloning: A Laboratory Manual, 2nd ed.; Cold Spring Harbor Laboratory Press: New York, NY, USA, 1989. [Google Scholar]
  65. Schroeder, A.; Mueller, O.; Stocker, S.; Salowsky, R.; Leiber, M.; Gassmann, M.; Lightfoot, S.; Menzel, W.; Granzow, M.; Ragg, T. The RIN: An RNA integrity number for assigning integrity values to RNA measurements. BMC Mol. Biol. 2006, 7, 3. [Google Scholar] [CrossRef] [PubMed] [Green Version]
  66. Fernandes, J.M.; Mommens, M.; Hagen, Ø.; Babiak, I.; Solberg, C. Selection of suitable reference genes for real-time PCR studies of Atlantic halibut development. Comp. Biochem. Physiol. Part B Biochem. Mol. Biol. 2008, 150, 23–32. [Google Scholar] [CrossRef]
  67. Johnstone, K.A.; Lubieniecki, K.P.; Koop, B.F.; Davidson, W.S. Expression of olfactory receptors in different life stages and life histories of wild Atlantic salmon (Salmo salar). Mol. Ecol. 2011, 20, 4059–4069. [Google Scholar] [CrossRef] [PubMed]
  68. Lubieniecki, K.P.; Botwright, N.A.; Taylor, R.S.; Evans, B.S.; Cook, M.T.; Davidson, W.S. Expression analysis of sex-determining pathway genes during development in male and female Atlantic salmon (Salmo salar). Physiol. Genom. 2015, 47, 581–587. [Google Scholar] [CrossRef] [PubMed] [Green Version]
  69. Løvoll, M.; Johnsen, H.; Boshra, H.; Bøgwald, J.; Sunyer, J.O.; Dalmo, R.A. The ontogeny and extrahepatic expression of complement factor C3 in Atlantic salmon (Salmo salar). Fish Shellfish. Immunol. 2007, 23, 542–552. [Google Scholar] [CrossRef]
  70. Kleppe, L.; Wargelius, A.; Johnsen, H.; Andersson, E.; Edvardsen, R.B. Gonad specific genes in Atlantic salmon (Salmon salar L.): Characterization of tdrd7-2, dazl-2, piwil1 and tdrd1 genes. Gene 2015, 560, 217–225. [Google Scholar] [CrossRef]
  71. Brubacher, J.L.; Secombes, C.J.; Zou, J.; Bols, N.C. Constitutive and LPS-induced gene expression in a macrophage-like cell line from the rainbow trout (Oncorhynchus mykiss). Dev. Comp. Immunol. 2000, 24, 565–574. [Google Scholar] [CrossRef] [PubMed]
  72. Hong, S.; Peddie, S.; Campos-Pérez, J.J.; Zou, J.; Secombes, C.J. The effect of intraperitoneally administered recom-binant IL-1β on immune parameters and resistance to Aeromonas salmonicida in the rainbow trout (Oncorhynchus mykiss). Dev. Comp. Immunol. 2003, 27, 801–812. [Google Scholar] [CrossRef] [PubMed]
  73. Robertsen, B.; Bergan, V.; Røkenes, T.; Larsen, R.; Albuquerque, A. Atlantic salmon interferon genes: Cloning, sequence analysis, expression, and biological activity. J. Interferon Cytokine Res. 2003, 23, 601–612. [Google Scholar] [CrossRef] [PubMed] [Green Version]
  74. Acosta, F.; Lockhart, K.; Gahlawat, S.K.; Real, F.; Ellis, A.E. Mx expression in Atlantic salmon (Salmo salar L.) parr in response to Listonella anguillarum bacterin, lipopolysaccharide and chromosomal DNA. Fish Shellfish. Immunol. 2004, 17, 255–263. [Google Scholar] [CrossRef] [PubMed]
  75. Takle, H.; Baeverfjord, G.; Lunde, M.; Kolstad, K.; Andersen, Ø. The effect of heat and cold exposure on HSP70 ex-pression and development of deformities during embryogenesis of Atlantic salmon (Salmo salar). Aquaculture 2005, 249, 515–524. [Google Scholar] [CrossRef]
  76. Takle, H.; McLeod, A.; Andersen, O. Cloning and characterization of the executioner caspases 3, 6, 7 and Hsp70 in hyperthermic Atlantic salmon (Salmo salar) embryos. Comp. Biochem. Physiol. Part B Biochem. Mol. Biol. 2006, 144, 188–198. [Google Scholar] [CrossRef] [PubMed]
  77. Julin, K.; Johansen, L.H.; Sommer, A.I. Reference genes evaluated for use in infectious pancreatic necrosis virus re-al-time RT-qPCR assay applied during different stages of an infection. J. Virol. Methods 2009, 162, 30–39. [Google Scholar] [CrossRef]
  78. Fodnes, J.O.; Kvaal, G. Variance in Relative Gene Expression RT-qPCR Analysis of Atlantic Salmon-before, during and after Delousing. Bachelor’s Thesis, Norwegian University of Science and Technology, Faculty of Natural Sciences, Trondheim Ålesund Gjøvik, Norway, 2020. [Google Scholar]
  79. Nagasawa, K.; Fernandes, J.M.; Yoshizaki, G.; Miwa, M.; Babiak, I. Identification and migration of primordial germ cells in Atlantic salmon, Salmo salar: Characterization of vasa, dead end, and lymphocyte antigen 75 genes. Mol. Reprod. Dev. 2013, 80, 118–131. [Google Scholar] [CrossRef] [Green Version]
  80. Du, S.; Zhou, L.; Wang, X.; Xu, S.; Li, J.; Song, Z.; Liu, Q. Characterization of vasa and dnd1 homologs in summer flounder, Paralichthys dentatus: Expression analysis and colocalization of PGCs during embryogenesis. Theriogenology 2022, 181, 180–189. [Google Scholar] [CrossRef]
  81. Weidinger, G.; Stebler, J.; Slanchev, K.; Dumstrei, K.; Wise, C.; Lovell-Badge, R.; Thisse, C.; Thisse, B.; Raz, E. Dead end, a novel vertebrate germ plasm component, is required for zebrafish primordial germ cell migration and survival. Curr. Biol. 2003, 13, 1429–1434. [Google Scholar] [CrossRef] [Green Version]
  82. Giraldez, A.J.; Mishima, Y.; Rihel, J.; Grocock, R.J.; Van Dongen, S.; Inoue, K.; Enright, A.J.; Schier, A.F. Zebrafish MiR-430 promotes deadenylation and clearance of maternal mRNAs. Science 2006, 312, 75–79. [Google Scholar] [CrossRef] [PubMed] [Green Version]
  83. Bushati, N.; Stark, A.; Brennecke, J.; Cohen, S.M. Temporal reciprocity of miRNAs and their targets during the ma-ternal-to-zygotic transition in Drosophila. Curr. Biol. 2008, 18, 501–506. [Google Scholar] [CrossRef] [PubMed] [Green Version]
  84. Lund, E.; Liu, M.; Hartley, R.S.; Sheets, M.D.; Dahlberg, J.E. Deadenylation of maternal mRNAs mediated by miR-427 in Xenopus laevis embryos. Rna 2009, 15, 2351–2363. [Google Scholar] [CrossRef] [PubMed] [Green Version]
  85. Kass, S.U.; Pruss, D.; Wolffe, A.P. How does DNA methylation repress transcription? Trends Genet. 1997, 13, 444–449. [Google Scholar] [CrossRef] [PubMed]
  86. Pacchiarini, T.; Cross, I.; Leite, R.B.; Gavaia, P.; Ortiz-Delgado, J.B.; Pousão-Ferreira, P.; Rebordinos, L.; Sarasquete, C.; Cabrita, E. Solea senega-lensis vasa transcripts: Molecular characterisation, tissue distribution and developmental expression profiles. Reprod. Fertil. Dev. 2013, 25, 646–660. [Google Scholar] [CrossRef] [Green Version]
  87. Ricci, J.M.; Martinez, E.R.; Butzge, A.J.; Doretto, L.B.; Oliveira, M.A.; Bombardelli, R.A.; Bogerd, J.; Nóbrega, R.H. Char-acterization of vasa homolog in a neotropical catfish, Jundiá (Rhamdia quelen): Molecular cloning and expression analysis during embryonic and larval development. Gene 2018, 654, 116–126. [Google Scholar] [CrossRef] [PubMed] [Green Version]
  88. Zhu, W.; Wang, T.; Zhao, C.; Wang, D.; Zhang, X.; Zhang, H.; Chi, M.; Yin, S.; Jia, Y. Evolutionary conservation and divergence of Vasa, Dazl and Nanos1 during embryogenesis and gametogenesis in dark sleeper (Odontobutis potamophila). Gene 2018, 672, 21–33. [Google Scholar] [CrossRef]
  89. Presslauer, C.; Nagasawa, K.; Fernandes, J.M.O.; Babiak, I. Expression of vasa and nanos3a during primordial germ cell formation and migration in Atlantic cod (Gadus morhua L.). Theriogenology 2012, 78, 1262–1277. [Google Scholar] [CrossRef]
  90. Svetic, V.; Hollway, G.E.; Elworthy, S.; Chipperfield, T.R.; Davison, C.; Adams, R.J.; Eisen, J.S.; Ingham, P.W.; Currie, P.D.; Kelsh, R.N. Sdf1a patterns zebrafish melanophores and links the somite and melanophore pattern defects in choker mutants. Development 2007, 134, 1011–1022. [Google Scholar] [CrossRef] [Green Version]
  91. Chong, S.W.; Nguyet, L.M.; Jiang, Y.J.; Korzh, V. The chemokine Sdf-1 and its receptor Cxcr4 are required for for-mation of muscle in zebrafish. BMC Dev. Biol. 2007, 7, 54. [Google Scholar] [CrossRef] [PubMed] [Green Version]
  92. Hayes, T.B. Sex determination and primary sex differentiation in amphibian: Genetic and developmental mechanisms. J. Exp. Zool. 1988, 281, 373–399. [Google Scholar] [CrossRef]
  93. Chen, S.; Zhang, G.; Shao, C.; Huang, Q.; Liu, G.; Zhang, P.; Song, W.; An, N.; Chalopin, D.; Volff, J.-N.; et al. Whole-genome sequence of a flatfish provides insights into ZW sex chromosome evolution and adaptation to a benthic lifestyle. Nat. Genet. 2014, 46, 253–260. [Google Scholar] [CrossRef] [PubMed] [Green Version]
  94. Nagahama, Y.; Chakraborty, T.; Paul-Prasanth, B.; Ohta, K.; Nakamura, M. Sex determination, gonadal sex differen-tiation, and plasticity in vertebrate species. Physiol. Rev. 2021, 101, 1237–1308. [Google Scholar] [CrossRef]
  95. Heule, C.; Salzburger, W.; Böhne, A. Genetics of sexual development: An evolutionary playground for fish. Genetics 2014, 196, 579–591. [Google Scholar] [CrossRef] [Green Version]
  96. Martínez, P.; Viñas, A.M.; Sánchez, L.; Díaz, N.; Ribas, L.; Piferrer, F. Genetic architecture of sex determination in fish: Applications to sex ratio control in aquaculture. Front. Genet. 2014, 5, 340. [Google Scholar] [CrossRef] [PubMed] [Green Version]
  97. Horie, Y.; Myosho, T.; Sato, T.; Sakaizumi, M.; Hamaguchi, S.; Kobayashi, T. Androgen induces gonadal soma-derived factor, Gsdf, in XX gonads correlated to sex-reversal but not Dmrt1 directly, in the teleost fish, northern medaka (Oryzias sakaizumii). Mol. Cell. Endocrinol. 2016, 436, 141–149. [Google Scholar] [CrossRef] [PubMed]
  98. Chakraborty, T.; Zhou, L.Y.; Chaudhari, A.; Iguchi, T.; Nagahama, Y. Dmy initiates masculinity by altering Gsdf/Sox9a2/Rspo1 expression in medaka (Oryzias latipes). Sci. Rep. 2016, 6, 19480. [Google Scholar] [CrossRef] [PubMed] [Green Version]
  99. Sawatari, E.; Shikina, S.; Takeuchi, T.; Yoshizaki, G. A novel transforming growth factor-β superfamily member ex-pressed in gonadal somatic cells enhances primordial germ cell and spermatogonial proliferation in rainbow trout (Oncorhynchus mykiss). Dev. Biol. 2007, 301, 266–275. [Google Scholar] [CrossRef] [PubMed] [Green Version]
  100. Shibata, Y.; Paul-Prasanth, B.; Suzuki, A.; Usami, T.; Nakamoto, M.; Matsuda, M.; Nagahama, Y. Expression of gonadal soma derived factor (GSDF) is spatially and temporally correlated with early testicular differentiation in medaka. Gene Expr. Patterns 2010, 10, 283–289. [Google Scholar] [CrossRef]
  101. Yan, Y.L.; Batzel, P.; Titus, T.; Sydes, J.; Desvignes, T.; Bremiller, R.; Draper, B.; Postlethwait, J.H. The roles of Amh in zebrafish gonad development and sex determination. BioRxiv 2019, 650218. [Google Scholar]
  102. Gautier, A.; Sohm, F.; Joly, J.S.; Le Gac, F.; Lareyre, J.J. The proximal promoter region of the zebrafish gsdfgene is sufficient to mimic the spatio-temporal expression pattern of the endogenous gene in Sertoli and granulosa cells. Biol. Reprod. 2011, 85, 1240–1251. [Google Scholar] [CrossRef] [PubMed] [Green Version]
  103. Nakamura, S.; Kobayashi, D.; Aoki, Y.; Yokoi, H.; Ebe, Y.; Wittbrodt, J.; Tanaka, M. Identification and lineage tracing of two populations of somatic gonadal precursors in medaka embryos. Dev. Biol. 2006, 295, 678–688. [Google Scholar] [CrossRef] [Green Version]
  104. Klüver, N.; Pfennig, F.; Pala, I.; Storch, K.; Schlieder, M.; Froschauer, A.; Gutzeit, H.O.; Schartl, M. Differential expression of anti-Müllerian hormone (amh) and anti-Müllerian hormone receptor type II (amhrII) in the teleost medaka. Dev. Dyn. Off. Publ. Am. Assoc. Anat. 2007, 236, 271–281. [Google Scholar] [CrossRef] [PubMed]
  105. Simpson, E.R.; Mahendroo, M.S.; Means, G.D.; Kilgore, M.W.; Hinshelwood, M.M.; Graham-Lorence, S.; Amarneh, B.; Ito, Y.; Fisher, C.R.; Michael, M.D.; et al. Aromatase cytochrome P450, the enzyme responsible for estrogen biosynthesis. Endocr. Rev. 1994, 15, 342–355. [Google Scholar]
  106. Kwon, J.Y.; Haghpanah, V.; Kogson-Hurtado, L.M.; McAndrew, B.J.; Penman, D.J. Masculinization of genetic female Nile tilapia (Oreochromis niloticus) by dietary administration of an aromatase inhibitor during sexual differentiation. J. Exp. Zool. 2000, 287, 46–53. [Google Scholar] [CrossRef] [PubMed]
  107. Lau, E.S.W.; Zhang, Z.; Qin, M.; Ge, W. Knockout of zebrafish ovarian aromatase gene (Cyp19a1a) by TALEN and CRISPR/Cas9 leads to all-male offspring due to failed ovarian differentiation. Sci. Rep. 2016, 6, 37357. [Google Scholar] [CrossRef] [PubMed] [Green Version]
  108. Dong, W.; Willett, K.L. Local expression of CYP19A1 and CYP19A2 in developing and adult killifish (Fundulus heteroclitus). Gen. Comp. Endocrinol. 2008, 155, 307–317. [Google Scholar] [CrossRef] [Green Version]
  109. Coumailleau, P.; Pellegrini, E.; Adrio, F.; Diotel, N.; Cano-Nicolau, J.; Nasri, A.; Vaillant, C.; Kah, O. Aromatase, estrogen receptors and brain development in fish and amphibians. Biochim. Et Biophys. Acta (BBA)-Gene Regul. Mech. 2015, 1849, 152–162. [Google Scholar] [CrossRef] [PubMed]
  110. Brown, M.S.; Evans, B.S.; Afonso, L.O. Developmental changes in gene expression and gonad morphology during sex differentiation in Atlantic salmon (Salmo salar). Gene 2022, 823, 146393. [Google Scholar] [CrossRef]
  111. Otake, H.; Shinomiya, A.; Matsuda, M.; Hamaguchi, S.; Sakaizumi, M. Wild-derived XY sex-reversal mutants in the medaka, Oryzias latipes. Genetics 2006, 173, 2083–2090. [Google Scholar] [CrossRef] [Green Version]
  112. Herpin, A.; Schartl, M. Dmrt1 genes at the crossroads: A widespread and central class of sexual development factors in fish. FEBS J. 2011, 278, 1010–1019. [Google Scholar] [CrossRef] [PubMed]
  113. Jackson, B.C.; Carpenter, C.; Nebert, D.W.; Vasiliou, V. Update of human and mouse forkhead box (FOX) gene families. Hum. Genom. 2010, 4, 345. [Google Scholar] [CrossRef] [PubMed] [Green Version]
  114. Zhang, X.; Li, M.; Ma, H.; Liu, X.; Shi, H.; Li, M.; Wang, D. Mutation of Foxl2 or Cyp19a1a results in female to male sex reversal in XX Nile tilapia. Endocrinology 2017, 158, 2634–2647. [Google Scholar] [CrossRef] [Green Version]
  115. Lin, L.; Hongwei, L.; Zhong, L. Cloning and expression analysis of DMRT1 gene in Pelteobagrus fulvidraco. J. Huazhong Agric. University 2012, 31, 220–226. [Google Scholar]
  116. Jin-Hua, W.A.N.G.; Liang, M.I.A.O.; Ming-Yun, L.I.; Xiao-Fei, G.U.O.; Na, P.A.N.; Ying-Ying, C.H.E.N.; Liang, Z.H.A.O. Cloning the Dmrt1 and DmrtA2 genes of ayu (Plecoglossus altivelis) and mapping their expression in adult, larval, and embryonic stages. Zool. Res. 2014, 35, 99. [Google Scholar]
  117. Herpin, A.; Schindler, D.; Kraiss, A.; Hornung, U.; Winkler, C.; Schartl, M. Inhibition of primordial germ cell prolif-eration by the medaka male determining gene Dmrt1bY. BMC Dev. Biol. 2007, 7, 99. [Google Scholar] [CrossRef]
  118. Zhao, Y.; Zhang, Y.; Zhong, Y.; Guo, J.; Lu, M.; Gui, L.; Li, M. Molecular identification and expression analysis of Foxl2 and sox9b in Oryzias celebensis. Aquac. Fish. 2021, 6, 471–478. [Google Scholar] [CrossRef]
Figure 1. Gel electrophoresis of RNA (A). It showed clear distinctive bands of 28s rRNA and 18s rRNA. RNA analysis was carried out using the Agilent 2200 TapeStation system with a gel image showing different RNA samples (B).
Animals 13 01094 g001
Figure 2. Average threshold cycle (Ct) values of different HKGs in the developmental stages of S. salar.
Animals 13 01094 g002
Figure 3. Evaluation of candidate reference genes using Delta Ct, BestKeeper, normFinder and Genorm statistical algorithms in different developmental samples of S. salar. The lower value indicates greater stability of the reference gene and vice versa.
Animals 13 01094 g003
Figure 4. Stability ranking of candidate reference genes as determined by RefFinder in different developmental stages of S. salar. Lower Geomean values indicate more stable expression and vice versa.
Animals 13 01094 g004
Figure 5. Basal mRNA transcript level of PGC genes: vasa, dnd1, nanos3a and sdf1 during developmental stages of S. salar. Data are presented as mean ± SD (n = 4). Bars with different superscripts denote statistically significant differences (p < 0.05) between developmental stages. 0: unfertilized egg and 430: yolk sac fry or alevins.
Animals 13 01094 g005
Figure 6. Basal mRNA transcript level of SD genes: gsdf, amh, cyp19a, dmrt1 and foxl2 during developmental stages of A. salmon. Data are presented as mean ± SD (n = 4). Bars with different superscripts denote statistically significant differences (p < 0.05) between developmental stages. 0: unfertilized egg and 430: yolk sac fry or alevins.
Animals 13 01094 g006
Table 1. Incubation time of A. salmon eggs/embryos and larvae and the number of samples used in the present study. (Temperature was maintained at 10 °C).
Day\Days Post-FertilizationDegree Days (d°C)Pooled Number of Eggs/Embryos/Larvae per Sample
0unfertilized egg10
11010
22010
33010
44010
5506
7706
8806
111106
141406
212106
242406
272706
343406
43430 (yolk sac fry or alevins)3
Table 2. Primers used in the present study.
GeneForward Primer Sequence (5′ to 3′)Reverse Primer Sequence (5′ to 3′)Accession Number and Reference
vasaCGCTCCCTGGTCAAAGTCCTGTCGCTAGTTGACTCGCCCCATCTCTCJN712912
dnd1TCTGTACAGGGCCTGATGGTTAAAACAAAGTAGGGGATCTGTG[19].
nanos3aATGGAGTCCGAAAACAAGAGTCGGTTCTGGGGTGAACTTGCKC237283
sdf1GTGTTGGTCCTACTGGCTGTGGCGAGGGACGGTGTTGAGAGTGGAGCNM_001140787
gsdfGACAAAGCAGTGGCTGTACCGGCAGCATTTCAGACCACTAXM_014138924
amhCAGTCACTCTCTGCAGCCTTACAACAACATTGAATCTCCATTTCAGTTTACNM_001123585
cyp19aTCAAACAGAACCCTGACGTAGGCTCCCTTTCACCTATAGCAGTGTAF436885
dmrt1AGGAGGAGGAGATGGGGCTCTGTACCAGCAGAGGTGTTTCCACAGGTAGXM_014172771
foxl2GCGGTGATGGGTACGGCTACCTGGACGGGACTCACGTTGCCACTGGJX184084
β-actinCCAAAGCCAACAGGGAGAAGAGGGACAACACTGCCTGGATBG933897
GAPDHAAGTGAAGCAGGAGGGTGGAACAGCCTCACCCCATTTGATGAM230811
eEf1aCCCCTCCAGGACGTTTACAAACACACGGCCCACAGGTACABT058711
UB2L3CGAGAAGGGACAGGTGTGTCACCAACGCAATCAGGGACTNM_001141284
Table 3. Statistical analysis of housekeeping genes by BestKeeper.
UB2L3eEF1aβ-actinGAPDH
n *15151515
geo Mean [CP]21.9020.5722.8825.56
AR Mean [CP]21.9320.6722.9325.60
min [CP]20.0018.0020.0023.00
max [CP]24.0025.0025.0028.00
std dev [±CP]0.891.641.281.23
CV [% CP]4.057.965.584.79
min [x-fold]−3.74−5.92−7.38−5.90
max [x-fold]4.2721.614.335.42
std dev [±x-fold]1.853.132.432.34
* number of stages from which mRNA expression of HKGs was analyzed.
Disclaimer/Publisher’s Note: The statements, opinions and data contained in all publications are solely those of the individual author(s) and contributor(s) and not of MDPI and/or the editor(s). MDPI and/or the editor(s) disclaim responsibility for any injury to people or property resulting from any ideas, methods, instructions or products referred to in the content.

