
Influences of Glyphosate Contaminations and Concentrate Feed on Performance, Blood Parameters, Blood Cell Functionality and DNA Damage Properties in Fattening Bulls
 , , , and
Abstract
:Simple Summary
Abstract
1. Introduction
2. Materials and Methods
2.1. Experimental Design, Feed Production and Sample Collection
2.2. Feed Samples and Glyphosate Analyses
2.3. Analysis of Serum Metabolites
2.4. Hematological Evaluation
2.5. Antioxidant Enzyme Activities and Ferric Reducing Ability of Plasma
2.6. DNA Damage
2.7. Flow Cytometric Analysis
2.8. T-Cell Phenotyping
2.9. Intracellular Production of Reactive Oxygen Species
2.10. Phagocytosis
2.11. Apoptosis
2.12. Ex Vivo Proliferation Assay
2.13. Gene Expression Analysis
2.14. Statistical Analyses
2.15. Data Availability
3. Results
3.1. Glyphosate Exposure, Fattening and Slaughter Performance
3.2. Blood Parameters
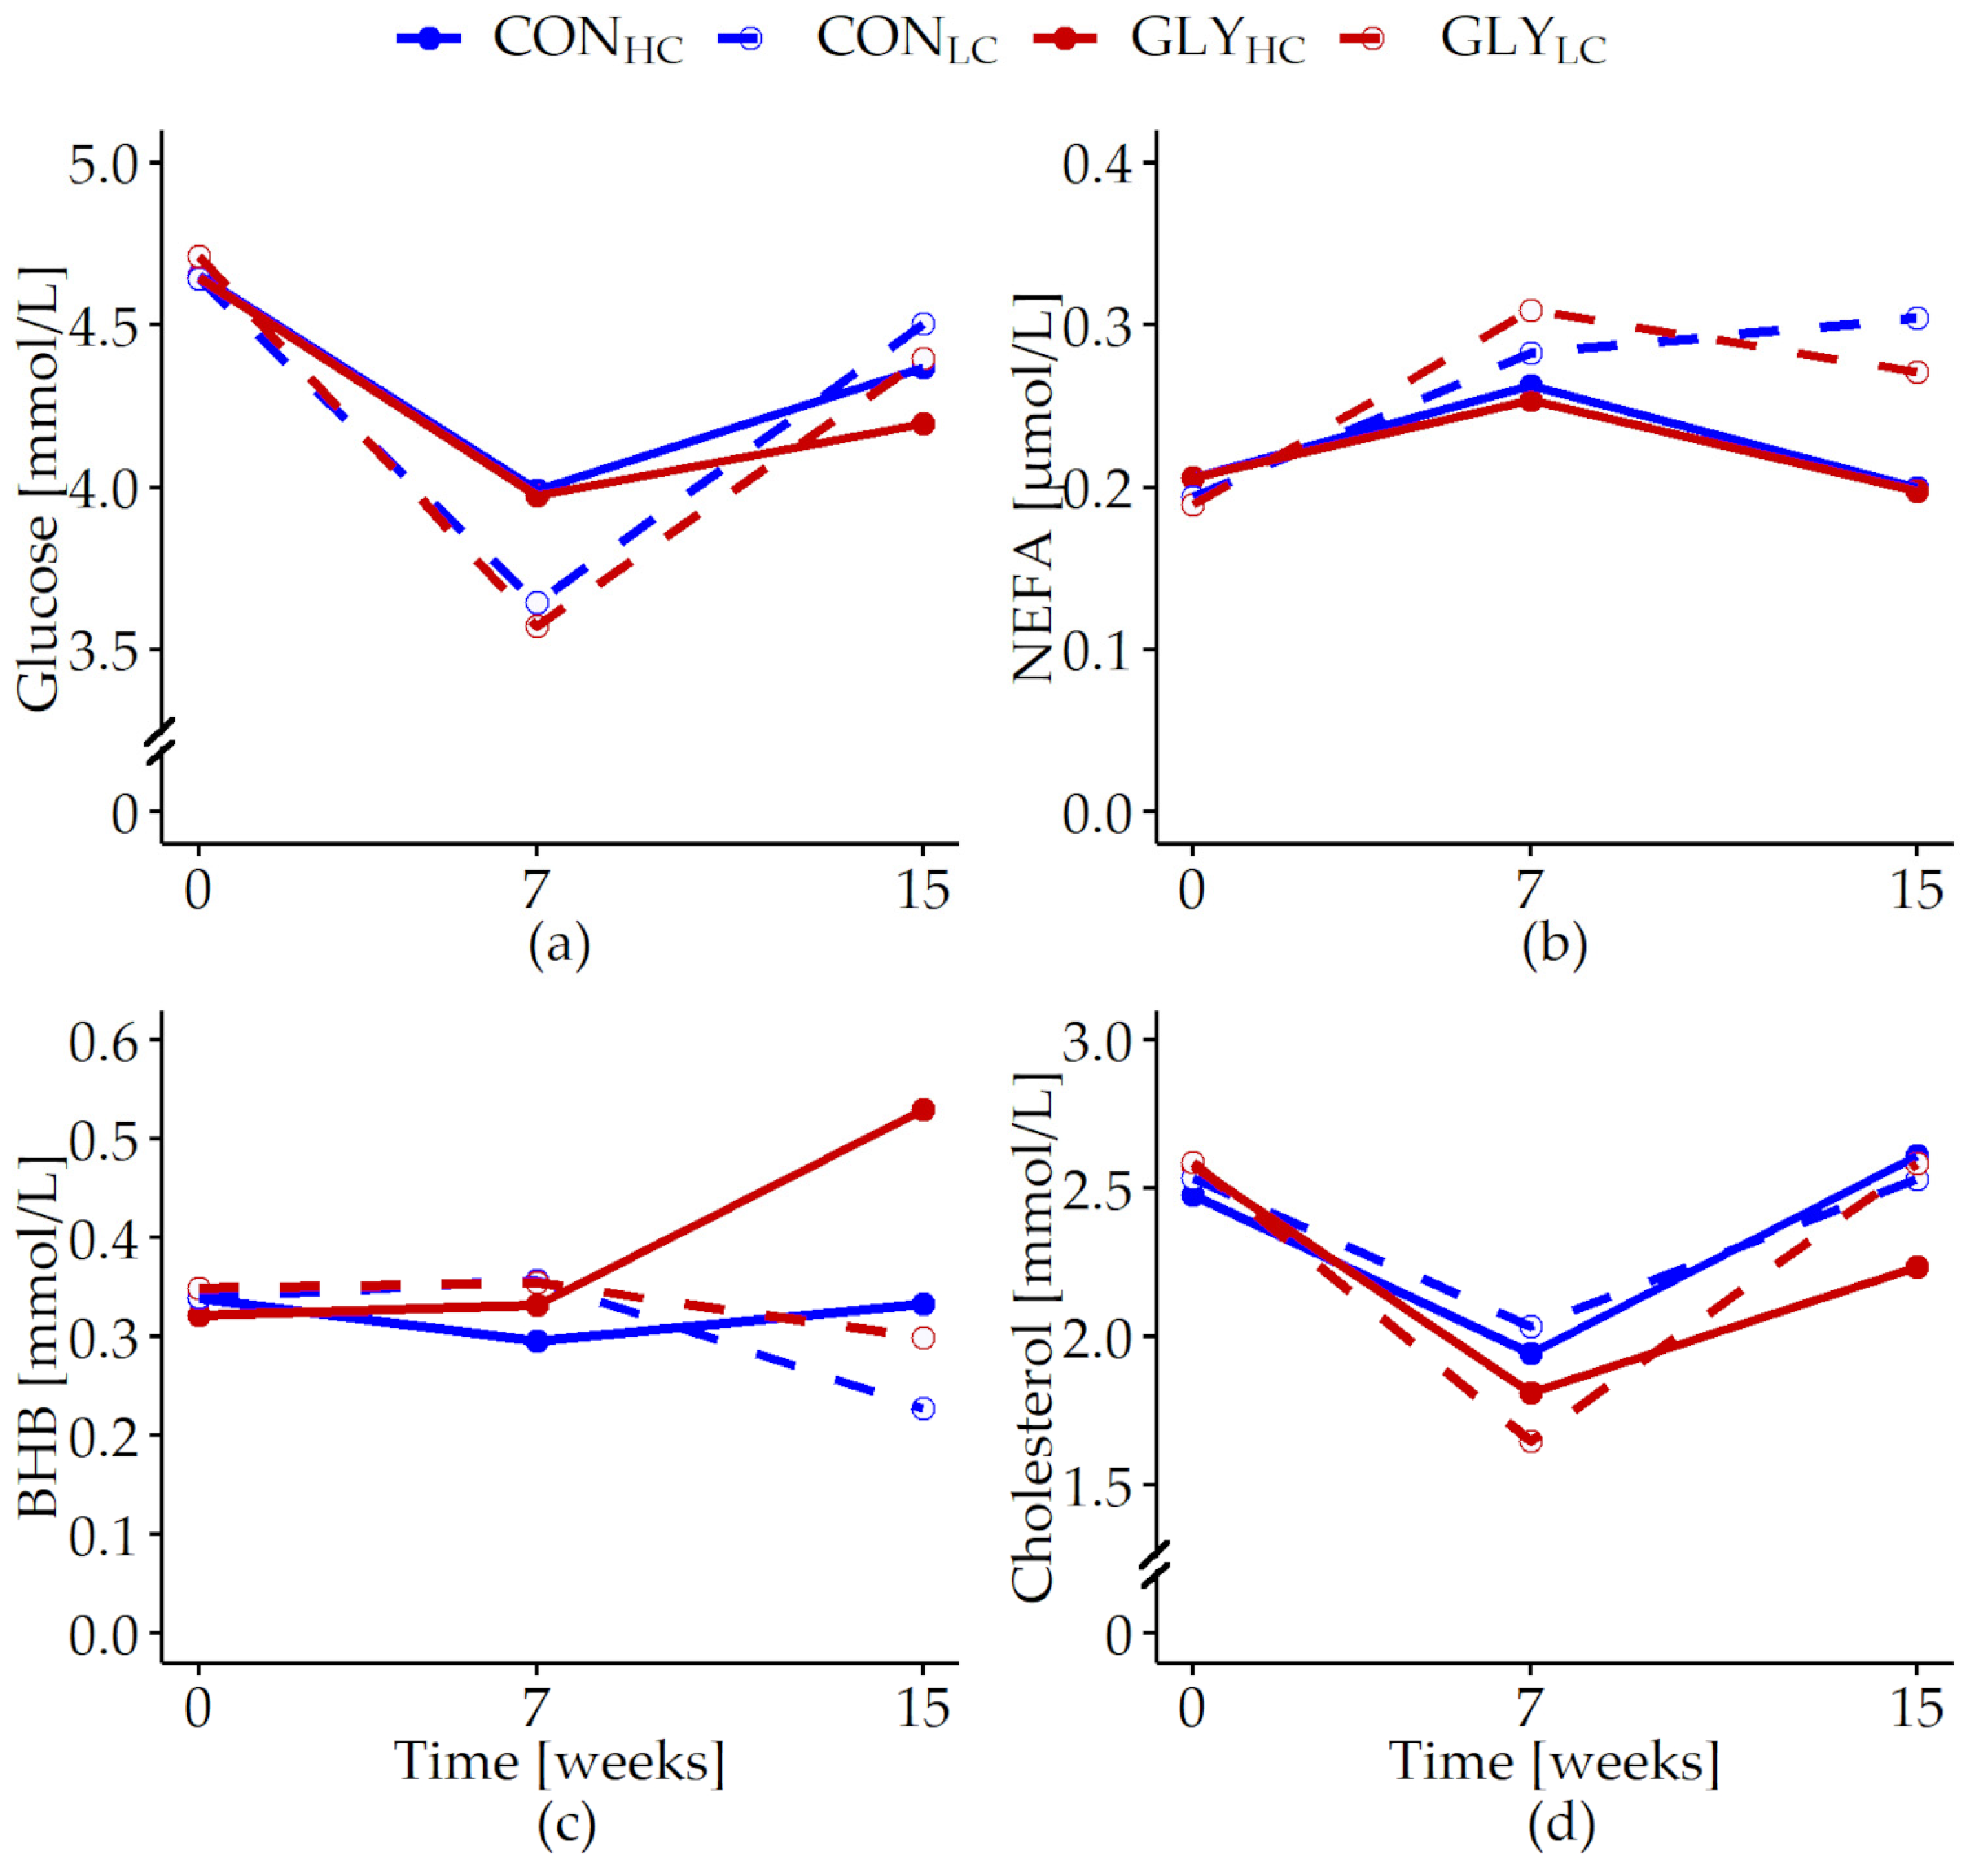
3.2.1. Serum Metabolites
3.2.2. Hematology and Antioxidative Status
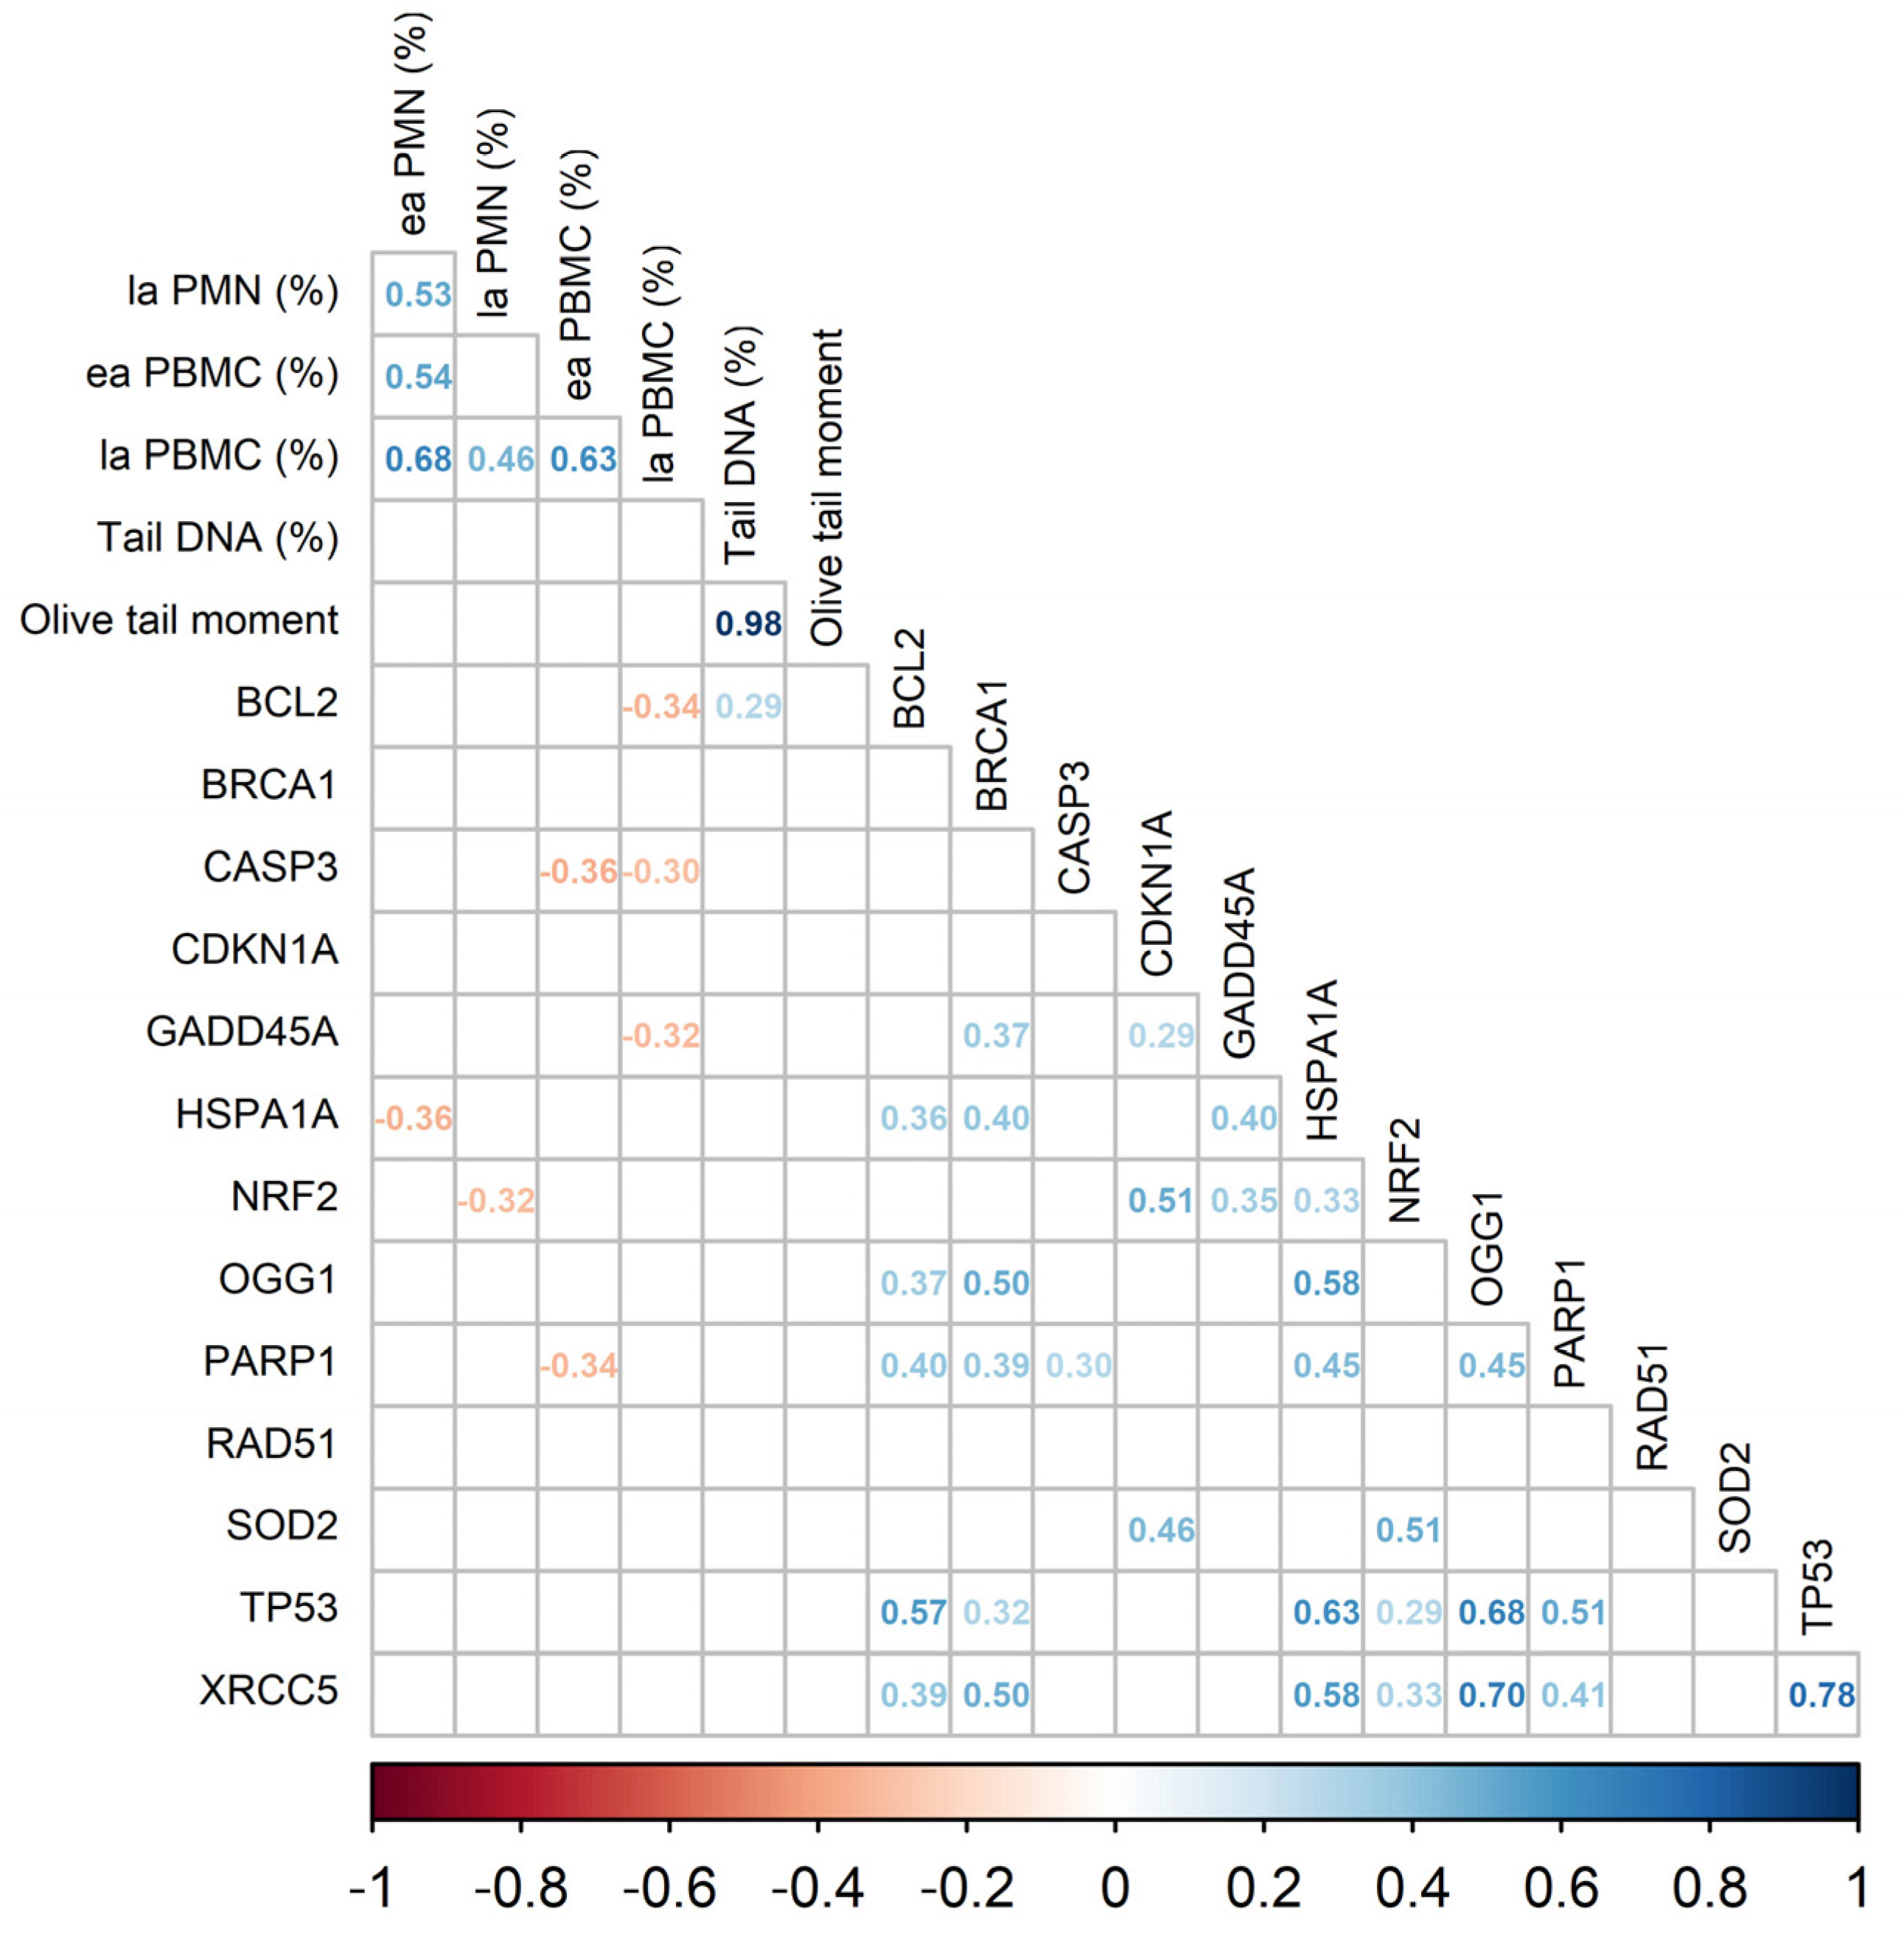
3.2.3. DNA Damage Indicators in Leukocytes
3.2.4. Functional Properties of Immune Cells
3.3. Gene Expression Analysis
4. Discussion
5. Conclusions
Author Contributions
Funding
Institutional Review Board Statement
Data Availability Statement
Acknowledgments
Conflicts of Interest
Appendix A

| Parameter | Experimental Week | Group | n |
|---|---|---|---|
| Albumin [g/L] | 7 | CONLC | 11 |
| Glucose [mmol/L] | 7 | CONLC | 11 |
| Cholesterol [mmol/L] | 7 | CONLC | 11 |
| AST [µkat/L] | 7 | CONLC | 11 |
| GLYLC | 11 | ||
| GGT [µkat/L] | 7 | CONLC | 11 |
| GLDH [µkat/L] | 0 | GLYLC | 11 |
| 7 | CONLC | 10 | |
| 15 | CONHC | 11 | |
| CONLC | 10 | ||
| Triglycerides [mmol/L] | 7 | CONLC | 11 |
| Urea [mmol/L] | 7 | CONLC | 11 |
| Uric acid [µmol/L] | 7 | CONLC | 11 |
| AP [µkat/L] | 7 | CONLC | 11 |
| Monocytes (%) | 0 | CONHC | 11 |
| Platelet distribution width | 15 | CONHC | 11 |
| CONLC | 11 | ||
| Basal R123+ (%) | 0 | CONLC | 11 |
| 7 | CONLC | 11 | |
| GLYLC | 11 | ||
| 15 | CONLC | 11 | |
| Stimulated R123+ (%) | 0 | CONLC | 11 |
| 7 | CONHC | 10 | |
| CONLC | 10 | ||
| GLYHC | 10 | ||
| GLYLC | 9 | ||
| 15 | CONLC | 11 | |
| Basal R123+ (MFI) | 0 | CONLC | 11 |
| 7 | CONLC | 11 | |
| GLYLC | 11 | ||
| 15 | CONLC | 11 | |
| Stimulated R123+ (MFI) | 0 | CONLC | 11 |
| 7 | CONHC | 10 | |
| CONLC | 10 | ||
| GLYHC | 10 | ||
| GLYLC | 9 | ||
| 15 | CONLC | 11 | |
| CD4 (%) | 15 | CONHC | 11 |
| CONLC | 11 | ||
| GLYLC | 10 | ||
| CD4+ (MFI) | 15 | CONHC | 11 |
| CONLC | 11 | ||
| GLYLC | 10 | ||
| CD8+ (%) | 15 | CONHC | 11 |
| CONLC | 11 | ||
| GLYLC | 10 | ||
| CD8+ (MFI) | 15 | CONHC | 11 |
| CONLC | 11 | ||
| GLYLC | 10 | ||
| Phagocytotic PMN (%) | 0 | CONHC | 6 |
| CONLC | 6 | ||
| GLYHC | 7 | ||
| GLYLC | 5 | ||
| 7 | CONHC | 7 | |
| CONLC | 7 | ||
| GLYHC | 7 | ||
| GLYLC | 7 | ||
| 15 | CONHC | 11 | |
| CONLC | 11 | ||
| GLYLC | 11 | ||
| Phagocytotic PMN (MFI) | 0 | CONHC | 6 |
| CONLC | 6 | ||
| GLYHC | 7 | ||
| GLYLC | 5 | ||
| 7 | CONHC | 7 | |
| CONLC | 7 | ||
| GLYHC | 7 | ||
| GLYLC | 7 | ||
| 15 | CONHC | 11 | |
| CONLC | 11 | ||
| GLYLC | 9 | ||
| Early apoptotic PMN (%) | 15 | CONLC | 11 |
| Late apoptotic PMN (%) | 15 | CONLC | 11 |
| Early apoptotic PBMC (%) | 15 | CONLC | 11 |
| Late apoptotic PBMC (%) | 15 | CONLC | 11 |
| SOD (U/g HGB) | 15 | CONLC | 11 |
| Gpx (mU/g HGB) | 15 | CONLC | 11 |
| p-Value | ||||||||
|---|---|---|---|---|---|---|---|---|
| PSEM | GLY | CFP | t | GLY×CFP | GLY×t | CFP×t | GLY×CFP×t | |
| Glucose [mmol/L] | 0.024 | 0.296 | 0.228 | <0.001 | 0.763 | 0.363 | <0.001 | 0.828 |
| NEFA [µmol/L] | 0.007 | 0.802 | 0.021 | <0.001 | 0.996 | 0.759 | 0.016 | 0.645 |
| BHB [mmol/L] | 0.01 | 0.011 | 0.053 | 0.848 | 0.236 | 0.007 | <0.001 | 0.275 |
| Cholesterol [mmol/L] | 0.026 | 0.032 | 0.398 | <0.001 | 0.677 | 0.027 | 0.405 | 0.023 |
| p-Value | ||||||||
|---|---|---|---|---|---|---|---|---|
| PSEM | GLY | CFP | t | GLY×CFP | GLY×t | CFP×t | GLY×CFP×t | |
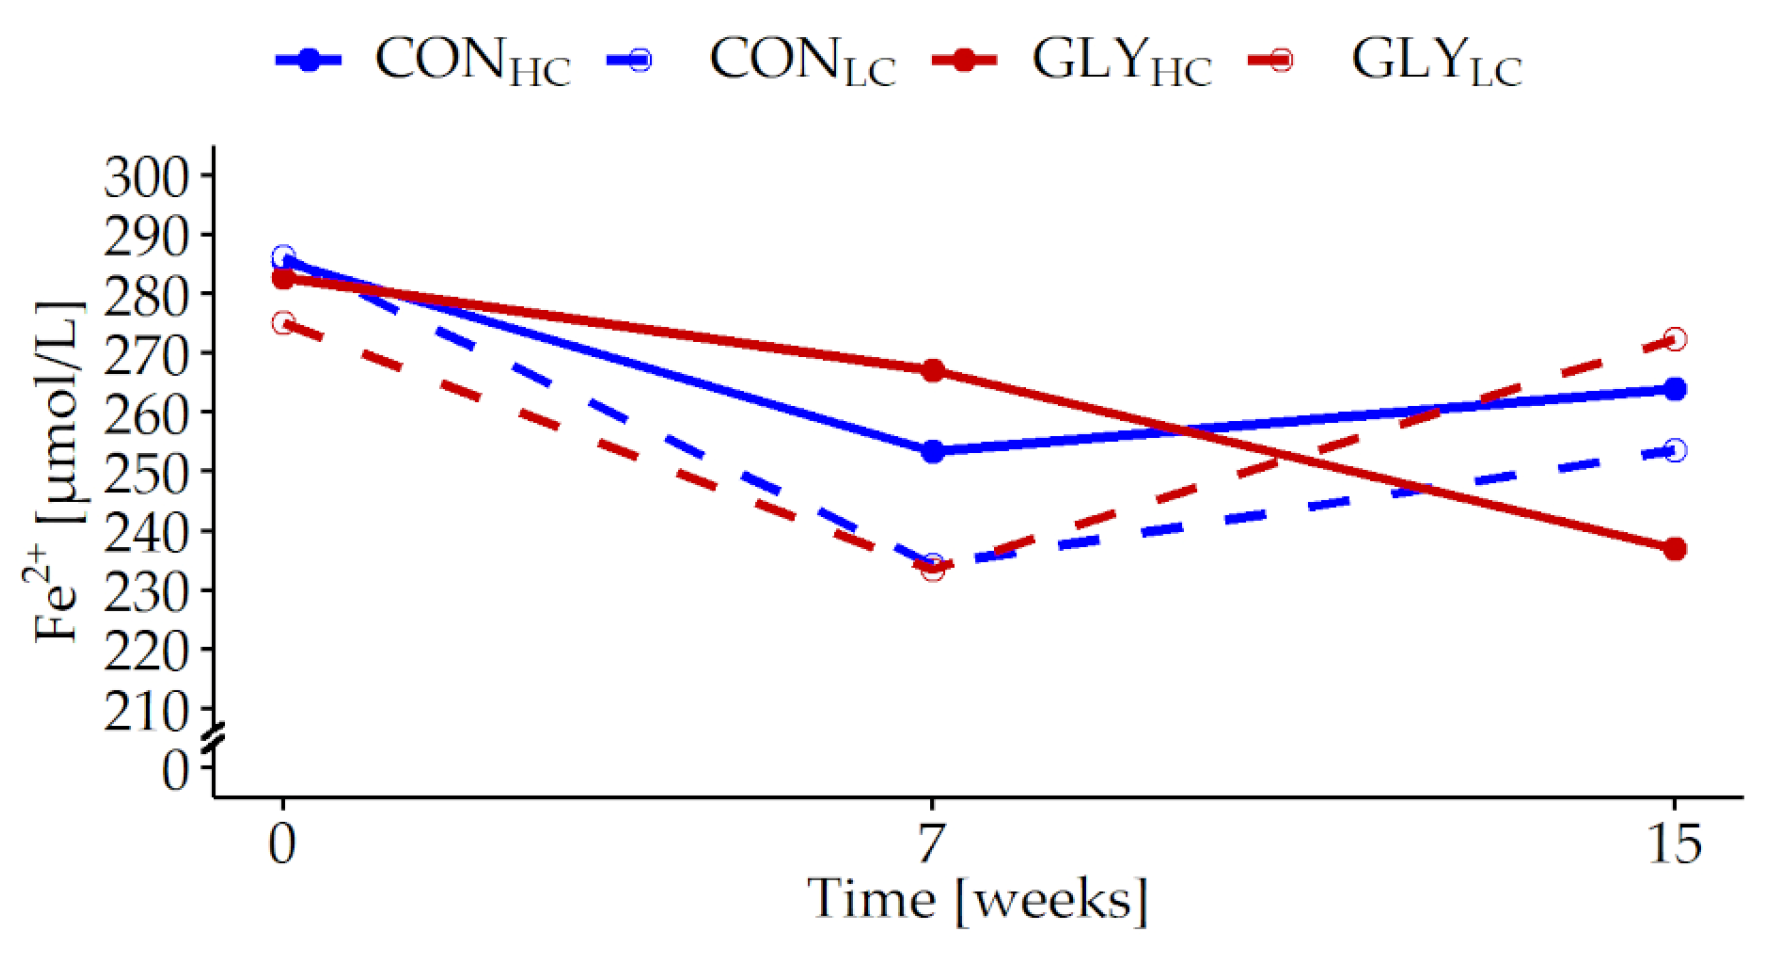
| Fe2+ [µmol/L] | 0.026 | 0.727 | 0.186 | <0.001 | 0.379 | 0.414 | 0.001 | 0.008 |
| p-Value | ||||||||
|---|---|---|---|---|---|---|---|---|
| PSEM | GLY | CFP | t | GLY×CFP | GLY×t | CFP×t | GLY×CFP×t | |
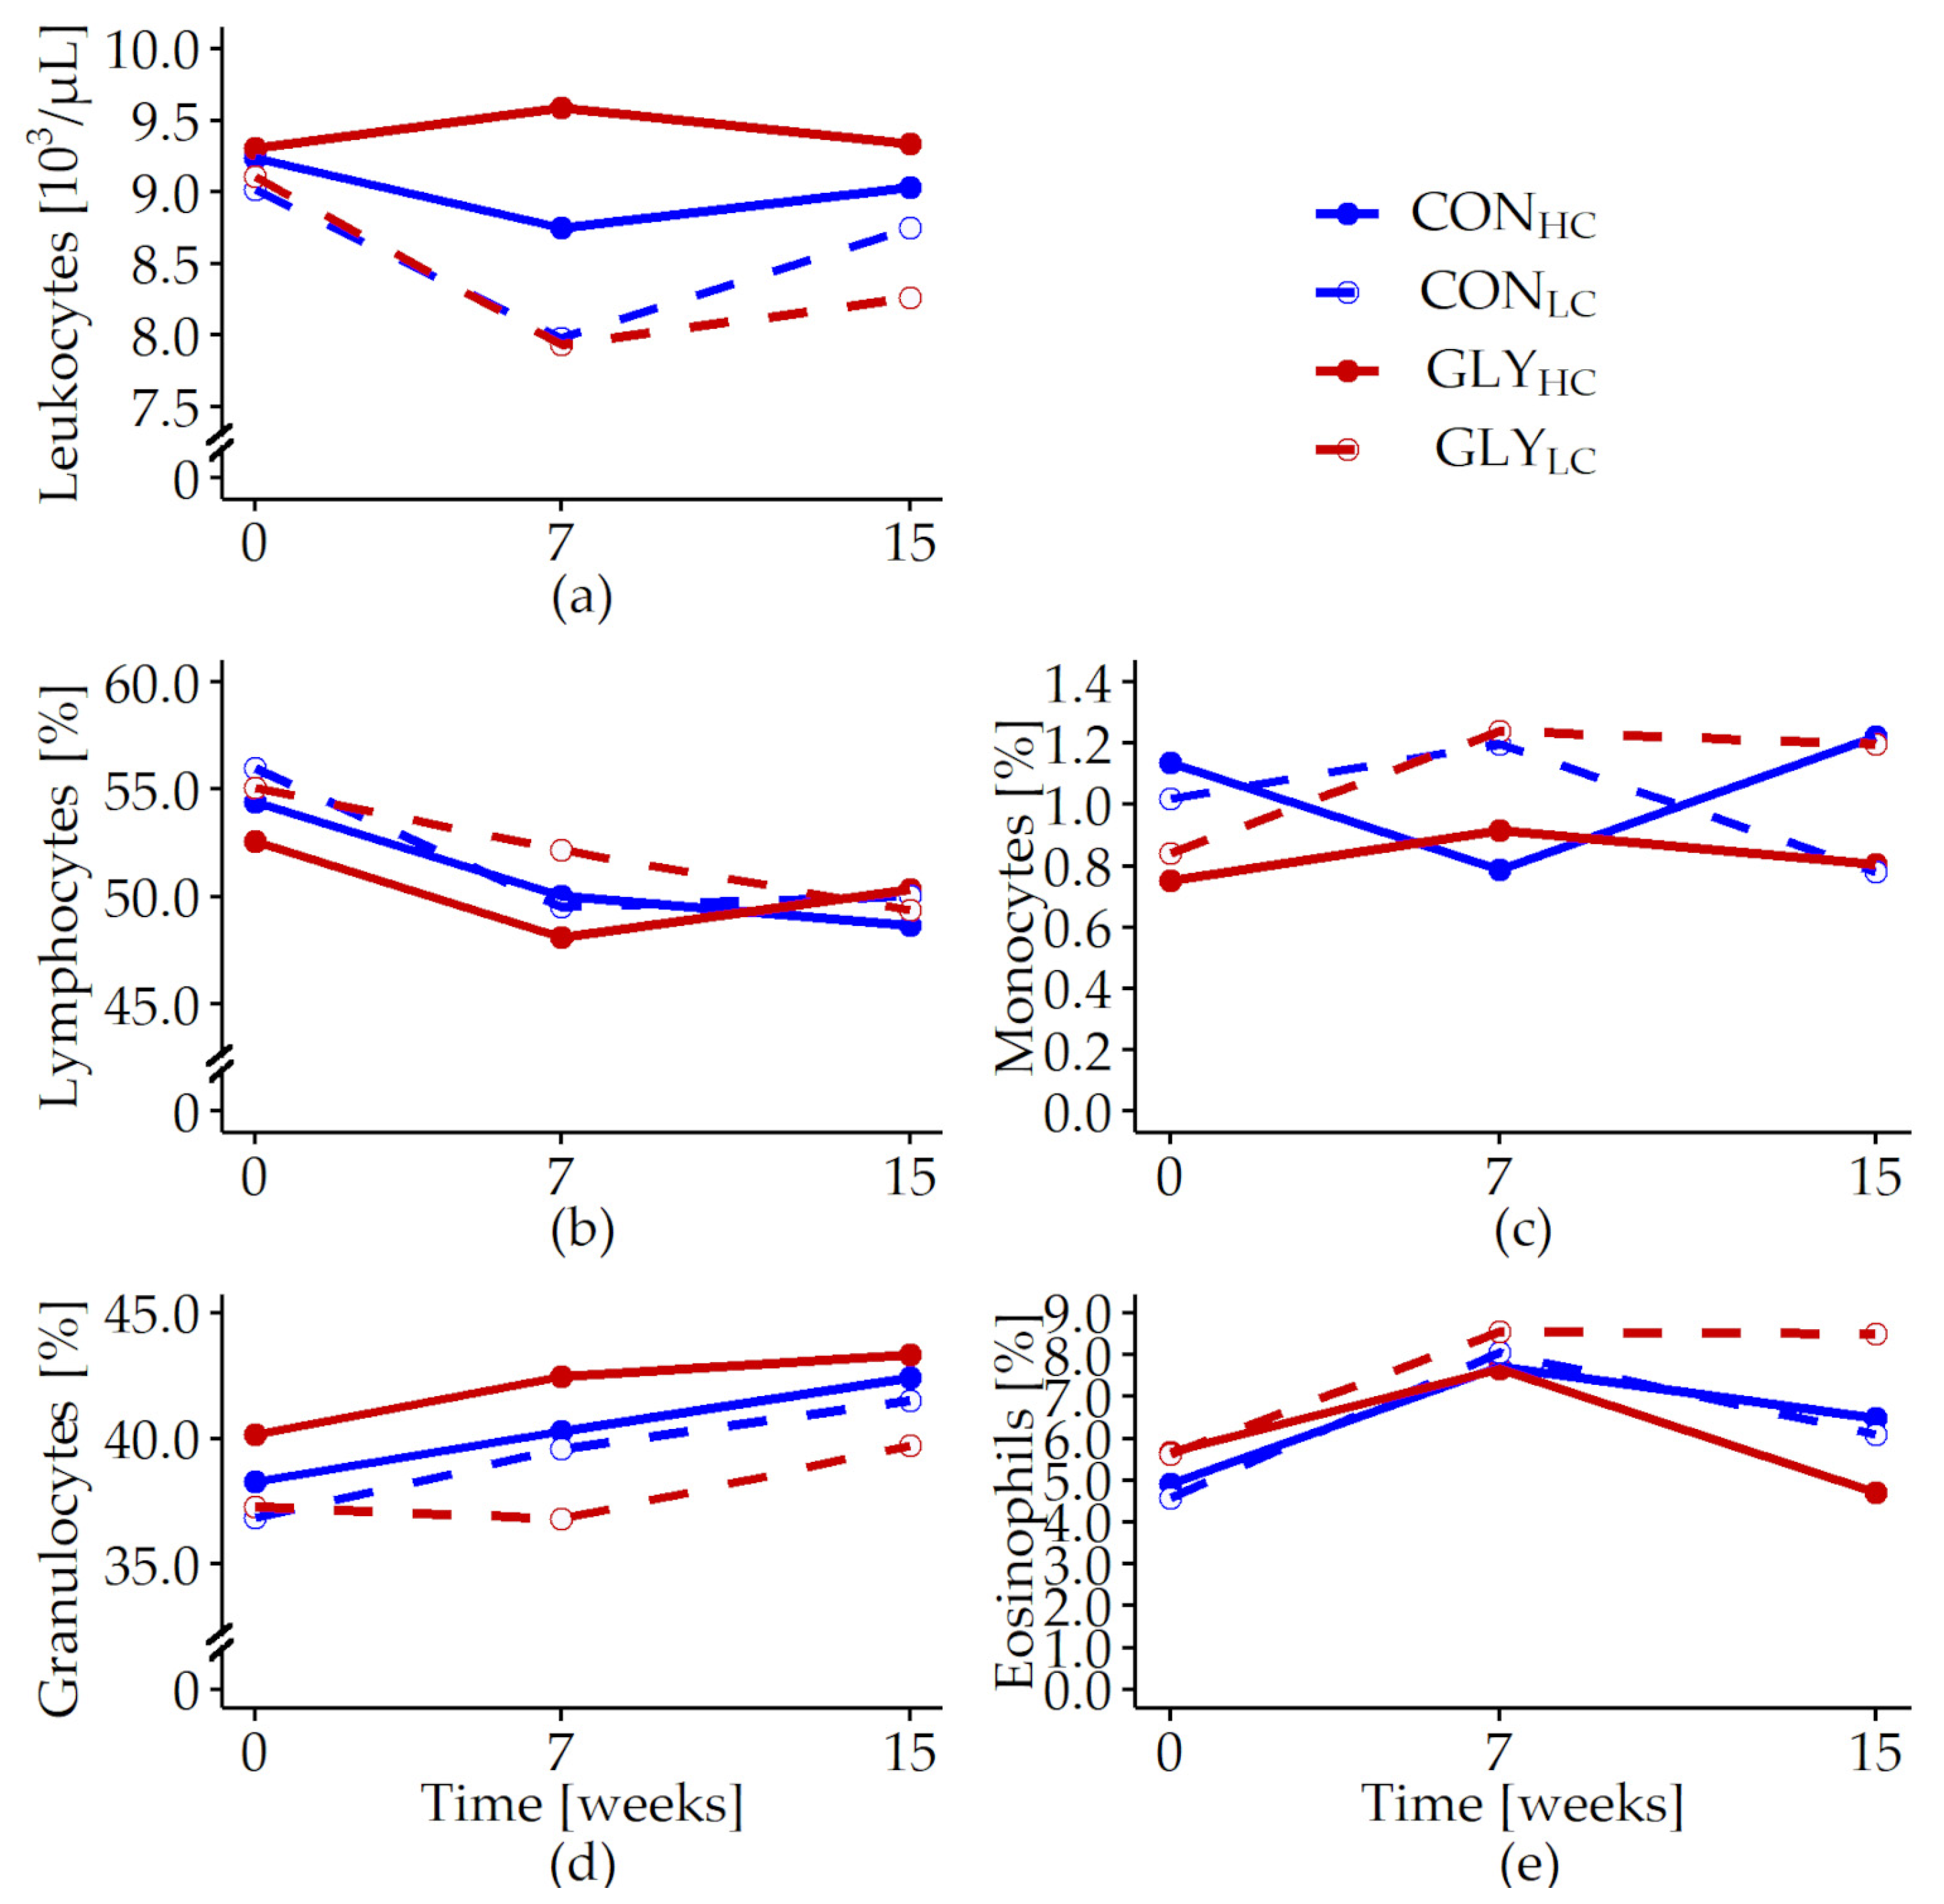
| Leukocytes [103/L] | 0.089 | 0.477 | <0.001 | 0.023 | 0.122 | 0.515 | 0.072 | 0.520 |
| Lymphocytes [%] | 0.349 | 0.817 | 0.073 | <0.001 | 0.470 | 0.473 | 0.527 | 0.131 |
| Monocytes [%] | 0.075 | 0.679 | 0.471 | 0.864 | 0.296 | 0.582 | 0.483 | 0.449 |
| Granulocytes [%] | 0.577 | 0.910 | 0.037 | 0.042 | 0.198 | 0.828 | 0.928 | 0.815 |
| Eosinophils [%] | 0.488 | 0.472 | 0.631 | 0.069 | 0.397 | 0.733 | 0.953 | 0.657 |
| p-Value | ||||||||
|---|---|---|---|---|---|---|---|---|
| PSEM | GLY | CFP | t | GLY× CFP | GLY×t | CFP×t | GLY×CFP×t | |
| CD4+ [%] | 0.168 | 0.127 | 0.360 | <0.001 | 0.187 | 0.043 | 0.388 | 0.051 |
| CD8+ [%] | 0.161 | 0.070 | 0.479 | <0.001 | 0.091 | 0.100 | 0.906 | 0.003 |
| CD4+ [MFI] | 0.025 | 0.289 | 0.520 | <0.001 | 0.345 | 0.245 | 0.533 | 0.049 |
| CD8+ [MFI] | 0.530 | <0.001 | 0.005 | <0.001 | 0.058 | 0.009 | 0.044 | <0.001 |
| p-Value | ||||||||
|---|---|---|---|---|---|---|---|---|
| PSEM | GLY | CFP | t | GLY×CFP | GLY×t | CFP×t | GLY×CFP×t | |
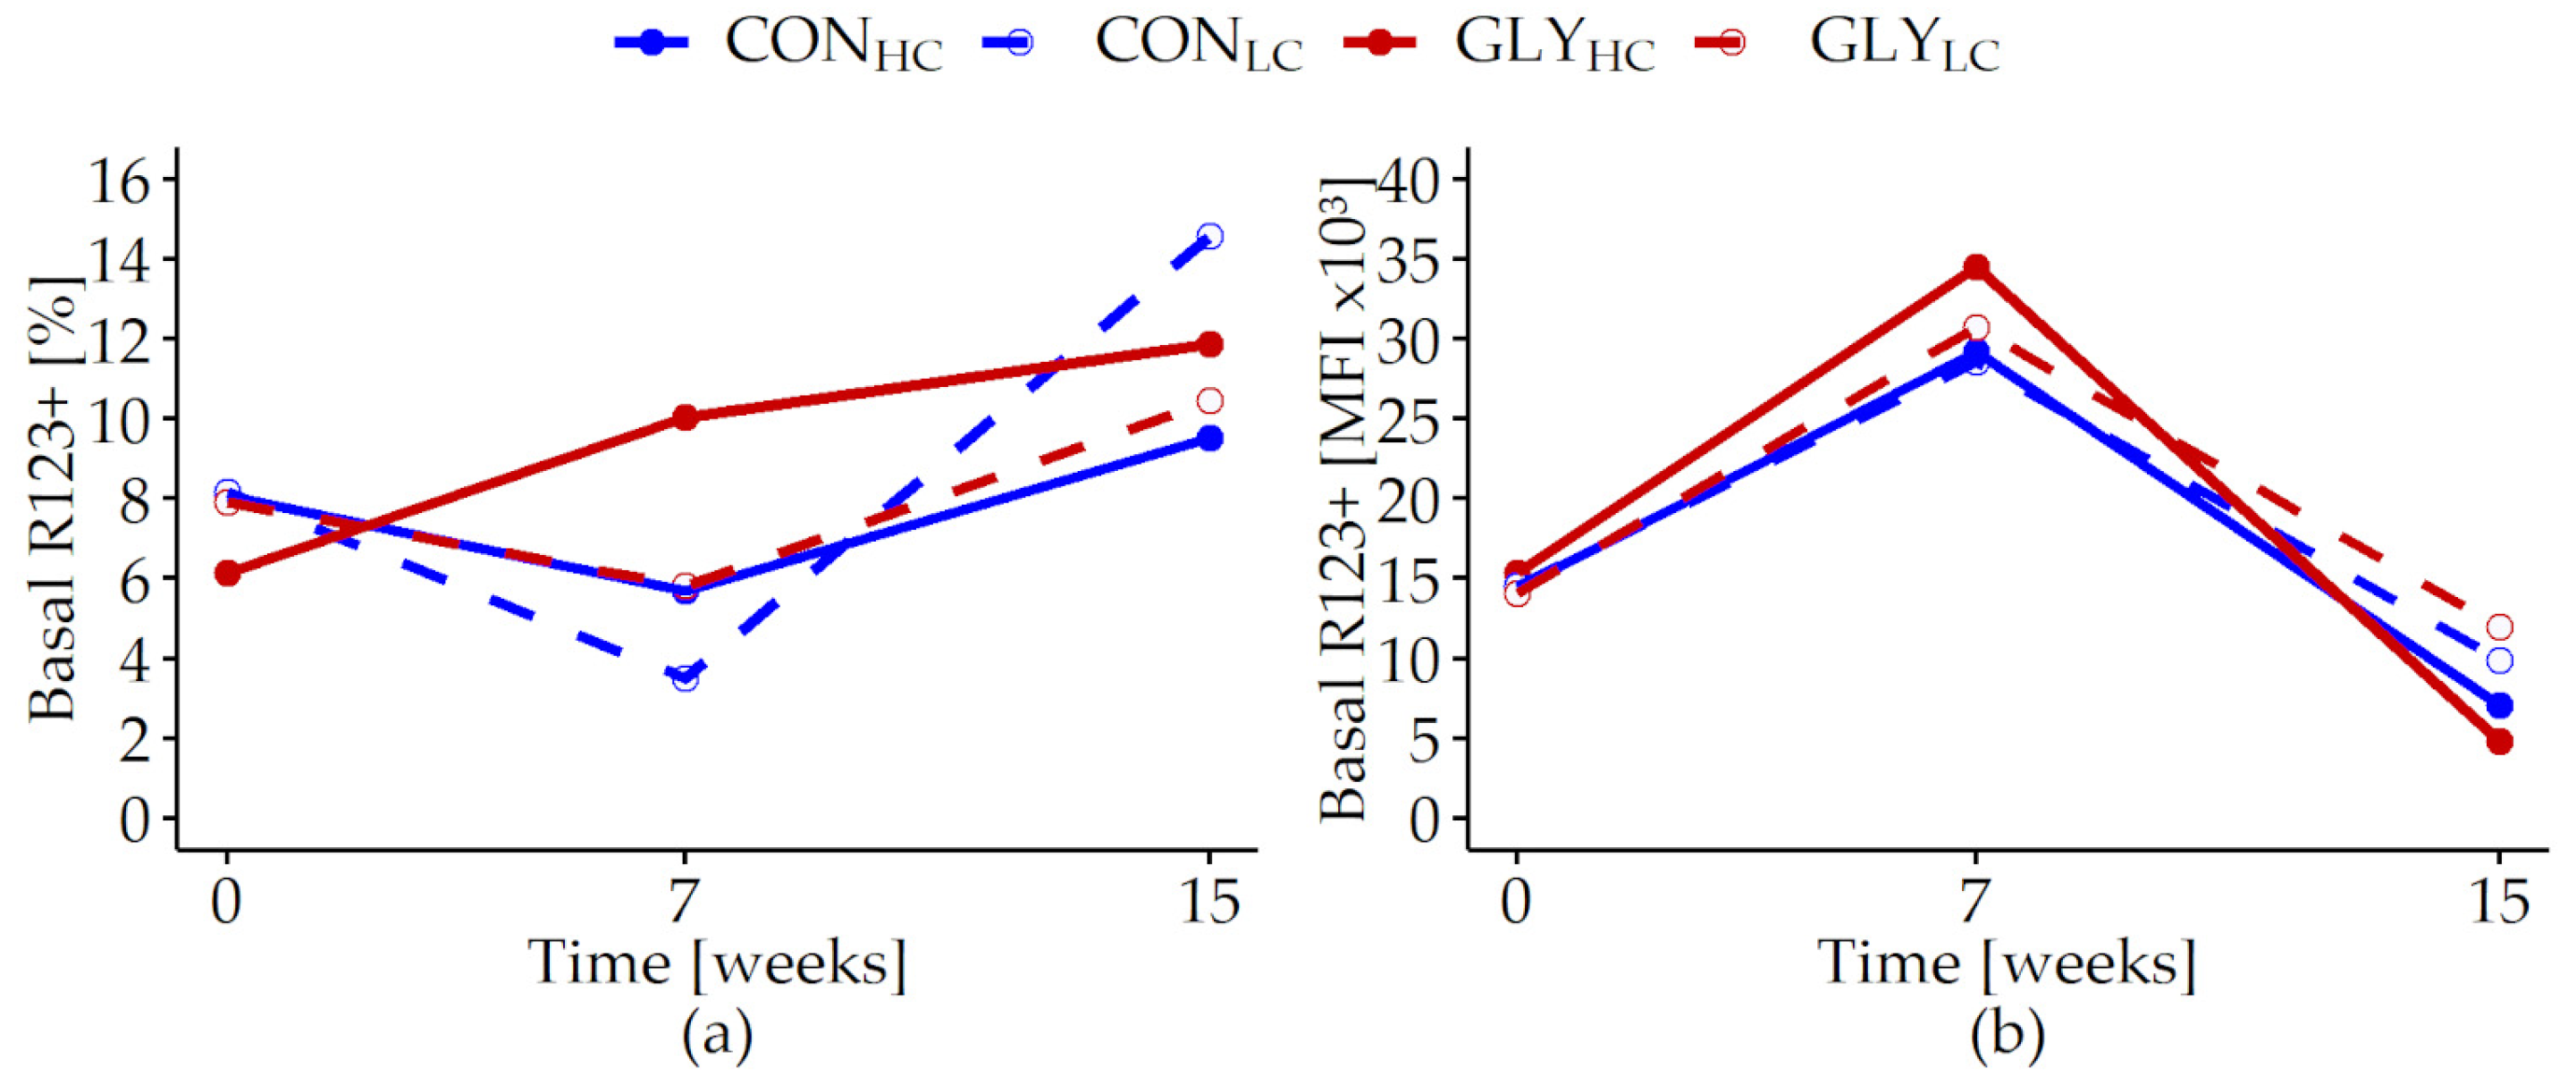
| Basal R123+ [%] | 0.486 | 0.652 | 0.880 | <0.001 | 0.254 | 0.118 | 0.087 | 0.231 |
| Basal R123+ [MFI × 103] | 0.519 | 0.033 | 0.244 | <0.001 | 0.955 | 0.083 | <0.001 | 0.002 |
References
- Duke, S.O.; Powles, S.B. Glyphosate: A once-in-a-century herbicide. Pest Manag. Sci. 2008, 64, 319–325. [Google Scholar] [CrossRef]
- Antier, C.; Kudsk, P.; Reboud, X.; Ulber, L.; Baret, P.V.; Messéan, A. Glyphosate Use in the European Agricultural Sector and a Framework for Its Further Monitoring. Sustainability 2020, 12, 5682. [Google Scholar] [CrossRef]
- Meftaul, I.M.; Venkateswarlu, K.; Dharmarajan, R.; Annamalai, P.; Asaduzzaman, M.; Parven, A.; Megharaj, M. Controversies over human health and ecological impacts of glyphosate: Is it to be banned in modern agriculture? Environ. Pollut. 2020, 263, 114372. [Google Scholar] [CrossRef]
- Benbrook, C.M. Trends in glyphosate herbicide use in the United States and globally. Environ. Sci. Eur. 2016, 28, 3. [Google Scholar] [CrossRef]
- Von Soosten, D.; Meyer, U.; Hüther, L.; Dänicke, S.; Lahrssen-Wiederholt, M.; Schafft, H.; Spolders, M.; Breves, G. Excretion pathways and ruminal disappearance of glyphosate and its degradation product aminomethylphosphonic acid in dairy cows. J. Dairy Sci. 2016, 99, 5318–5324. [Google Scholar] [CrossRef]
- Heymann, A.-K.; Schnabel, K.; Billenkamp, F.; Bühler, S.; Frahm, J.; Kersten, S.; Hüther, L.; Meyer, U.; von Soosten, D.; Trakooljul, N.; et al. Effects of glyphosate residues and different concentrate feed proportions in dairy cow rations on hepatic gene expression, liver histology and biochemical blood parameters. PLoS ONE 2021, 16, e0246679. [Google Scholar] [CrossRef]
- Schnabel, K.; Schmitz, R.; Frahm, J.; Meyer, U.; Breves, G.; Dänicke, S. Functionality and DNA-damage properties of blood cells in lactating cows exposed to glyphosate contaminated feed at different feed energy levels. Arch. Anim. Nutr. 2020, 74, 87–106. [Google Scholar] [CrossRef]
- Schnabel, K.; Schmitz, R.; von Soosten, D.; Frahm, J.; Kersten, S.; Meyer, U.; Breves, G.; Hackenberg, R.; Spitzke, M.; Dänicke, S. Effects of glyphosate residues and different con-centrate feed proportions on performance, energy metabolism and health characteristics in lactating dairy cows. Arch. Anim. Nutr. 2017, 71, 413–427. [Google Scholar] [CrossRef]
- Fu, H.; Qiu, S.; Yao, X.; Gao, F.; Tan, P.; Teng, T.; Shi, B. Toxicity of glyphosate in feed for weanling piglets and the mechanism of glyphosate detoxification by the liver nuclear receptor CAR/PXR pathway. J. Hazard. Mater. 2019, 387, 121707. [Google Scholar] [CrossRef]
- Krüger, M.; Schledorn, P.; Schrödl, W.; Hoppe, H.W.; Lutz, W.; Shehata, A.A. Detection of glyphosate residues in animals and humans. J. Environ. Anal. Toxicol. 2014, 4, 1–5. [Google Scholar]
- Anadón, A.; Martínez-Larrañaga, M.R.; Martínez, M.A.; Castellano, V.J.; Martínez, M.; Martin, M.T.; Nozal, M.J.; Bernal, J.L. Toxicokinetics of glyphosate and its metabolite aminomethyl phosphonic acid in rats. Toxicol. Lett. 2009, 190, 91–95. [Google Scholar] [CrossRef]
- El-Shenawy, N.S. Oxidative stress responses of rats exposed to Roundup and its active ingredient glyphosate. Environ. Toxicol. Pharmacol. 2009, 28, 379–385. [Google Scholar] [CrossRef]
- Jasper, R.; Locatelli, G.O.; Pilati, C.; Locatelli, C. Evaluation of biochemical, hematological and oxidative parameters in mice exposed to the herbicide glyphosate-Roundup®. Interdiscip. Toxicol. 2012, 5, 133–140. [Google Scholar] [CrossRef]
- Owagboriaye, F.; Dedeke, G.; Ademolu, K.; Olujimi, O.; Aladesida, A.; Adeleke, M. Comparative studies on endogenic stress hormones, antioxidant, biochemical and hematological status of metabolic disturbance in albino rat exposed to roundup herbicide and its active ingredient glyphosate. Environ. Sci. Pollut. Res. 2019, 26, 14502–14512. [Google Scholar] [CrossRef]
- Fialkow, L.; Wang, Y.; Downey, G.P. Reactive oxygen and nitrogen species as signaling molecules regulating neutrophil function. Free Radic. Biol. Med. 2007, 42, 153–164. [Google Scholar] [CrossRef]
- Franchina, D.G.; Dostert, C.; Brenner, D. Reactive Oxygen Species: Involvement in T Cell Signaling and Metabolism. Trends Immunol. 2018, 39, 489–502. [Google Scholar] [CrossRef]
- Woźniak, E.; Sicińska, P.; Michałowicz, J.; Woźniak, K.; Reszka, E.; Huras, B.; Zakrzewski, J.; Bukowska, B. The mechanism of DNA damage induced by Roundup 360 PLUS, glyphosate and AMPA in human peripheral blood mononuclear cells—Genotoxic risk assessement. Food Chem. Toxicol. 2018, 120, 510–522. [Google Scholar] [CrossRef]
- Kwiatkowska, M.; Huras, B.; Bukowska, B. The effect of metabolites and impurities of glyphosate on human erythrocytes (in vitro). Pestic. Biochem. Physiol. 2014, 109, 34–43. [Google Scholar] [CrossRef]
- Kwiatkowska, M.; Michałowicz, J.; Jarosiewicz, P.; Pingot, D.; Sicińska, P.; Huras, B.; Zakrzewski, J.; Jarosiewicz, M.; Bukowska, B. Evaluation of apoptotic potential of glyphosate metabolites and impurities in human peripheral blood mononuclear cells (in vitro study). Food Chem. Toxicol. 2019, 135, 110888. [Google Scholar] [CrossRef]
- Billenkamp, F.; Schnabel, K.; Hüther, L.; Frahm, J.; von Soosten, D.; Meyer, U.; Höper, D.; Beer, M.; Seyboldt, C.; Neubauer, H.; et al. No hints at glyphosate-induced ruminal dysbiosis in cows. NPJ Biofilms Microbiomes 2021, 7, 30. [Google Scholar] [CrossRef]
- Erickson, G.E.; Robbins, N.D.; Simon, J.J.; Berger, L.L.; Klopfenstein, T.J.; Stanisiewski, E.P.; Hartnell, G.F. Effect of feeding glyphosate-tolerant (Roundup-Ready events GA21 or nk603) corn compared with reference hybrids on feedlot steer performance and carcass characteristics1. J. Anim. Sci. 2003, 81, 2600–2608. [Google Scholar] [CrossRef]
- Bundesministeriums für Ernährung und Landwirtschaft. Fünfte Verordnung zur Änderung der Pflanzenschutz-Anwendungsverordnung $3 Absatz (5). Bundesgesetzblatt Teil 1 Nr. 62 vom 7 September 2021; Bundesministeriums für Ernährung und Landwirtschaft: Berlin, Germany, 2021. (In German) [Google Scholar]
- Ackermann, W.; Coenen, M.; Schrödl, W.; Shehata, A.A.; Krüger, M. The Influence of Glyphosate on the Microbiota and Production of Botulinum Neurotoxin During Ruminal Fermentation. Curr. Microbiol. 2014, 70, 374–382. [Google Scholar] [CrossRef]
- Krüger, M.; Shehata, A.A.; Schrödl, W.; Rodloff, A. Glyphosate suppresses the antagonistic effect of Enterococcus spp. on Clostridium botulinum. Anaerobe 2013, 20, 74–78. [Google Scholar] [CrossRef]
- Winkler, J.; Gödde, J.; Meyer, U.; Frahm, J.; Westendarp, H.; Dänicke, S. Fusarium toxin-contaminated maize in diets of growing bulls: Effects on performance, slaughtering characteristics, and transfer into physiological liquids. Mycotoxin Res. 2016, 32, 127–135. [Google Scholar] [CrossRef]
- VDLUFA (Verband Deutscher Landwirtschaftlicher Untersuchungs- und Forschungsanstalten). Die Chemische Untersuchung von Futtermitteln; Rüdiger, S., Carl, B., Curt, N., Rolf, B., Eds.; VDLUFA-Verlag: Darmstadt, Germany, 1993. [Google Scholar]
- Benzie, I.F.F.; Strain, J.J. The ferric reducing ability of plasma (FRAP) as a measure of “antioxidant power”: The FRAP assay. Anal. Biochem. 1996, 239, 70–76. [Google Scholar] [CrossRef]
- Bühler, S.; Frahm, J.; Tienken, R.; Kersten, S.; Meyer, U.; Huber, K.; Dänicke, S. Effects of energy supply and nicotinic acid supplementation on serum anti-oxidative capacity and on expression of oxidative stress-related genes in blood leucocytes of periparturient primi- and pluriparous dairy cows. J. Anim. Physiol. Anim. Nutr. 2017, 102, e87–e98. [Google Scholar] [CrossRef]
- Singh, N.P.; McCoy, M.T.; Tice, R.R.; Schneider, E.L. A simple technique for quantitation of low levels of DNA damage in individual cells. Exp. Cell Res. 1988, 175, 184–191. [Google Scholar] [CrossRef]
- Końca, K.; Lankoff, A.; Banasik, A.; Lisowska, H.; Kuszewski, T.; Góźdź, S.; Koza, Z.; Wojcik, A. A cross-platform public domain PC image-analysis program for the comet assay. Mutat. Res. Toxicol. Environ. Mutagen. 2002, 534, 15–20. [Google Scholar] [CrossRef]
- Olive, P.L.; Banáth, J.P.; Durand, R.E. Heterogeneity in Radiation-Induced DNA Damage and Repair in Tumor and Normal Cells Measured Using the “Comet” Assay. Radiat. Res. 1990, 122, 86. [Google Scholar] [CrossRef]
- Bühler, S.; Frahm, J.; Liermann, W.; Tienken, R.; Kersten, S.; Meyer, U.; Huber, K.; Dänicke, S. Effects of energy supply and nicotinic acid supple-mentation on phagocytosis and ROS production of blood immune cells of periparturient primi- and pluriparous dairy cows. Res. Vet. Sci. 2018, 116, 62–71. [Google Scholar] [CrossRef]
- Renner, L.; Schwabe, A.; Döll, S.; Höltershinken, M.; Dänicke, S. Effect of rare earth elements on beef cattle growth performance, blood clinical chemical parameters and mitogen stimulated proliferation of bovine peripheral blood mononuclear cells in vitro and ex vivo. Toxicol. Lett. 2011, 201, 277–284. [Google Scholar] [CrossRef]
- Drong, C.; Meyer, U.; Von Soosten, D.; Frahm, J.; Rehage, J.; Schirrmeier, H.; Beer, M.; Dänicke, S. Effects of monensin and essential oils on immunological, haematological and biochemical parameters of cows during the transition period. J. Anim. Physiol. Anim. Nutr. 2016, 101, 791–806. [Google Scholar] [CrossRef]
- Bühler, S.; Frahm, J.; Tienken, R.; Kersten, S.; Meyer, U.; Huber, K.; Dänicke, S. Influence of energy level and nicotinic acid supplementation on apoptosis of blood leukocytes of periparturient dairy cows. Vet. Immunol. Immunopathol. 2016, 179, 36–45. [Google Scholar] [CrossRef]
- Ye, J.; Coulouris, G.; Zaretskaya, I.; Cutcutache, I.; Rozen, S.; Madden, T.L. Primer-BLAST: A tool to design target-specific primers for polymerase chain reaction. BMC Bioinform. 2012, 13, 134. [Google Scholar] [CrossRef]
- Koressaar, T.; Remm, M. Enhancements and modifications of primer design program Primer3. Bioinformatics 2007, 23, 1289–1291. [Google Scholar] [CrossRef]
- Untergasser, A.; Cutcutache, I.; Koressaar, T.; Ye, J.; Faircloth, B.C.; Remm, M.; Rozen, S.G. Primer3—New capabilities and interfaces. Nucleic Acids Res. 2012, 40, e115. [Google Scholar] [CrossRef]
- Littell, R.C.; Henry, P.R.; Ammerman, C.B. Statistical analysis of repeated measures data using SAS procedures. J. Anim. Sci. 1998, 76, 1216–1231. [Google Scholar] [CrossRef]
- RStudio Team. RStudio: Integrated Development for R, version 1.2.5042; RStudio, Inc.: Boston, MA, USA, 2020.
- R Core Team. R: A Language and Environment for Statistical Computing; R Foundation for Statistical Computing: Vienna, Austria, 2020. [Google Scholar]
- Wickham, H. ggplot2: Elegant Graphics for Data Analysis; Springer: New York, NY, USA, 2016. [Google Scholar]
- Kassambara, A. ggpubr: ‘ggplot2’ Based Publication Ready Plots, R package version 0.2.5; 2020. Available online: https://rpkgs.datanovia.com/ggpubr/ (accessed on 13 March 2023).
- Auguie, B. gridExtra: Miscellaneous Functions for “Grid” Graphics, R package version 2.1; 2017. Available online: https://cran.r-project.org/web/packages/gridExtra/ (accessed on 13 March 2023).
- Wickham, H.; Pedersen, T.L. gtable: Arrange ‘Grobs’ in Tables, R package version 0.3; 2019. Available online: https://cloud.r-project.org/web/packages/gtable/index.html (accessed on 13 March 2023).
- Wei, T.; Simko, V. R Package “corrplot”: Visualization of a Correlation Matrix, 2021.
- Qiu, S.; Fu, H.; Zhou, R.; Yang, Z.; Bai, G.; Shi, B. Toxic effects of glyphosate on intestinal morphology, antioxidant capacity and barrier function in weaned piglets. Ecotoxicol. Environ. Saf. 2020, 187, 109846. [Google Scholar] [CrossRef]
- Duke, S.O. Glyphosate: Uses Other Than in Glyphosate-Resistant Crops, Mode of Action, Degradation in Plants, and Effects on Non-target Plants and Agricultural Microbes. In Reviews of Environmental Contamination and Toxicology; Springer: Cham, Switzerland, 2020; pp. 1–65. [Google Scholar] [CrossRef]
- Mutwedu, V.B.; Nyongesa, A.W.; Azine, P.C.; Chiregereza, D.K.; Ngoumtsop, V.H.; Mugumaarhahama, Y.; Ayagirwe, R.B.B. Growth performance and reproductive function impairment of glyphosate-based herbicide in male guinea pig (Cavia porcellus). Vet. Med. Sci. 2021, 7, 1047–1055. [Google Scholar] [CrossRef]
- Braun, U. Ultrasonography of the Liver in Cattle. Vet. Clin. North Am. Food Anim. Pract. 2009, 25, 591–609. [Google Scholar] [CrossRef]
- Kraft, W.; Dürr, U.M. Klinische Labordiagnostik in der Tiermedizin, 7th ed.; Schattauer: Stuttgart, Germany, 2014. [Google Scholar]
- Dänicke, S.; Winkler, J.; Meyer, U.; Kersten, S.; Wernike, K.; Beer, M.; Frahm, J. Antibody response of growing German Holstein bulls to a vaccination against bovine viral diarrhea virus (BVDV) is influenced by Fusarium toxin exposure in a non-linear fashion. Mycotoxin Res. 2018, 34, 123–139. [Google Scholar] [CrossRef] [PubMed]
- Astiz, M.; de Alaniz, M.J.; Marra, C.A. Antioxidant defense system in rats simultaneously intoxicated with agrochemicals. Environ. Toxicol. Pharmacol. 2009, 28, 465–473. [Google Scholar] [CrossRef]
- Knight, J.A. Review: Free radicals, antioxidants, and the immune system. Ann. Clin. Lab. Sci. 2000, 30, 145–158. [Google Scholar]
- Espinosa-Diez, C.; Miguel, V.; Mennerich, D.; Kietzmann, T.; Sánchez-Pérez, P.; Cadenas, S.; Lamas, S. Antioxidant responses and cellular adjustments to oxidative stress. Redox Biol. 2015, 6, 183–197. [Google Scholar] [CrossRef]
- Olive, P.L.; Banáth, J.P. The comet assay: A method to measure DNA damage in individual cells. Nat. Protoc. 2006, 1, 23–29. [Google Scholar] [CrossRef]
- Mañas, F.; Peralta, L.; Raviolo, J.; Ovando, H.G.; Weyers, A.; Ugnia, L.; Cid, M.G.; Larripa, I.; Gorla, N. Genotoxicity of glyphosate assessed by the comet assay and cytogenetic tests. Environ. Toxicol. Pharmacol. 2009, 28, 37–41. [Google Scholar] [CrossRef]
- Fischer, M. Census and evaluation of p53 target genes. Oncogene 2017, 36, 3943–3956. [Google Scholar] [CrossRef]
- Russell, D.F.; Betts, D.H. Alternative splicing and expression analysis of bovine DNA methyltransferase 1. Dev. Dyn. 2008, 237, 1051–1059. [Google Scholar] [CrossRef]
- Gajewski, S.; Hartwig, A. PARP1 is required for ATM-mediated p53 activation and p53-mediated gene expression after ionizing radiation. Chem. Res. Toxicol. 2020, 33, 1933–1940. [Google Scholar] [CrossRef]
- Woźniak, E.; Reszka, E.; Jablonska, E.; Balcerczyk, A.; Broncel, M.; Bukowska, B. Glyphosate affects methylation in the promoter regions of selected tumor suppressors as well as expression of major cell cycle and apoptosis drivers in PBMCs (in vitro study). Toxicol. Vitr. 2019, 63, 104736. [Google Scholar] [CrossRef]

| Concentrates | Roughage | ||||||
|---|---|---|---|---|---|---|---|
| Experimental Group | |||||||
| GLYHC n = 11 | CONHC n = 12 | GLYLC n = 12 | CONLC n = 12 | Maize Silage | Straw CON | Straw GLY | |
| Components [% dry matter] | |||||||
| Peas | 35.0 | 65.0 | |||||
| Peas GLY-treated | 35.0 | 65.0 | |||||
| Wheat | 29.0 | 10.0 | |||||
| Wheat GLY-treated | 29.0 | 10.0 | |||||
| Corn | 29.2 | 29.2 | |||||
| Soybean oil | 1.0 | 1.0 | 1.0 | 1.0 | |||
| Urea | 1.8 | 1.8 | 13.0 | 13.0 | |||
| Calcium carbonate | 1.0 | 1.0 | |||||
| Vitamin/Mineral Premix $ | 3.0 | 3.0 | 11.0 | 11.0 | |||
| Chemical composition | |||||||
| Dry matter (DM) [%] | 87 | 87 | 87 | 89 | 34 | 88 | 86 |
| Nutrients [g/kg DM] | |||||||
| Crude ash | 61 | 60 | 127 | 131 | 37 | 60 | 57 |
| Crude protein | 203 | 202 | 554 | 560 | 70 | 34 | 32 |
| Ether extract | 41 | 42 | 26 | 24 | 35 | 15 | 14 |
| Crude fibre | 40 | 36 | 44 | 45 | 190 | 443 | 427 |
| aNDFom ‡ | 97 | 95 | 85 | 77 | 379 | 820 | 821 |
| ADFom § | 48 | 46 | 56 | 57 | 219 | 505 | 500 |
| Starch | 582 | 595 | 409 | 402 | 367 | ||
| Sugar | 44 | 43 | 41 | 42 | |||
| Energy [MJ ME/kg DM] | 12.8 | 12.8 | 10.4 | 10.4 | 11.5 | 6.4 | 6.4 |
| Herbicide agent residues [mg/kg DM] | |||||||
| Glyphosate | 0.41 | 0.02 | 0.31 | 0.01 | 0.00 # | 0.57 # | 61.81 # |
| AMPA | 0.01 | 0.00 | 0.00 | 0.00 | 0.00 # | 0.00 # | 0.59 # |
| Gene Symbol | NCBI Accession Number | Sequences [fw/rev] 5′-3′ | Concentration [nmol] fw/rev | Amplicon Size [bp] | Efficiency [%] | Reference |
|---|---|---|---|---|---|---|
| Reference genes | ||||||
| RPS9 | NM_001101152.2 | F-GGCGTCTGTTCGAAGGTAATG R-GGGATGTTCACCACCTGCTT | 333/333 | 229 | 101.8 | this study |
| UCHL | NM_174481 | F-CAAAGACAACTTGCTGAGGAACC R-ACTGCTTGTGTTCTGCTAAAGTC | 333/333 | 208 | 95.9 | [35] |
| UXT | NM_001037471.2 | F-CGCTACGAGGCTTTCATCTCT R-CGAGTGGTTAGCTTCCTGGAGT | 333/333 | 141 | 89.6 | [6] |
| Genes of interest | ||||||
| BCL2 | NM_001166486.1 | F-ACGGAGGCTGGGACGCCTTT R-AGGGTGATGCAAGCGCCCAC | 250/333 | 121 | 96.8 | [35] |
| BRCA1 | NM_178573.1 | F-CCAAAGCGAGCAAGAGAATCC R-CACTCTAGTTGATCTGTGGGC | 333/333 | 101 | 94.8 | this study |
| CASP3 | NM_001077840.1 | F-CAGCGTCGTAGCTGAACGTA R-AGGCCATGCCAGTATTTTCG | 500/500 | 221 | 102 | [35] |
| CDKN1A | NM_001098958.2 | F-CCACTCCAAACGCAGACTGA R-GCACAAACTGAAGGCCCAAG | 333/333 | 131 | 84.6 | this study |
| GADD45A | NM_001034247.1 | F-GAGCAAAAGACCGAAAGGATGG R-CAGGCACAGCACCACGTTAT | 333/333 | 147 | 96.6 | this study |
| HSPA1A | NM_203322.3 | F-AGGACTTCGACAACAGGCTG R-TGCTGGACGACAAGGTTCTC | 500/500 | 141 | 93.2 | this study |
| NRF2 | NM_001011678.2 | F-AGCTCAGCATGATGGACTTGGA R-CAGCTCATGCTCCTTCTGTCG | 333/333 | 152 | 91.1 | [28] |
| OGG1 | NM_001080285.2 | F-ACCTTTGGACCTCGGCTCAT R-CCGTTCTTCTAGGATGGCTCG | 333/333 | 165 | 94.4 | this study |
| PARP1 | NM_174751.2 | F-CGGACAGATGTTTCAGGCAAAG R-TGGGGCTTATCGGGGTACA | 250/250 | 179 | 97.1 | [28] |
| RAD51 | NM_001046179.2 | F-GCCCTAGCGAATACCAAAGC R-ACCACATTGCTCTAGTCGGG | 333/333 | 145 | 94.1 | this study |
| SOD | NM_201527.2 | F-CGTGACTTTGGTTCCTTTGCC R-GCGTCCCTGCTCCTTATTGA | 250/250 | 108 | 95.2 | [28] |
| TP53 | NM_174201.2 | F-TAGGAGCACTAAGCGAGCACT R-GTTCCCTTCCATCCAGAGCA | 333/333 | 173 | 86.4 | this study |
| XRCC5 | NM_001102141.1 | F-AGACCCTCTTCCCTCTGACG R-TTCACGCTTCCAACACAGGT | 333/333 | 181 | 99.6 | this study |
| Experimental Group | p-Value | |||||||
|---|---|---|---|---|---|---|---|---|
| CONHC (n = 12) | CONLC (n = 12) | GLYHC (n = 11) | GLYLC (n = 12) | PSEM | CFP | GLY | GLY× CFP | |
| Final performance evaluation # | ||||||||
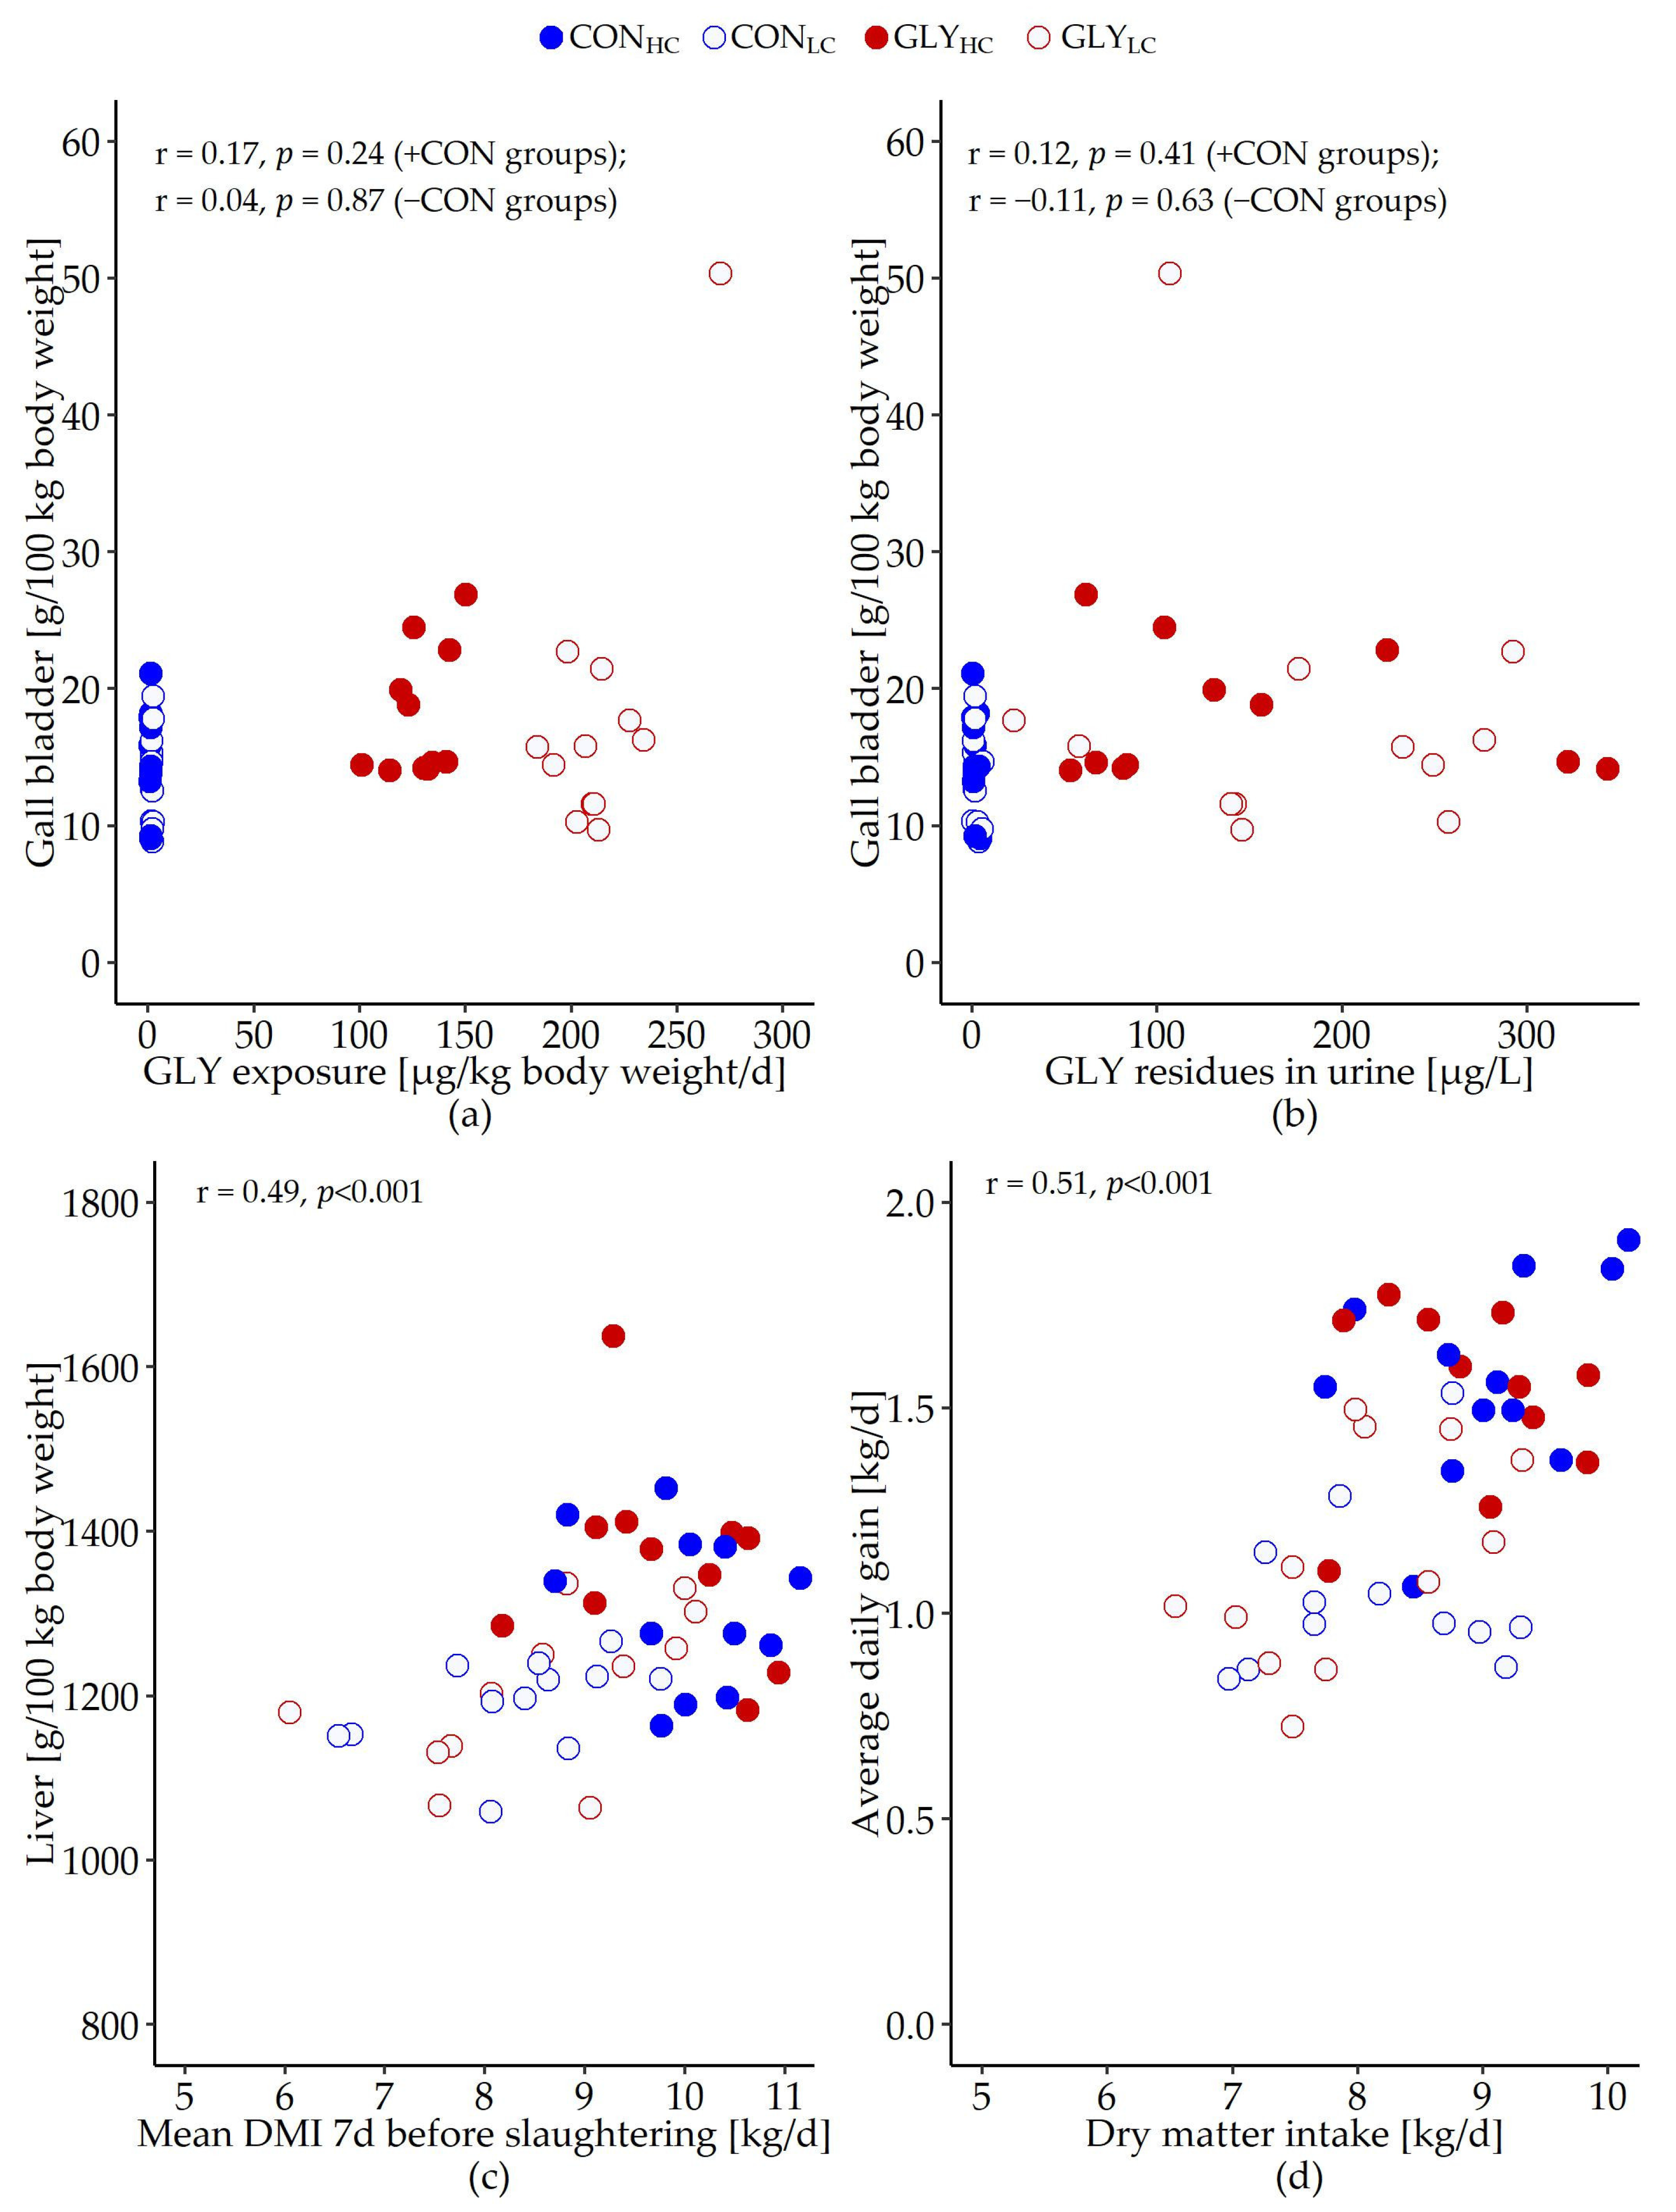
| Dry matter intake (DMI) [kg/d] | 9.0 | 8.1 | 8.9 | 7.9 | 0.090 | <0.001 | 0.400 | 0.834 |
| Water intake [l/d] | 21.9 | 21.2 | 22.1 | 21.4 | 0.566 | 0.512 | 0.868 | 0.983 |
| Energy intake [MJ/d] | 105 | 85 | 103 | 83 | 0.957 | <0.001 | 0.420 | 0.891 |
| Average daily gain (ADG) [kg/d] | 1.6 | 1.0 | 1.5 | 1.1 | 0.033 | <0.001 | 0.669 | 0.321 |
| Feed conversion [kg DMI/kg ADG] | 6.0 | 8.3 | 6.0 | 7.6 | 0.189 | <0.001 | 0.336 | 0.320 |
| Energy utilization [MJ ME/kg ADG] | 69.4 | 86.8 | 69.6 | 79.2 | 2.027 | 0.001 | 0.362 | 0.341 |
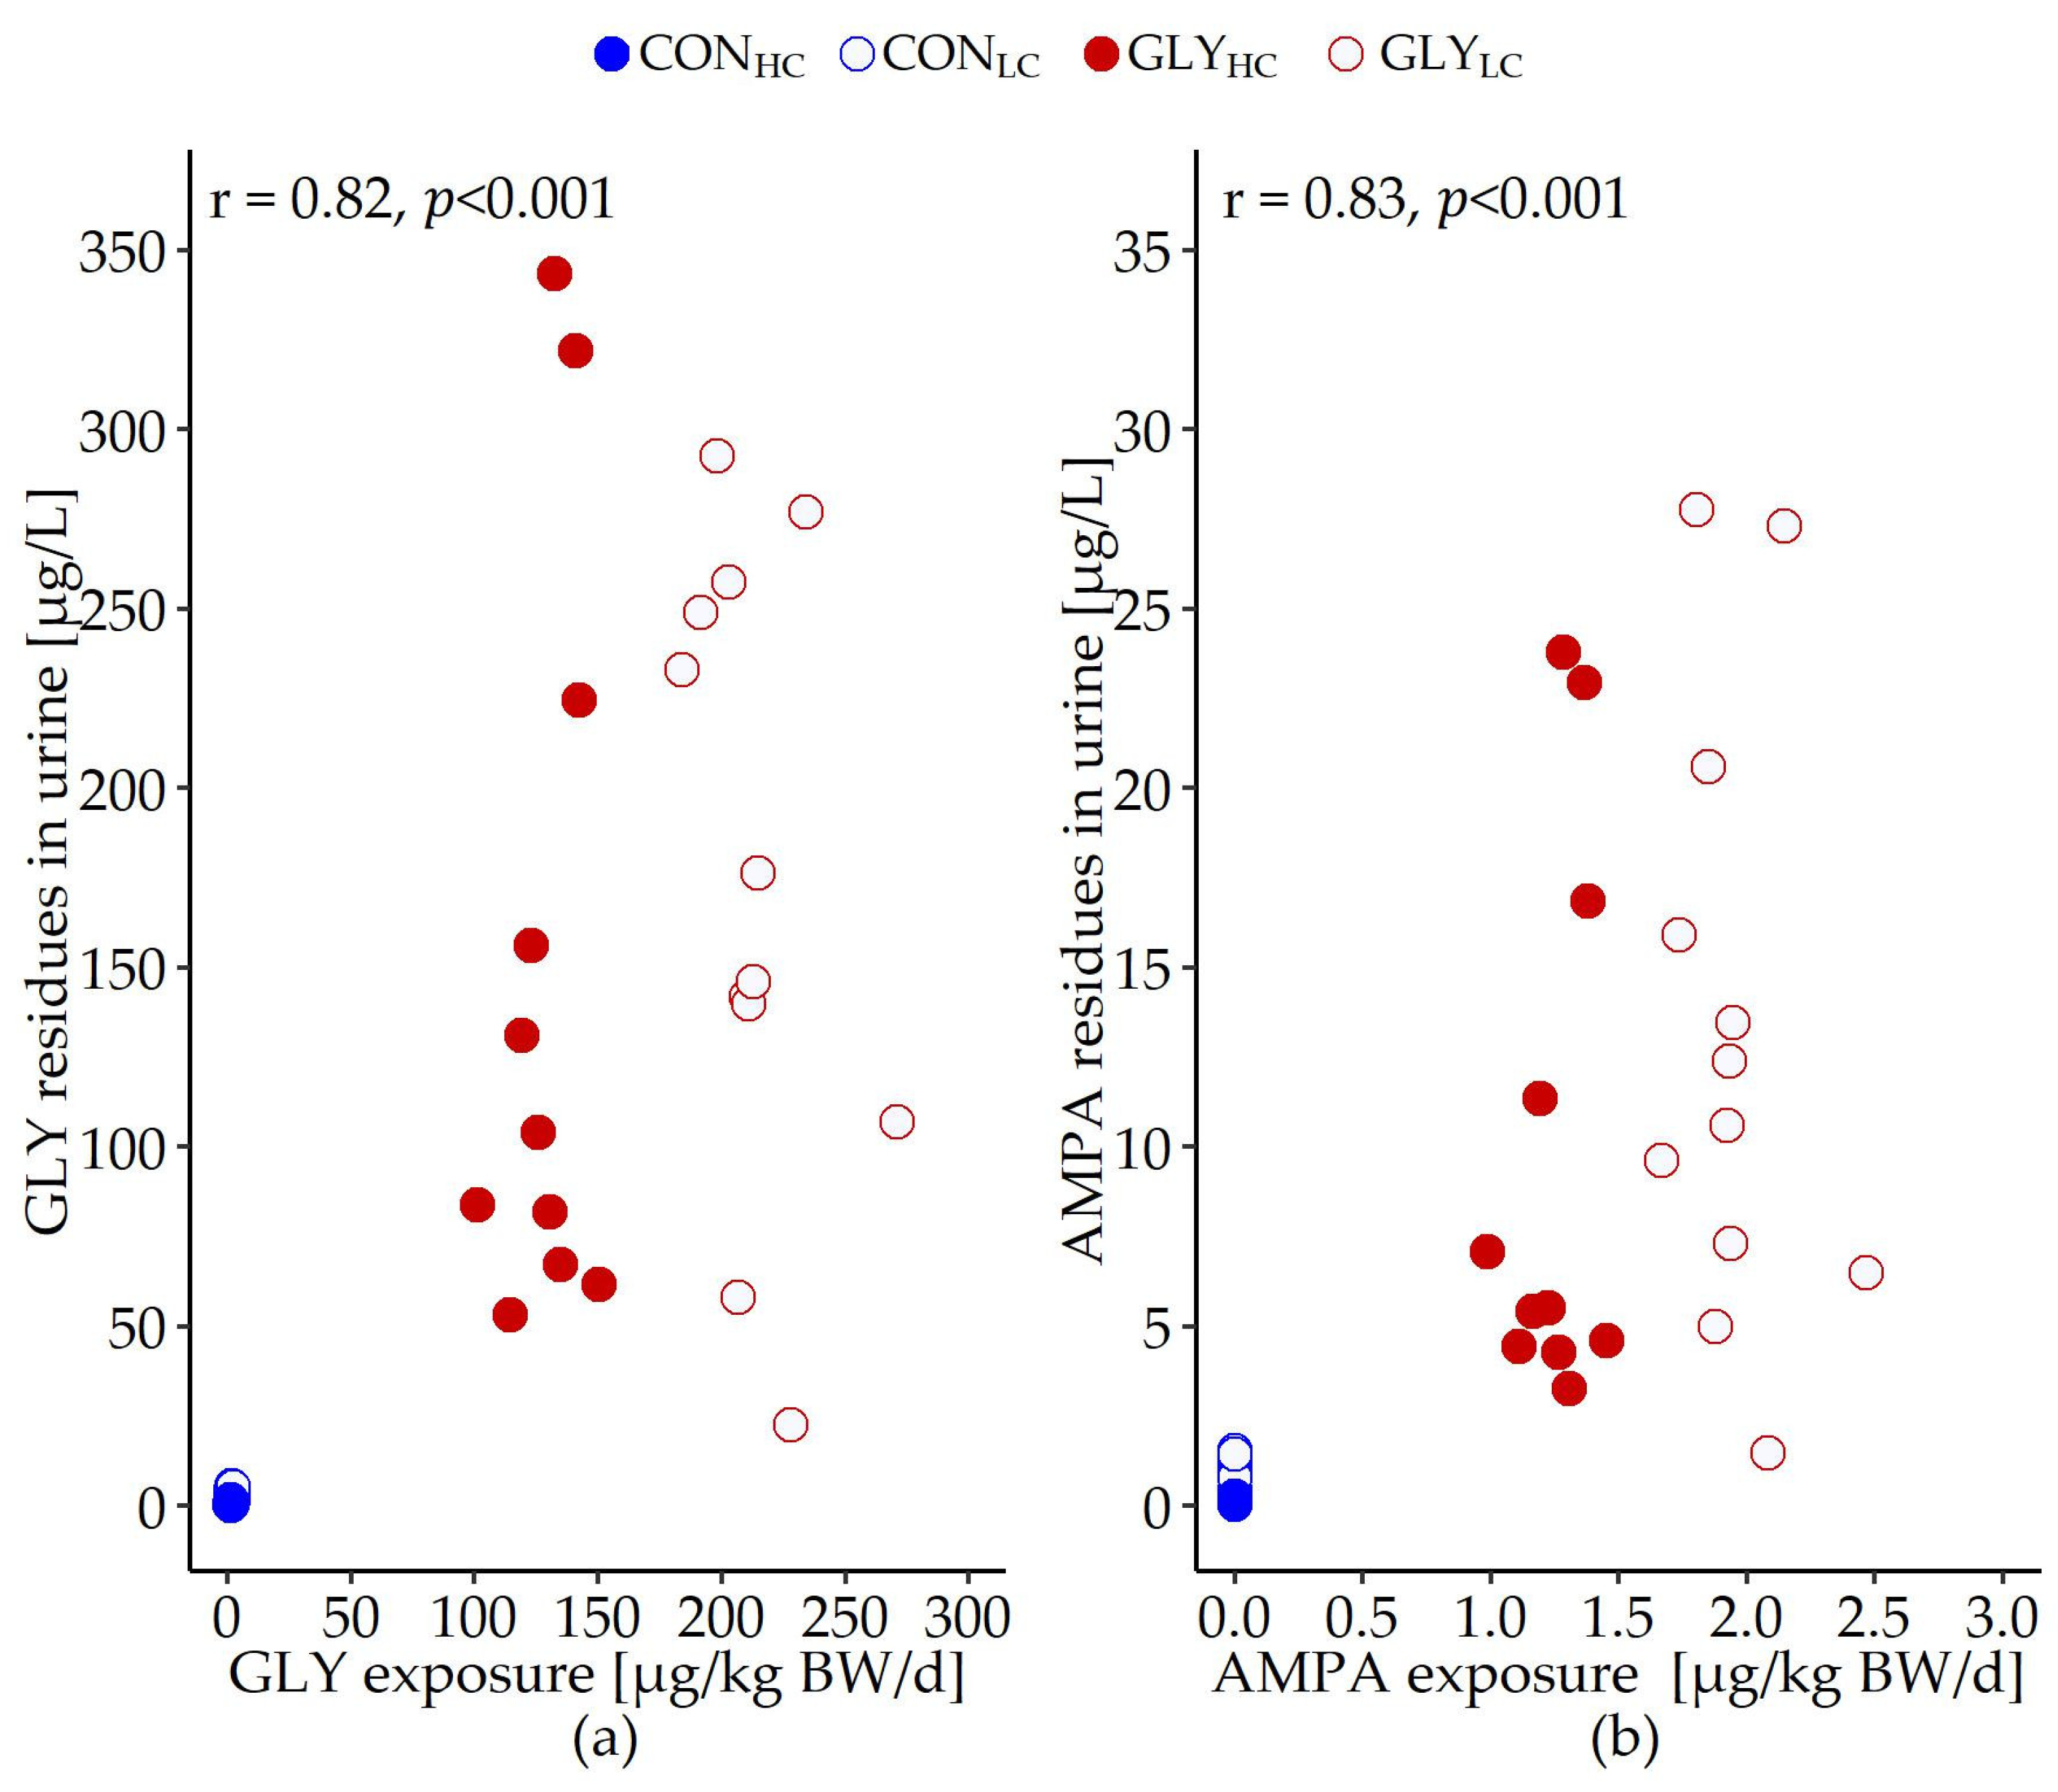
| GLY exposure [µg/kg BW/d] | 1.3 | 2.0 | 128.6 | 213.7 | 1.444 | <0.001 | <0.001 | <0.001 |
| AMPA exposure [µg/kg BW/d] | 0.0 | 0.0 | 1.2 | 1.9 | 0.014 | <0.001 | <0.001 | <0.001 |
| Body weight before slaughtering [kg], selected organ weights [g/100 kg BW] and GLY/AMPA residues in urine [µg/L] | ||||||||
| Body weight | 584.3 | 501.4 | 570.8 | 510.0 | 8.510 | <0.001 | 0.886 | 0.520 |
| GLY in urine | 1.8 | 2.3 | 148.1 | 188.0 | 66.954 | 0.484 | <0.001 | 0.503 |
| AMPA in urine | 0.3 | 0.6 | 10.0 | 13.2 | 5.657 | 0.296 | <0.001 | 0.383 |
| Gall blader | 14.9 | 13.6 | 18.1 | 18.1 | 0.945 | 0.733 | 0.046 | 0.722 |
| Heart | 306.6 | 285.6 | 307.5 | 278.2 | 0.005 | 0.014 | 0.741 | 0.673 |
| Kidneys | 200.5 | 195.9 | 214.1 | 204.2 | 3.674 | 0.328 | 0.142 | 0.722 |
| Liver | 1306.9 | 1191.3 | 1361.7 | 1208.1 | 13.601 | <0.001 | 0.196 | 0.490 |
| Lung | 557.6 | 510.6 | 539.5 | 498.3 | 9.786 | 0.029 | 0.441 | 0.884 |
| Prostate gland | 113.1 | 103.7 | 114.3 | 104.2 | 2.117 | 0.027 | 0.832 | 0.936 |
| Pancreas | 91.3 | 80.2 | 85.8 | 80.6 | 1.783 | 0.027 | 0.481 | 0.420 |
| Spinal cord | 25.4 | 25.0 | 26.4 | 24.9 | 0.336 | 0.144 | 0.513 | 0.393 |
| Spleen | 165.7 | 148.1 | 168.6 | 142.6 | 3.344 | 0.002 | 0.851 | 0.535 |
| Testicles | 132.46 | 123.82 | 136.06 | 128.38 | 2.832 | 0.157 | 0.475 | 0.933 |
| Thymus | 57.98 | 49.25 | 59.27 | 46.87 | 1.642 | 0.002 | 0.870 | 0.580 |
| Thyroid glands | 10.75 | 8.71 | 12.38 | 8.14 | 0.575 | 0.009 | 0.651 | 0.345 |
| Tongue | 210.37 | 197.64 | 210.92 | 197.27 | 3.456 | 0.063 | 0.990 | 0.947 |
| Urinary bladder | 15.41 | 13.63 | 16.46 | 19.19 | 0.959 | 0.805 | 0.092 | 0.246 |
| Experimental Group | p-Value | ||||||||||||
|---|---|---|---|---|---|---|---|---|---|---|---|---|---|
| Week | CONHC (n = 12) | CONLC (n = 12) | GLYHC (n = 11) | GLYLC (n = 12) | PSEM | GLY | CFP | t | GLY×CFP | GLY×t | CFP×t | GLY× CFP×t | |
| Albumin [g/L] | 0 | 30.07 | 29.73 | 30.27 | 29.71 | 0.160 | 0.382 | <0.001 | <0.001 | 0.057 | 0.696 | 0.182 | 0.199 |
| 7 | 29.62 | 27.28 | 28.44 | 27.43 | |||||||||
| 15 | 33.32 | 30.33 | 31.62 | 31.19 | |||||||||
| Total protein [g/L] | 0 | 50.37 | 49.98 | 50.55 | 50.33 | 0.211 | 0.959 | <0.001 | <0.001 | 0.604 | 0.018 | 0.003 | 0.965 |
| 7 | 54.14 | 52.23 | 52.15 | 50.95 | |||||||||
| 15 | 53.42 | 49.32 | 54.50 | 50.83 | |||||||||
| Total bilirubin [µmol/L] | 0 | 7.91 | 7.63 | 7.87 | 7.71 | 0.097 | 0.369 | 0.002 | 0.945 | 0.927 | 0.773 | 0.001 | 0.364 |
| 7 | 7.47 | 8.23 | 7.53 | 7.62 | |||||||||
| 15 | 7.18 | 8.50 | 6.58 | 8.56 | |||||||||
| Triglycerides [mmol/L] | 0 | 0.19 | 0.21 | 0.18 | 0.19 | 0.004 | 0.085 | 0.467 | <0.001 | 0.405 | 0.039 | 0.014 | 0.422 |
| 7 | 0.13 | 0.08 | 0.15 | 0.12 | |||||||||
| 15 | 0.17 | 0.15 | 0.19 | 0.21 | |||||||||
| Alkaline phosphatase [µkat/L] | 0 | 4.52 | 4.48 | 4.55 | 4.56 | 0.063 | 0.783 | 0.060 | <0.001 | 0.131 | 0.948 | 0.352 | 0.622 |
| 7 | 4.68 | 4.13 | 4.36 | 4.41 | |||||||||
| 15 | 5.33 | 4.61 | 5.14 | 4.94 | |||||||||
| Aspartate aminotransferase (AST) [µkat/L] | 0 | 0.96 | 0.94 | 0.98 | 0.92 | 0.013 | 0.660 | 0.155 | 0.030 | 0.288 | 0.046 | 0.992 | 0.296 |
| 7 | 0.93 | 0.87 | 0.96 | 0.96 | |||||||||
| 15 | 1.11 | 1.00 | 0.95 | 0.98 | |||||||||
| γ-glutamyltransferase (GGT) [µkat/L] | 0 | 0.23 | 0.24 | 0.22 | 0.23 | 0.006 | 0.389 | 0.375 | 0.069 | 0.208 | 0.805 | 0.448 | 0.590 |
| 7 | 0.26 | 0.22 | 0.23 | 0.22 | |||||||||
| 15 | 0.28 | 0.24 | 0.26 | 0.26 | |||||||||
| Glutamate dehydrogenase (GLDH) [µkat/L] | 0 | 0.28 | 0.36 | 0.34 | 0.21 | 0.060 | 0.699 | 0.025 | 0.688 | 0.995 | 0.815 | 0.283 | 0.805 |
| 7 | 0.66 | 0.15 | 0.69 | 0.21 | |||||||||
| 15 | 0.20 | 0.23 | 0.39 | 0.18 | |||||||||
| Urea [mmol/L] | 0 | 1.01 | 1.15 | 0.89 | 0.99 | 0.069 | 0.312 | 0.477 | <0.001 | 0.060 | 0.998 | 0.071 | 0.146 |
| 7 | 3.59 | 3.09 | 2.82 | 3.58 | |||||||||
| 15 | 3.43 | 2.69 | 3.09 | 2.72 | |||||||||
| Uric acid [µmol/L] | 0 | 65.23 | 92.32 | 86.59 | 77.23 | 4.416 | 0.417 | 0.335 | <0.001 | 0.851 | 0.155 | 0.144 | 0.063 |
| 7 | 21.40 | 12.06 | 17.62 | 16.77 | |||||||||
| 15 | 87.81 | 52.37 | 54.91 | 53.20 | |||||||||
| Experimental Group | p-Value | ||||||||||||
|---|---|---|---|---|---|---|---|---|---|---|---|---|---|
| Week | CONHC (n = 12) | CONLC (n = 12) | GLYHC (n = 11) | GLYLC (n = 12) | PSEM | GLY | CFP | t | GLY× CFP | GLY×t | CFP×t | GLY× CFP×t | |
| Erythrocytes [106/µL] | 0 | 8.18 | 8.22 | 8.17 | 8.24 | 0.048 | 0.420 | 0.021 | <0.001 | 0.204 | 0.845 | 0.125 | 0.558 |
| 7 | 9.34 | 9.22 | 9.46 | 8.86 | |||||||||
| 15 | 8.26 | 8.01 | 8.27 | 7.75 | |||||||||
| Mean corpuscular volume [fL] | 0 | 39.87 | 39.86 | 39.85 | 39.87 | 0.081 | 0.079 | <0.001 | <0.001 | 0.329 | 0.446 | <0.001 | 0.639 |
| 7 | 42.74 | 41.73 | 42.79 | 42.53 | |||||||||
| 15 | 43.90 | 42.22 | 44.25 | 42.75 | |||||||||
| Hemoglobin [g/dL] | 0 | 9.69 | 9.68 | 9.65 | 9.74 | 0.039 | 0.002 | 0.019 | <0.001 | 0.976 | 0.006 | <0.001 | 0.678 |
| 7 | 11.10 | 11.22 | 10.47 | 10.67 | |||||||||
| 15 | 12.32 | 11.65 | 12.28 | 11.42 | |||||||||
| Mean corpuscular hemoglobin [pg] | 0 | 11.86 | 11.84 | 11.85 | 11.85 | 0.049 | 0.211 | 0.462 | <0.001 | 0.142 | 0.072 | 0.002 | 0.502 |
| 7 | 11.97 | 12.22 | 11.23 | 12.08 | |||||||||
| 15 | 14.99 | 14.55 | 14.94 | 14.75 | |||||||||
| Mean corpuscular hemoglobin concentration [g/dL] | 0 | 29.83 | 29.47 | 30.06 | 29.65 | 0.161 | 0.093 | 0.072 | <0.001 | 0.431 | 0.007 | 0.001 | 0.633 |
| 7 | 28.12 | 29.09 | 26.55 | 28.32 | |||||||||
| 15 | 34.16 | 34.26 | 34.07 | 34.32 | |||||||||
| Hematocrit [%] | 0 | 32.57 | 32.63 | 32.38 | 32.77 | 0.201 | 0.721 | <0.001 | <0.001 | 0.495 | 0.979 | 0.007 | 0.735 |
| 7 | 39.84 | 38.36 | 40.18 | 37.64 | |||||||||
| 15 | 36.15 | 33.78 | 36.40 | 33.09 | |||||||||
| Red cell distribution width [%] | 0 | 18.55 | 18.61 | 18.69 | 18.60 | 0.051 | 0.629 | 0.249 | <0.001 | 0.196 | 0.814 | 0.401 | 0.350 |
| 7 | 18.42 | 18.20 | 18.35 | 18.51 | |||||||||
| 15 | 17.27 | 16.67 | 16.95 | 16.91 | |||||||||
| Platelets [10³/µL] | 0 | 193.86 | 193.43 | 201.83 | 180.27 | 6.052 | 0.596 | 0.902 | <0.001 | 0.881 | 0.866 | 0.316 | 0.701 |
| 7 | 291.61 | 281.26 | 311.28 | 285.94 | |||||||||
| 15 | 192.86 | 204.68 | 190.28 | 227.10 | |||||||||
| Mean platelet volume [fL] | 0 | 3.65 | 3.62 | 3.62 | 3.67 | 0.021 | 0.568 | 0.001 | 0.090 | 0.406 | 0.663 | 0.029 | 0.463 |
| 7 | 3.78 | 3.63 | 3.83 | 3.55 | |||||||||
| 15 | 3.81 | 3.64 | 3.97 | 3.63 | |||||||||
| Platelet distribution Width [%] | 0 | 14.24 | 14.41 | 14.19 | 14.35 | 2.91 | 0.940 | 0.004 | <0.001 | 0.581 | 0.651 | 0.003 | 0.951 |
| 7 | 14.49 | 14.13 | 14.69 | 14.20 | |||||||||
| 15 | 15.73 | 15.20 | 15.76 | 15.07 | |||||||||
| Experimental Group | p-Value | |||||||
|---|---|---|---|---|---|---|---|---|
| CONHC (n = 12) | CONLC (n = 12) | GLYHC (n = 11) | GLYLC (n = 12) | PSEM | GLY | CFP | GLY×CFP | |
| Tail DNA [%] | 22.10 | 10.56 | 7.36 | 13.23 | 1.38 | 0.034 | 0.309 | 0.003 |
| Olive tail moment | 29.81 | 8.57 | 5.36 | 11.05 | 2.15 | 0.014 | 0.077 | 0.003 |
| Experimental Group | p-Value | ||||||||||||
|---|---|---|---|---|---|---|---|---|---|---|---|---|---|
| Week | CONHC (n = 12) | CONLC (n = 12) | GLYHC (n = 11) | GLYLC (n = 12) | PSEM | GLY | CFP | t | GLY×CFP | GLY×t | CFP×t | GLY×CFP×t | |
| Stimulated R123+ [%] | 0 | 98.90 | 99.58 | 98.20 | 98.20 | 0.296 | 0.947 | 0.832 | <0.001 | 0.186 | 0.346 | 0.869 | 0.293 |
| 7 | 96.90 | 91.45 | 93.68 | 96.62 | |||||||||
| 15 | 99.59 | 99.70 | 99.30 | 99.73 | |||||||||
| Stimulated R123+ [MFI × 103] | 0 | 58.63 | 59.45 | 57.83 | 60.14 | 0.704 | 0.651 | 0.395 | <0.001 | 0.511 | 0.935 | 0.853 | 0.324 |
| 7 | 40.08 | 39.92 | 38.77 | 39.49 | |||||||||
| 15 | 55.79 | 60.27 | 58.60 | 56.26 | |||||||||
| Phagocytic PMN [%] # | 0 | 78.07 | 80.22 | 79.83 | 82.04 | 1.173 | 0.724 | 0.071 | 0.005 | 0.422 | 0.180 | 0.004 | 0.802 |
| 7 | 86.66 | 86.00 | 83.70 | 80.74 | |||||||||
| 15 | 82.13 | 74.93 | 84.99 | 73.42 | |||||||||
| Phagocytic PMN [MFI × 103] # | 0 | 81.19 | 82.38 | 81.11 | 82.00 | 1.133 | 0.590 | 0.142 | <0.001 | 0.084 | 0.789 | 0.040 | 0.165 |
| 7 | 101.52 | 75.40 | 75.15 | 83.24 | |||||||||
| 15 | 109.57 | 83.76 | 100.67 | 95.01 | |||||||||
| Experimental Group | p-Value | |||||||
|---|---|---|---|---|---|---|---|---|
| CONHC (n = 12) | CONLC (n = 12) | GLYHC (n = 11) | GLYLC (n = 12) | PSEM | GLY | CFP | GLY×CFP | |
| Early apoptotic PMN [%] | 3.72 | 4.32 | 3.2 | 6.81 | 0.62 | 0.452 | 0.114 | 0.254 |
| Late apoptotic PMN [%] | 0.65 | 0.63 | 0.88 | 0.90 | 0.08 | 0.126 | 0.990 | 0.921 |
| Early apoptotic PBMC [%] | 4.24 | 4.80 | 4.61 | 4.87 | 0.27 | 0.685 | 0.449 | 0.784 |
| Late apoptotic PBMC [%] | 4.83 | 4.84 | 5.12 | 5.40 | 0.30 | 0.476 | 0.812 | 0.816 |
| Experimental Group | p-Value | |||||||
|---|---|---|---|---|---|---|---|---|
| CONHC (n = 12) | CONLC (n = 12) | GLYHC (n = 11) | GLYLC (n = 12) | PSEM | GLY | CFP | GLY×CFP | |
| BCL2 | 0.89 | 0.82 | 0.98 | 0.94 | 0.012 | 0.042 | 0.249 | 0.669 |
| BRCA1 | 0.88 | 0.91 | 0.98 | 0.99 | 0.012 | 0.083 | 0.712 | 0.852 |
| CASP3 | 0.98 | 0.94 | 1.09 | 0.97 | 0.014 | 0.317 | 0.232 | 0.572 |
| CDKN1A | 0.81 | 0.61 | 0.76 | 0.66 | 0.016 | 0.965 | 0.010 | 0.340 |
| GADD45A | 0.71 | 0.71 | 0.80 | 0.73 | 0.016 | 0.275 | 0.568 | 0.527 |
| HSPA1A | 0.75 | 0.62 | 0.89 | 0.78 | 0.021 | 0.043 | 0.093 | 0.797 |
| NRF2 | 0.86 | 0.74 | 0.90 | 0.76 | 0.010 | 0.477 | 0.002 | 0.915 |
| OGG1 | 0.90 | 0.94 | 1.02 | 1.05 | 0.013 | 0.055 | 0.624 | 0.886 |
| PARP1 | 0.86 | 0.79 | 1.02 | 0.90 | 0.012 | 0.008 | 0.051 | 0.734 |
| RAD51 | 0.73 | 0.75 | 0.65 | 0.77 | 0.012 | 0.403 | 0.101 | 0.209 |
| SOD2 | 0.88 | 0.67 | 0.91 | 0.69 | 0.013 | 0.670 | <0.001 | 0.904 |
| TP53 | 0.88 | 0.84 | 1.09 | 1.02 | 0.013 | 0.002 | 0.394 | 0.822 |
| XRCC5 | 0.77 | 0.76 | 0.90 | 0.88 | 0.014 | 0.024 | 0.812 | 0.883 |
Disclaimer/Publisher’s Note: The statements, opinions and data contained in all publications are solely those of the individual author(s) and contributor(s) and not of MDPI and/or the editor(s). MDPI and/or the editor(s) disclaim responsibility for any injury to people or property resulting from any ideas, methods, instructions or products referred to in the content. |
© 2023 by the authors. Licensee MDPI, Basel, Switzerland. This article is an open access article distributed under the terms and conditions of the Creative Commons Attribution (CC BY) license (https://creativecommons.org/licenses/by/4.0/).
Share and Cite
Heymann, A.-K.; Schnabel, K.; Billenkamp, F.; Bühler, S.; Frahm, J.; Kersten, S.; Meyer, U.; von Soosten, D.; Dänicke, S. Influences of Glyphosate Contaminations and Concentrate Feed on Performance, Blood Parameters, Blood Cell Functionality and DNA Damage Properties in Fattening Bulls. Animals 2023, 13, 1499. https://doi.org/10.3390/ani13091499
Heymann A-K, Schnabel K, Billenkamp F, Bühler S, Frahm J, Kersten S, Meyer U, von Soosten D, Dänicke S. Influences of Glyphosate Contaminations and Concentrate Feed on Performance, Blood Parameters, Blood Cell Functionality and DNA Damage Properties in Fattening Bulls. Animals. 2023; 13(9):1499. https://doi.org/10.3390/ani13091499
Chicago/Turabian StyleHeymann, Ann-Katrin, Karina Schnabel, Fabian Billenkamp, Susanne Bühler, Jana Frahm, Susanne Kersten, Ulrich Meyer, Dirk von Soosten, and Sven Dänicke. 2023. "Influences of Glyphosate Contaminations and Concentrate Feed on Performance, Blood Parameters, Blood Cell Functionality and DNA Damage Properties in Fattening Bulls" Animals 13, no. 9: 1499. https://doi.org/10.3390/ani13091499