
Assessment of Ecological Bridges at Wildlife Crossings in Türkiye: A Case Study of Wild Boar Crossings on the Izmir-Çeşme Motorway

 ,
,  ,
,  ,
,  and
and
Abstract
:Simple Summary
Abstract
1. Introduction
- (1)
- What is the temporal distribution of wild boar crossings on the Ecological Bridge?
- (2)
- When do wild boars cross the motorway and how does the presence of the incorporated pond on the bridge affect these crossings?
- (3)
- What measures should be considered for the effective use of the wildlife crossing and the implementation of collision mitigation strategies?
2. Material and Methods
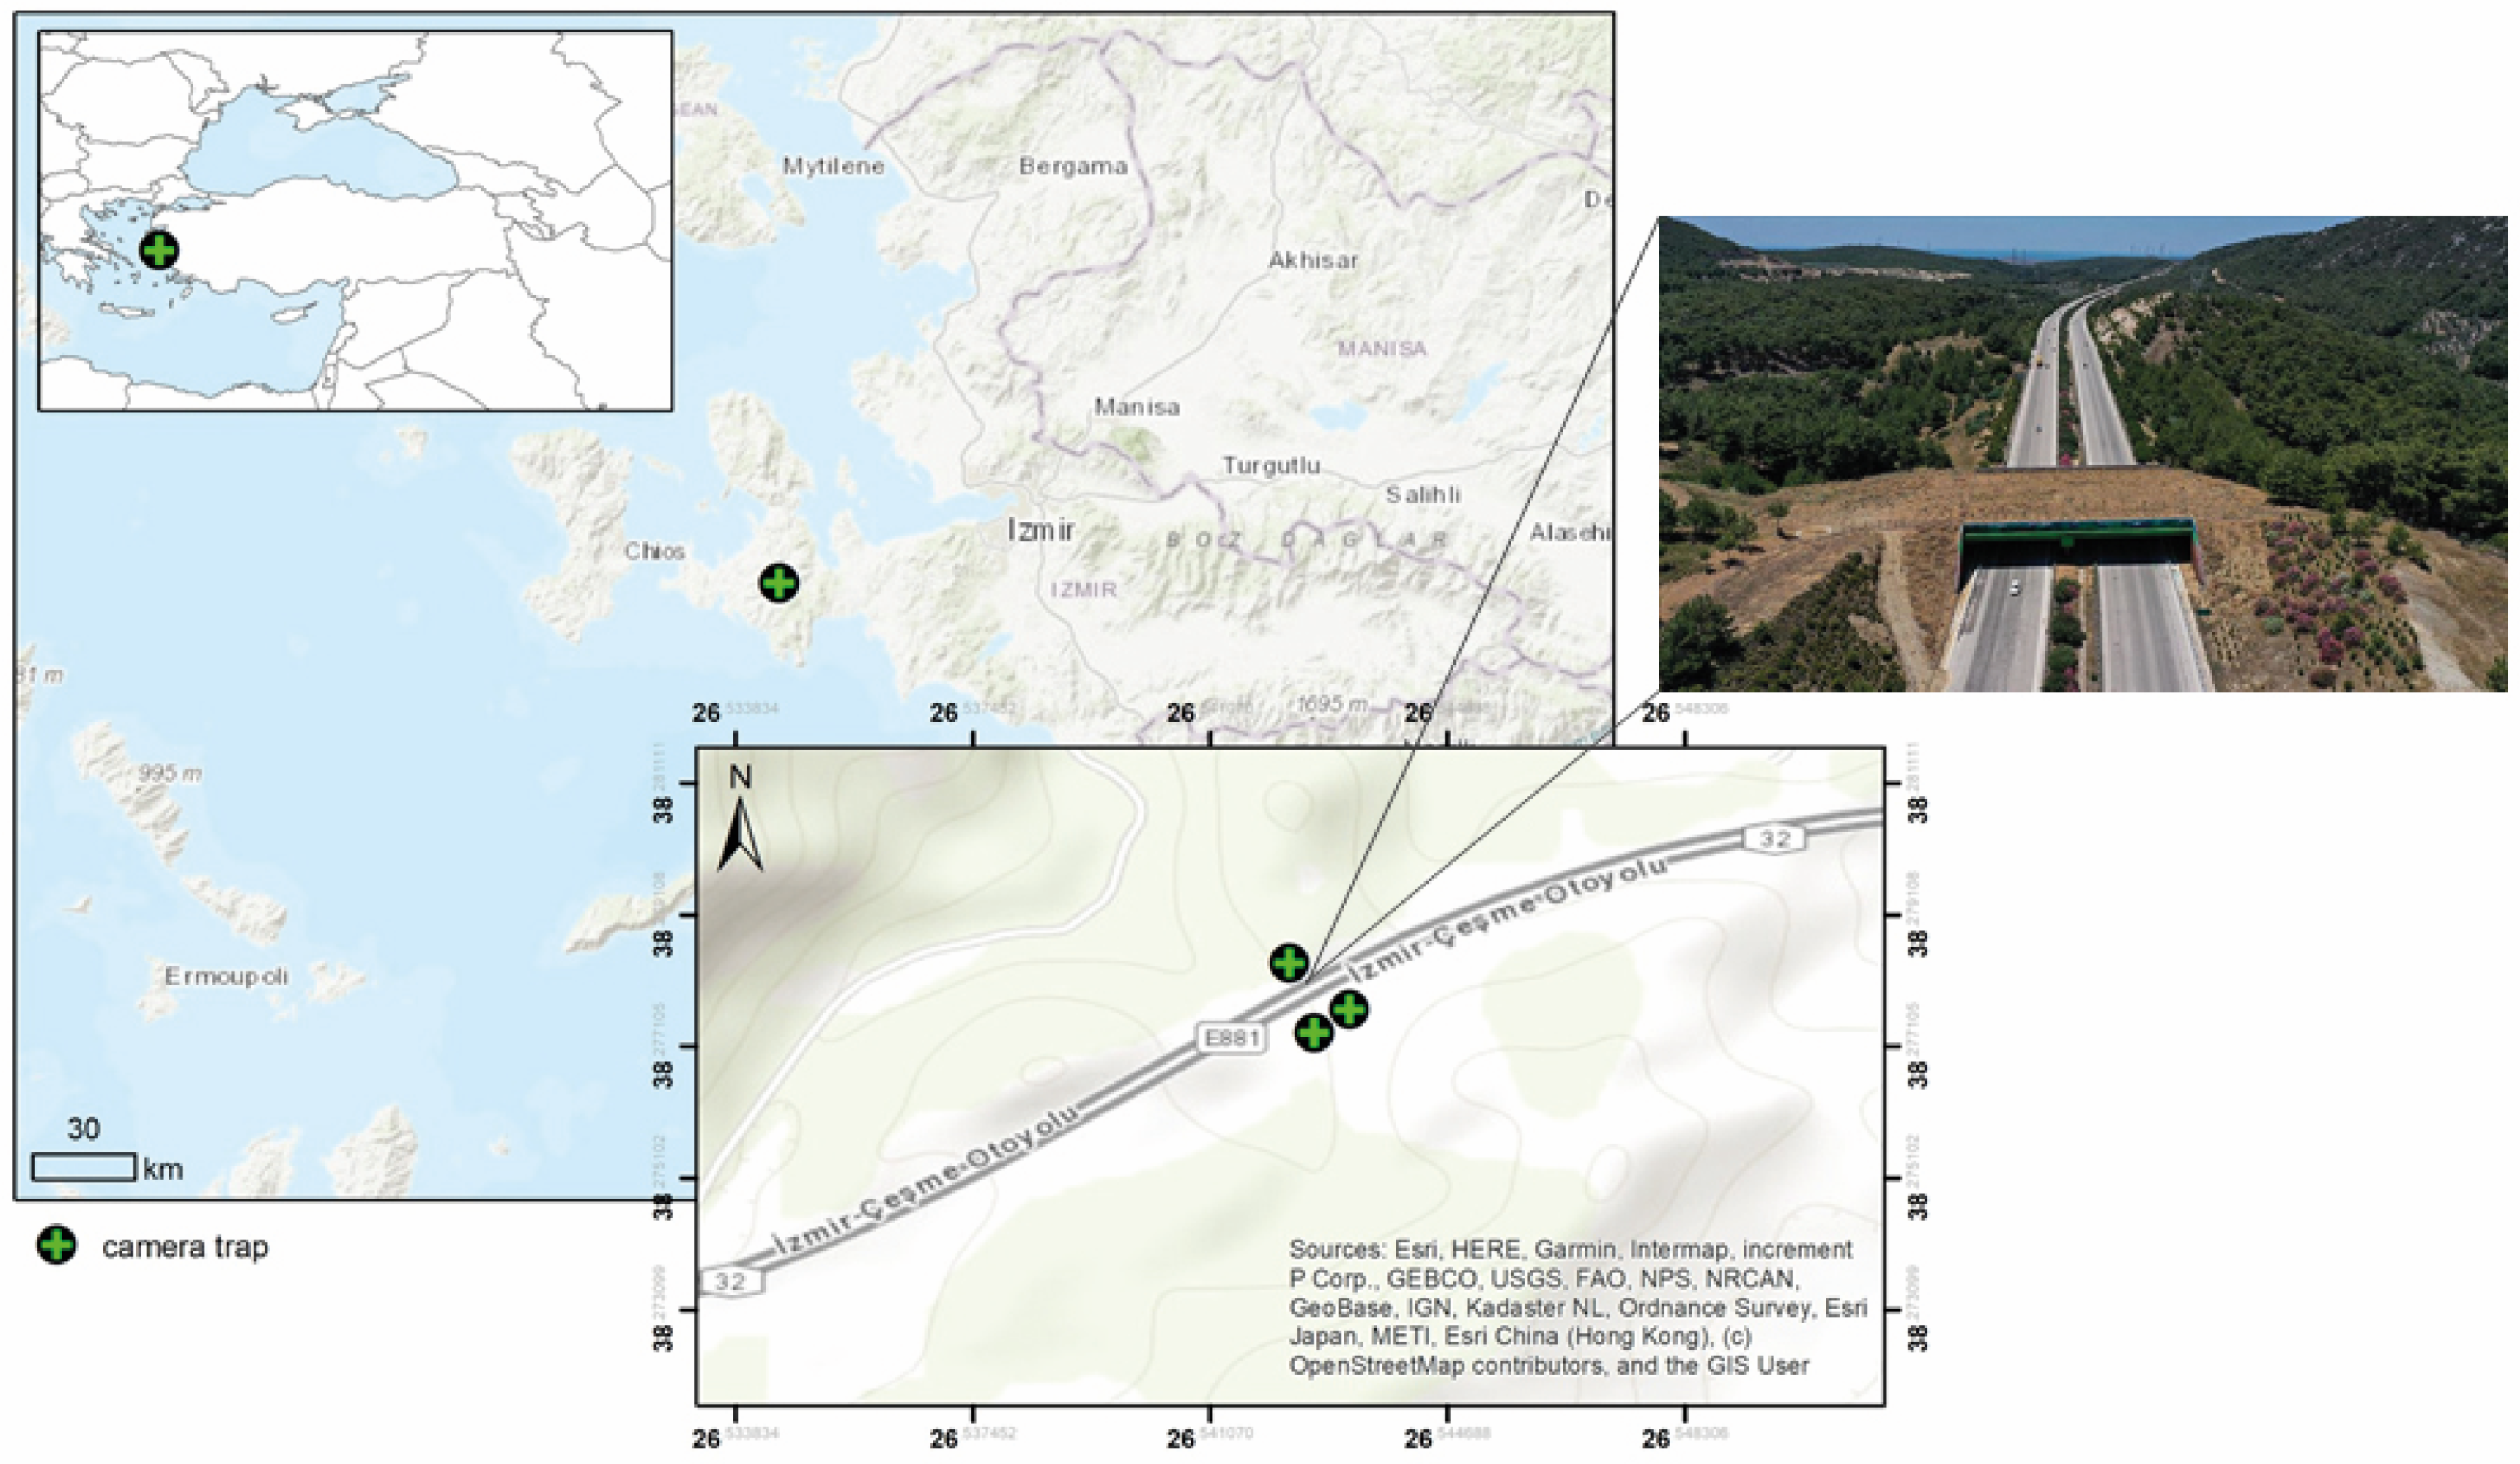
2.1. Study Area
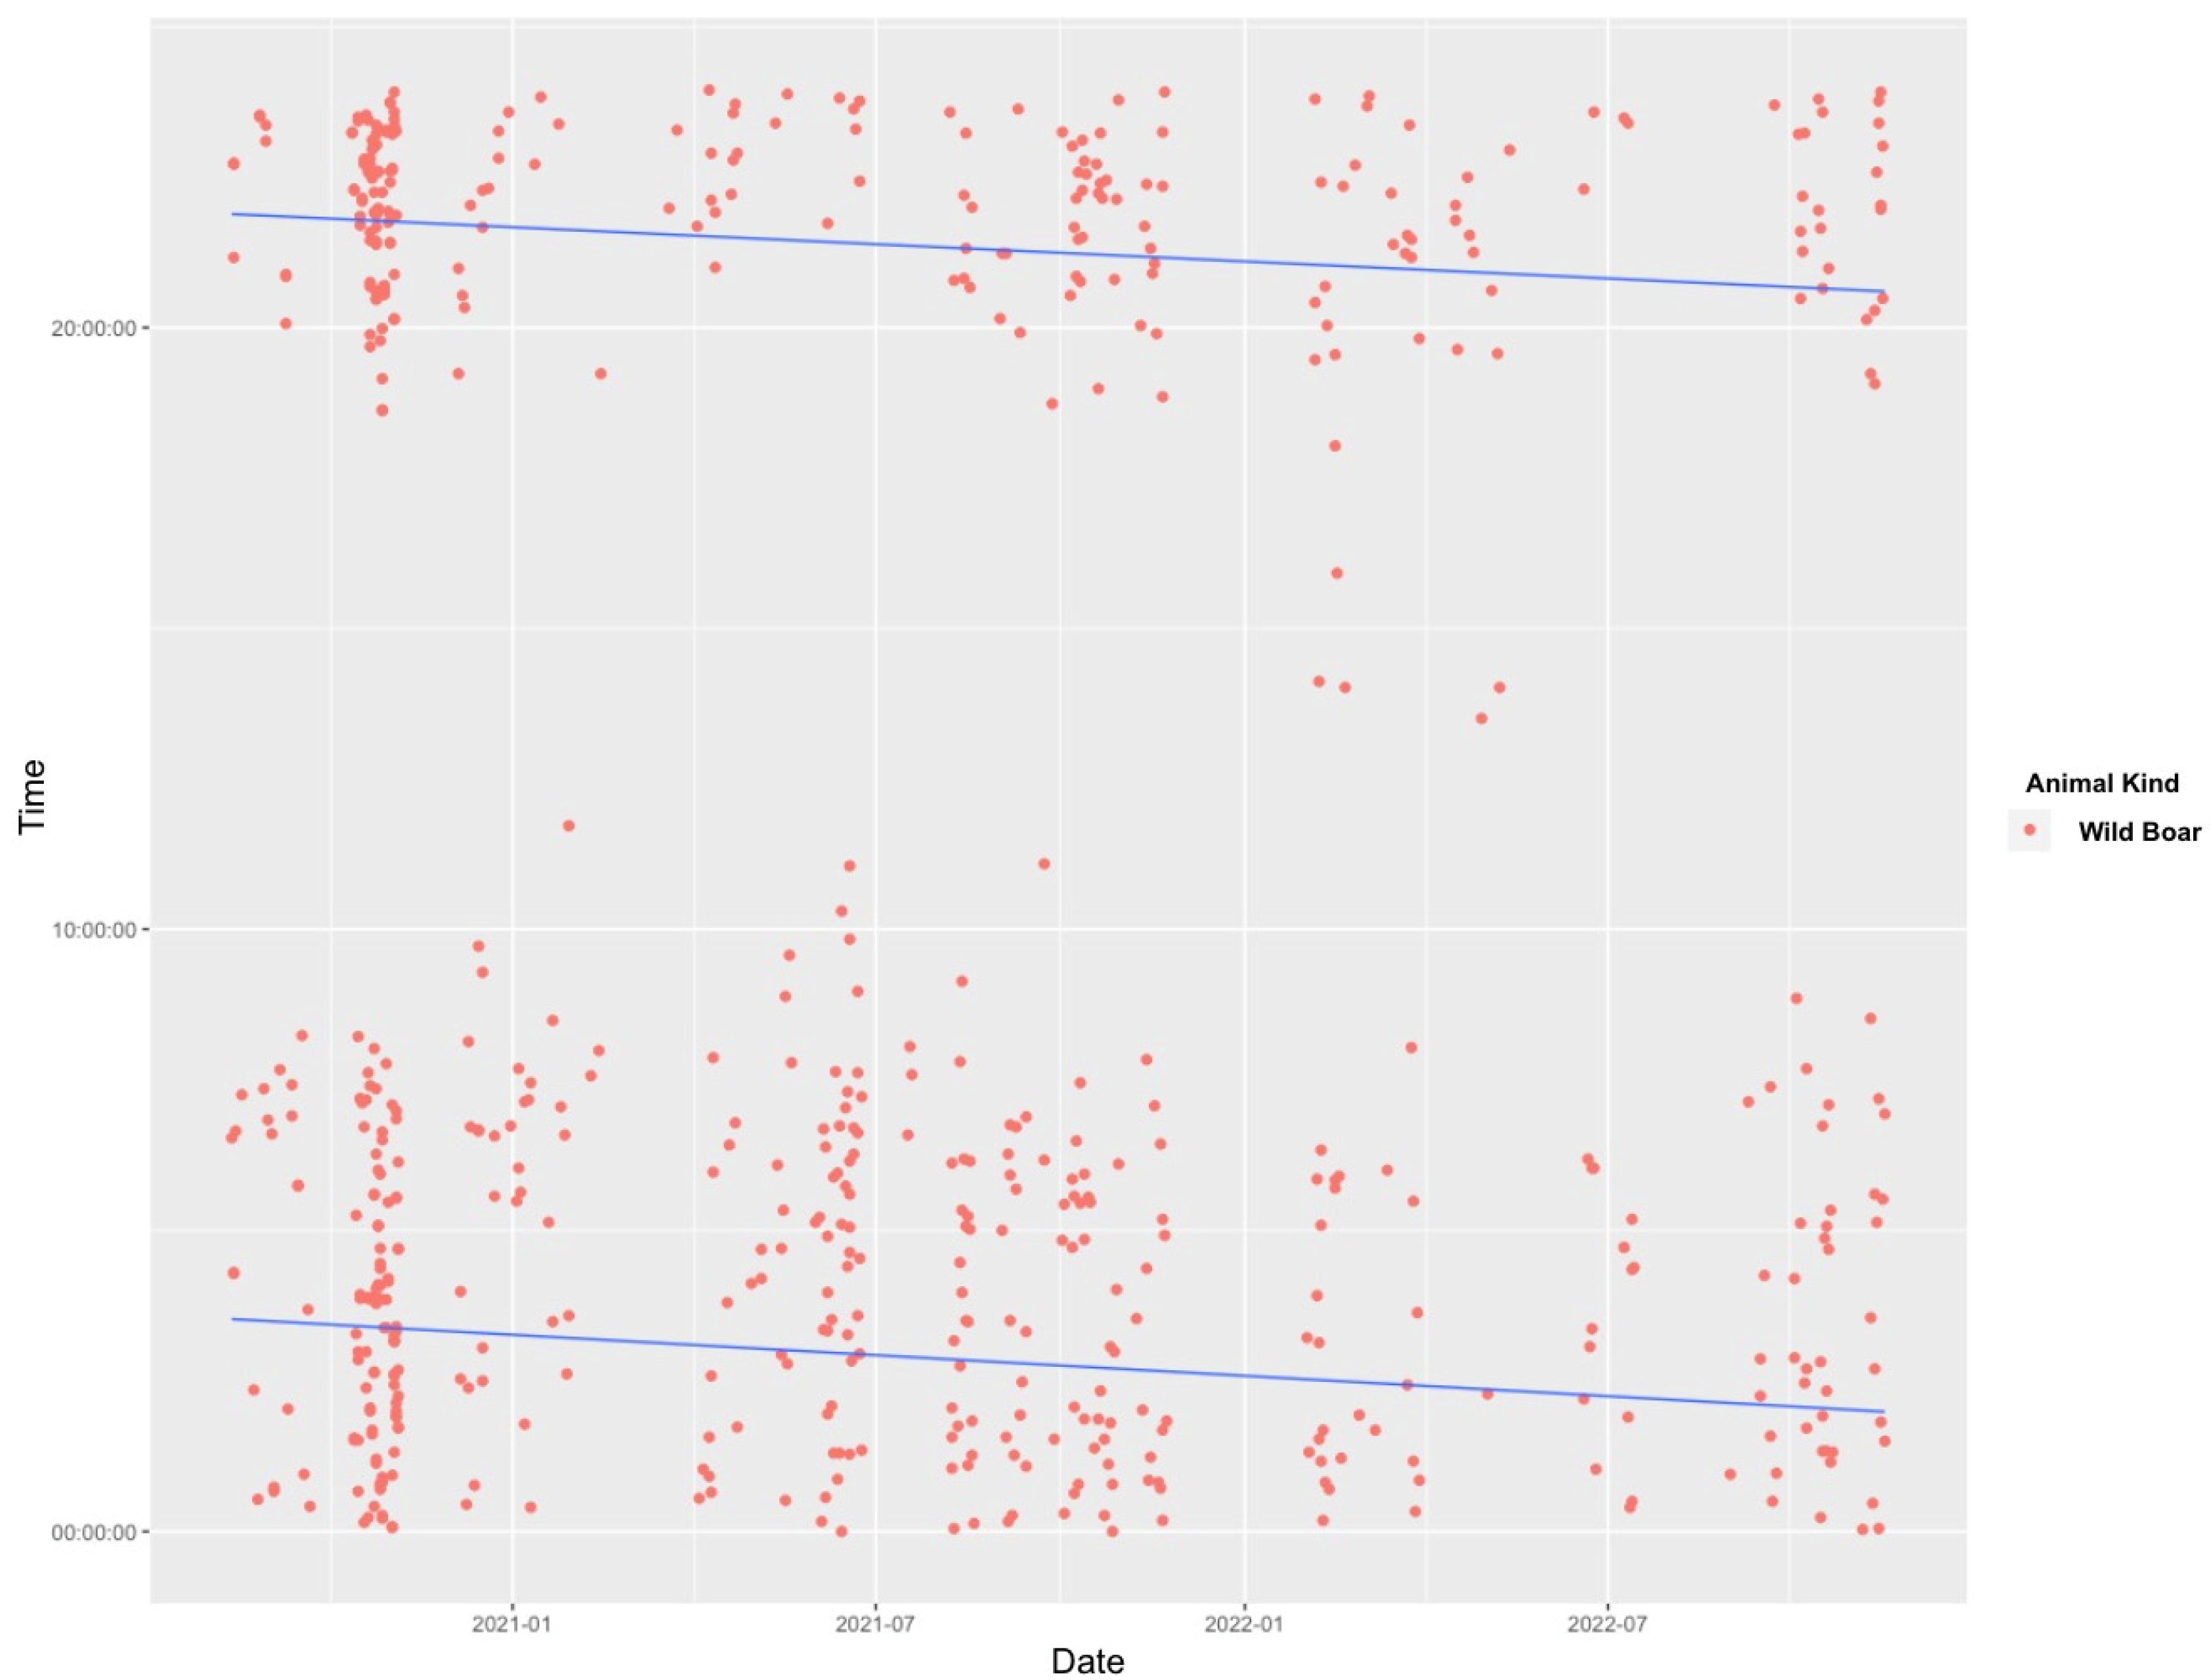
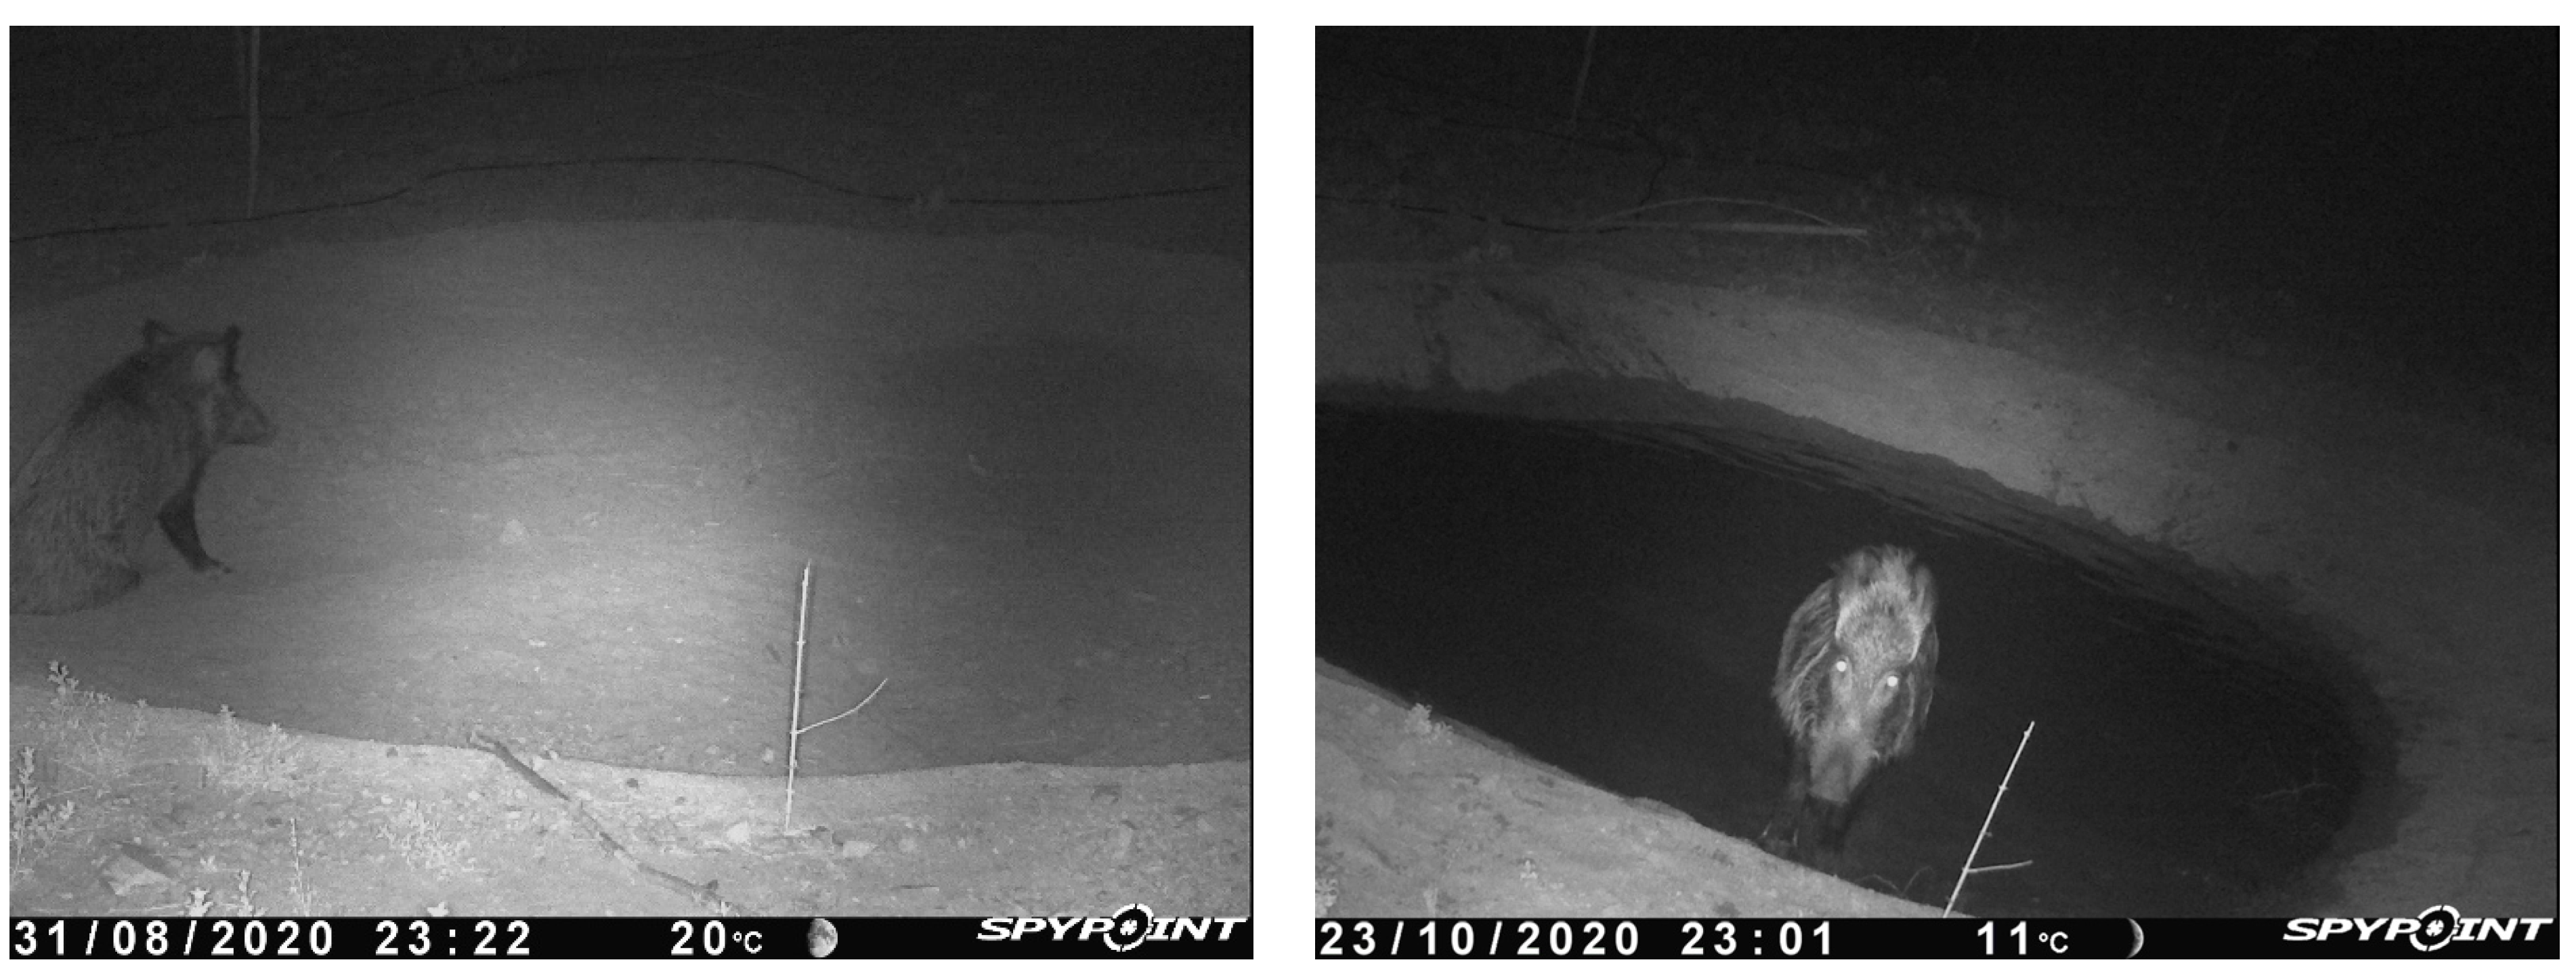
2.2. Data Collection and Statistical Analysis
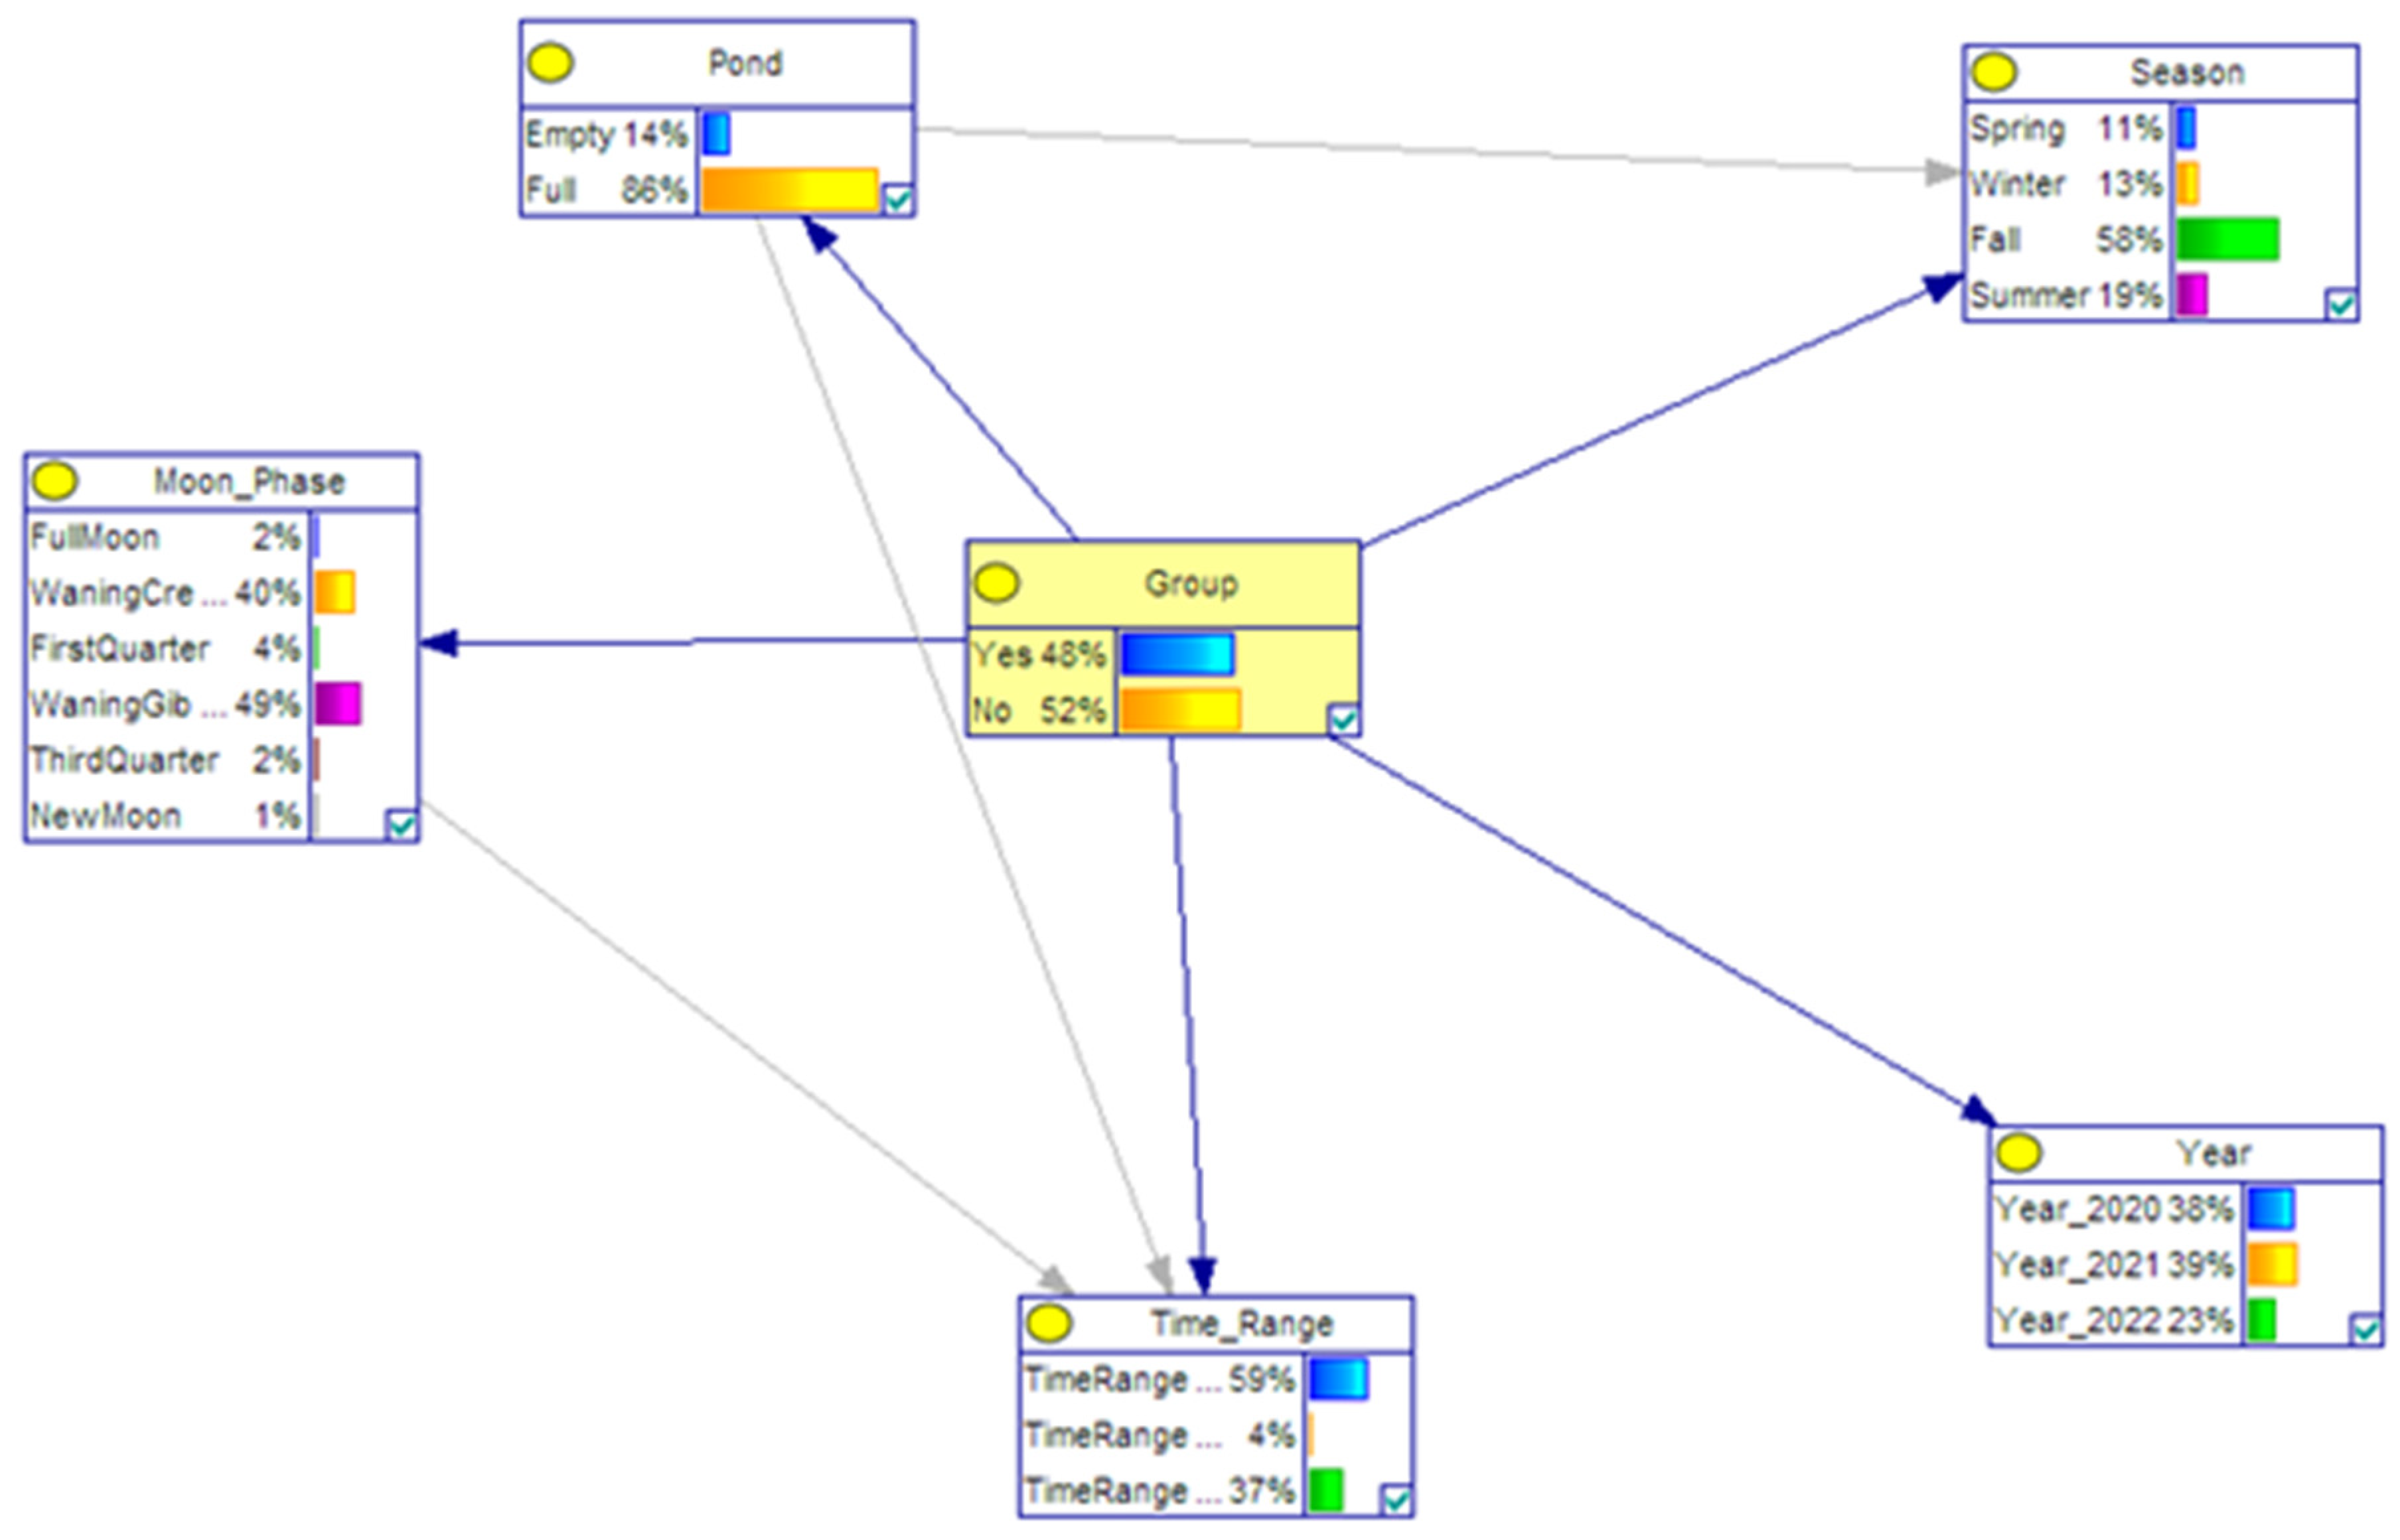
2.3. Bayesian Network Model
3. Results
4. Discussion
5. Conclusions
Author Contributions
Funding
Institutional Review Board Statement
Informed Consent Statement
Data Availability Statement
Acknowledgments
Conflicts of Interest
References
- Forman, R.T.T.; Alexander, L.E. Roads and Their Major Ecological Effects. Annu. Rev. Ecol. Syst. 1998, 29, 207–231. [Google Scholar] [CrossRef]
- Shanley, C.S.; Pyare, S. Evaluating the Road-Effect Zone on Wildlife Distribution in a Rural Landscape. Ecosphere 2011, 2, art16. [Google Scholar] [CrossRef]
- Fahrig, L.; Rytwinski, T. Effects of Roads on Animal Abundance: An Empirical Review and Synthesis. Ecol. Soc. 2009, 14, 20. [Google Scholar] [CrossRef]
- Taylor, B.D.; Goldingay, R.L. Roads and Wildlife: Impacts, Mitigation and Implications for Wildlife Management in Australia. Wildl. Res. 2010, 37, 320–331. [Google Scholar] [CrossRef]
- Özcan, A.U.; Kutlutürk, M.M.; Kuter, S. Modelling of Road-Kill Hotspots in Steppe Landscape in Turkey. Landsc. Ecol. Eng. 2022, 18, 441–449. [Google Scholar] [CrossRef]
- Coulon, A.; Cosson, J.F.; Angibault, J.M.; Cargnelutti, B.; Galan, M.; Morellet, N.; Petit, E.; Aulagnier, S.; Hewison, A.J.M. Landscape Connectivity Influences Gene Flow in a Roe Deer Population Inhabiting a Fragmented Landscape: An Individual–Based Approach. Mol. Ecol. 2004, 13, 2841–2850. [Google Scholar] [CrossRef] [PubMed]
- Epps, C.W.; Palsbøll, P.J.; Wehausen, J.D.; Roderick, G.K.; Ramey II, R.R.; McCullough, D.R. Highways Block Gene Flow and Cause a Rapid Decline in Genetic Diversity of Desert Bighorn Sheep. Ecol. Lett. 2005, 8, 1029–1038. [Google Scholar] [CrossRef]
- Seiler, A.; Helldin, J.-O.; Seiler, C. Road Mortality in Swedish Mammals: Results of a Drivers’ Questionnaire. Wildl. Biol. 2004, 10, 225–233. [Google Scholar] [CrossRef]
- Battisti, C.; Amori, G.; De Felici, S.; Luiselli, L.; Zapparoli, M. Mammal Road-Killing from a Mediterranean Area in Central Italy: Evidence from an Atlas Dataset. Rend. Fis. Acc. Lincei 2012, 23, 217–223. [Google Scholar] [CrossRef]
- Hanski, I. Metapopulation Dynamics. Nature 1998, 396, 41–49. [Google Scholar] [CrossRef]
- Lindenmayer, D.B.; Fischer, J. Habitat Fragmentation and Landscape Change: An Ecological and Conservation Synthesis; Island Press: Washington, DC, USA, 2013; ISBN 978-1-59726-606-2. [Google Scholar]
- Dennis, R.L.H.; Dapporto, L.; Dover, J.W.; Shreeve, T.G. Corridors and Barriers in Biodiversity Conservation: A Novel Resource-Based Habitat Perspective for Butterflies. Biodivers. Conserv. 2013, 22, 2709–2734. [Google Scholar] [CrossRef]
- Bennett, A.F. Habitat Linkages: A Key Element in an Integrated Landscape Approach to Conservation. Parks 1997, 7, 43–49. [Google Scholar]
- Lima, S.L.; Blackwell, B.F.; DeVault, T.L.; Fernández-Juricic, E. Animal Reactions to Oncoming Vehicles: A Conceptual Review. Biol. Rev. 2015, 90, 60–76. [Google Scholar] [CrossRef]
- De Freitas, S.R.; Barszcz, L.B. The Online Media Perspective on Animal and Vehicle Accidents in Brazilian Highways: A Matter of Safety? Desenvolv. E Meio. Ambiente 2015, 33, 261–276. [Google Scholar]
- Forman, R.T.T.; Deblinger, R.D. The Ecological Road-Effect Zone of a Massachusetts (U.S.A.) Suburban Highway. Conserv. Biol. 2000, 14, 36–46. [Google Scholar] [CrossRef]
- Boarman, W.I.; Sazaki, M. A Highway’s Road-Effect Zone for Desert Tortoises (Gopherus Agassizii). J. Arid. Environ. 2006, 65, 94–101. [Google Scholar] [CrossRef]
- Eigenbrod, F.; Hecnar, S.J.; Fahrig, L. Quantifying the Road-Effect Zone: Threshold Effects of a Motorway on Anuran Populations in Ontario, Canada. Ecol. Soc. 2009, 14, 18. [Google Scholar] [CrossRef]
- Helldin, J.O.; Seiler, A. Effects of Roads on the Abundance of Birds in Swedish Forest and Farmland. Wildl. Biol. 2003, 6, 111–120. [Google Scholar] [CrossRef]
- Forman, R.T. Road Ecology: Science and Solutions; Island Press: Washington, DC, USA, 2003; ISBN 1-55963-933-4. [Google Scholar]
- Zevgolis, Y.G.; Kouris, A.; Christopoulos, A. Spatiotemporal Patterns and Road Mortality Hotspots of Herpetofauna on a Mediterranean Island. Diversity 2023, 15, 478. [Google Scholar] [CrossRef]
- Clevenger, A.P.; Huijser, M.P. Wildlife Crossing Structure Handbook: Design and Evaluation in North America; United States. Federal Highway Administration. Central Federal Lands Highway Division: Washington, DC, USA, 2011. [Google Scholar]
- Danks, Z.D.; Porter, W.F. Temporal, Spatial, and Landscape Habitat Characteristics of Moose—Vehicle Collisions in Western Maine. J. Wildl. Manag. 2010, 74, 1229–1241. [Google Scholar] [CrossRef]
- Ramp, D.; Caldwell, J.; Edwards, K.A.; Warton, D.; Croft, D.B. Modelling of Wildlife Fatality Hotspots along the Snowy Mountain Highway in New South Wales, Australia. Biol. Conserv. 2005, 126, 474–490. [Google Scholar] [CrossRef]
- Özcan, A.U.; Özkazanç, N.K. Yaban Hayvanı Uyarı Levhalarının Konumlarının Değerlendirilmesi Kırıkkale-Çankırı Karayolu Örneği. Bartın Orman. Fakültesi Derg. 2020, 22, 208–221. [Google Scholar] [CrossRef]
- Barrientos, R.; Bolonio, L. The Presence of Rabbits Adjacent to Roads Increases Polecat Road Mortality. Biodivers. Conserv. 2009, 18, 405–418. [Google Scholar] [CrossRef]
- Gunson, K.E.; Mountrakis, G.; Quackenbush, L.J. Spatial Wildlife-Vehicle Collision Models: A Review of Current Work and Its Application to Transportation Mitigation Projects. J. Environ. Manag. 2011, 92, 1074–1082. [Google Scholar] [CrossRef] [PubMed]
- Özcan, A.U. Step Bölgede Mammalia Sınıfı Yaban Hayvanları Ile Araç Çarpışmalarının Modellenmesi: Kırıkkale-Çankırı Karayolu Örneği. Doctoral Thesis, Bartın Üniversitesi, Fen Bilimleri Enstitüsü, Bartın, Turkey, 2018. [Google Scholar]
- Fahrig, L.; Pedlar, J.H.; Pope, S.E.; Taylor, P.D.; Wegner, J.F. Effect of Road Traffic on Amphibian Density. Biol. Conserv. 1995, 73, 177–182. [Google Scholar] [CrossRef]
- Seiler, A. Predicting Locations of Moose–Vehicle Collisions in Sweden. J. Appl. Ecol. 2005, 42, 371–382. [Google Scholar] [CrossRef]
- Iuell, B. Wildlife and Traffic-a European Handbook for Identifying Conflicts and Designing Solutions. In Proceedings of the XXIInd PIARC World Road Congress, Durban, South Africa, 19–25 October 2003. [Google Scholar]
- Clevenger, A.P.; Ford, A.T. Wildlife Crossing Structures, Fencing, and Other Highway Design Considerations; Island Press: Washington, DC, USA, 2010; Volume 424. [Google Scholar]
- Huijser, M.P.; McGowan, P.; Clevenger, A.P.; Ament, R. Wildlife-Vehicle Collision Reduction Study: Best Practices Manual: Report to Congress; Western Transportation Institute: Bozeman, MT, USA; Louis Berger, Inc.: Morristown, NJ, USA; Island Press: Washington, DC, USA, 2008. [Google Scholar]
- Sawyer, H.; Lebeau, C.; Hart, T. Mitigating Roadway Impacts to Migratory Mule Deer—A Case Study with Underpasses and Continuous Fencing. Wildl. Soc. Bull. 2012, 36, 492–498. [Google Scholar] [CrossRef]
- Huijser, M.P.; Fairbank, E.R.; Camel-Means, W.; Graham, J.; Watson, V.; Basting, P.; Becker, D. Effectiveness of Short Sections of Wildlife Fencing and Crossing Structures along Highways in Reducing Wildlife–Vehicle Collisions and Providing Safe Crossing Opportunities for Large Mammals. Biol. Conserv. 2016, 197, 61–68. [Google Scholar] [CrossRef]
- Glista, D.J.; DeVault, T.L.; DeWoody, J.A. A Review of Mitigation Measures for Reducing Wildlife Mortality on Roadways. Landsc. Urban. Plan. 2009, 91, 1–7. [Google Scholar] [CrossRef]
- Soykan, F.; Sezer, L.; Işık, Ş. Karaburun Yarımadası’nın Doğal Özellikleri, Tarihsel Coğrafyası ve Turizm Potansiyeli. Ege Üniversitesi Araştırma Fon. Saymanlığı 1989, 444. [Google Scholar]
- Bekat, L. Karaburun Akdağ çevresinin flora ve vejetasyonu. Master Thesis, Ege Üniversitesi, Fen Bilimleri Enstitüsü, İzmir, Turkey, 1980. [Google Scholar]
- Günal, N. Gediz-Büyük Menderes Arasındaki Sahanın Bitki Coğrafyası; İstanbul Üniversitesi Deniz Bilimleri ve Coğrafya Enstitüsü: İstanbul, Turkey, 1986. [Google Scholar]
- Sezer, I. Karaburun Yarımadasının Fiziki Coğrafyası. Basılmamış. Doctoral Thesis, Ege Üniversitesi Sosyal Bilimler Enstitüsü, Coğrafya Anabilim Dalı, İzmir, Turkey, 1993. [Google Scholar]
- Turkish Statistical Institute Address-Based Population Registration System Results. Available online: https://data.tuik.gov.tr/Bulten/Index?p=49685 (accessed on 21 November 2023).
- Çeşme District Governorate Nüfus Durumu. Available online: http://www.cesme.gov.tr/nufus-durumu (accessed on 21 November 2023).
- Yılmaz, E.; Çiçek, İ. Türkiye’de Köppen-Geiger İklim Tiplerindeki Zamanmekansal Değişimler. DTCF J. 2019, 59, 181–202. [Google Scholar] [CrossRef]
- Hepcan, Ş.; Hepcan, Ç.C.; Bouwma, I.M.; Jongman, R.H.G.; Özkan, M.B. Ecological Networks as a New Approach for Nature Conservation in Turkey: A Case Study of İzmir Province. Landsc. Urban. Plan. 2009, 90, 143–154. [Google Scholar] [CrossRef]
- Hepcan, Ş.; Hepcan, Ç.C.; Koçman, A.; Özkan, M.B.; Can, Ö.E. Yaban Hayatı Koruma Bağlamında Karakulak (Caracal Caracal) İçin İzmir İli Örneğinde Habitat Ağları Oluşturulması Üzerine Bir Araştırma. JOTAF 2013, 10, 29–39. [Google Scholar]
- Bowkett, A.E.; Rovero, F.; Marshall, A.R. The Use of Camera-Trap Data to Model Habitat Use by Antelope Species in the Udzungwa Mountain Forests, Tanzania. Afr. J. Ecol. 2008, 46, 479–487. [Google Scholar] [CrossRef]
- Rovero, F.; Marshall, A.R. Camera Trapping Photographic Rate as an Index of Density in Forest Ungulates. J. Appl. Ecol. 2009, 46, 1011–1017. [Google Scholar] [CrossRef]
- Scutari, M. Learning Bayesian Networks with the Bnlearn R Package. arXiv 2009, arXiv:0908.3817. [Google Scholar]
- Wickham, H. Ggplot2. WIREs Comput. Stat. 2011, 3, 180–185. [Google Scholar] [CrossRef]
- R Core Team. R: The R Project for Statistical Computing. Available online: https://www.r-project.org/ (accessed on 21 November 2023).
- Friedman, N.; Nachman, I.; Pe’er, D. Learning Bayesian Network Structure from Massive Datasets: The “Sparse Candidate” Algorithm 2013. arXiv 2013, arXiv:1301.6696. [Google Scholar]
- Ediş, S.; Ulaş, E. Using Bayesian Network to predict the watershed land use type of Çankırı Acıçay-Tatlıçay. Turk. J. For. 2017, 18, 212–218. [Google Scholar] [CrossRef]
- Pearl, J. Probabilistic Reasoning in Intelligent Systems: Networks of Plausible Inference; Morgan kaufmann: Cambridge, MA, USA, 1988; ISBN 1-55860-479-0. [Google Scholar]
- Fuster-Parra, P.; García-Mas, A.; Ponseti, F.J.; Leo, F.M. Team Performance and Collective Efficacy in the Dynamic Psychology of Competitive Team: A Bayesian Network Analysis. Hum. Mov. Sci. 2015, 40, 98–118. [Google Scholar] [CrossRef]
- Lauritzen, S.L. Propagation of Probabilities, Means, and Variances in Mixed Graphical Association Models. J. Am. Stat. Assoc. 1992, 87, 1098–1108. [Google Scholar] [CrossRef]
- Pan, J.; Rao, H.; Zhang, X.; Li, W.; Wei, Z.; Zhang, Z.; Ren, H.; Song, W.; Hou, Y.; Qiu, L. Application of a Tabu Search-Based Bayesian Network in Identifying Factors Related to Hypertension. Medicine 2019, 98, e16058. [Google Scholar] [CrossRef] [PubMed]
- Newell, R.; Dale, A.; Lister, N.-M. An Integrated Climate-Biodiversity Framework to Improve Planning and Policy: An Application to Wildlife Crossings and Landscape Connectivity. Ecol. Soc. 2022, 27, 23. [Google Scholar] [CrossRef]
- Baskin, L.; Danell, K. Ecology of Ungulates: A Handbook of Species in Eastern Europe and Northern and Central Asia; Springer Science & Business Media: Berlin/Heidelberg, Germany, 2003; ISBN 3-540-43804-1. [Google Scholar]
- Baubet, E.; Bonenfant, C.; Brandt, S. Diet of the Wild Boar in the French Alps. Galemys 2004, 16, 101–113. [Google Scholar]
- Rosell, C.; Fernández-Llario, P.; Herrero, J. El Jabalí (Sus Scrofa Linnaeus, 1758). Galemys 2001, 13, 1–25. [Google Scholar]
- Cukor, J.; Linda, R.; Mahlerová, K.; Vacek, Z.; Faltusová, M.; Marada, P.; Havránek, F.; Hart, V. Different Patterns of Human Activities in Nature during Covid-19 Pandemic and African Swine Fever Outbreak Confirm Direct Impact on Wildlife Disruption. Sci. Rep. 2021, 11, 20791. [Google Scholar] [CrossRef] [PubMed]
- Rupani, P.F.; Nilashi, M.; Abumalloh, R.A.; Asadi, S.; Samad, S.; Wang, S. Coronavirus Pandemic (COVID-19) and Its Natural Environmental Impacts. Int. J. Environ. Sci. Technol. 2020, 17, 4655–4666. [Google Scholar] [CrossRef] [PubMed]
- Morelle, K.; Lehaire, F.; Lejeune, P. Is Wild Boar Heading towards Movement Ecology? A Review of Trends and Gaps. Wildl. Biol. 2014, 20, 196–205. [Google Scholar] [CrossRef]
- Tolon, V.; Dray, S.; Loison, A.; Zeileis, A.; Fischer, C.; Baubet, E. Responding to Spatial and Temporal Variations in Predation Risk: Space Use of a Game Species in a Changing Landscape of Fear. Can. J. Zool. 2009, 87, 1129–1137. [Google Scholar] [CrossRef]
- Thurfjell, H.; Ball, J.P.; Åhlén, P.-A.; Kornacher, P.; Dettki, H.; Sjöberg, K. Habitat Use and Spatial Patterns of Wild Boar Sus Scrofa (L.): Agricultural Fields and Edges. Eur. J. Wildl. Res. 2009, 55, 517–523. [Google Scholar] [CrossRef]
- Lagos, L.; Picos, J.; Valero, E. Temporal Pattern of Wild Ungulate-Related Traffic Accidents in Northwest Spain. Eur. J. Wildl. Res. 2012, 58, 661–668. [Google Scholar] [CrossRef]
- Mori, E.; Bagnato, S.; Serroni, P.; Sangiuliano, A.; Rotondaro, F.; Marchianò, V.; Cascini, V.; Poerio, L.; Ferretti, F. Spatiotemporal Mechanisms of Coexistence in an European Mammal Community in a Protected Area of Southern Italy. J. Zool. 2020, 310, 232–245. [Google Scholar] [CrossRef]
- Brivio, F.; Grignolio, S.; Brogi, R.; Benazzi, M.; Bertolucci, C.; Apollonio, M. An Analysis of Intrinsic and Extrinsic Factors Affecting the Activity of a Nocturnal Species: The Wild Boar. Mamm. Biol. 2017, 84, 73–81. [Google Scholar] [CrossRef]
- Cahill, S.; Llimona, F.; Gràcia, J. Spacing and Nocturnal Activity of Wild Boar Sus Scrofa in a Mediterranean Metropolitan Park. Wildl. Biol. 2003, 9, 3–13. [Google Scholar] [CrossRef]
- Lemel, J.; Truvé, J.; Söderberg, B. Variation in Ranging and Activity Behaviour of European Wild Boar Sus Scrofa in Sweden. Wildl. Biol. 2003, 9, 29–36. [Google Scholar] [CrossRef]
- Wang, Y.; Guan, L.; Piao, Z.; Wang, Z.; Kong, Y. Monitoring Wildlife Crossing Structures along Highways in Changbai Mountain, China. Transp. Res. Part. D Transp. Environ. 2017, 50, 119–128. [Google Scholar] [CrossRef]
- Nekaris, K.A.I.; Handby, V.; Campera, M. Impact of Weather Conditions, Seasonality and Moonlight on the Use of Artificial Canopy Bridges by Nocturnal Arboreal Mammals. Biodivers. Conserv. 2021, 30, 3633–3645. [Google Scholar] [CrossRef]
- Lashley, M.A.; Chitwood, M.C.; Biggerstaff, M.T.; Morina, D.L.; Moorman, C.E.; DePerno, C.S. White-Tailed Deer Vigilance: The Influence of Social and Environmental Factors. PLoS ONE 2014, 9, e90652. [Google Scholar] [CrossRef]
- Sullivan, J.M. Trends and Characteristics of Animal-Vehicle Collisions in the United States. J. Saf. Res. 2011, 42, 9–16. [Google Scholar] [CrossRef]
- Gordigiani, L.; Viviano, A.; Brivio, F.; Grignolio, S.; Lazzeri, L.; Marcon, A.; Mori, E. Carried Away by a Moonlight Shadow: Activity of Wild Boar in Relation to Nocturnal Light Intensity. Mamm. Res. 2022, 67, 39–49. [Google Scholar] [CrossRef]
- Gaudiano, L.; Pucciarelli, L.; Frassanito, A.G.; Mori, E.; Morimando, F.; Silvestri, F.M.; Sorino, R.; Viviano, A.; Corriero, G. Spatio-Temporal Behaviour of Female Wild Boar in an Agro-Forestry–Pastoral Landscape of Southern Italy. Mamm. Res. 2022, 67, 163–172. [Google Scholar] [CrossRef]
- Coulson, G.M. Road-Kills of Macropds on a Section of Highway in Central Victoria. Wildl. Res. 1982, 9, 21–26. [Google Scholar] [CrossRef]
- Colino-Rabanal, V.J.; Langen, T.A.; Peris, S.J.; Lizana, M. Ungulate: Vehicle Collision Rates Are Associated with the Phase of the Moon. Biodivers. Conserv. 2018, 27, 681–694. [Google Scholar] [CrossRef]
- Doherty, T.S.; Fist, C.N.; Driscoll, D.A. Animal Movement Varies with Resource Availability, Landscape Configuration and Body Size: A Conceptual Model and Empirical Example. Landsc. Ecol. 2019, 34, 603–614. [Google Scholar] [CrossRef]
- Moorcroft, P.R.; Lewis, M.A.; Crabtree, R.L. Mechanistic Home Range Models Capture Spatial Patterns and Dynamics of Coyote Territories in Yellowstone. Proc. R. Soc. B Biol. Sci. 2006, 273, 1651–1659. [Google Scholar] [CrossRef] [PubMed]
- McCune, B.; Mefford, M.J. PC-ORD: Multivariate Analysis of Ecological Data; Version 4 for Windows; User’s Guide; MjM Software Design: Cleveland, OH, USA, 1999. [Google Scholar]
- Battisti, C. Unifying the Trans-Disciplinary Arsenal of Project Management Tools in a Single Logical Framework: Further Suggestion for IUCN Project Cycle Development. J. Nat. Conserv. 2018, 41, 63–72. [Google Scholar] [CrossRef]
- Sijtsma, F.J.; van der Veen, E.; van Hinsberg, A.; Pouwels, R.; Bekker, R.; van Dijk, R.E.; Grutters, M.; Klaassen, R.; Krijn, M.; Mouissie, M.; et al. Ecological Impact and Cost-Effectiveness of Wildlife Crossings in a Highly Fragmented Landscape: A Multi-Method Approach. Landsc. Ecol. 2020, 35, 1701–1720. [Google Scholar] [CrossRef]
- Hassall, C. The Ecology and Biodiversity of Urban Ponds. WIREs Water 2014, 1, 187–206. [Google Scholar] [CrossRef]
- Ruiz-Fons, F.; Segalés, J.; Gortázar, C. A Review of Viral Diseases of the European Wild Boar: Effects of Population Dynamics and Reservoir Rôle. Vet. J. 2008, 176, 158–169. [Google Scholar] [CrossRef]

| Variable | Description | Categories |
|---|---|---|
| Group | Herd crossings were categorized as “yes” and individual crossings as “no”. | Yes |
| No | ||
| Pond | If there is water in the pond, it is categorized as “full”, and if there is no water, it is categorized as “empty”. | Empty |
| Full | ||
| Season | The 4 different seasons (fall, winter, spring, summer) in Türkiye are categorized. | Spring |
| Winter | ||
| Fall | ||
| Summer | ||
| Year | The three different years in the dataset categorized as 2020, 2021, and 2022. | 2020 |
| 2021 | ||
| 2022 | ||
| Time Range | Three different time ranges based on the wild boar crossing are categorized. | 00.00–08.00 (Time_Range1) |
| 08.00–16.00 (Time_Range2) | ||
| 16.00–00.00 (Time_Range3) | ||
| Moon Phase | Six different phases of the moon are categorized according to dataset. | Full Moon |
| Waning Crescent | ||
| First Quarter | ||
| Waning Gibbous | ||
| Third Quarter | ||
| New Moon |
| Moon’s Phase | Frequency of Crossing | Percentage | Cumulative P. |
|---|---|---|---|
| New Moon | 6 | 1.0 | 1.0 |
| Waning Crescent | 247 | 42.2 | 43.2 |
| First Quarter | 25 | 4.3 | 47.4 |
| Waning Gibbous | 280 | 47.8 | 95.2 |
| Full Moon | 15 | 2.6 | 97.8 |
| Third Quarter | 13 | 2.2 | 100.0 |
| Total | 586 | 100.0 |
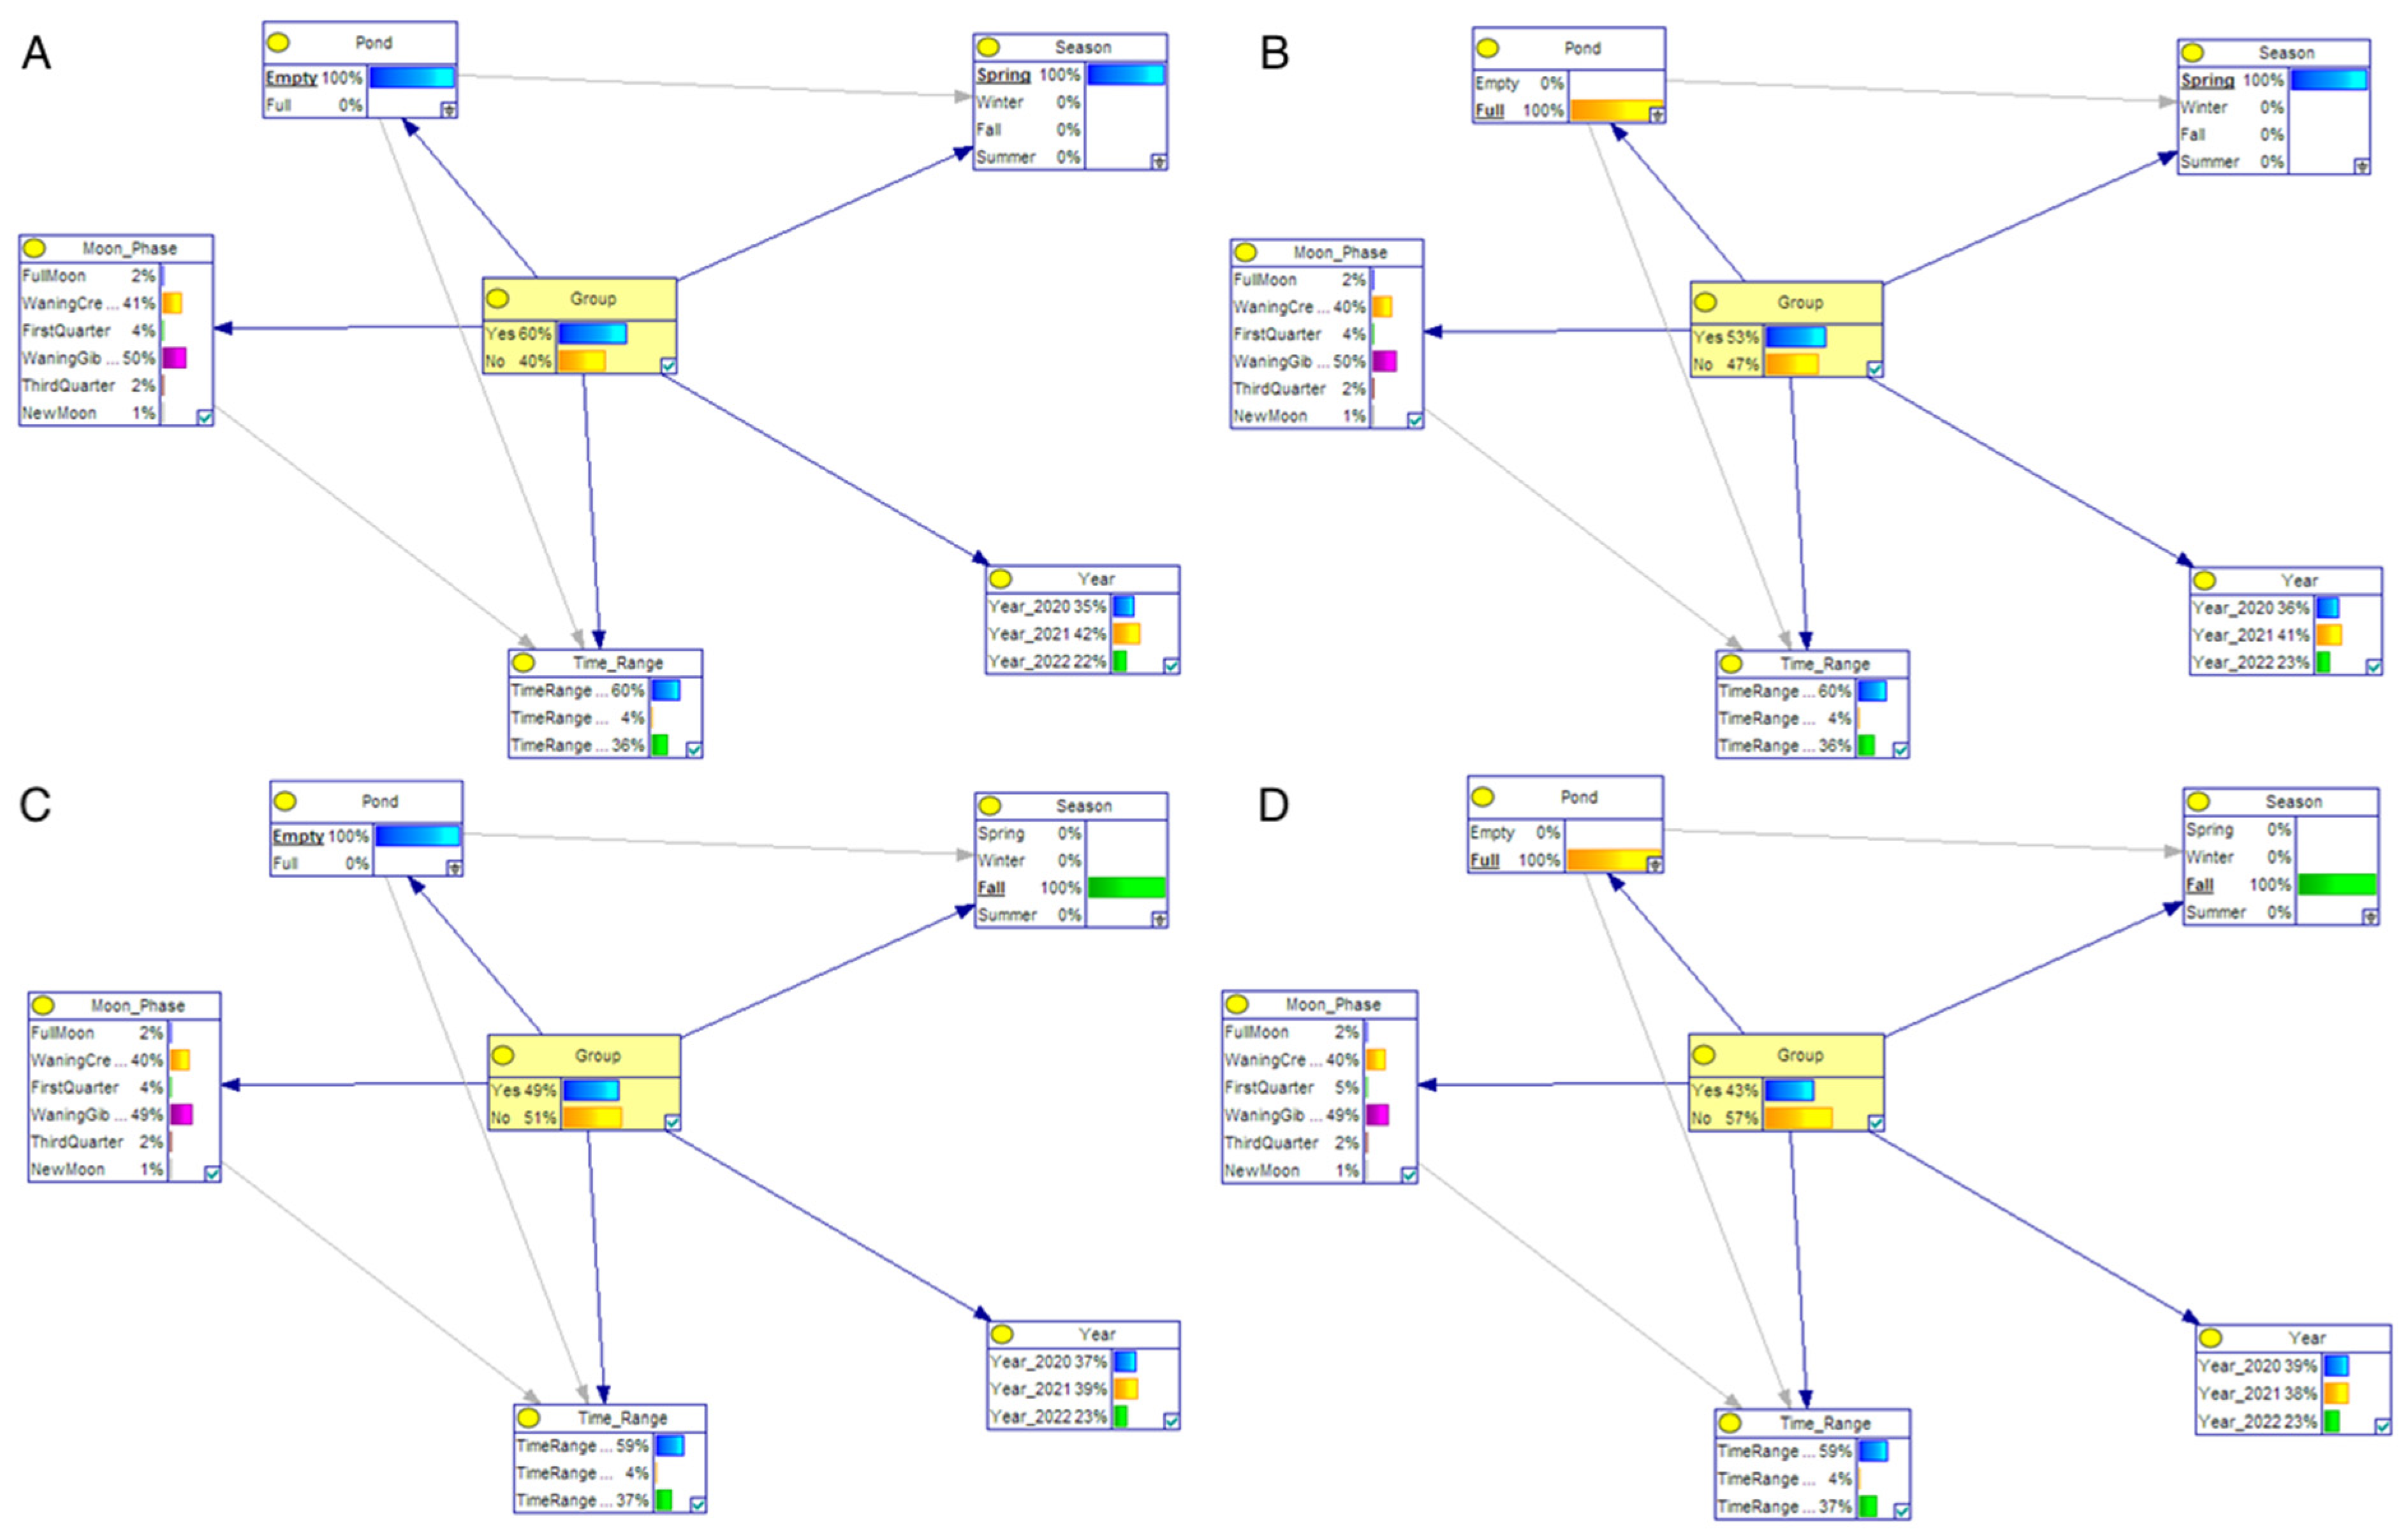
| Scenario | Pond | Season | Phase of Moon | Time Range | Year |
|---|---|---|---|---|---|
| 1 | Empty | Spring | x | x | x |
| 2 | Full | Spring | x | x | x |
| 3 | Empty | Fall | x | x | x |
| 4 | Full | Fall | x | x | x |
| Variable | Categories | Probabilities |
|---|---|---|
| Group | Yes | 48% |
| No | 52% | |
| Pond | Empty | 14% |
| Full | 86% | |
| Season | Spring | 11% |
| Winter | 13% | |
| Fall | 58% | |
| Summer | 19% | |
| Year | 2020 | 38% |
| 2021 | 39% | |
| 2022 | 23% | |
| Time Range | 00.00–08.00 | 59% |
| 08.00–16.00 | 4% | |
| 16.00–00.00 | 37% | |
| Moon Phase | Full Moon | 2% |
| Waning Crescent | 40% | |
| First Quarter | 4% | |
| Waning Gibbous | 49% | |
| Third Quarter | 2% | |
| New Moon | 1% |
Disclaimer/Publisher’s Note: The statements, opinions and data contained in all publications are solely those of the individual author(s) and contributor(s) and not of MDPI and/or the editor(s). MDPI and/or the editor(s) disclaim responsibility for any injury to people or property resulting from any ideas, methods, instructions or products referred to in the content. |
© 2023 by the authors. Licensee MDPI, Basel, Switzerland. This article is an open access article distributed under the terms and conditions of the Creative Commons Attribution (CC BY) license (https://creativecommons.org/licenses/by/4.0/).
Share and Cite
Tuttu, U.; Ulaş, E.; Gülçin, D.; Velázquez, J.; Çiçek, K.; Özcan, A.U. Assessment of Ecological Bridges at Wildlife Crossings in Türkiye: A Case Study of Wild Boar Crossings on the Izmir-Çeşme Motorway. Animals 2024, 14, 30. https://doi.org/10.3390/ani14010030
Tuttu U, Ulaş E, Gülçin D, Velázquez J, Çiçek K, Özcan AU. Assessment of Ecological Bridges at Wildlife Crossings in Türkiye: A Case Study of Wild Boar Crossings on the Izmir-Çeşme Motorway. Animals. 2024; 14(1):30. https://doi.org/10.3390/ani14010030
Chicago/Turabian StyleTuttu, Uğur, Efehan Ulaş, Derya Gülçin, Javier Velázquez, Kerim Çiçek, and Ali Uğur Özcan. 2024. "Assessment of Ecological Bridges at Wildlife Crossings in Türkiye: A Case Study of Wild Boar Crossings on the Izmir-Çeşme Motorway" Animals 14, no. 1: 30. https://doi.org/10.3390/ani14010030
APA StyleTuttu, U., Ulaş, E., Gülçin, D., Velázquez, J., Çiçek, K., & Özcan, A. U. (2024). Assessment of Ecological Bridges at Wildlife Crossings in Türkiye: A Case Study of Wild Boar Crossings on the Izmir-Çeşme Motorway. Animals, 14(1), 30. https://doi.org/10.3390/ani14010030