
A Novel UHPLC–MS/MS Method for the Measurement of 25-Hydroxyvitamin D3 in Canine Serum and Its Application to Healthy Dogs
 , , , and
Abstract
:Simple Summary
Abstract
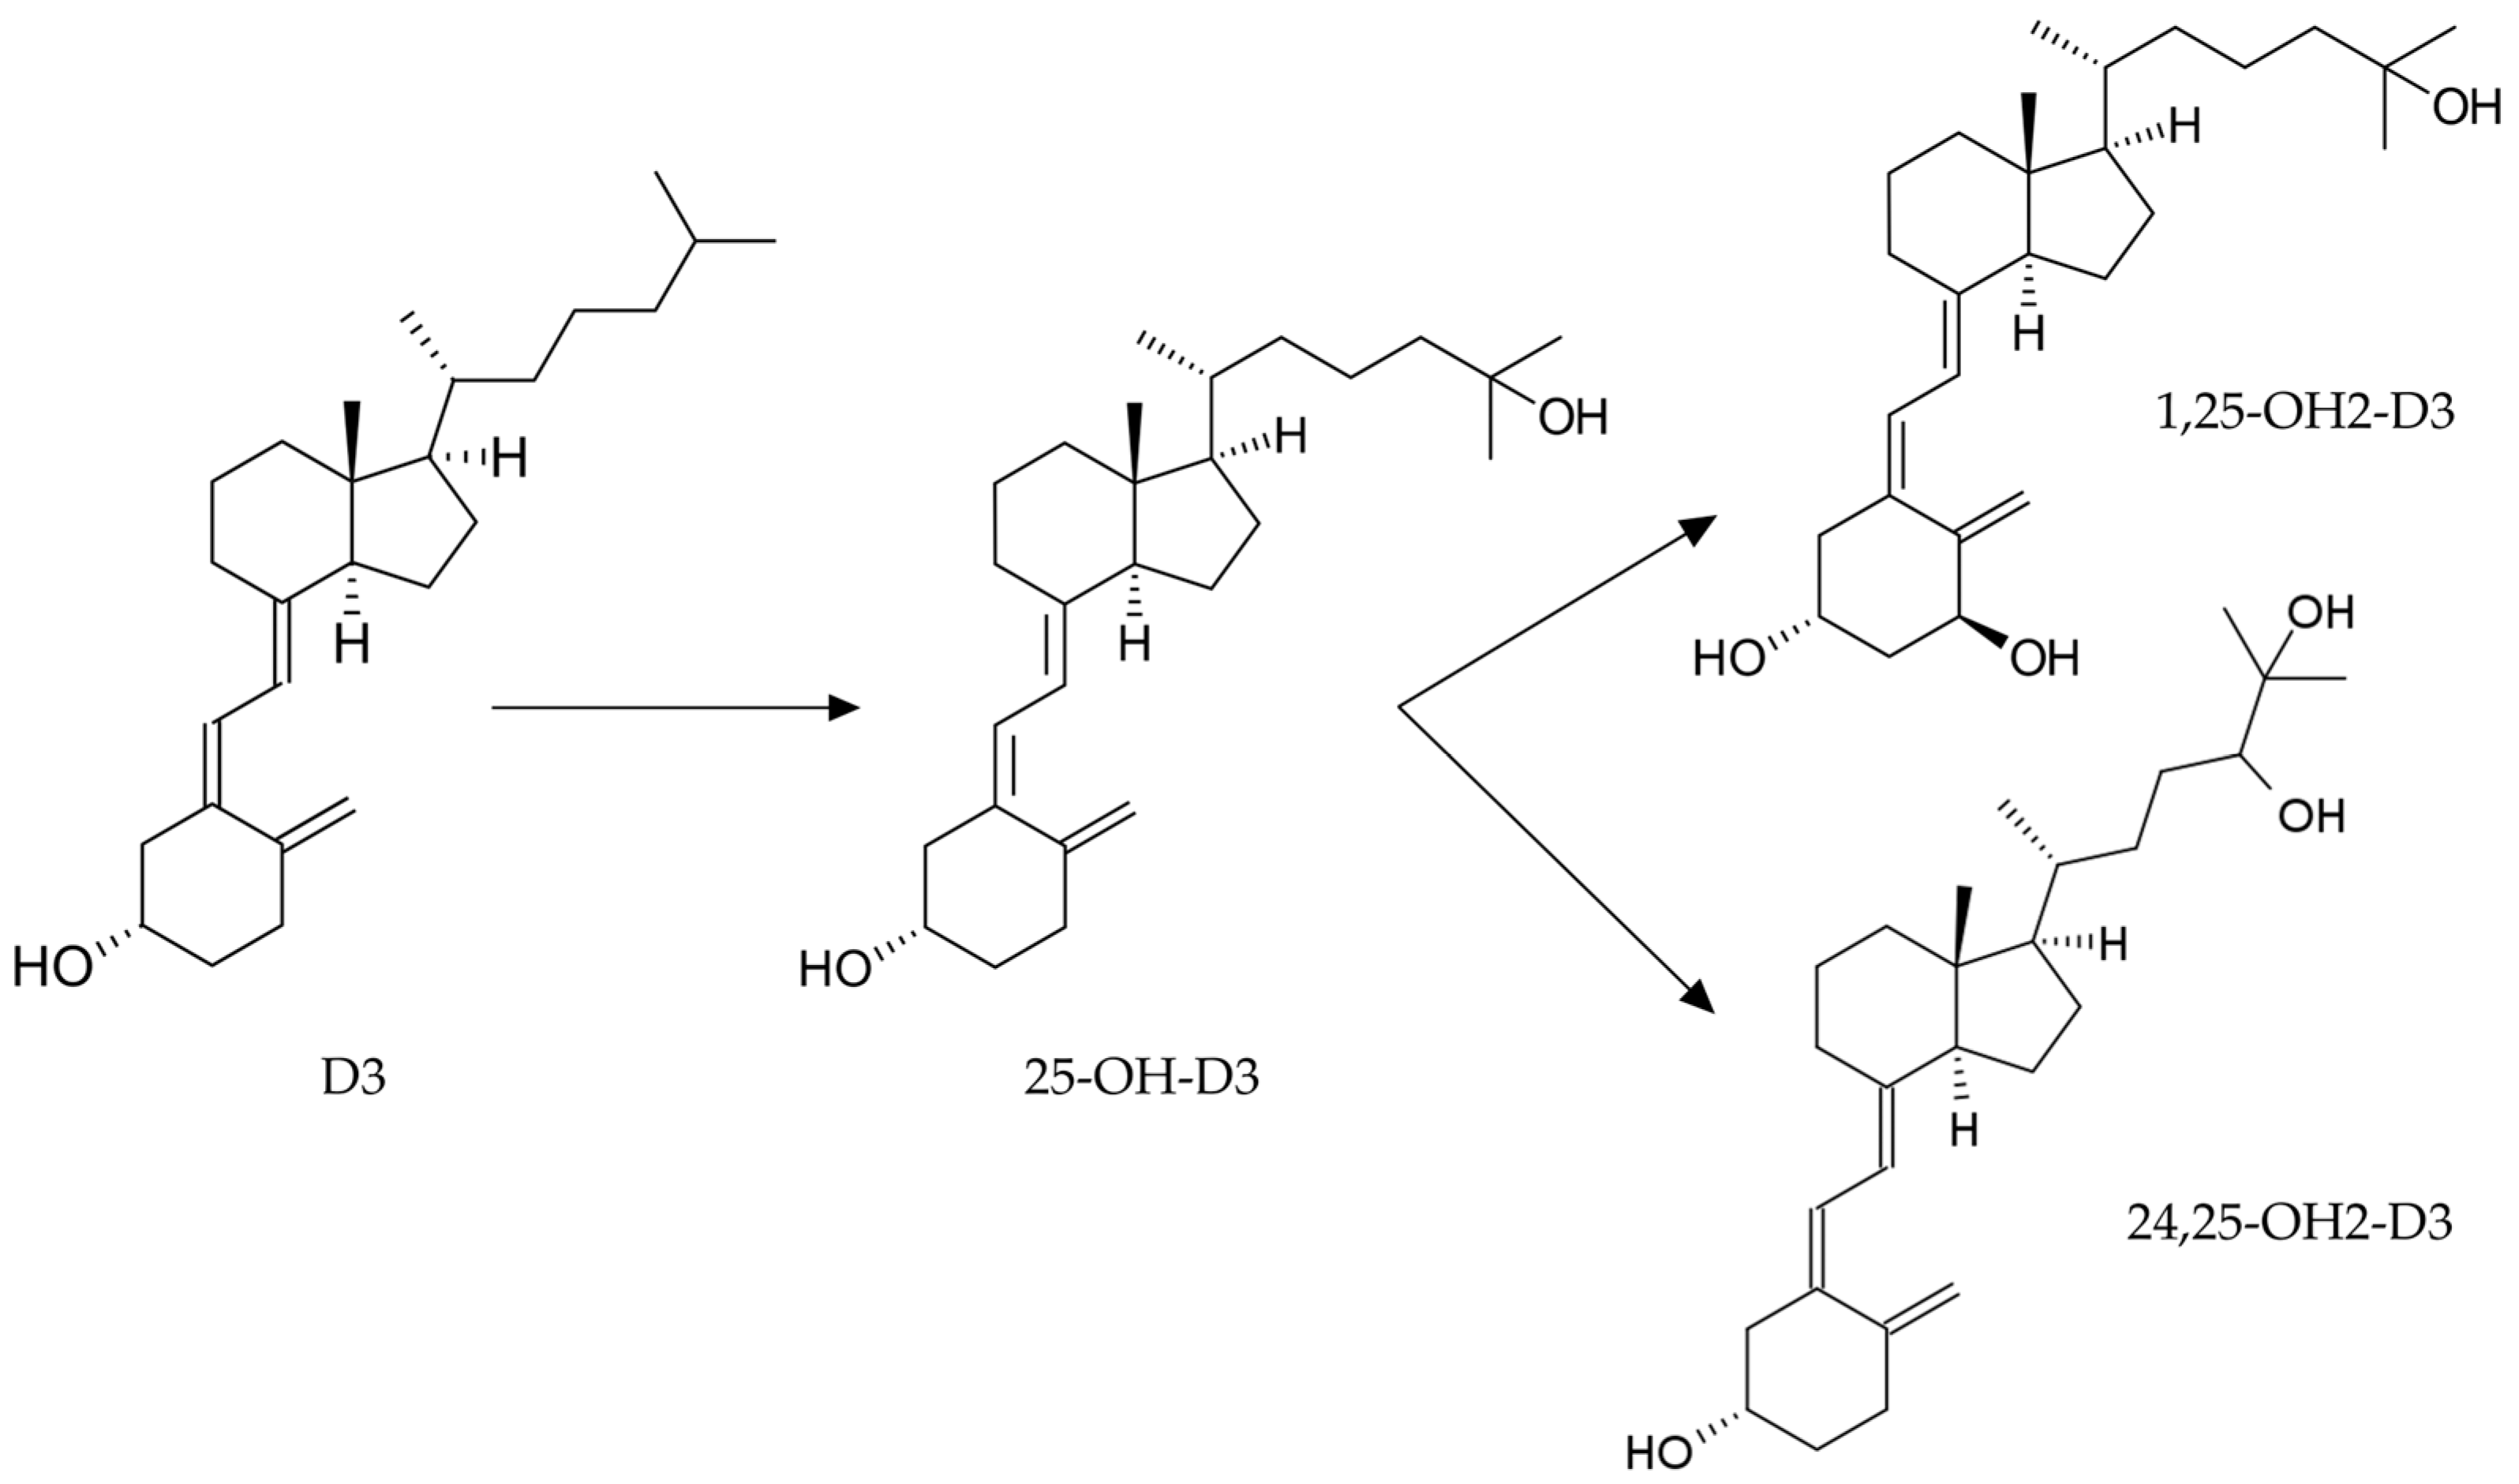
1. Introduction
2. Materials and Methods
2.1. Serum Samples
2.2. Chemicals and Reagents
2.3. Working Solutions
2.4. Sample Preparation
2.5. Liquid Chromatography–Mass Spectrometry Conditions
2.6. Method Validation
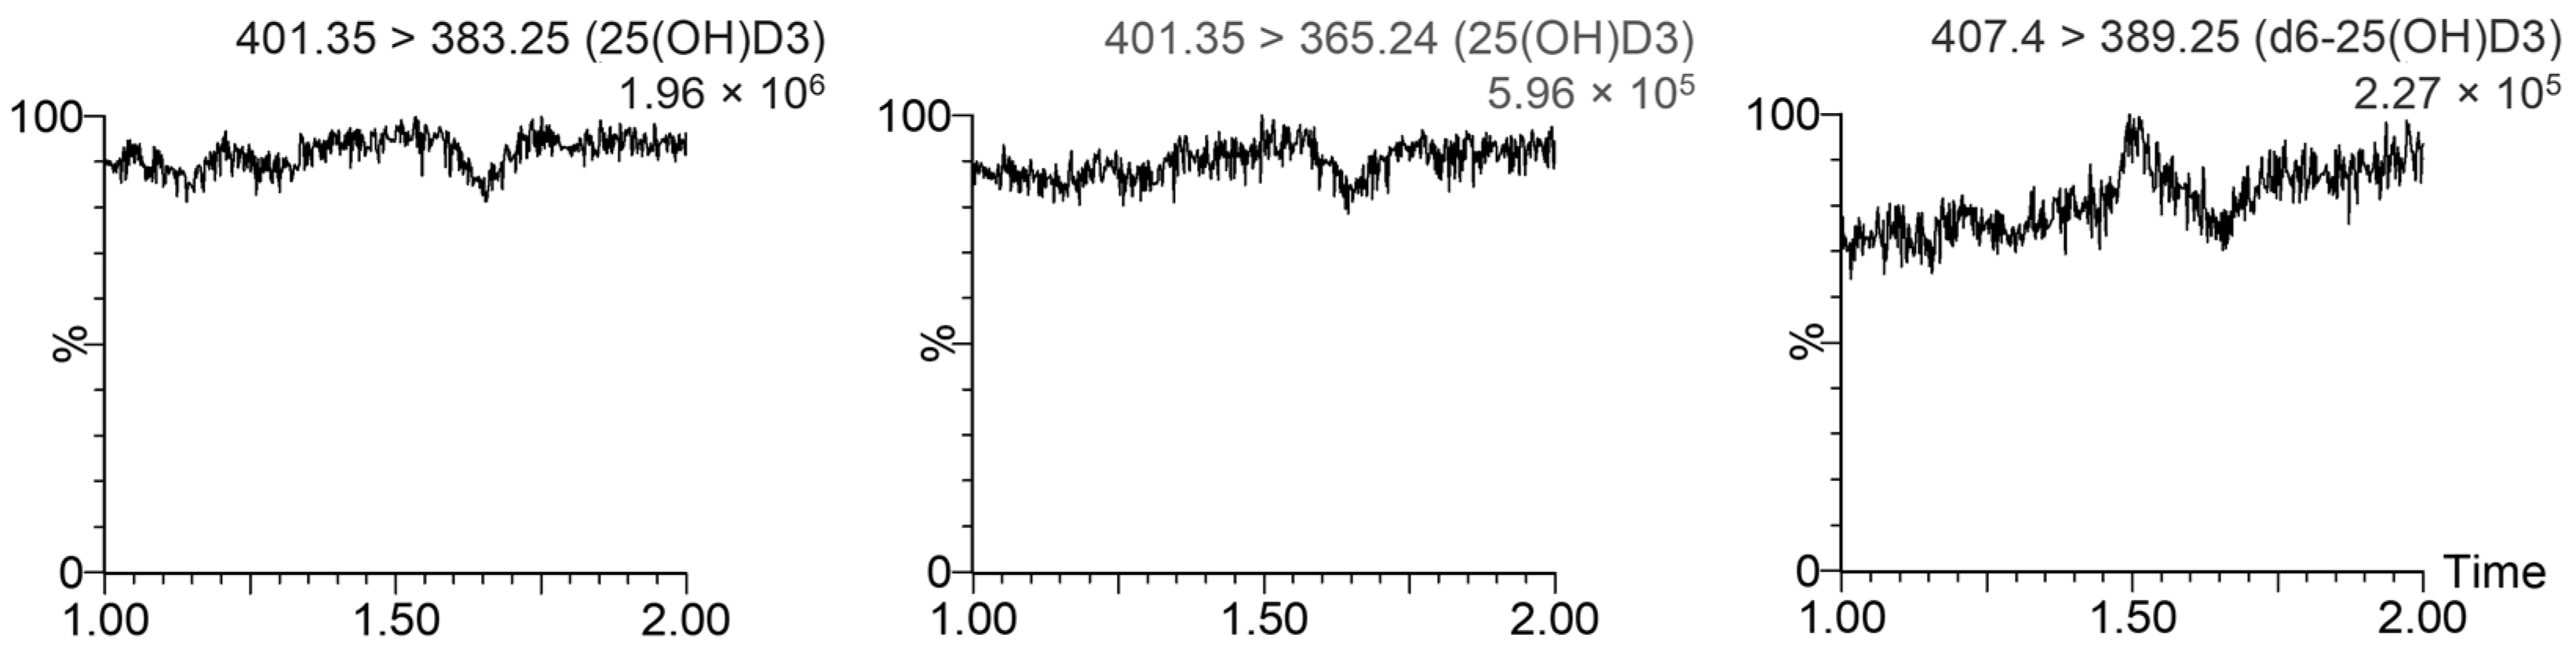
2.6.1. Specificity
2.6.2. Calibration Range
2.6.3. Accuracy and Precision
2.6.4. Recovery and Matrix Effect
2.6.5. Carry-Over
2.6.6. Stability
2.7. Statistical Analysis
3. Results
4. Discussion
4.1. Method Development and Validation
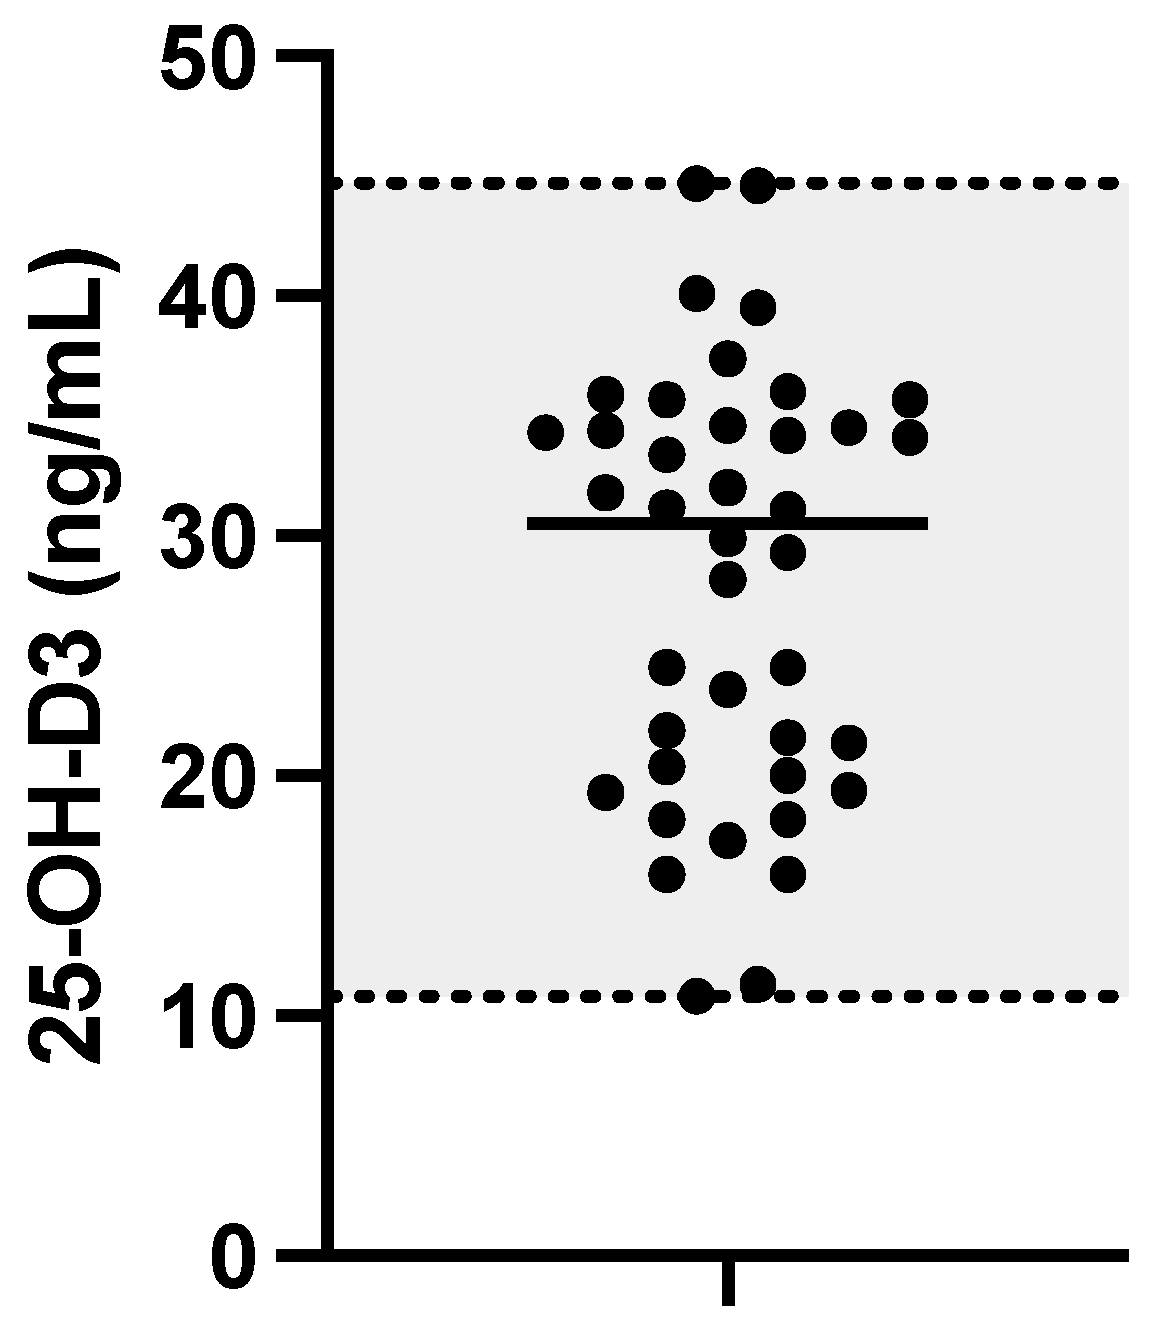
4.2. Dog Serum Analysis
5. Conclusions
Supplementary Materials
Author Contributions
Funding
Institutional Review Board Statement
Informed Consent Statement
Data Availability Statement
Conflicts of Interest
References
- How, K.L.; Hazewinkel, H.A.; Mol, J.A. Dietary Vitamin D Dependence of Cat and Dog Due to Inadequate Cutaneous Synthesis of Vitamin D. Gen. Comp. Endocrinol. 1994, 96, 12–18. [Google Scholar] [CrossRef] [PubMed]
- Morris, J.G. Ineffective Vitamin D Synthesis in Cats Is Reversed by an Inhibitor of 7-Dehydrocholestrol-Delta7-Reductase. J. Nutr. 1999, 129, 903–908. [Google Scholar] [CrossRef] [PubMed]
- Hurst, E.A.; Homer, N.Z.; Mellanby, R.J. Vitamin D Metabolism and Profiling in Veterinary Species. Metabolites 2020, 10, 371. [Google Scholar] [CrossRef] [PubMed]
- Parker, V.J.; Rudinsky, A.J.; Chew, D.J. Vitamin D Metabolism in Canine and Feline Medicine. J. Am. Vet. Med. Assoc. 2017, 250, 1259–1269. [Google Scholar] [CrossRef] [PubMed]
- Zafalon, R.V.A.; Ruberti, B.; Rentas, M.F.; Amaral, A.R.; Vendramini, T.H.A.; Chacar, F.C.; Kogika, M.M.; Brunetto, M.A. The Role of Vitamin D in Small Animal Bone Metabolism. Metabolites 2020, 10, 496. [Google Scholar] [CrossRef] [PubMed]
- Jones, K.S.; Assar, S.; Harnpanich, D.; Bouillon, R.; Lambrechts, D.; Prentice, A.; Schoenmakers, I. 25(OH)D2 Half-Life Is Shorter than 25(OH)D3 Half-Life and Is Influenced by DBP Concentration and Genotype. J. Clin. Endocrinol. Metab. 2014, 99, 3373–3381. [Google Scholar] [CrossRef] [PubMed]
- Holick, M.F. Vitamin D Status: Measurement, Interpretation, and Clinical Application. Ann. Epidemiol. 2009, 19, 73–78. [Google Scholar] [CrossRef]
- Cavalier, E. Long-Term Stability of 25-Hydroxyvitamin D: Importance of the Analytical Method and of the Patient Matrix. Clin. Chem. Lab. Med. CCLM 2021, 59, e389–e391. [Google Scholar] [CrossRef]
- Mick, P.J.; Peng, S.A.; Loftus, J.P. Serum Vitamin D Metabolites and CXCL10 Concentrations Associate With Survival in Dogs With Immune Mediated Disease. Front. Vet. Sci. 2019, 6, 247. [Google Scholar] [CrossRef]
- Zafalon, R.V.A.; Risolia, L.W.; Pedrinelli, V.; Vendramini, T.H.A.; Rodrigues, R.B.A.; Amaral, A.R.; Kogika, M.M.; Brunetto, M.A. Vitamin D Metabolism in Dogs and Cats and Its Relation to Diseases Not Associated with Bone Metabolism. J. Anim. Physiol. Anim. Nutr. 2020, 104, 322–342. [Google Scholar] [CrossRef]
- Weidner, N.; Woods, J.P.; Conlon, P.; Meckling, K.A.; Atkinson, J.L.; Bayle, J.; Makowski, A.J.; Horst, R.L.; Verbrugghe, A. Influence of Various Factors on Circulating 25(OH) Vitamin D Concentrations in Dogs with Cancer and Healthy Dogs. J. Vet. Intern. Med. 2017, 31, 1796–1803. [Google Scholar] [CrossRef] [PubMed]
- Clarke, K.E.; Hurst, E.A.; Mellanby, R.J. Vitamin D Metabolism and Disorders in Dogs and Cats. J. Small Anim. Pract. 2021, 62, 935–947. [Google Scholar] [CrossRef] [PubMed]
- Gow, A.G.; Else, R.; Evans, H.; Berry, J.L.; Herrtage, M.E.; Mellanby, R.J. Hypovitaminosis D in Dogs with Inflammatory Bowel Disease and Hypoalbuminaemia. J. Small Anim. Pract. 2011, 52, 411–418. [Google Scholar] [CrossRef] [PubMed]
- Gerhard, C.; Jaffey, J.A. Persistent Increase in Serum 25-Hydroxyvitamin D Concentration in a Dog Following Cholecalciferol Intoxication. Front. Vet. Sci. 2020, 6, 472. [Google Scholar] [CrossRef] [PubMed]
- Vecchiato, C.G.; Delsante, C.; Galiazzo, G.; Perfetti, S.; Pinna, C.; Sabetti, M.C.; Zagnoli, L.; Biagi, G.; Pietra, M. Case Report: A Case Series Linked to Vitamin D Excess in Pet Food: Cholecalciferol (Vitamin D3) Toxicity Observed in Five Cats. Front. Vet. Sci. 2021, 8, 707741. [Google Scholar] [CrossRef] [PubMed]
- Ahmadi, S.; Farzaneh, N.; Mohri, M. Changes and Relations of 25(OH) Vitamin D and Some Inflammatory and Oxidative Stress Indicators in Healthy Dairy Cows during Transition Period. Comp. Clin. Pathol. 2022, 31, 917–924. [Google Scholar] [CrossRef]
- Alizadeh, K.; Ahmadi, S.; Sarchahi, A.A.; Mohri, M. The Effects of Age, Sex, Breed, Diet, Reproductive Status and Housing Condition on the Amounts of 25(OH) Vitamin D in the Serum of Healthy Dogs: Reference Values. Vet. Med. Sci. 2022, 8, 2360–2366. [Google Scholar] [CrossRef]
- Sharp, C.R.; Selting, K.A.; Ringold, R. The Effect of Diet on Serum 25-Hydroxyvitamin D Concentrations in Dogs. BMC Res. Notes 2015, 8, 442. [Google Scholar] [CrossRef]
- Selting, K.A.; Sharp, C.R.; Ringold, R.; Thamm, D.H.; Backus, R. Serum 25-Hydroxyvitamin D Concentrations in Dogs—Correlation with Health and Cancer Risk. Vet. Comp. Oncol. 2016, 14, 295–305. [Google Scholar] [CrossRef]
- Wagner, D.; Hanwell, H.E.C.; Vieth, R. An Evaluation of Automated Methods for Measurement of Serum 25-Hydroxyvitamin D. Clin. Biochem. 2009, 42, 1549–1556. [Google Scholar] [CrossRef]
- Leino, A.; Turpeinen, U.; Koskinen, P. Automated Measurement of 25-OH Vitamin D3 on the Roche Modular E170 Analyzer. Clin. Chem. 2008, 54, 2059–2062. [Google Scholar] [CrossRef] [PubMed]
- Lensmeyer, G.L.; Wiebe, D.A.; Binkley, N.; Drezner, M.K. HPLC Method for 25-Hydroxyvitamin D Measurement: Comparison with Contemporary Assays. Clin. Chem. 2006, 52, 1120–1126. [Google Scholar] [CrossRef] [PubMed]
- Burild, A.; Lauridsen, C.; Faqir, N.; Sommer, H.M.; Jakobsen, J. Vitamin D3 and 25-Hydroxyvitamin D3 in Pork and Their Relationship to Vitamin D Status in Pigs. J. Nutr. Sci. 2016, 5, e3. [Google Scholar] [CrossRef] [PubMed]
- Singh, R.J.; Taylor, R.L.; Reddy, G.S.; Grebe, S.K.G. C-3 Epimers Can Account for a Significant Proportion of Total Circulating 25-Hydroxyvitamin D in Infants, Complicating Accurate Measurement and Interpretation of Vitamin D Status. J. Clin. Endocrinol. Metab. 2006, 91, 3055–3061. [Google Scholar] [CrossRef] [PubMed]
- Xu, S.; Ni, R.; Lv, L.; Chen, R.; Chen, Y.; Huang, F.; Xu, Z. Simultaneous Determination of Vitamin D Metabolites 25(OH)D3 and 1α,25(OH)2D3 in Human Plasma Using Liquid Chromatography Tandem Mass Spectrometry. J. Mass Spectrom. Adv. Clin. Lab 2022, 24, 65–79. [Google Scholar] [CrossRef] [PubMed]
- Wan, D.; Yang, J.; Barnych, B.; Hwang, S.H.; Lee, K.S.S.; Cui, Y.; Niu, J.; Watsky, M.A.; Hammock, B.D. A New Sensitive LC/MS/MS Analysis of Vitamin D Metabolites Using a Click Derivatization Reagent, 2-Nitrosopyridine. J. Lipid Res. 2017, 58, 798–808. [Google Scholar] [CrossRef] [PubMed]
- Hurst, E.A.; Homer, N.Z.; Gow, A.G.; Clements, D.N.; Evans, H.; Gaylor, D.; Campbell, S.; Handel, I.; Mellanby, R.J. Vitamin D Status Is Seasonally Stable in Northern European Dogs. Vet. Clin. Pathol. 2020, 49, 279–291. [Google Scholar] [CrossRef] [PubMed]
- EMA ICH M10 on Bioanalytical Method Validation—Scientific Guideline. Available online: https://www.ema.europa.eu/en/ich-m10-bioanalytical-method-validation-scientific-guideline (accessed on 24 July 2023).
- Matuszewski, B.K. Standard Line Slopes as a Measure of a Relative Matrix Effect in Quantitative HPLC–MS Bioanalysis. J. Chromatogr. B 2006, 830, 293–300. [Google Scholar] [CrossRef]
- Friedrichs, K.R.; Harr, K.E.; Freeman, K.P.; Szladovits, B.; Walton, R.M.; Barnhart, K.F.; Blanco-Chavez, J. American Society for Veterinary Clinical Pathology ASVCP Reference Interval Guidelines: Determination of de Novo Reference Intervals in Veterinary Species and Other Related Topics. Vet. Clin. Pathol. 2012, 41, 441–453. [Google Scholar] [CrossRef]
- Fritz, C.A.; Navetta, K.A.; Wolford, D.P.; Colangelo, J.L. Assessment of Endogenous 25-Hydroxyvitamin D Serum Concentrations by Liquid Chromatography-Tandem Mass Spectrometry in Various Animal Species. Vet. Clin. Pathol. 2017, 46, 371–379. [Google Scholar] [CrossRef]
- Hurst, E.A.; Homer, N.Z.; Denham, S.G.; MacFarlane, E.; Campbell, S.; Boswinkel, M.; Mellanby, R.J. Development and Application of a LC–MS/MS Assay for Simultaneous Analysis of 25-Hydroxyvitamin-D and 3-Epi-25-Hydroxyvitamin-D Metabolites in Canine Serum. J. Steroid Biochem. Mol. Biol. 2020, 199, 105598. [Google Scholar] [CrossRef] [PubMed]
- Spoo, J.W.; Downey, R.L.; Griffitts, C.; Horst, R.J.; Levine, C.B.; Childs, R.M.; Wakshlag, J.J. Plasma Vitamin D Metabolites and C-Reactive Protein in Stage-Stop Racing Endurance Sled Dogs. J. Vet. Intern. Med. 2015, 29, 519–525. [Google Scholar] [CrossRef] [PubMed]
- Groth, E.M.; Lulich, J.P.; Chew, D.J.; Parker, V.J.; Furrow, E. Vitamin D Metabolism in Dogs with and without Hypercalciuric Calcium Oxalate Urolithiasis. J. Vet. Intern. Med. 2019, 33, 758–763. [Google Scholar] [CrossRef] [PubMed]
- Kovalik, M.; Thoday, K.L.; Berry, J.; van den Broek, A.H.M.; Mellanby, R.J. Prednisolone Therapy for Atopic Dermatitis Is Less Effective in Dogs with Lower Pretreatment Serum 25-Hydroxyvitamin D Concentrations. Vet. Dermatol. 2012, 23, 125-e28. [Google Scholar] [CrossRef] [PubMed]
- Cazzolli, D.M.; Prittie, J.E.; Fox, P.R.; Lamb, K. Evaluation of Serum 25-Hydroxyvitamin D Concentrations in a Heterogeneous Canine ICU Population. J. Vet. Emerg. Crit. Care 2019, 29, 605–610. [Google Scholar] [CrossRef]
- Kim, D.-I.; Kim, H.; Son, P.; Kang, J.-H.; Kang, B.-T.; Yang, M.-P. Serum 25-Hydroxyvitamin D Concentrations in Dogs with Suspected Acute Pancreatitis. J. Vet. Med. Sci. 2017, 79, 1366–1373. [Google Scholar] [CrossRef]
- da Fonseca, F.M.; Beltrame, O.; Seixas, S.; Laskoski, L.; Félix, A.; Dittrich, R. Serum Concentration of 25 (OH) Vitamin D in Healthy Dogs: Factors as Age, Sex, and Diet. Comp. Clin. Pathol. 2020, 29, 697–703. [Google Scholar] [CrossRef]
- Gonzales, M. Nutritional Guidelines for Complete and Complementary Pet Food for Cats and Dogs. pp. 1–98. Available online: https://europeanpetfood.org/wp-content/uploads/2022/03/Updated-Nutritional-Guidelines.pdf (accessed on 2 December 2023).


| Matrix-Matched (Pooled Serum) | Water (Surrogate Matrix) | |||
|---|---|---|---|---|
| Accuracy (%) | Precision (%) | Accuracy (%) | Precision (%) | |
| QC1 (10 ng/mL) | QC1 (10 ng/mL) | |||
| Day 1 (n = 5) | 0.0 | 1.0 | −4.0 | 1.0 |
| Day 2 (n = 5) | 8.0 | 8.1 | 10.0 | 8.8 |
| Day 3 (n = 5) | 1.7 | 2.5 | 9.3 | 5.8 |
| Inter-day (n = 15) | 3.2 | 5.7 | 5.1 | 8.5 |
| QC2 (20 ng/mL) | QC2 (20 ng/mL) | |||
| Day 1 (n = 5) | −1.3 | 4.1 | 3.2 | 5.2 |
| Day 2 (n = 5) | −4.5 | 2.1 | 12.7 | 6.5 |
| Day 3 (n = 5) | 4.8 | 8.0 | 0.5 | 5.3 |
| Inter-day (n = 15) | −0.3 | 6.3 | 5.1 | 7.5 |
| QC3 (80 ng/mL) | QC3 (80 ng/mL) | |||
| Day 1 (n = 5) | 0.9 | 1.9 | −1.8 | 1.4 |
| Day 2 (n = 5) | −4.8 | 1.6 | 4.1 | 9.3 |
| Day 3 (n = 5) | −3.3 | 6.7 | −2.5 | 4.2 |
| Inter-day (n = 15) | −2.4 | 4.4 | −0.1 | 6.1 |
| QC4 (120 ng/mL) | QC4 (120 ng/mL) | |||
| Day 1 (n = 5) | −6.4 | 2.6 | −5.8 | 1.5 |
| Day 2 (n = 5) | −6.5 | 2.6 | 0.8 | 8.6 |
| Day 3 (n = 5) | −0.9 | 1.5 | −0.6 | 1.7 |
| Inter-day (n = 15) | −4.6 | 3.5 | −1.9 | 5.5 |
Disclaimer/Publisher’s Note: The statements, opinions and data contained in all publications are solely those of the individual author(s) and contributor(s) and not of MDPI and/or the editor(s). MDPI and/or the editor(s) disclaim responsibility for any injury to people or property resulting from any ideas, methods, instructions or products referred to in the content. |
© 2023 by the authors. Licensee MDPI, Basel, Switzerland. This article is an open access article distributed under the terms and conditions of the Creative Commons Attribution (CC BY) license (https://creativecommons.org/licenses/by/4.0/).
Share and Cite
Bardhi, A.; Vecchiato, C.G.; Sabetti, M.C.; Tardo, A.M.; Vasylyeva, K.; Biagi, G.; Pietra, M.; Barbarossa, A. A Novel UHPLC–MS/MS Method for the Measurement of 25-Hydroxyvitamin D3 in Canine Serum and Its Application to Healthy Dogs. Animals 2024, 14, 62. https://doi.org/10.3390/ani14010062
Bardhi A, Vecchiato CG, Sabetti MC, Tardo AM, Vasylyeva K, Biagi G, Pietra M, Barbarossa A. A Novel UHPLC–MS/MS Method for the Measurement of 25-Hydroxyvitamin D3 in Canine Serum and Its Application to Healthy Dogs. Animals. 2024; 14(1):62. https://doi.org/10.3390/ani14010062
Chicago/Turabian StyleBardhi, Anisa, Carla Giuditta Vecchiato, Maria Chiara Sabetti, Antonio Maria Tardo, Kateryna Vasylyeva, Giacomo Biagi, Marco Pietra, and Andrea Barbarossa. 2024. "A Novel UHPLC–MS/MS Method for the Measurement of 25-Hydroxyvitamin D3 in Canine Serum and Its Application to Healthy Dogs" Animals 14, no. 1: 62. https://doi.org/10.3390/ani14010062