Article

Genome-Wide Gene–Environment Interaction Analysis Identifies Novel Candidate Variants for Growth Traits in Beef Cattle

1
Institute of Animal Sciences, Chinese Academy of Agricultural Sciences, Beijing 100193, China
2
Shaanxi Key Laboratory of Molecular Biology for Agriculture, College of Animal Science and Technology, Northwest A&F University, Yangling, Xianyang 712100, China
*
Authors to whom correspondence should be addressed.
These authors contributed equally to this work.
Animals 2024, 14(11), 1695; https://doi.org/10.3390/ani14111695
Submission received: 16 April 2024 / Revised: 24 May 2024 / Accepted: 30 May 2024 / Published: 5 June 2024
(This article belongs to the Section Animal Genetics and Genomics)

Abstract

:

Simple Summary

Growth traits have been widely studied as economically important traits in the beef cattle industry. However, traditional studies often miss how these traits change under different environmental conditions, only focusing on single genetic changes that affect traits directly. In our study, we analyzed how genetics and environment interact to affect growth in beef cattle, considering four growth traits and two environmental factors. This analysis uncovered several genetic markers for growth traits that are not usually evident in standard studies, showing that some genes have effects that can be obliterated by environmental conditions Further testing showed whether these genetic markers are grouped in specific genes or functional pathways, helping us understand how genetics can influence growth under different environmental conditions. By uncovering novel genetic loci, genes, and candidate biological mechanisms associated with growth traits, our study provides valuable information for selection prediction and breeding decisions in the beef cattle industry.

Abstract

Complex traits are widely considered to be the result of a compound regulation of genes, environmental factors, and genotype-by-environment interaction (G × E). The inclusion of G × E in genome-wide association analyses is essential to understand animal environmental adaptations and improve the efficiency of breeding decisions. Here, we systematically investigated the G × E of growth traits (including weaning weight, yearling weight, 18-month body weight, and 24-month body weight) with environmental factors (farm and temperature) using genome-wide genotype-by-environment interaction association studies (GWEIS) with a dataset of 1350 cattle. We validated the robust estimator’s effectiveness in GWEIS and detected 29 independent interacting SNPs with a significance threshold of 1.67 × 10⁻⁶, indicating that these SNPs, which do not show main effects in traditional genome-wide association studies (GWAS), may have non-additive effects across genotypes but are obliterated by environmental means. The gene-based analysis using MAGMA identified three genes that overlapped with the GEWIS results exhibiting G × E, namely SMAD2, PALMD, and MECOM. Further, the results of functional exploration in gene-set analysis revealed the bio-mechanisms of how cattle growth responds to environmental changes, such as mitotic or cytokinesis, fatty acid β-oxidation, neurotransmitter activity, gap junction, and keratan sulfate degradation. This study not only reveals novel genetic loci and underlying mechanisms influencing growth traits but also transforms our understanding of environmental adaptation in beef cattle, thereby paving the way for more targeted and efficient breeding strategies.

1. Introduction

Growth traits are frequently recorded and used as important selection criteria in modern beef cattle farm production systems and breeding programs, primarily because they are closely linked to increasing overall beef production, reproduction, and other crucial economic traits, thus affecting profitability [1,2]. However, considering the strong environmental adaptability and widespread distribution of beef cattle, joint genetic evaluations between farms located in different geographic regions and candidate gene localization for growth traits are often extremely unstable and poorly replicable [3,4,5], partly because complex traits are thought to be regulated by a combination of genes, environment, and often overlooked gene–environment interactions (G × E). Thus, the exploitation of gene-environment also known as genotype-by-environment interactions may be an attractive and meaningful approach for identifying novel candidate genes associated with growth traits.
From a biological perspective, G × E can be considered a process by which genetic factors regulate environmental influences and vice versa [6]. In most cases, G × E has been used in the etiology of human psychiatric phenotypes to speculate on pathogenic causes, as it explains why, under specific environmental risk exposure, some individuals develop psychiatric symptoms while others do not [7,8,9]. In contrast, the presence and size of G × E in plants and animals were previously explained by assessing genetic parameters through methods such as reaction norm models [10,11,12], as there was not enough genomic data to support molecular-level exploration until advancement in the development of sequencing technologies reduced the limitations of G × E in genome prediction and genome-wide association analysis in plants and animals [13,14,15].
Genome-wide association studies (GWAS) are powerful in locating candidate genetic loci associated with traits of interest [4,16]. However, typical GWAS were designed to detect only single main effect SNPs that directly affect the phenotype, ignoring potentially useful information from available environmental exposure data since environmental variables were treated as random or systematic effects. Several methods have been invented to overcome this problem, some such as multi-trait models and meta-analysis reducing the burden of multiple testing by pre-selecting variants or integrating statistics from GWASs in different environments [17,18,19], while these approaches may yield more significant SNPs, individual SNP effects are unlikely to provide insight into the higher-order biological mechanisms underlying G × E, and the lack of genome-wide G × E data restricts follow-up analyses such as gene-set analysis, which could elucidate the function of G × E effects [20,21]. Moreover, since SNPs with G × E may not show strong main effects, these approaches may also lead to obscuring potential key interactions [20,22]. Other methods such as single-step GWAS or Bayesian regression model can study global G × E effects across the genome by modeling interactions with polygenic risk scores constructed using SNP main effects from GWAS or estimating the proportion of variance explained by G × E effects [13,23,24], although these methods can detect the presence of G × E, they cannot confirm which SNPs or genes were driving G × E interactions. In addition, the above methods may be limited by the selection of environmental variables or inflated estimates due to heteroskedasticity residuals, etc. [25,26]. We, therefore, chose the genome-wide genotype-by-environment interaction studies (GWEIS) method, which has been proven effective in G × E studies [27,28,29], to study G × E associated with growth traits in beef cattle and to control for error inflation using robust standard errors [30] that are not available in large-scale genetic analysis software.
Here, we considered farm and monthly mean temperature as environmental variables and present a comprehensive study of G × E for weaning weight (WW), yearling weight (YW), 18-month body weight (18 BW), and 24-month body weight (24 BW) in more than 1300 Huaxi cattle. While using LD score regression methods ensured that the introduction of the robust estimator could appropriately control for the aforementioned inflation and confounding of GWEISs in all experimental scenarios, we first explored SNP–environment interactions between all environmental variables and genome-wide 770 K chip SNPs. We then sought to elucidate the relevant biological mechanisms that may control G × E by testing whether individual SNP–environment interaction effects are overrepresented in specific genes or gene sets. In parallel with all interaction-based analyses, we performed traditional GWASs for the four growth traits in the same population to assess the agreement between the top interaction effects and the corresponding main effects. Our results revealed novel interactions between genetic loci, genes, and candidate biological mechanisms associated with growth traits, providing new insights into environmental adaptation and genetic mechanism resolution of growth traits in beef cattle.

2. Materials and Methods

2.1. Animal Resource and Phenotypes Recording

A total of 1350 individuals in this study were derived from the Chinese Simmental beef cattle core populations born between 2009 and 2019 in China. All the cattle lived on seven different farms located throughout China, where they were fed a similar diet consisting of silage, maize, beer grain, and soybean dregs. Phenotypic records of growth traits, namely the weaning weight (WW), the yearling weight (YW), the 18-month body weight (18 BW), and the 24-month body weight (24 BW), were examined. All the growth traits in the study were measured within one month before or after the growth time point, using uniform measurement specifications in the beef cattle performance test.

2.2. Genotyping and Quality Control

Blood samples for the experimental population were collected during the periodic quarantine inspection of the farms. Genomic DNA was isolated from blood samples using the TIANamp Blood DNA Kit (Tiangen Biotech Co., Ltd., Beijing, China), and the high-quality DNAs with the A260/280 ratio with a range of 1.8–2.0 were considered for further analysis. In this study, the Illumina BovineHD Beadchip with 774,660 SNPs (Illumina Inc., San Diego, CA, USA) was used for qualified DNAs genotyping and Illumina’s Infinium II Assay was selected as the genotyping platform. The SNPs were uniformly distributed on the whole bovine genome with a mean inter-marker space of 3.43 kb. SNP chips were scanned and analyzed using the Infinium GenomeStudio software v2.0 (Illumina Inc., San Diego, CA, USA). PLINK v1.9 (http://zzz.bwh.harvard.edu/plink/, accessed on 1 July 2021) was used for quality control of SNPs according to the following empirical excluded criteria: (1) minor allele frequency (MAF) < 0.05; (2) SNP call rate (CR) < 90%; (3) Hardy–Weinberg equilibrium value p < 1 × 10⁻⁶; (4) Mendelian error of SNP genotype above 2%; (5) individuals with more than 10% SNPs deletion; (6) SNP marker sites with missing chromosomal location information. All the misplaced and duplicated SNPs were also excluded from the analysis. Ultimately, 598,430 SNPs with an average marker interval of 3 kb on 29 autosomal chromosomes remained for subsequent analysis.

2.3. Environmental Factors

We considered farms and the average monthly temperature during the growth period of each individual as environmental factors. As for the farm factor, it can be regarded as a limited-dimensional discrete variable, all cattle were sourced from seven different farms in various regions of China, including Changchun Xinmu (CCXM, longitude 125.464848° E and latitude 43.71698° N), Jilin Dexin (JLDX, longitude 122.946° E and latitude 45.565° N), Tongliao Keerqin (KEQ, longitude 122.040° E and latitude 43.860° N), Aokesi farm in Inner Mongolia (AKS, longitude 119.316° E and latitude 46.278° N), Henan Dingyuan (HNDY, longitude 114.022° E and latitude 34.894° N), Shayang Hanjiang (SYHJ, longitude 112.584° E and latitude 30.864° N), and Yunnan Zhongchu (YNZC, longitude 102.986° E and latitude 25.180° N). The monthly average temperature was collected at the nearest climatological station (National Oceanic and Atmospheric Administration, NOAA, Washington, DC, USA, https://www.noaa.gov (accessed on 14 October 2022)) to each farm and was calculated by averaging the monthly temperatures of each individual from birth to phenotype recording, which can be considered as a continuous variable since the monthly mean temperature of each individual is unique and calculated independently.

2.4. GWEIS

A linear interaction model in R (v4.1.3) was used to analyze SNP–environment interactions. The heteroscedasticity of the residuals makes genotype-by-environment interaction association studies (GWEIS) test statistics particularly vulnerable to erroneous inflating of test statistics. We used the sandwich estimator, also known as Huber–White estimated standard errors [30], to handle this. The sandwich estimator permits a distinct residual variance term across data, which is estimated using the squared residuals, in contrast to model-based standard errors, which are computed using a single residual variance term for all observations.
Our script is an adaptation of a PLINK R plugin originally developed by Almli et al. [31], which performs a joint test of SNP and SNP–environment interaction effects (https://epstein-software.github.io/robust-joint-interaction (accessed on 22 August 2022)). Beyond run-time optimization, we computed p-values for the gene-environment interaction (rather than the joint test of SNP main and interaction effects, as performed initially), and included covariate–SNP and covariate–environment interactions in addition to covariate main effects. Autosomal SNPs were coded as 0, 1, and 2, representing the homozygous minor, heterozygous, or homozygous major genotypes, respectively. We thus implemented the following linear regression model for every SNP:
y i = μ 0 + β g G i + β e E i + β g × e G i E i + β c C i + β c × g C i G i + β c × e C i E i + ε i
where y i represents the phenotype measure for any individual i, G i the SNP allele count, and E i the environmental measure. C i is a k×n vector of covariates, with k equalling the total number of covariates; ε i the residual; and denotes the transpose. The intercept ( μ 0 ) and betas for the SNP ( β g ), environment ( β e ), and SNP–environment interaction term ( β g × e ) are all scalars, while the betas for the covariate–environment ( β c × e ) and covariate–SNP ( β c × g ) interactions are k×1 vectors. The parameter of interest here is β g × e : the beta for the SNP–environment interaction.
We included age, sex, birth weight, and 20 PCs (Principal Component) as covariates. As recommendations or standards regarding the number of PCs that should be included typically pertain to analyses of main effects, we could not rule out the possibility that potentially more complex confounding effects of ancestry could emerge when analyzing interactions; therefore, we opted for a more cautious approach by including up to 20 covariates.

2.5. GWAS

Univariate linear mixed model analyses were performed for the WW, YW, 12 BW, or 24 BW in GEMMA v0.98.5 software using the same set of covariates as in the GWEIS:
y = 1 μ + X β + Z u + ε
where y is an n-vector of phenotypes; μ is the overall mean; X is the incidence matrix of genotypes; β represents genotype effects; Z is the random effects design matrix; u is an n-vector of random additive genetic effects; and ε is an n-vector of random residual. Assuming that u ~ N ( 0 , G σ a 2 ) and e ~ N ( 0 , I σ e 2 ) , G is the n × n genomic relationship matrix; σ a 2 is the additive genetic variance; σ e 2 is the residual variance component; I is an n × n identity matrix.

2.6. Gene-Based and Gene-Set Analyses

To investigate whether SNP–environment interaction signals tend to cluster within gene regions and whether G × E-containing genes are enriched in specific biological pathways, we performed genome-wide gene-based analysis as well as gene-set analysis using MAGMA (v1.10) [32], using the initial GWEIS p-values as input to obtain p-values of genes for gene-set analysis. To allow the inclusion of nearby potential regulatory SNPs, we used windows of 50 kb upstream and downstream [33] of the transcription start and stop sites, respectively. The positions of 23,431 genes were obtained from Ensembl (Bos taurus ARS-UCD1.2 (ftp://ftp.ensembl.org/pub/release-101/fasta/bos_taurus/DNA/ (accessed on 15 November 2022)), of which 23,305 genes mapped at least one SNP. While a total of 1342 definitions of gene sets related to cattle were obtained from Reactome (https://reactome.org/ (accessed on 26 November 2022)), 1283 of them reached the condition of containing multiple genes for analysis. For both analyses, we used the default settings of MAGMA, with gene-based and gene-set analyses using the ‘SNPwise-mean’ model and a competitive framework, respectively.

3. Results

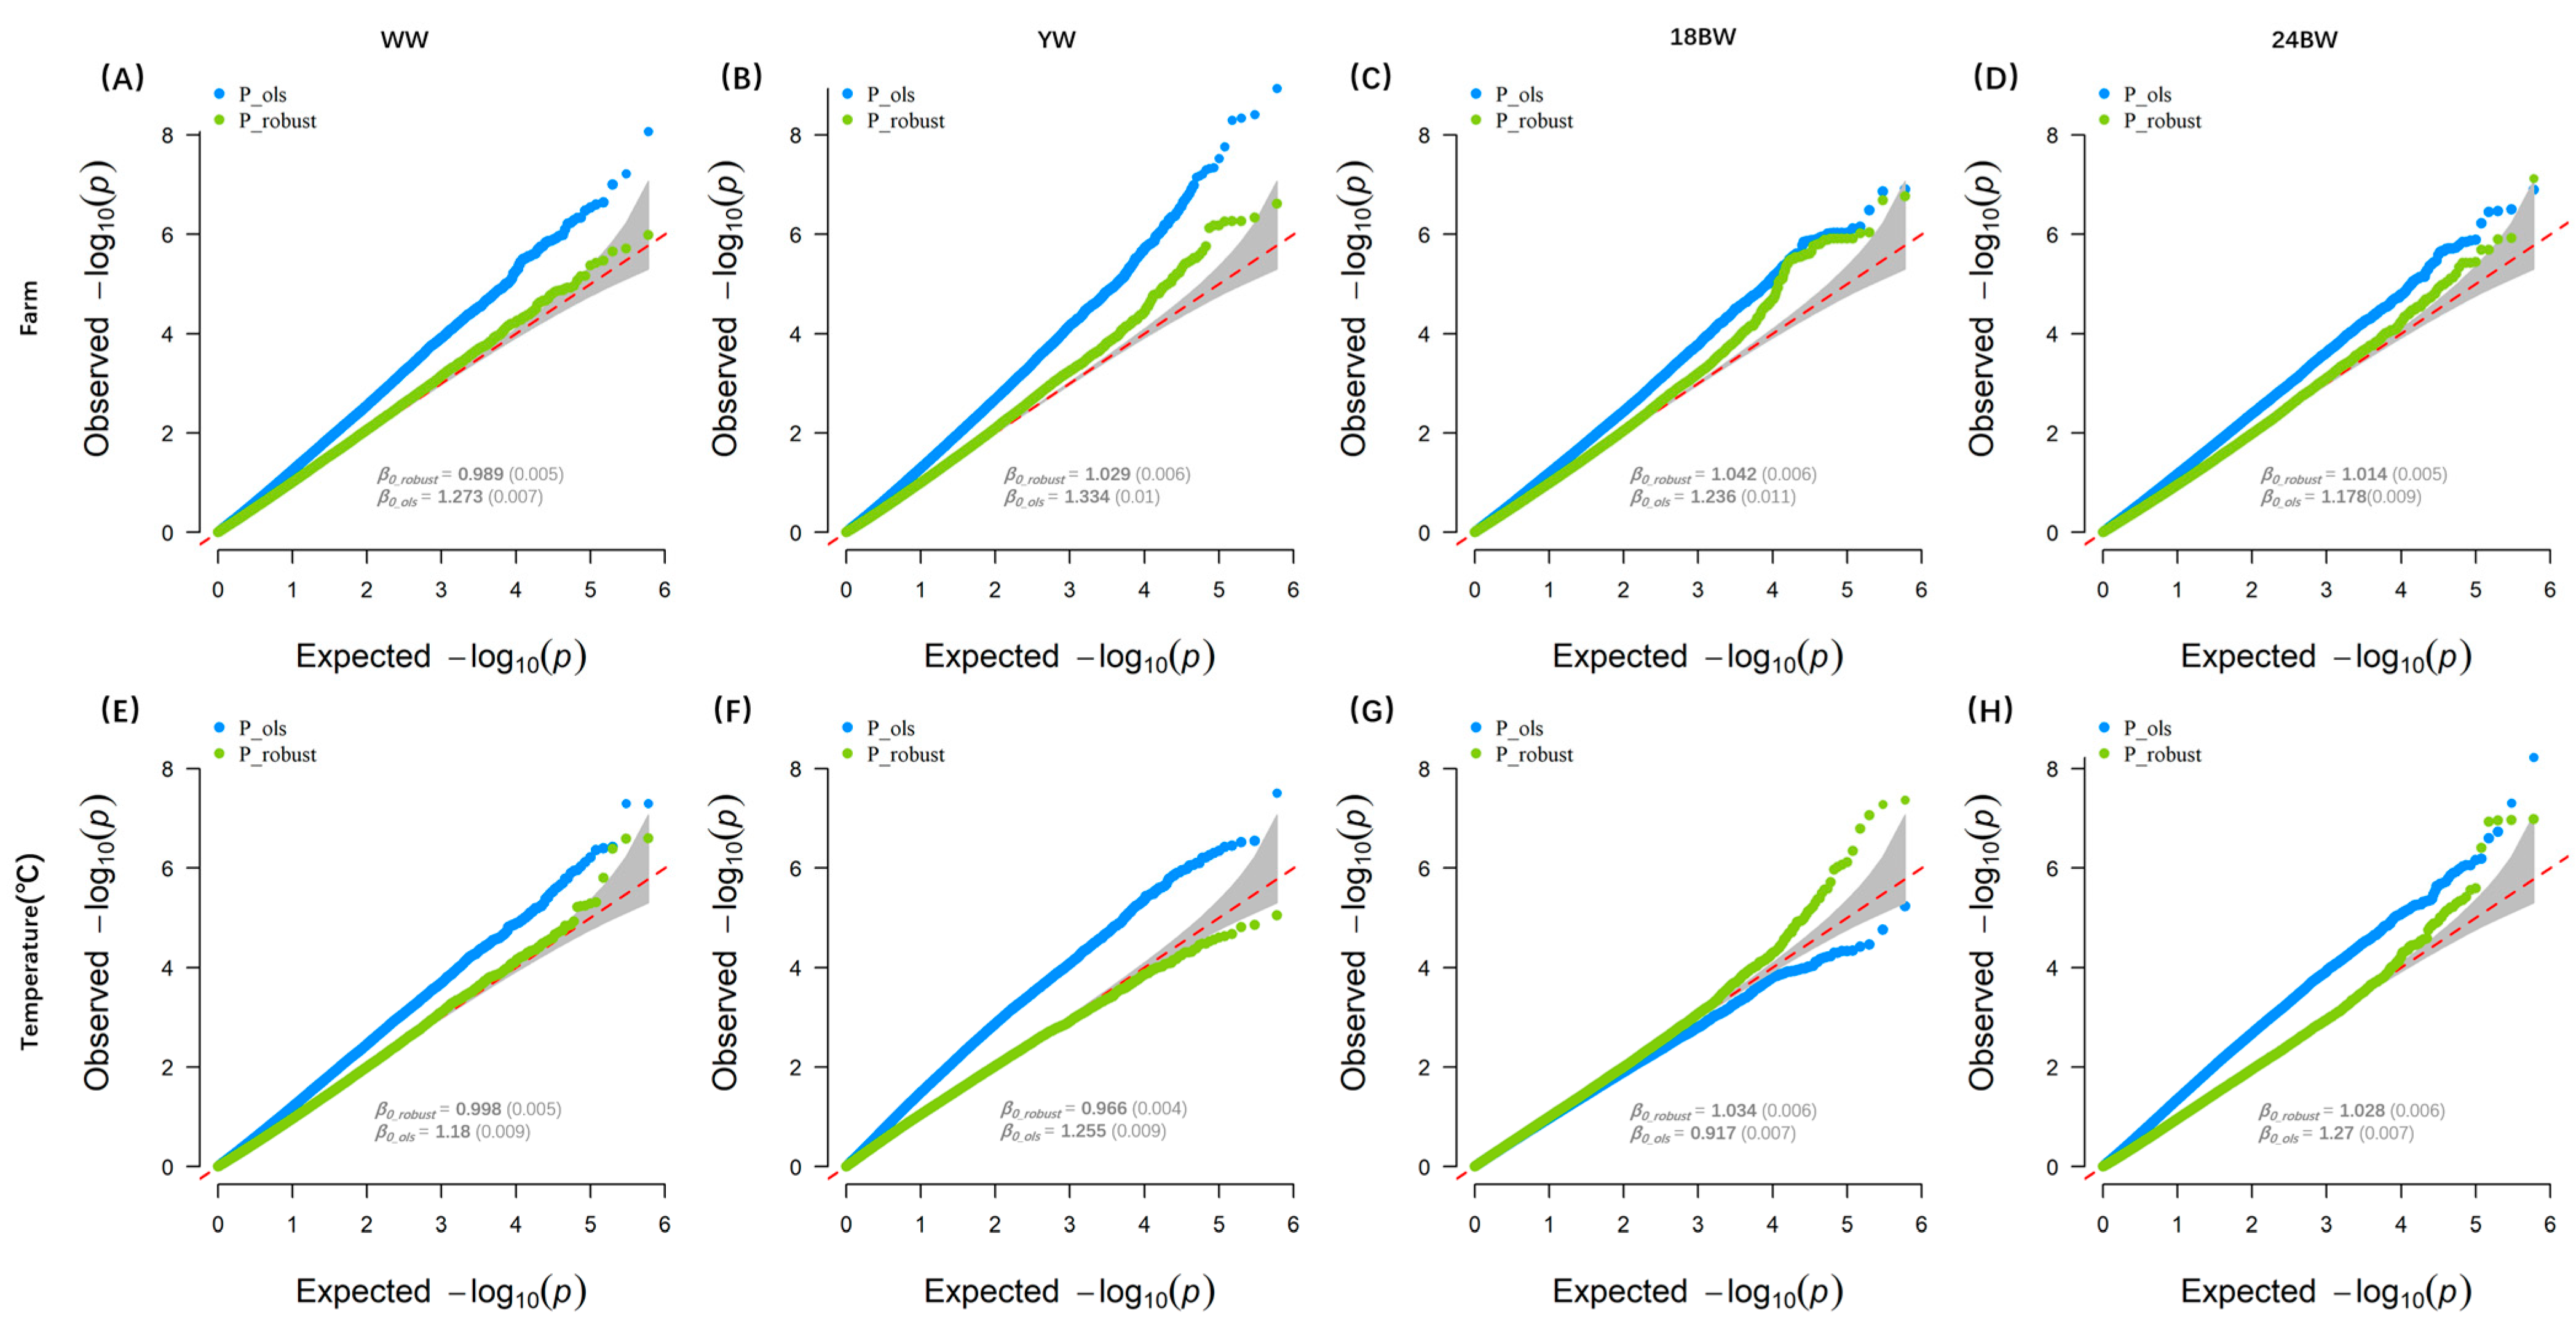
3.1. GWEIS Test Statistics

In order to solve the mentioned risk of spurious inflation of the GWEIS test statistic previously [26,31], we examined SNP–environment interactions in a linear regression model using the R script, computing t-statistics for the interaction coefficients using robust standard errors in the form of the Huber–White sandwich estimator, and we included SNP–covariate and environment–covariate interaction effects in the model to account for any potential confounding covariate interactions. We compared this method with the traditional model test statistic by obtaining LD score regression intercepts [34] and plotting the observed −log10 p-values against the expected null distribution in the form of QQ-plots for results. When relying on the traditional model-based standard errors, we could observe the presence of mild inflation in most of the scenarios. The intercepts of the LD score for the traditional model-based results ranged from 0.917 to 1.334, and the QQ-plots indicated deviations of the p-values of the weakly correlated SNP from the expected distribution in most cases. However, this is not the case for the robust results, where the QQ-plots show no signs of inflation and the LD score intercepts were all below 1.042 (Figure 1).

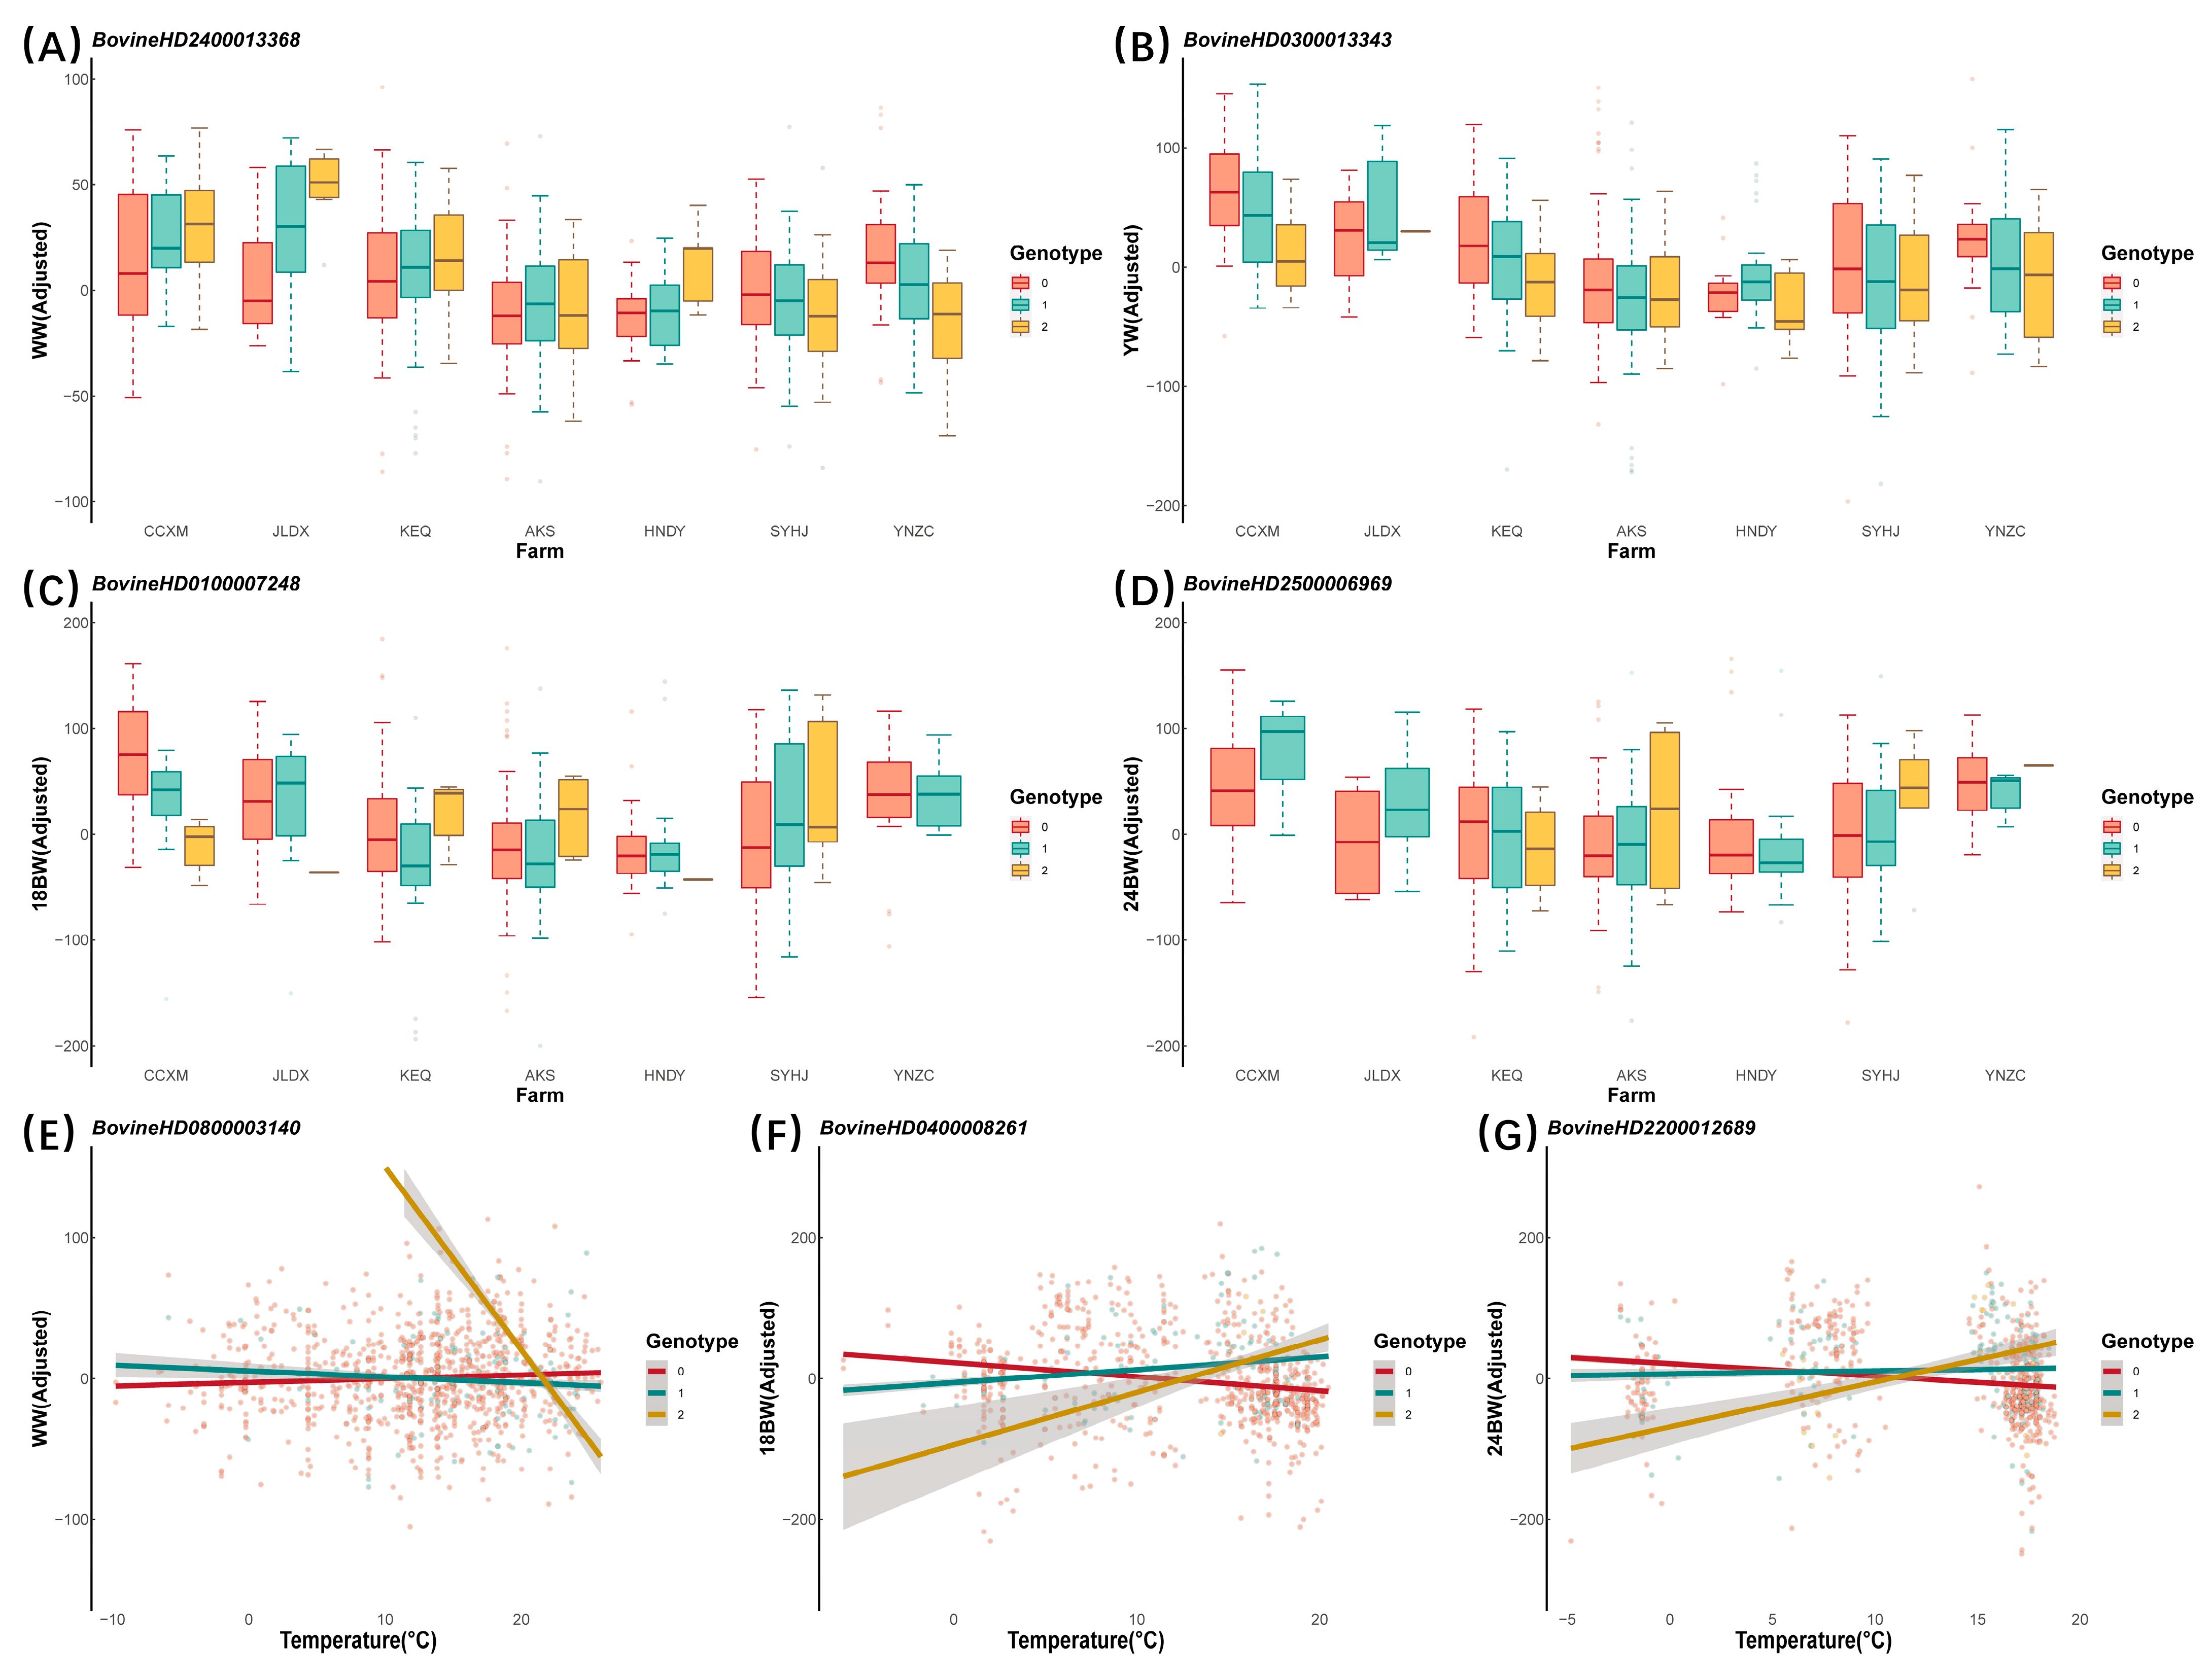
3.2. G × E Interacting SNPs Detected by GWEIS

We analyzed the single SNP-by-environment interactions between each of WW, YW, 18 BW, and 24 BW (N  = 777–1187; Table 1) and a total of 598,430 SNPs (minor allele frequency > 0.05; call rate > 0.9; see Section 2), from which we identified 29 independent SNPs (r2  <  0.8) for the four growth traits that showed G × E interaction effects at the standard genome-wide significance threshold (p  <  1/598,430 = 1.67 × 10⁻⁶; Table 2 and Figures S1–S8). As a result, a total of 12 and 10 candidate interaction genes from farms and monthly average temperature were located by those significant SNPs, respectively, and 4, 2, 10, and 7 of them were associated with WW, YW, 12 BW, and 24 BW (Table 2). Of these, with further Bonferroni correction (p < 0.05/598,430 = 8.36 × 10⁻⁸), seven SNPs were identified in the two environments, and the four traits remained significant and enriched to four genes: Proprotein Convertase Subtilisin/Kexin Type 5 (PCSK5), Filamin B (FLNB), Sterile Alpha and TIR Motif Containing 1 (SARM1), and Solute Carrier Family 46 Member 1 (SLC46A1).
Furthermore, we further visualized genotype re-ranking by plotting the phenotypic performance in response to environmental changes in the 29 identified independent SNPs in Figure 2 and Figures S9–S15. The 0, 1, and 2 corresponding to homozygous reference, heterozygous, and homozygous alternative genotypes were drawn with red, dark green, and golden. In this case, the superior genotypes of those SNPs would rearrange with either discrete (farm, Figure 2A–D and Figures S9–S11) or continuous (temperature, Figure 2E–G and Figures S12–S15) environmental variables. For instance, BovineHD2400013368 genotypes are ranked 2 > 1 > 0 in some farms (high latitudes such as CCXM or JLDX) and 0 > 1 > 2 in others (low latitudes such as SYHJ or YNZC) for the WW trait. The genotypes of BovineHD2400013368 exhibited negative pleiotropy and had an opposite effect across temperatures (as manifested in slope differences) for the WW trait. This verified the existence of G × E interaction regarding the change in traits-farm and/or traits-temperature.
These results contrast with traditional GWAS using the same covariates as GWEISs for the four growth traits, where eight independent significant SNPs were detected. For the 29 SNPs that showed significant G × E interactions at the standard genome-wide significance threshold (p < 1.67 × 10⁻⁶), we did not find any indication of significant main effects in GWAS (p > 0.05; Table 2).

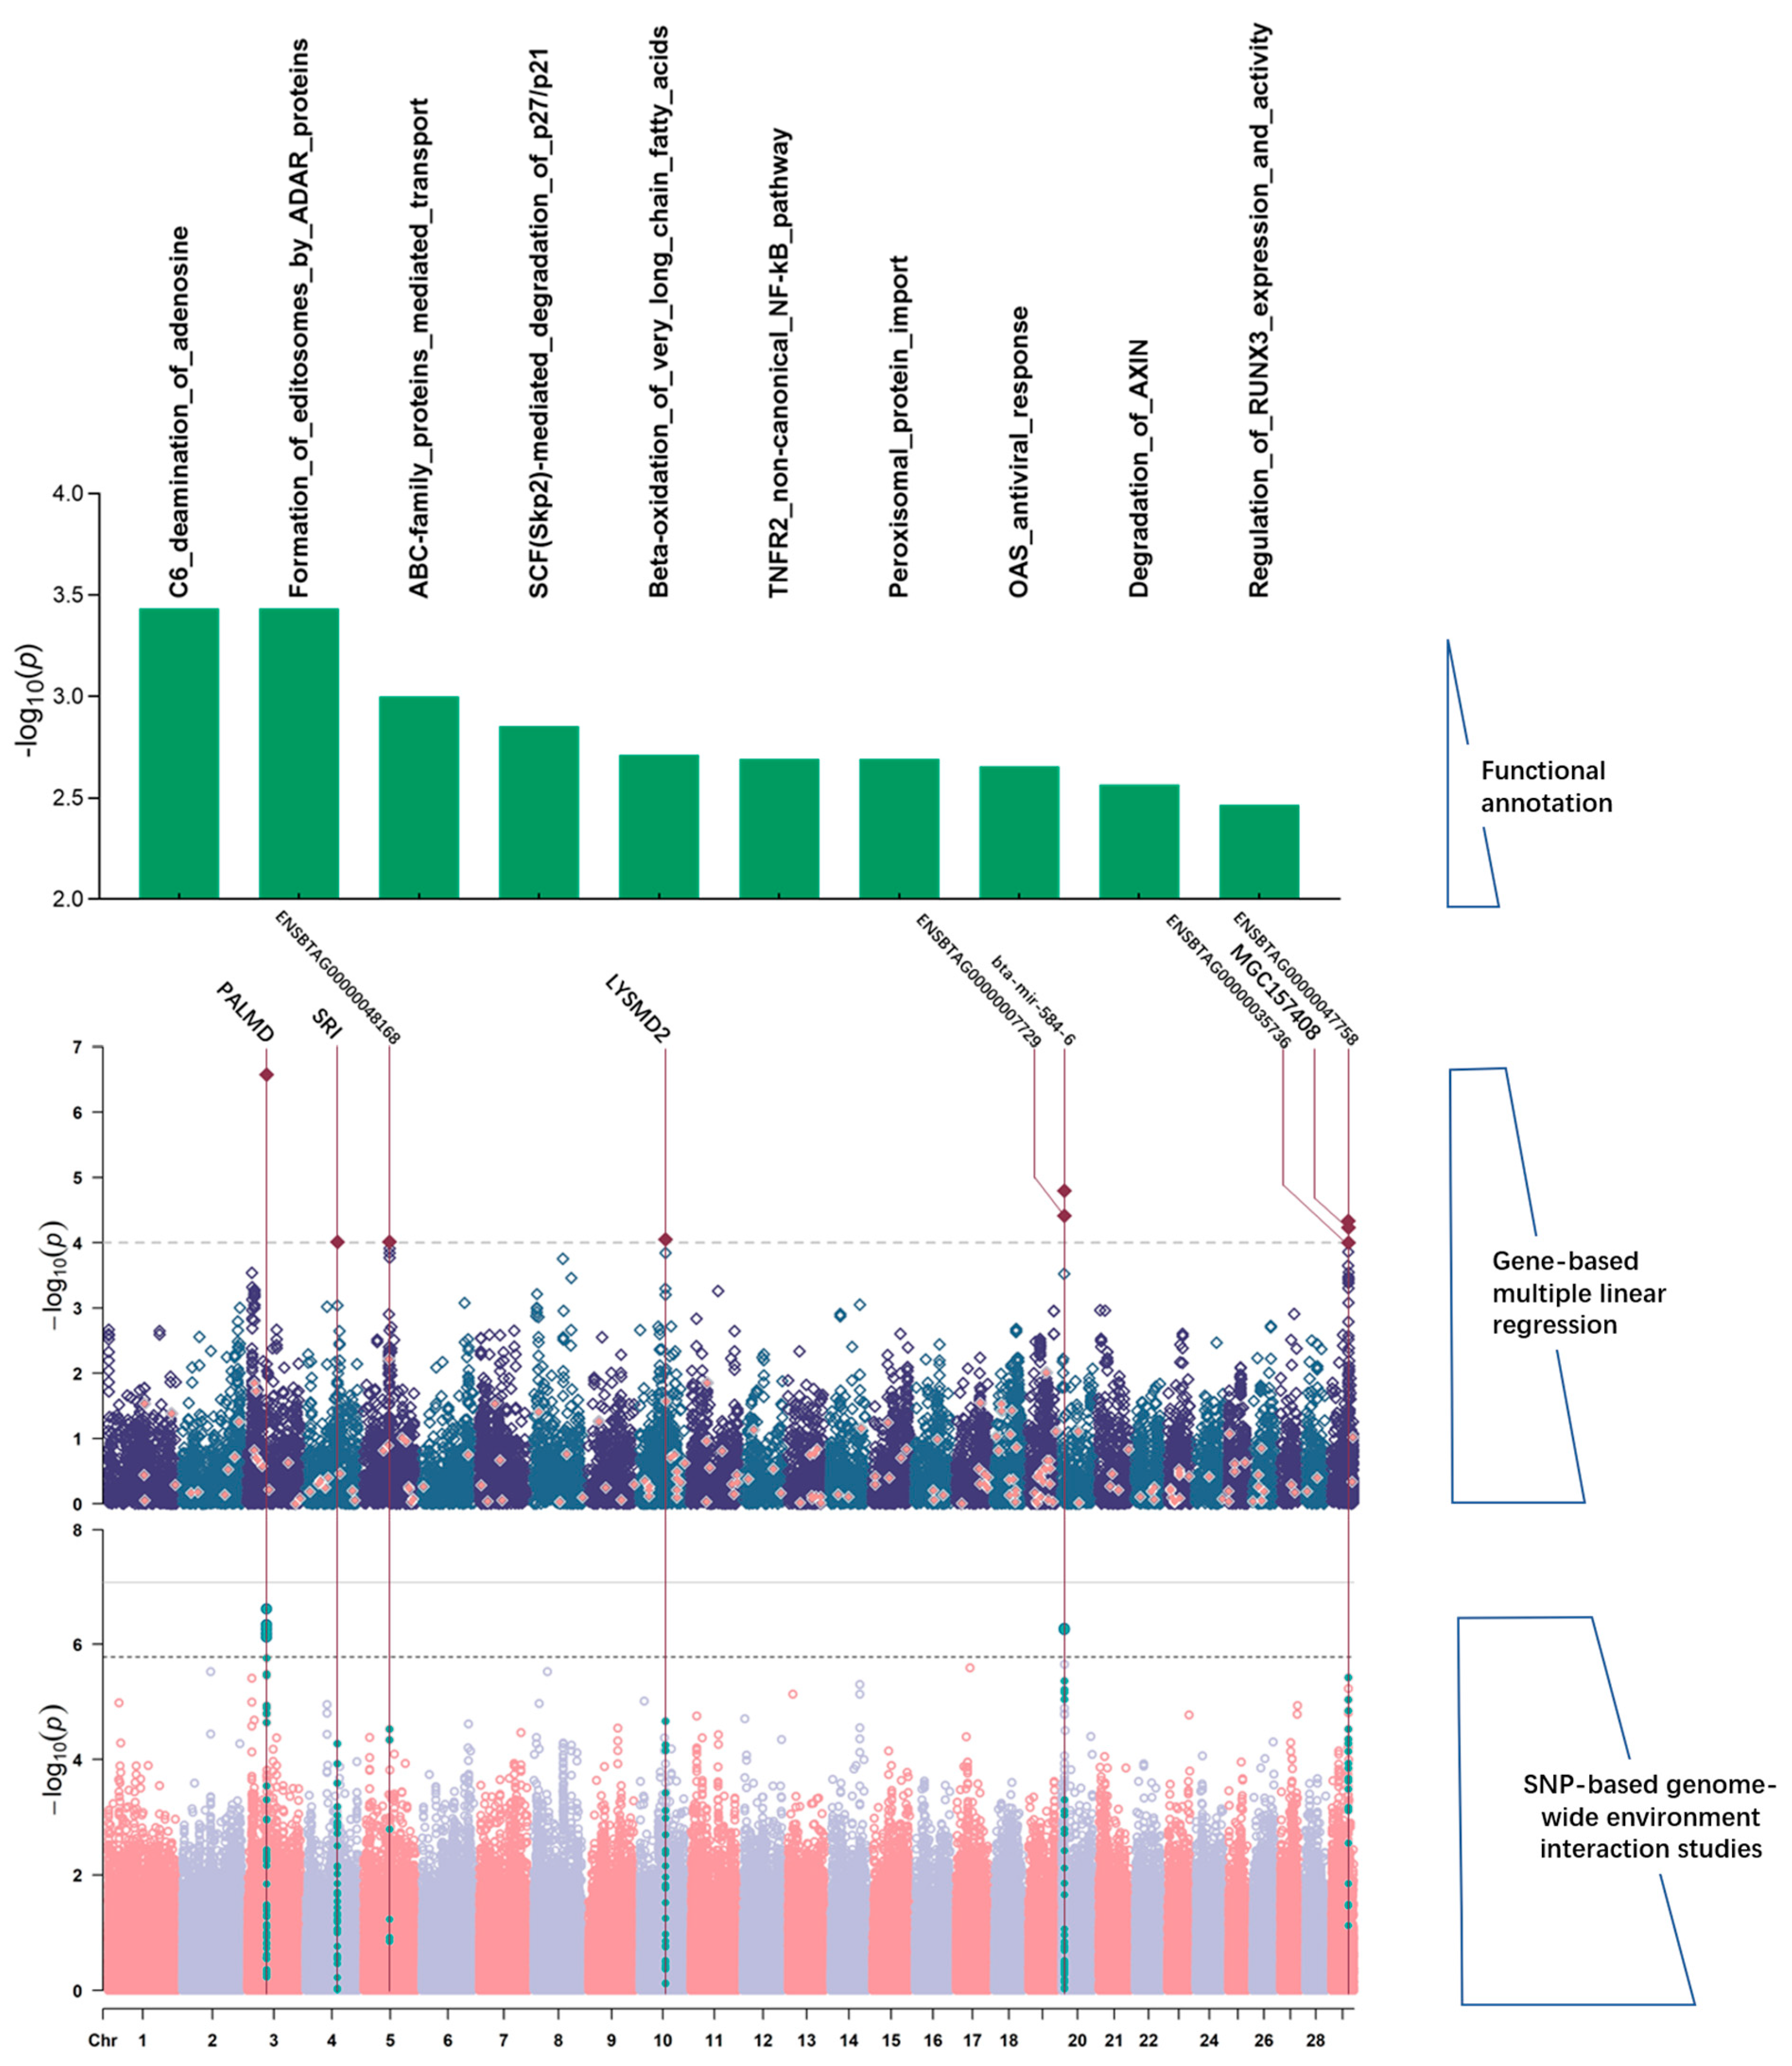
3.3. Genes and Gene Sets Implicated by SNP–Environment Interactions

To facilitate functional interpretation of the GWEIS results, we sought to clarify whether genome-wide SNP–environment interaction effects tended to aggregate within specific genes and gene sets (Figure 3). We performed genome-wide gene-based association studies for 23,305 genes conducted in Multi-Marker Analysis of GenoMic Annotation (MAGMA) using the interaction p-values from all the eight GWEISs as input (Figure 3 and Figures S16–S23). As a result, we found a total of 20 genes that reached standard genome-wide significance (p  <  1 × 10⁻⁴; Table 3); only one gene (Palmdelphin (PLAMD) in Farm-YW) remained significant under the further Bonferroni correction (p  <  0.05/23,305 = 2.14 × 10⁻⁶). In addition, three significant genes (SMAD2 (SMAD Family Member 2), PALMD, MECOM (MDS1 and EVI1 Complex Locus) in Farm-WW, Farm-YW, and Farm-18 BW, respectively) had been identified in the previous GWEIS analysis. Similar to the SNP-level results, the concordance between suggestive main and interaction effects at the gene level was low, and no genes were detected to achieve suggestibility significance in the main effect genes for all scenarios.
Further, to determine whether the most strongly associated genes for any environment (including sub-significant genes) tended to be overrepresented within particular pathways, we performed competitive gene-set and gene-property analyses in MAGMA using the results from the GWEIS-based gene-wise analyses as input. These analyses concerned 1283 gene sets (Reactome; see Section 2). At a p-value threshold of 1 × 10⁻⁴, 7 pathways from five scenarios were significant (Table 4). All of these pathways remain significant under the additional Bonferroni correction (p  <  0.05/1347 = 3.71 × 10⁻⁵; Table 4).

4. Discussion

In this study, we explored genome-wide gene–environment interactions of four growth traits (including weaning weight WW, yearling weight YW, the weight of 18 months 18 BW, and the weight of 24 months 24 BW) across two environmental factors (farm and mean monthly temperature). From all SNP-, gene-, and gene-set-based analyses, we detected independent 29 SNPs, 20 genes, and 7 gene sets that showed G × E effects at standard genome-wide significance thresholds, of which 20 SNPs, 5 genes, and 7 gene sets, respectively, remained significant under the further Bonferroni correction.
An important issue in the interaction model is heteroskedasticity, which refers to the observation that the variance of trait outcome differs among levels of environmental exposure, and this phenomenon violates the assumption that trait variance should be the same across individuals (homoskedasticity) in linear regression, with the result that substantial genome-wide inflation occurs [31]. Here, we incorporated robust standard errors often referred to as Huber–White, sandwich, or heteroskedasticity consistency errors [35,36] in model analysis, which are often considered to deal with misspecification of mean and variance assumptions in statistical models due to its heteroskedasticity insensitivity. Robust SEs are widely used in econometric, anthropomorphic [37], and biomarker [38] studies for correcting inflation, and also demonstrated effectiveness in gene–environment interaction studies [27,28,39]. The LD score regression results showed that the robust test corrected deviations present in model-based tests regardless of whether the environmental factors were discrete or continuous variables (manifested in this study as farm and temperature), demonstrating the strategy’s effectiveness and feasibility of GWIES in animal G × E analysis.
In contrast to previous studies, which suggested that the power for main effect detection was higher than that for interaction effects [40,41,42], we detected more significant interactions using GWEIS than those detected in a traditional GWAS on growth traits, which only detects eight independent SNPs with the same significance threshold, implying that the detection of traditional main effects compared to interaction effects may be more sensitive to the size of the sample population and individual source consistency. That is, when experimental samples come from uneven environments, the main effect of genotype may be obscured by the G × E that occurs due to environmental diversity. In addition, the interacting SNPs we identified under the standard significance threshold of GWEIS showed no evidence of suggestive main effects in GWAS, nor in the subsequent gene-based and gene-set analyses, implying that important interacting effects might be overlooked in the detection of main effects.
The farm effect is complex and should be emphasized in animal production since it involves many potential environmental factors that affect animal growth and development, such as management, nutrition level, and climate. Under all the GEWIS studies on growth traits with the farm as the environmental factor, we localized a total of 12 coding genes, and 3 of them showed significant interaction effects in the next gene-based analyses, namely SMAD2, PALMD, and MECOM, which were distributed on BTA 24, BTA 3, and BTA 1 associated with WW, 12 BW, and 18 BW, respectively. SMAD2 regulates a variety of cellular processes by mediating transforming growth factor (TGF)-β signaling and is involved in the regulation of reproduction and embryonic development in cattle [43]. Meanwhile, SMAD2 can regulate the level of myogenic inhibitors in the biological organism, thus participating in myofiber proliferation and affecting growth and development [44,45]. Furthermore, in a study of SAMD2 expression in thoracic aortic aneurysms (TAAs) of different etiologies, SAMD2 was found to be epigenetically regulated, implying the presence of environmental interactions [46]. The palmdelphin (PALMD) gene was differentially expressed between high- and low-yielding Holsten cattle and thus considered to be associated with milk production traits in cattle [47], while a study on production traits in pigs [48] found that gene polymorphisms of PALMD had a significant effect on backfat thickness. The PALMD also promotes basal progenitors (BPs) proliferation via integrin signaling, which is a necessary pathway for the evolutionary expansion of the mammalian neocortex [49]. The MECOM gene, also named EVI1, encodes a protein that is an oncoprotein that may be involved in hematopoiesis, apoptosis, development, and cell differentiation and proliferation [50], and has been identified as a candidate gene associated with lung weight and kidney weight in cattle in a previous GWAS on bovine visceral organ weights by An et al. [51]. In addition, MECOM has also been reported as a candidate gene associated with lung function and longissimus dorsi development in cattle [52,53]. Similarly, in a human blood-pressure-related gene–environment interaction study, MECOM exhibited a strong interaction with smoking [54]. These functional studies suggest that these three genes may be important target genes that play important roles in the regulation of growth and development in beef cattle and receive gene–environment interactions.
Contrary to expectations, our temperature-related G × E studies did not find overlapping genes between SNP- and gene-based interaction analyses, unlike the results from farm-related studies. Despite this lack of overlap, the 11 and 5 genes identified in SNP- and gene-based interaction analyses under temperature G × E conditions were predominantly associated with crucial aspects of growth and development, such as fat deposition (HMBOX1 [55]; FLNB [56]), feed efficiency (BNIP1 [4]), and heat stress (SARM1 [56]). A possible explanation for this phenomenon is that, compared to the single unidimensional variable of temperature, the farm variable not only encompasses climatic factors but also considers environmental effects that are difficult to measure, such as feed quality and management, and this integrative environmental factor guarantees the ability to detect environmentally sensitive loci. Another explanation is that the temperature was set as a continuous variable in this study; however, the animals themselves develop adaptations that determine that they are insensitive to temperature fluctuations within a certain interval, so the effect of G × E may be more pronounced in the early developmental stages [57]. These findings support the importance of including environmental interaction effects in multi-population genomic prediction, and using the G × E SNPs detected in this study to support breeding decisions may yield benefits for animal production performance.
Gene-set analysis was considered to identify biological processes that were significantly regulated by the collective influence of subtle perturbations to multiple functional genes [58]. In our study, gene-set-based pathway analyses using MAGMA yielded seven significant gene sets and remained significant with additional Bonferroni correction threshold (p < 0.05/1283 = 3.90 × 10⁻⁵), clustered around functional pathways related to growth and development such as cell disaggregated proliferation, fatty acid β-oxidation, gap junctions, and keratin sulfate. For instance, polo-like kinases (Plks) are cell cycle-regulating serine/threonine kinases that play important roles in cell–cell mitosis, spindle formation, and cytoplasmic division [59]. Gap junctions are specialized intercellular junctions between multiple animal cell types that affect the development of embryos, tissues, and organs [60,61]. Gene-set analysis of GWEIS data considers the G × E interaction contained in most genetic makers to identify functionally annotated collections of genes enriched for phenotypic association, and although the results may be variably driven by the diversity of gene sets collected, it is an attractive strategy for gaining insight into biological mechanisms.

5. Conclusions

In this study, we introduced a robust estimator into our model to control inflation caused by heteroskedasticity and performed genome-wide gene–environment interactions association analysis for four growth traits and two environmental factors in beef cattle. Through this approach, we detected a few genetic markers affecting growth traits that did not show significant main effects in traditional GWAS, demonstrating that functional loci may have non-additive effects across genotypes but are obliterated by environmental means. Further follow-up testing on whether these reciprocal loci tend to cluster in genes or gene sets reveals the biological mechanisms by which genetic factors modulate the response to environmental influences on performance. Our results revealed novel interactions between genetic loci, genes, and candidate biological mechanisms associated with growth traits, providing new insights into environmental adaptation and the resolution of genetic mechanisms influencing growth traits in beef cattle. These findings prompt further investigation into how these genetic loci can be effectively integrated into breeding programs to enhance resilience and performance in diverse environmental conditions.

Supplementary Materials

The following supporting information can be downloaded at: https://www.mdpi.com/article/10.3390/ani14111695/s1, Figure S1: Manhattan plot of GWEIS results for Farm-WW; Figure S2: Manhattan plot of GWEIS results for Farm-YW; Figure S3: Manhattan plot of GWEIS results for Farm-18BW; Figure S4: Manhattan plot of GWEIS results for Farm-24BW; Figure S5: Manhattan plot of GWEIS results for Temperature-WW; Figure S6: Manhattan plot of GWEIS results for Temperature-YW; Figure S7: Manhattan plot of GWEIS results for Temperature-18 BW; Figure S8: Manhattan plot of GWEIS results for Temperature-24 BW; Figure S9: Interaction plot of significant SNPs for Farm-WW; Figure S10: Interaction plot of significant SNPs for Farm-YW; Figure S11: Interaction plot of significant SNPs for Farm-18 BW; Figure S12: Interaction plot of significant SNPs for Farm-24 BW; Figure S13: Interaction plot of significant SNPs for Temperature-WW; Figure S14: Interaction plot of significant SNPs for Temperature-18 BW; Figure S15: Interaction plot of significant SNPs for Temperature-24 BW; Figure S16: Manhattan plot of MAGMA gene analysis results for Farm-WW; Figure S17: Manhattan plot of MAGMA gene analysis results for Farm-YW; Figure S18: Manhattan plot of MAGMA gene analysis results for Farm-18 BW; Figure S19: Manhattan plot of MAGMA gene analysis results for Farm-24 BW; Figure S20: Manhattan plot of MAGMA gene analysis results for temperature-WW; Figure S21: Manhattan plot of MAGMA gene analysis results for temperature-YW; Figure S22: Manhattan plot of MAGMA gene analysis results for temperature-18 BW; Figure S23: Manhattan plot of MAGMA gene analysis results for temperature-24 BW.

Author Contributions

Conceptualization, T.D. and H.G.; methodology, T.D. and K.L.; software, T.D., K.L. and L.D.; formal analysis, T.D. and M.L.; investigation, L.Q. and S.Q.; data curation, K.L., L.D. and Q.X.; writing—original draft preparation, T.D. and K.L.; writing—review and editing, T.D., M.L., K.L. and L.D.; visualization, T.D. and K.L.; supervision, X.L., J.L. and H.G.; project administration, L.X., L.Z., X.G. and H.G.; funding acquisition, H.G. and J.L. All authors have read and agreed to the published version of the manuscript.

Funding

This research was supported by the National Natural Science Foundations of China (32172693), the Science and Technology Project of Inner Mongolia Autonomous Region (2020GG0210), the Program of National Beef Cattle and Yak Industrial Technology System (CARS-37).

Institutional Review Board Statement

The research was undertaken with the approval of the ethics committee of the Institute of Animal Sciences, Chinese Academy of Agricultural Sciences (CAAS), Beijing, China (approval number: RNL09/07). The China Council on Animal Care’s (CCAC) recommended guidelines were strictly followed in all procedures.

Informed Consent Statement

Written informed consent has been obtained from the Farm owners.

Data Availability Statement

The datasets are available upon request from the National Center of Beef Cattle Genetic Evaluation, Beijing, China (Email: [email protected]).

Acknowledgments

The authors would like to thank all members of the Cattle Breeding Innovative Research Team for sample collection as well as all staff at the cattle experimental unit for animal fattening.

Conflicts of Interest

The authors declare no conflicts of interest.

References

  1. Utsunomiya, Y.T.; do Carmo, A.S.; Carvalheiro, R.; Neves, H.H.; Matos, M.C.; Zavarez, L.B.; Pérez O’Brien, A.M.; Sölkner, J.; McEwan, J.C.; Cole, J.B.; et al. Genome-wide association study for birth weight in Nellore cattle points to previously described orthologous genes affecting human and bovine height. BMC Genet. 2013, 14, 52. [Google Scholar] [CrossRef] [PubMed]
  2. Brito Lopes, F.; da Silva, M.C.; Magnabosco, C.U.; Goncalves Narciso, M.; Sainz, R.D. Selection Indices and Multivariate Analysis Show Similar Results in the Evaluation of Growth and Carcass Traits in Beef Cattle. PLoS ONE 2016, 11, e0147180. [Google Scholar] [CrossRef] [PubMed]
  3. Frankham, R. Introduction to quantitative genetics (4th edn). Trends Genet. 1996, 12, 280. [Google Scholar] [CrossRef]
  4. Seabury, C.M.; Oldeschulte, D.L.; Saatchi, M.; Beever, J.E.; Decker, J.E.; Halley, Y.A.; Bhattarai, E.K.; Molaei, M.; Freetly, H.C.; Hansen, S.L.; et al. Genome-wide association study for feed efficiency and growth traits in U.S. beef cattle. BMC Genom. 2017, 18, 386. [Google Scholar] [CrossRef] [PubMed]
  5. Bolormaa, S.; Hayes, B.J.; Savin, K.; Hawken, R.; Barendse, W.; Arthur, P.F.; Herd, R.M.; Goddard, M.E. Genome-wide association studies for feedlot and growth traits in cattle. J. Anim. Sci. 2011, 89, 1684–1697. [Google Scholar] [CrossRef] [PubMed]
  6. Tabery, J.; Griffiths, P.E. Historical and Philosophical Perspectives on Behavioral Genetics and Developmental Science. In Handbook of Developmental Science, Behavior, and Genetics; Hood, K.E., Halpern, C.T., Greenberg, G., Lerner, R.M., Eds.; Blackwell Publishing Ltd.: Chichester, UK, 2010; pp. 39–60. [Google Scholar]
  7. Caspi, A.; McClay, J.; Moffitt, T.E.; Mill, J.; Martin, J.; Craig, I.W.; Taylor, A.; Poulton, R. Role of genotype in the cycle of violence in maltreated children. Science 2002, 297, 851–854. [Google Scholar] [CrossRef] [PubMed]
  8. Uher, R.; Zwicker, A. Etiology in psychiatry: Embracing the reality of poly-gene-environmental causation of mental illness. World Psychiatry 2017, 16, 121–129. [Google Scholar] [CrossRef] [PubMed]
  9. Rutter, M. Gene-environment interdependence. Dev. Sci. 2007, 10, 12–18. [Google Scholar] [CrossRef]
  10. Falconer, D.S. Introduction to Quantitative Genetics; Pearson Education India: Delhi, India, 1996. [Google Scholar]
  11. Williams, J.L.; Bertrand, J.K.; Misztal, I.; Łukaszewicz, M. Genotype by environment interaction for growth due to altitude in United States Angus cattle. J. Anim. Sci. 2012, 90, 2152–2158. [Google Scholar] [CrossRef]
  12. Bradford, H.L.; Fragomeni, B.O.; Bertrand, J.K.; Lourenco, D.A.L.; Misztal, I. Genetic evaluations for growth heat tolerance in Angus cattle. J. Anim. Sci. 2016, 94, 4143–4150. [Google Scholar] [CrossRef]
  13. Shi, R.; Brito, L.F.; Liu, A.; Luo, H.; Chen, Z.; Liu, L.; Guo, G.; Mulder, H.; Ducro, B.; van der Linden, A.; et al. Genotype-by-environment interaction in Holstein heifer fertility traits using single-step genomic reaction norm models. BMC Genom. 2021, 22, 193. [Google Scholar] [CrossRef]
  14. Gillberg, J.; Marttinen, P.; Mamitsuka, H.; Kaski, S. Modelling G×E with historical weather information improves genomic prediction in new environments. Bioinformatics 2019, 35, 4045–4052. [Google Scholar] [CrossRef] [PubMed]
  15. Song, H.; Zhang, Q.; Ding, X. The superiority of multi-trait models with genotype-by-environment interactions in a limited number of environments for genomic prediction in pigs. J. Anim. Sci. Biotechnol. 2020, 11, 88. [Google Scholar] [CrossRef] [PubMed]
  16. Hou, L.; Bergen, S.E.; Akula, N.; Song, J.; Hultman, C.M.; Landén, M.; Adli, M.; Alda, M.; Ardau, R.; Arias, B.; et al. Genome-wide association study of 40,000 individuals identifies two novel loci associated with bipolar disorder. Hum. Mol. Genet. 2016, 25, 3383–3394. [Google Scholar] [CrossRef] [PubMed]
  17. Meyer, K. Factor-analytic models for genotype x environment type problems and structured covariance matrices. Genet. Sel. Evol. 2009, 41, 21. [Google Scholar] [CrossRef] [PubMed]
  18. Xu, X.; Shi, G.; Nehorai, A. Meta-regression of gene-environment interaction in genome-wide association studies. IEEE Trans. Nanobioscience 2013, 12, 354–362. [Google Scholar] [CrossRef] [PubMed]
  19. Barker, H.L.; Holeski, L.M.; Lindroth, R.L. Independent and interactive effects of plant genotype and environment on plant traits and insect herbivore performance: A meta-analysis with Salicaceae. Funct. Ecol. 2019, 33, 422–435. [Google Scholar] [CrossRef]
  20. Winham, S.J.; Biernacka, J.M. Gene-environment interactions in genome-wide association studies: Current approaches and new directions. J. Child Psychol. Psychiatry Allied Discip. 2013, 54, 1120–1134. [Google Scholar] [CrossRef] [PubMed]
  21. Børglum, A.D.; Demontis, D.; Grove, J.; Pallesen, J.; Hollegaard, M.V.; Pedersen, C.B.; Hedemand, A.; Mattheisen, M.; Uitterlinden, A.; Nyegaard, M.; et al. Genome-wide study of association and interaction with maternal cytomegalovirus infection suggests new schizophrenia loci. Mol. Psychiatry 2014, 19, 325–333. [Google Scholar] [CrossRef]
  22. Thomas, D. Gene—Environment-wide association studies: Emerging approaches. Nat. Rev. Genet. 2010, 11, 259–272. [Google Scholar] [CrossRef]
  23. Aguilar, I.; Legarra, A.; Cardoso, F.; Masuda, Y.; Lourenco, D.; Misztal, I. Frequentist p-values for large-scale-single step genome-wide association, with an application to birth weight in American Angus cattle. Genet. Sel. Evol. 2019, 51, 28. [Google Scholar] [CrossRef] [PubMed]
  24. Kerin, M.; Marchini, J. Inferring Gene-by-Environment Interactions with a Bayesian Whole-Genome Regression Model. Am. J. Hum. Genet. 2020, 107, 698–713. [Google Scholar] [CrossRef] [PubMed]
  25. Su, G.; Madsen, P.; Lund, M.S.; Sorensen, D.; Korsgaard, I.R.; Jensen, J. Bayesian analysis of the linear reaction norm model with unknown covariates. J. Anim. Sci. 2006, 84, 1651–1657. [Google Scholar] [CrossRef] [PubMed]
  26. Voorman, A.; Lumley, T.; McKnight, B.; Rice, K. Behavior of QQ-plots and genomic control in studies of gene-environment interaction. PLoS ONE 2011, 6, e19416. [Google Scholar] [CrossRef] [PubMed]
  27. Werme, J.; van der Sluis, S.; Posthuma, D.; de Leeuw, C.A. Genome-wide gene-environment interactions in neuroticism: An exploratory study across 25 environments. Transl. Psychiatry 2021, 11, 180. [Google Scholar] [CrossRef] [PubMed]
  28. Ye, J.; Cheng, S.; Chu, X.; Wen, Y.; Cheng, B.; Liu, L.; Liang, C.; Kafle, O.P.; Jia, Y.; Wu, C.; et al. Associations between electronic devices use and common mental traits: A gene-environment interaction model using the UK Biobank data. Addict. Biol. 2022, 27, e13111. [Google Scholar] [CrossRef] [PubMed]
  29. Chen, Y.; Pan, C.; Cheng, S.; Li, C.; Zhang, H.; Zhang, Z.; Zhang, J.; Yao, Y.; Meng, P.; Yang, X.; et al. The interaction of early life factors and depression-associated loci affecting the age at onset of the depression. Transl. Psychiatry 2022, 12, 294. [Google Scholar] [CrossRef] [PubMed]
  30. Hayes, A.F.; Cai, L. Using heteroskedasticity-consistent standard error estimators in OLS regression: An introduction and software implementation. Behav. Res. Methods 2007, 39, 709–722. [Google Scholar] [CrossRef] [PubMed]
  31. Almli, L.M.; Duncan, R.; Feng, H.; Ghosh, D.; Binder, E.B.; Bradley, B.; Ressler, K.J.; Conneely, K.N.; Epstein, M.P. Correcting systematic inflation in genetic association tests that consider interaction effects: Application to a genome-wide association study of posttraumatic stress disorder. JAMA Psychiatry 2014, 71, 1392–1399. [Google Scholar] [CrossRef]
  32. de Leeuw, C.A.; Mooij, J.M.; Heskes, T.; Posthuma, D. MAGMA: Generalized gene-set analysis of GWAS data. PLoS Comput. Biol. 2015, 11, e1004219. [Google Scholar] [CrossRef]
  33. Wang, K.; Li, M.; Bucan, M. Pathway-based approaches for analysis of genomewide association studies. Am. J. Hum. Genet. 2007, 81, 1278–1283. [Google Scholar] [CrossRef] [PubMed]
  34. Bulik-Sullivan, B.K.; Loh, P.R.; Finucane, H.K.; Ripke, S.; Yang, J.; Patterson, N.; Daly, M.J.; Price, A.L.; Neale, B.M.; Schizophrenia Working Group of the Psychiatric Genomics Consortium. LD Score regression distinguishes confounding from polygenicity in genome-wide association studies. Nat. Genet. 2015, 47, 291–295. [Google Scholar] [CrossRef] [PubMed]
  35. White, H. A heteroskedasticity-consistent covariance matrix estimator and a direct test for heteroskedasticity. Econometrica 1980, 48, 817–838. [Google Scholar] [CrossRef]
  36. Huber, P.J. The behavior of maximum likelihood estimates under nonstandard conditions. In Proceedings of the Fifth Berkeley Symposium on Mathematical Statistics and Probability: Weather Modification, Berkeley, CA, USA, 21 June–18 July 1965; University of California: Berkeley, CA, USA, 1967; p. 221. [Google Scholar]
  37. Gao, S.K.; Beresford, S.A.; Frank, L.L.; Schreiner, P.J.; Burke, G.L.; Fitzpatrick, A.L. Modifications to the Healthy Eating Index and its ability to predict obesity: The Multi-Ethnic Study of Atherosclerosis. Am. J. Clin. Nutr. 2008, 88, 64–69. [Google Scholar] [CrossRef] [PubMed]
  38. Lakhani, S.R.; van de Vijver, M.J.; Jacquemier, J.; Anderson, T.J.; Osin, P.P.; McGuffog, L.; Easton, D.F. The pathology of familial breast cancer: Predictive value of immunohistochemical markers estrogen receptor, progesterone receptor, HER-2, and p53 in patients with mutations in BRCA1 and BRCA2. J. Clin. Oncol. 2002, 20, 2310–2318. [Google Scholar] [CrossRef]
  39. Tchetgen Tchetgen, E.J.; Kraft, P. On the robustness of tests of genetic associations incorporating gene-environment interaction when the environmental exposure is misspecified. Epidemiology 2011, 22, 257–261. [Google Scholar] [CrossRef]
  40. Liu, D.J.; Leal, S.M. A novel adaptive method for the analysis of next-generation sequencing data to detect complex trait associations with rare variants due to gene main effects and interactions. PLoS Genet. 2010, 6, e1001156. [Google Scholar] [CrossRef]
  41. Smith, J.L.; Wilson, M.L.; Nilson, S.M.; Rowan, T.N.; Schnabel, R.D.; Decker, J.E.; Seabury, C.M. Genome-wide association and genotype by environment interactions for growth traits in U.S. Red Angus cattle. BMC Genom. 2022, 23, 517. [Google Scholar]
  42. Braz, C.U.; Rowan, T.N.; Schnabel, R.D.; Decker, J.E. Genome-wide association analyses identify genotype-by-environment interactions of growth traits in Simmental cattle. Sci. Rep. 2021, 11, 13335. [Google Scholar] [CrossRef]
  43. Zhang, K.; Rajput, S.K.; Lee, K.B.; Wang, D.; Huang, J.; Folger, J.K.; Knott, J.G.; Zhang, J.; Smith, G.W. Evidence supporting a role for SMAD2/3 in bovine early embryonic development: Potential implications for embryotropic actions of follistatin. Biol. Reprod. 2015, 93, 86. [Google Scholar] [CrossRef]
  44. Sartori, R.; Milan, G.; Patron, M.; Mammucari, C.; Blaauw, B.; Abraham, R.; Sandri, M. Smad2 and 3 transcription factors control muscle mass in adulthood. Am. J. Physiol. Cell Physiol. 2009, 296, C1248–C1257. [Google Scholar] [CrossRef]
  45. Welle, S.L. Myostatin and muscle fiber size. Focus on “Smad2 and 3 transcription factors control muscle mass in adulthood” and “Myostatin reduces Akt/TORC1/p70S6K signaling, inhibiting myoblast differentiation and myotube size”. Am. J. Physiol. Cell Physiol. 2009, 296, C1245–C1247. [Google Scholar] [CrossRef] [PubMed]
  46. Gomez, D.; Coyet, A.; Ollivier, V.; Jeunemaitre, X.; Jondeau, G.; Michel, J.-B.; Vranckx, R. Epigenetic control of vascular smooth muscle cells in Marfan and non-Marfan thoracic aortic aneurysms. Cardiovasc. Res. 2011, 89, 446–456. [Google Scholar] [CrossRef] [PubMed]
  47. Seo, M.; Lee, H.-J.; Kim, K.; Caetano-Anolles, K.; Jeong, J.Y.; Park, S.; Oh, Y.K.; Cho, S.; Kim, H. Characterizing milk production related genes in Holstein using RNA-seq. Asian-Australas. J. Anim. Sci. 2016, 29, 343–351. [Google Scholar]
  48. Martínez-Montes, A.M.; Fernández, A.; Pérez-Montarelo, D.; Alves, E.; Benítez, R.M.; Nuñez, Y.; Óvilo, C.; Ibañez-Escriche, N.; Folch, J.M.; Fernández, A.I. Using RNA-Seq SNP data to reveal potential causal mutations related to pig production traits and RNA editing. Anim. Genet. 2017, 48, 151–165. [Google Scholar] [CrossRef] [PubMed]
  49. Kalebic, N.; Gilardi, C.; Stepien, B.; Wilsch-Bräuninger, M.; Long, K.R.; Namba, T.; Florio, M.; Langen, B.; Lombardot, B.; Shevchenko, A.; et al. Neocortical Expansion Due to Increased Proliferation of Basal Progenitors Is Linked to Changes in Their Morphology. Cell Stem Cell 2019, 24, 535–550.e9. [Google Scholar] [CrossRef]
  50. De Weer, A.; Van der Meulen, J.; Rondou, P.; Taghon, T.; Konrad, T.A.; De Preter, K.; Mestdagh, P.; Van Maerken, T.; Van Roy, N.; Jeison, M.; et al. EVI1-mediated down regulation of MIR449A is essential for the survival of EVI1 positive leukaemic cells. Br. J. Haematol. 2011, 154, 337–348. [Google Scholar] [CrossRef] [PubMed]
  51. An, B.; Xia, J.; Chang, T.; Wang, X.; Miao, J.; Xu, L.; Zhang, L.; Gao, X.; Chen, Y.; Li, J.; et al. Genome-wide association study identifies loci and candidate genes for internal organ weights in Simmental beef cattle. Physiol. Genom. 2018, 50, 523–531. [Google Scholar] [CrossRef]
  52. Canive, M.; Fernandez-Jimenez, N.; Casais, R.; Vázquez, P.; Lavín, J.L.; Bilbao, J.R.; Blanco-Vázquez, C.; Garrido, J.M.; Juste, R.A.; Alonso-Hearn, M. Identification of loci associated with susceptibility to bovine paratuberculosis and with the dysregulation of the MECOM, eEF1A2, and U1 spliceosomal RNA expression. Sci. Rep. 2021, 11, 313. [Google Scholar] [CrossRef]
  53. Liu, R.; Liu, X.; Bai, X.; Xiao, C.; Dong, Y. Identification and Characterization of circRNA in Longissimus Dorsi of Different Breeds of Cattle. Front. Genet. 2020, 11, 565085. [Google Scholar] [CrossRef]
  54. Sung, Y.J.; de Las Fuentes, L.; Schwander, K.L.; Simino, J.; Rao, D.C. Gene-smoking interactions identify several novel blood pressure loci in the Framingham Heart Study. Am. J. Hypertens. 2015, 28, 343–354. [Google Scholar] [CrossRef] [PubMed]
  55. Sevane, N.; Armstrong, E.; Wiener, P.; Pong Wong, R.; Dunner, S.; GemQual Consortium. Polymorphisms in twelve candidate genes are associated with growth, muscle lipid profile and meat quality traits in eleven European cattle breeds. Mol. Biol. Rep. 2014, 41, 4721–4731. [Google Scholar] [CrossRef]
  56. Martins, R.; Machado, P.C.; Pinto, L.F.B.; Silva, M.R.; Schenkel, F.S.; Brito, L.F.; Pedrosa, V.B. Genome-wide association study and pathway analysis for fat deposition traits in nellore cattle raised in pasture–based systems. J. Anim. Breed. Genet. 2021, 138, 360–378. [Google Scholar] [CrossRef] [PubMed]
  57. Heim, C.; Binder, E.B. Current research trends in early life stress and depression: Review of human studies on sensitive periods, gene-environment interactions, and epigenetics. Exp. Neurol. 2012, 233, 102–111. [Google Scholar] [CrossRef] [PubMed]
  58. Subramanian, A.; Tamayo, P.; Mootha, V.K.; Mukherjee, S.; Ebert, B.L.; Gillette, M.A.; Paulovich, A.; Pomeroy, S.L.; Golub, T.R.; Lander, E.S.; et al. Gene set enrichment analysis: A knowledge-based approach for interpreting genome-wide expression profiles. Proc. Natl. Acad. Sci. USA 2005, 102, 15545–15550. [Google Scholar] [CrossRef]
  59. Barr, F.A.; Silljé, H.H.W.; Nigg, E.A. Polo-like kinases and the orchestration of cell division. Nat. Rev. Mol. Cell Biol. 2004, 5, 429–440. [Google Scholar] [CrossRef]
  60. Donahue, H.J.; Li, Z.; Zhou, Z.; Yellowley, C.E. Differentiation of human fetal osteoblastic cells and gap junctional intercellular communication. Am. J. Physiol. Cell Physiol. 2000, 278, C315–C322. [Google Scholar] [CrossRef]
  61. Cronier, L.; Frendo, J.-L.; Defamie, N.; Pidoux, G.; Bertin, G.; Guibourdenche, J.; Pointis, G.; Malassiné, A. Requirement of gap junctional intercellular communication for human villous trophoblast differentiation. Biol. Reprod. 2003, 69, 1472–1480. [Google Scholar] [CrossRef] [PubMed]
Figure 1. QQ-Plots for the GWEIS analysis using traditional model-based (blue) and robust (green) variance estimator. (AD) QQ-Plots of −log10 (p-value) for the weaning weight (WW), the yearling weight (YW), the body weight of 18 months (18 BW), and the body weight of 24 months (24 BW) across farms, respectively. (EH) QQ-Plots of −log10 (p-value) for WW, YW, 18 BW, and 24 BW across temperatures, respectively. β0 denotes LD score intercepts (with standard errors) from LDSC.
Animals 14 01695 g001
Figure 2. Interaction plots of phenotypes changing over environment factors for different genotypes of significant SNPs. The 0, 1, and 2 corresponding to homozygous reference, heterozygous, and homozygous alternative genotypes are drawn with red, turquoise, and golden. The y-axis is the phenotype of growth traits that have been adjusted for sex, first birth weight, and age of days. The x-axis represents environmental variables, where the environmental variables are farms in the (AD) and temperature in the (EG). Only a single significant SNP is shown for each trait-environment case, while other significant SNPs are shown in Supplemental Figures.
Animals 14 01695 g002
Figure 3. Overview and results of SNP-based, gene-based, and pathway enrichment G × E interaction studies for YW-Farm. Bottom: Manhattan plot showing the −log10 p-values of SNP–environment interaction from the GWEIS. Gene labels have been annotated to suggestively significant (p < 1/598,430 = 1.67 × 10⁻⁶) intragenic SNPs with the lowest p-value. Manhattan plot showing each genomic risk locus which maps to the significant interacting genes in gene-based analysis (green). Middle: Manhattan plot showing the −log10 p-values for the MAGMA gene analysis (based on the GWEIS SNP–environment interaction results). Suggestively significant genes (p < 1 × 10⁻⁴) have been annotated with claret. The pink dots represent the genes contained in the gene set used for subsequent mapping. Top: Pathways in the top 10 of −log10 p-value in MAGMA gene-set analysis enrichment.
Animals 14 01695 g003
Table 1. Descriptive statistics (Mean ± SD, kg) on growth traits of Huaxi Cattle.
FarmsNWWYW18 BW24 BW
MaleFemaleMaleFemaleMaleFemaleMaleFemale
CCXM70258.75 ± 51.38279.31 ± 36.58478.04 ± 48.73391.46 ± 35.55684.5 ± 83.42494.31 ± 47.76839.96 ± 82.45589.08 ± 68.9
JLDX35228.74 ± 32.81 470.53 ± 61.07 637.91 ± 68.14 807.55 ± 68.89
KRQ238234.54 ± 61.26213.48 ± 30.05444.54 ± 55.11357.13 ± 38.95645.33 ± 94.81459.31 ± 36.73817.68 ± 82.2522 ± 38.38
AKS379165.2 ± 64.1152.83 ± 49.64366.12 ± 69.66274.5 ± 57.64594.59 ± 102.3382.82 ± 46.78769.97 ± 155.6447.67 ± 52.59
HNDY72184.26 ± 27.37171.93 ± 34.29495.78 ± 43.5475.83 ± 49.14711.5 ± 47.91534.86 ± 47.8880.74 ± 45.06574.5 ± 58.82
SYHJ437194.97 ± 24.12208.99 ± 22.86369 ± 39.58285.03 ± 30.32559.67 ± 76.88372.94 ± 35.19740.91 ± 68.86457.19 ± 46.13
YN119243.12 ± 56.2232.91 ± 41.74458.17 ± 47.55398.09 ± 30.34685.6 ± 30.9506.43 ± 50.12814.43 ± 54.47588.17 ± 58.02
Total13501187959836777
Name of traits: WW weaning weight, YW yearling weight, 18 BW body weight of 18 months, and 24 BW body weight of 24 months.
Table 2. Significant SNPs with G × E interactions identified in the GWEIS.
EnvironmentTraitSNPBTA 1POS 2GenePGWEISPGWAS
FarmsWWBovineHD0300020017367,574,825AK51.03 × 10−60.614
BovineHD24000133682447,983,708SMAD21.11 × 10−60.243
YWBovineHD0300013343343,785,038PALMD2.45 × 10−70.975
BovineHD2000001962206,217,212MIR584-65.39 × 10−70.407
18 BWBovineHD24000070242425,954,580DSG2,
DSG3
1.71 × 10−70.614
BovineHD0900021567977,291,417NHSL12.06 × 10−70.853
ARS-BFGL-NGS-586062134,730,593CYP11A1,
CCDC33
9.11 × 10−70.271
BTB-0164368748,200,949CDK149.50 × 10−70.667
BovineHD0100028293199,131,999MECOM1.23 × 10−60.011
BovineHD16000215311675,288,520-1.42 × 10−60.600
BovineHD0100007248124,519,328ROBO21.59 × 10−60.249
24 BWBovineHD25000069692524,706,966-7.55 × 10−8 *0.982
BovineHD02000333912115,898,667RHBDD11.20 × 10−60.412
TemperatureWWBovineHD0700013465746,699,643-2.50 × 10−70.304
BovineHD080000314089,686,754HMBOX14.14 × 10−70.165
BovineHD19000091991931,126,798DNAH91.57 × 10−60.277
18 BWBovineHD0400011664442,477,921-4.30 × 10−8 *0.368
BovineHD0800015785852,604,454PCSK55.20 × 10−8 *0.796
BovineHD2000001524204,793,312BNIP18.65 × 10−80.712
BovineHD0600020848674,944,109-1.61 × 10−70.328
BovineHD0900023319983,628,109-7.59 × 10−70.857
ARS-BFGL-NGS-96591104,157,289-8.63 × 10−70.484
BovineHD0800014102847,106,702TRPM39.57 × 10−70.761
BovineHD0400008261428,773,445-1.07 × 10−60.554
24 BWBovineHD22000126892243,774,319FLNB6.15 × 10−8 *0.021
BovineHD29000061042921,265,657-6.42 × 10−8 *0.985
BovineHD20000058482019,541,201MIR5826.61 × 10−8 *0.641
BovineHD19000058411920,432,774SARM1,
SLC46A1
7.05 × 10−8 *0.581
BovineHD1000001235104,037,591PGGT1B,
CCDC112
2.46 × 10−70.729
SNPs from all GWEIS analyses with a p-value below the standard genome-wide significance threshold (p < 1/598,430 = 1.67 × 10⁻⁶). Name of traits: WW weaning weight, YW yearling weight, 18 BW body weight of 18 months, and 24 BW body weight of 24 months. 1 Bos Taurus Autosome. 2 POS: Position (bp) on ARS-UCD1.2. * = remain significant under the Bonferroni correction (p < 0.05/598,430 = 8.36 × 10⁻⁸).
Table 3. Genes implicated in MAGMA gene analysis.
EnvironmentTraitGeneBTAPOSSTARTPOSSTOPPGWEISPGWAS
FarmsWWSMAD22447,921,04748,072,0604.58 × 10−60.466
IQCN74,825,6784,954,6881.57 × 10−50.500
CIST174,793,4424,960,6735.25 × 10−50.579
YWPALMD343,638,10343,798,1312.66 × 10−7 *0.773
MIR584-6206,189,9186,289,9931.59 × 10−50.231
ENSBTAG00000007729206,155,3006,256,2173.88 × 10−50.295
ENSBTAG000000477582939,060,43039,165,3944.64 × 10−50.005
MGC1574082939,407,51339,516,6955.89 × 10−50.024
LYSMD21058,681,53158,794,5068.85 × 10−50.264
ENSBTAG00000048168559,242,31559,343,2549.68 × 10−50.302
SRI472,724,52572,846,8249.72 × 10−50.059
ENSBTAG000000357362939,491,47839,600,9439.98 × 10−50.008
18 BWMECOM199,040,97299,193,2891.57 × 10−50.016
KREMEN2252,322,4712,427,3633.49 × 10−50.999
24 BWENSBTAG000000466332169,135,85569,236,3826.31 × 10−50.669
TemperatureWWABCC102316,911,89817,031,8802.08 × 10−50.029
DLK22316,931,80617,036,0602.10 × 10−50.029
TJAP12316,951,34817,075,3744.34 × 10−50.109
LRRC732316,975,85817,078,6556.35 × 10−50.120
YIPF32316,981,09317,085,3608.49 × 10−50.127
Results from MAGMA gene analysis of 23,305 genes, using the GWEIS interaction p-values as input (p < 1 × 10⁻⁴); * = gene remain significant under the additional Bonferroni correction for the number of environments analyzed (p < 0.05/23,305 = 2.14 × 10⁻⁶).
Table 4. Gene sets enriched in the MAGMA gene-set analyses.
EnvironmentTraitPathwayPGWEISPGWAS
FarmsWWMitotic Telophase/Cytokinesis7.66 × 10−10 *0.106
Polo-like kinase-mediated events1.27 × 10−5 *0.162
24 BWMitochondrial Fatty Acid Beta-Oxidation5.16 × 10−7 *0.288
TemperatureWWReduction in cytosolic Ca++ levels2.29 × 10−5 *0.906
YWFormation of annular gap junctions9.08 × 10−6 *0.230
Gap junction degradation1.87 × 10−5 *0.429
24 BWKeratan sulfate degradation1.59 × 10−8 *0.069
Results from MAGMA analysis of 1283 Reactome gene sets (p < 1 × 10⁻⁴). * = gene sets that remain significant under the Bonferroni correction (p < 0.05/1283 = 3.90 × 10⁻⁵).
Disclaimer/Publisher’s Note: The statements, opinions and data contained in all publications are solely those of the individual author(s) and contributor(s) and not of MDPI and/or the editor(s). MDPI and/or the editor(s) disclaim responsibility for any injury to people or property resulting from any ideas, methods, instructions or products referred to in the content.

