Article

Comprehensive Metagenomic Analysis of Veterinary Probiotics in Broiler Chickens

1
Department of Pharmacology and Toxicology, University of Veterinary Medicine, István utca 2, H-1078 Budapest, Hungary
2
National Laboratory of Infectious Animal Diseases, Antimicrobial Resistance, Veterinary Public Health and Food Chain Safety, University of Veterinary Medicine Budapest, H-1078 Budapest, Hungary
3
Centre for Bioinformatics, University of Veterinary Medicine, István utca 2, H-1078 Budapest, Hungary
4
Veterinary Medical Research Institute, Hungária krt. 21, H-1143 Budapest, Hungary
5
One Health Institute, University of Debrecen, Nagyerdei krt. 98, H-4032 Debrecen, Hungary
6
National Public Health Center, Albert Flórián út 2-6, H-1097 Budapest, Hungary
7
Department of Gerontology, Faculty of Health Sciences, University of Debrecen, Sóstói út 2-4, H-4400 Nyíregyháza, Hungary
8
Department of Microbiology and Infectious Diseases, University of Veterinary Medicine, István utca 2, H-1078 Budapest, Hungary
9
Autovakcina Kft., Szabadság sgrt. 57, H-1171 Budapest, Hungary
*
Author to whom correspondence should be addressed.
Animals 2024, 14(13), 1927; https://doi.org/10.3390/ani14131927
Submission received: 26 May 2024 / Revised: 21 June 2024 / Accepted: 28 June 2024 / Published: 29 June 2024
(This article belongs to the Collection Application of Antibiotic Alternatives in the Poultry Industry)

Abstract

:

Simple Summary

Probiotics are beneficial bacteria used to improve health, but they might also carry genes that resist antibiotics, known as antimicrobial resistance genes (ARGs). These genes can transfer between bacteria, potentially leading to drug-resistant infections, a serious public health concern. In this study, we focused on probiotics used in broiler chickens—a key sector of the poultry industry due to their economic value and widespread consumption. Using advanced genetic sequencing techniques, we examined whether probiotics carry ARGs that could be transferred through mobile genetic elements like plasmids or phages. We also monitored changes in the gut bacteria and resistance genes in response to different probiotic treatments. Furthermore, we assessed how the genetic traits correlate with actual resistance to antibiotics by measuring the minimum inhibitory concentration (MIC) of drugs against the bacteria.

Abstract

Probiotics are widely used in broiler chickens to support the gut microbiome, gut health, and to reduce the amount of antibiotics used. Despite their benefits, there is concern over their ability to carry and spread antimicrobial resistance genes (ARGs), posing a significant public health risk. This study utilized next-generation sequencing to investigate ARGs in probiotics approved for poultry, focusing on their potential to be transferred via mobile genetic elements such as plasmids and phages. We examined the gut microbiome and resistome changes in 60 broiler chickens over their rearing period, correlating these changes with different probiotic treatments. Specific resistance mechanisms against critically important antibiotics were identified, including genes related to fluoroquinolone resistance and peptide antibiotic resistance. We also found genes with significant relevance to public health (aadK, AAC(6′)-Ii) and multiple drug-resistance genes (vmlR, ykkC, ykkD, msrC, clbA, eatAv). Only one phage-encoded gene (dfrA43) was detected, with no evidence of plasmid or mobile genetic element transmission. Additionally, metagenomic analysis of fecal samples showed no significant changes corresponding to time or diet across groups. Our findings highlight the potential risks associated with the use of probiotics in poultry, particularly regarding the carriage of ARGs. It is crucial to conduct further research into the molecular genetics of probiotics to develop strategies that mitigate the risk of resistance gene transfer in agriculture, ensuring the safe and effective use of probiotics in animal husbandry.

1. Introduction

The term “probiotic” was first employed in 1974 to describe beneficial microorganisms that, when administered orally in suitable quantities, have positive effects on the host organism [1]. Probiotics are recognized for their immunomodulatory effects, facilitated by their interaction with intestinal epithelial cells and associated immune cells via receptors or direct adhesion [2,3]. Probiotic organisms compete with pathogens by adhering to the intestinal walls, effectively displacing harmful bacteria [4,5]. Additionally, probiotics can inhibit toxin production by pathogens, offering an antitoxin effect [6], and also produce bacteriocins such as lactic acid or hydrogen peroxide, which suppress the growth of certain pathogens [7]. Probiotics, along with other alternatives such as plant essential oils [8], antimicrobial peptides [9], or propolis [10,11,12,13], can be effective tools in preventing the spread of antimicrobial resistance (AMR) by partially or completely replacing the use of antibiotics.
Despite these advantages, probiotics also present risks. They can contribute to the development of various infections, such as fungemia caused by Saccharomyces cerevisiae or Saccharomyces boulardii [14,15,16,17,18], and there have been multiple reported cases of sepsis linked to species like Lactobacillus, Bacillus subtilis, or Bifidobacterium breve [19,20,21,22]. The potential excessive immunostimulatory effects of probiotics might also be problematic, as they can influence both innate and adaptive immune functions, triggering excessive immune responses that may lead to autoimmune diseases [23,24]. These contradictory experiences of probiotic use have led to their marketing solely as supplements, rather than as approved therapeutic agents [25,26]. A comprehensive study in 2011 concluded that although clinical trials have not proven increased health risks from probiotics, the available literature is insufficient to definitively confirm their safety [27].
The misuse of antibiotics and the related social and economic trends over the past few decades have significantly accelerated the selection and spread of resistant bacteria, with resistance-related deaths beginning to increase significantly [28]. Currently, around 700,000 deaths per year are linked to AMR, and estimates suggest this could rise to 10 million per year by 2050 if antibiotic use continues at the current rate and new therapies are not developed [29]. Notably, global human antibiotic use increased by 70% between 2000 and 2010 [30].
Because of their widespread use and the fact that probiotic ARG carriage may contribute to the spread of antimicrobial resistance [31], it is crucial to investigate the role of probiotics in the transfer of antimicrobial resistance genes (ARGs). Probiotics must not become a source of specific resistance genes [32], but this issue has not yet been agreed upon globally. Key organizations, including the Biosafety Assessment of Probiotics used for Human Consumption (PROSAFE), the Assessment and Critical Evaluation of Antibiotic Resistance Transferability in Food Chain (ACE-ART) project, and the Joint International Organization for Standardization-International Dairy Federation (ISO-IDF), are addressing this topic [33,34,35]. Metagenomic analyses have shown that environmental factors and probiotic feeding can influence ARG levels in feces. For instance, one study found that feeding Bacillus coagulans as a probiotic strain significantly increased the appearance of aminoglycoside ARGs in the feces of laying hens exposed to lead [36]. To address the current situation, it is essential to establish up-to-date regulations for probiotics, including antimicrobial resistance (AMR) testing. Additionally, guidelines for their proper use and disposal should be introduced [37]. New acute and long-term risks associated with probiotics have emerged, highlighting the need to update safety recommendations for these products [38].
The most commonly used probiotic strains belong to the genera Lactobacillus, Lactococcus, Bacillus, Enterococcus, and Bifidobacterium [39,40]. However, Enterococcus species, which harbor numerous ARGs, may not be the most suitable probiotic strains due to their potential for resistance gene transfer [41,42,43] and the fact that their health benefits have been clinically demonstrated in a limited number of cases [44,45].
Antibacterial resistance can be advantageous for probiotic strains to survive antibiotic treatment. However, these genes can be transmitted vertically or horizontally between bacteria. The gastrointestinal tract of higher organisms provides favorable conditions for gene transfer. In contrast, this process does not pose a threat in the case of yeasts, as there is no gene transfer between yeasts and bacteria, making their use considered safe [46]. It is important to distinguish between intrinsic antimicrobial resistance, which is not horizontally transferable, and acquired antimicrobial resistance, which can be transferred through various routes in probiotic strains. For instance, Lactobacillus species exhibit intrinsic resistance to several antibiotic groups, including aminoglycosides, glycopeptides, nucleic acid synthesis inhibitors, and folate synthesis inhibitors [47]. Generally, they are sensitive to penicillins and β-lactam inhibitors but show reduced sensitivity to cephalosporins. Nonetheless, several studies have reported resistance to penicillin G in various isolates [48,49,50]. Current research findings are often contradictory, necessitating more extensive and in-depth studies. Some research indicates that feeding preparations containing Bacillus licheniformis with different bacterial genomes affects the amount of antimicrobial resistance genes (ARGs) in the cecal and colonic contents of chickens [51]. In contrast, other studies suggest that a significant proportion of ARGs in the gut microbiome are acquired ARGs [52]. Metagenomic studies have demonstrated that feeding probiotics, in combination with various environmental factors, can influence the quantity of ARGs in the gut [36].
Our study aims to assess the safety of probiotics in poultry, focusing on the potential transfer of antimicrobial resistance genes within the gut microbiome of broiler chickens, thereby contributing to safer long-term agricultural practices.

2. Materials and Methods

2.1. Conditions of the Animal Experiment

The animal experiment was conducted at the Animal House of the Department of Pharmacology and Toxicology, University of Veterinary Medicine, Budapest. The animal experiments were approved by the ethical committee of the Veterinary University of Budapest (Licence No. ÁTET/EA/23/2022), the result of Act No. 28 of 1998.3. § (9), as well as 40/2013. 1. § (4), (c), and especially points (f) of the Government Decree; they are not classified as examination adversely affecting animal welfare, so no ethical permit is required. The experiment involved mixing five different probiotic products with feed and giving them to 60 day-old Ross308 broiler chicks sourced from Pipi-Tér Bt. (Bábolna TETRA Ltd., Budapest, Hungary). Before arrival, chicks were vaccinated with Hatchback AVINEW, Hatchback IBD120, and RISMAVAC + CA126 at the hatchery.
The chicks were housed in cages designed to meet animal welfare standards, with environmental conditions adjusted according to their age (Supplementary Table S1). Each chick was uniquely identified by a numbered tag attached to its foot, facilitating the tracking of weekly weight gain and the collection of fecal samples. The chicks were fed ad libitum with broiler starter (0–14 days), broiler grower (15–30 days), and broiler finishing (31–42 days) feed (Supplementary Table S2) and had access to fresh drinking water daily.

2.2. The Probiotic Products Tested and Their Dosage

Five different probiotic products, authorized for use in poultry feed, were selected (Table 1). For ARG analysis, 1 g samples of each product were sent for genome analysis using next-generation sequencing.
The selection of probiotic products was based not only on their relevance to poultry research but also on their widespread use and the antimicrobial gene profiles obtained through next-generation sequencing (NGS). This selection is significant not only for animal health but also for public health. The products were specifically chosen to include strains with the highest risk and the most ARGs to thoroughly investigate their impact and behavior. NGS testing was conducted prior to selection to identify those strains that carry significant ARGs, allowing us to study their potential for ARG transfer and the implications for both animal and human health. This approach ensures a comprehensive understanding of the risks associated with these probiotic strains.
A total of 60 animals were divided into six groups, with 10 animals per group. The first group, serving as the control, was not administered probiotics. The remaining five groups were given the manufacturers’ recommended dosages of the selected probiotic products from day 5 until the end of rearing on day 42. The dosages were as follows: BioPlus YC was administered at 4 g/10 kg of feed, Agroferm M+C at 7 g/10 kg of feed; Ecobiol WX at 1 g/10 kg of feed; Gastroferm M+C at 7 g/10 kg of feed; and Fecinor Soluble Plus at 1 g/10 kg of feed. The probiotics were uniformly mixed into the feed using a planetary feed mixer, with a homogenization time of two hours per 10 kg of feed.

2.3. Measurement of Animal Body Weight and Sampling

Animal body weight was measured individually using a scale once a week. Cloaca swab samples for sequencing were collected twice during the rearing period: at day-old age before the treatment, and after the treatment. Fecal samples were taken directly from the cloaca using a sterile AMIES sampler (Biolab Zrt., Budapest, Hungary), individually from each animal, allowing for the comparison of sequencing results by individually marking the animals. The initial sampling occurred on day 4, followed by a final sampling at the end of the rearing period on day 42. In the case of the group fed Ecobiol WX, animals were sampled twice at each time point using sterile swabs. For all sampled animals, 3 mL of sterile phosphate buffer solution was measured into sampling tubes in a sterile cabin prior to collection, and fecal samples were subsequently stored at −80 °C until sequencing. For the Ecobiol WX group, 3 mL of tryptone soy broth (TSB) was also measured into the second sampling tube under a laminar box for further enrichment culture.
The differences in body weight gain among the groups were compared with the control group for each product and statistically analyzed using two-way ANOVA [53] with R version 4.1.0 [54].

2.4. Analysis of Phenotypic Expression

The phenotypic expression of antimicrobial resistance was assessed by determining the minimum inhibitory concentration (MIC) of isolated probiotic strains against specific antibiotics, which have animal and public health significance. An inoculating loop of isolated bacteria was placed in a sterile tube containing 3 mL of Mueller–Hinton broth (MHB) and incubated at 37 °C for 18–24 h the day before testing. Stock solutions of test substances (Merck KGaA, Darmstadt, Germany) were prepared according to Clinical Laboratory Standards Institute (CLSI) methodology [55]. In the 96-well microtiter plate (VWR International, LLC, Debrecen, Hungary), all columns except the first were filled with 90 µL of MHB, and the first column received 180 µL of the stock solution. A two-fold dilution series was prepared by transferring 90 µL from the first column into the second column, thoroughly mixing 3–4 times. This process was continued to column 10, where the excess 90 µL was discarded.
Next, the bacterial suspension, adjusted to a 0.5 McFarland standard, was inoculated onto the plates [55]. From column 11 of the working plates, containing two dilution lines and working backwards, 10 µL of bacterial suspension was added to each well. Column 11 served as a positive control, receiving both tap water and bacterial suspension but no active substance, while column 12 acted as a negative control, containing only tap water, with no bacteria or active substance.
Evaluation of the MICs was performed using an SWIN automatic MIC reader and the VIZION system (CheBio Development Ltd., Budapest, Hungary). Breakpoints for each antimicrobial agent were determined based on CLSI and the European Committee on Antimicrobial Susceptibility Testing (EUCAST) guidelines. Escherichia coli (ATCC 25922) was used as the reference isolate.
Tiamulin and florfenicol were selected based on resistance-encoding genes of public health significance identified in the sequencing of Ecobiol WX. The two antibiotics were enriched in broth containing half the MIC concentration (32 µg/mL for tiamulin and 2 µg/mL for florfenicol). Samples were separately taken from the treated groups to select for resistant microbial strains. The samples were then kept in the enrichment broth at 37 °C for 18–24 h.

2.5. Next Generation Sequencing (NGS)

Probiotic products were sequenced using an Illumina NextSeq 500 system [56]. DNA was extracted from 1 g of each product using the QIAmp DNA kit (Qiagen, Hilden, Germany) following the manufacturer’s protocol. Fecal samples were sequenced on a NovaSeq PE150 platform [57], with DNA extractions also performed using the QIAmp DNA kit, according to the manufacturer’s protocol. For the bead shaking required to liberate bacterial genetic material, a Qiagen TissueLyzer LT (Qiagen GmBH, Hilden, Germany) was used at 50 Hz for 5 min. The extracted nucleic acid was stored at −20 °C until use. Illumina’s sequencing procedure utilizes a “paired-end” technique where strands are anchored with oligonucleotides in a bridge amplification. The complementary strand is then synthesized and bridged, followed by the removal of the reverse strand. Fluorescently labeled nucleotides are read during sequencing, allowing for high accuracy in the identification of the genetic sequences [58,59].
In total, 28 pooled samples were sequenced—four from each group. For each sequenced sample, five samples from each group were combined to produce two samples for sequencing, at both the beginning and end of the experiment. For next-generation sequencing, DNA libraries were prepared using the Illumina® Nextera XT DNA Library Preparation Kit (Illumina, San Diego, CA, USA). Indexes from the Nextera XT Index Kit v2 Set A (Illumina, San Diego, CA, USA) were used to uniquely label DNA fragments. First, nucleic acid samples were diluted to a concentration of 0.2 ng/µL in a final volume of 2.5 µL and mixed with 5 µL of Tagment DNA buffer and 2.5 µL of Amplicon Tagment Mix reagent for the tagmentation reaction. The reaction mixture was incubated at 55 °C for 6 min in an Eppendorf Mastercycler nexus GX2 (Eppendorf SE, Hamburg, Germany) and then cooled to 10 °C. Subsequently, 2.5 µL of Neutralize Tagment buffer was immediately added and incubated for 5 min at room temperature.
For DNA library preparation, 7.5 µL of Nextera PCR Master Mix was combined with 2.5 µL each of i5 and i7 index primers and added to the tagmented DNA sample for PCR amplification. The PCR program consisted of an initial denaturation at 95 °C for 30 s, followed by 12 cycles of 95 °C for 10 s, 55 °C for 30 s, and 72 °C for 30 s, with a final elongation step at 72 °C for 5 min, after which the samples were cooled to 10 °C. The resulting indexed DNA library was purified using a Gel/PCR DNA Fragments Extraction Kit (Geneaid Biotech, Xinpei, Taiwan) following the column purification protocol. The purified libraries were then quantified fluorometrically using a Qubit® dsDNA HS Assay Kit (Thermo Fisher Scientific, Waltham, MA, USA). Finally, DNA libraries with individual adapters were diluted to the appropriate concentration and mixed for sequencing.

2.6. Bioinformatics Data Analysis

Quality control of the raw sequence data was conducted using FastQC v0.11.9 [60], and Fastp v0.23.2-3 [61] and Bloocoo v1.0.7 [62] were used to filter out and correct possible adapter sequences, unbalanced base pair distributions, and poor-quality regions. Invalid sequences were filtered out using TrimGalore v0.6.6 [63]. The reads were then assembled into longer sequences (contigs) using MEGAHIT v1.2.9 [64]. The results from the two assemblies were then combined to produce an even-higher-quality draft genome using GAM-NGS v1.1b [65]. Contigs underwent quality control assessment using QUAST software [66]. To exclude fragments of the domestic fowl genome contained within the gut contents, read sequences were aligned to the reference genome of Gallus gallus (NCBI identifier: GRCg6a) using Bowtie2 software [67]. Taxonomic classification of sequences was performed using Kraken2 [68] software against the NCBI nucleotide database [69]. Analysis was carried out in an R-environment [54], utilizing phyloseq [70] and microbiome [71] packages. Bacterial origin sequences were constructed using metaSPAdes [72] software. Open reading frames (ORFs) from the resulting contigs were determined using Prodigal v2.6.3 [73]. ARG identification among ORFs was conducted using the Resistance Gene Identifier (RGI) v5.1.0 in comparison with The Comprehensive Antibiotic Resistance Database (CARD) [74]; only genes meeting the STRICT threshold defined by CARD and showing at least 95% sequence identity and coverage were considered. During the taxonomic analyses, the Shannon diversity index, Mann–Whitney test, and NMDS ordination analysis were performed using R version 4.1.0. [54].
The identified resistance genes were analyzed for potential mobility using MobileElementFinder v1.0.3 [75], considering only ARGs located within the longest transposon distance defined for a given microorganism in the database. The plasmid origin of contigs was investigated using PlasFlow v1.1 software [76], and phage encoding of the genes was assessed using VirSorter v2.2.2 [77] software.

3. Results

3.1. Animal Body Weight Gain

Weight gain for each group was calculated on a weekly basis, as shown in Figure 1. Body mass increased steadily throughout the duration of the trial. Statistical analysis revealed no significant differences between the control group (Group I) and the other treated groups (Supplementary Table S3). However, Group II (BioPlus YC) and Group IV (Ecobiol WX) demonstrated notably higher (but not significant) average weight gains compared to the control. The standard weight gain expected for the Ross308 breed was consistently met or exceeded by the groups receiving each formulation. Notably, by week 4 of life, weight gains in Group II had increased by 5%, in Group IV by 6%, in Group V (Gastroferm M+C) by 3%, and in Group VI (Fecinor Soluble Plus) by 3%. At week 5, Groups II and IV continued to show enhanced weight gains of 3% over the control.
No statistically significant differences were observed between the final body weights of any of the experimental groups and the control group (Group I). However, from a commercial perspective, measurements showing a positive mean weight difference of at least 5% compared to the control group were deemed relevant. This criterion was met in 42% of the cases for group averages. Notably, Group IV consistently exhibited a weight difference greater than 5% compared to the control group (exception in week 5). To achieve statistically significant results, it is recommended that the sample size be increased in future studies.

3.2. Results of NGS Regarding the Probiotic Products

The antimicrobial resistance genes (ARGs) identified in each probiotic product following sequencing are detailed in Table 2. A key mechanism of resistance, enzymatic inactivation, was observed in several samples. Notably, the aadk gene, responsible for aminoglycoside resistance and originating from Bacillus spp., was identified in BioPlus YC. The AAC(6’)-Ii gene, another aminoglycoside resistance gene but of Enterococcus spp. origin, was detected in Agroferm M+C, Gastroferm M+C, and Fecinor Soluble Plus.
Additionally, BioPlus YC was found to contain the mphk gene, which is associated with macrolide antibiotic resistance. Among the target mutations, the mprF gene warrants special attention, as it has been identified in BioPlus YC and linked to peptide antibiotic resistance. Furthermore, the diaminopyrimidine resistance gene dfrA43 was identified in Ecobiol WS. Despite being encoded by a dsDNA phage from Bacillus spp., it exhibited relatively low coverage (82.56%) and identity (35.75%), highlighting the complexity of accurately assessing gene origins and functions.
Most efflux-pump-related genes, including those responsible for fluoroquinolone resistance (blt, bmr) and peptide antibiotic resistance (bcrA, bcrB), were identified in BioPlus YC. Additionally, the efmA gene, which codes for an efflux pump conferring resistance to both macrolides and fluoroquinolones, was found in both Agroferm M+C and Gastroferm M+C. The presence of the ykkC and ykkD genes in BioPlus YC, which are associated with multi-resistance to aminoglycosides, tetracyclines, and phenicols, is also notable. Importantly, no mobile genetic elements (MGEs) were identified, and no antimicrobial resistance genes (ARGs) encoded on plasmids were detected.

3.3. Phenotypic Analysis of Probiotic Strains

In the Bacillus licheniformis and Bacillus subtilis strains from BioPlus YC, no antimicrobial resistance genes (ARGs) related to penicillins were identified, indicating phenotypic sensitivity. Resistance to gentamicin, demonstrated by high minimum inhibitory concentrations (MICs) of 8 and 16 µg/mL, is attributable to the expression of the aadK gene (enzymatic inactivation) and the ykkC and ykkD genes (efflux pumps). The high MIC values for oxytetracycline (8 µg/mL) in Bacillus licheniformis and for doxycycline (32 µg/mL) in Bacillus subtilis suggest resistance mechanisms involving the vmlR gene (target mutation) or the ykkC and ykkD genes (efflux pumps). Clindamycin resistance (32 µg/mL) in the former strain could be due to the vmlR or ermD genes (target mutations) or the lmrB gene (efflux pump). In both strains, high tiamulin MICs (64 µg/mL) were linked to the vmlR gene (target mutation).
For Agroferm M+C, all identified ARGs are of Enterococcus origin, with inherent resistance to cephalosporins indicated by a ceftriaxone MIC of 16 µg/mL, although generally showing sensitivity to penicillins. Gentamicin resistance (32 µg/mL) may be mediated by the AAC(6’)-Ii gene (enzymatic inactivation), and florfenicol resistance (8 µg/mL) may involve the msrC or eatAv genes (target mutations). These genes are also implicated in the high tiamulin MICs (64 µg/mL), a resistance pattern observed similarly in Lactobacillus plantarum. MIC values for probiotic strains are detailed in Table 3 and Table 4.
For Ecobiol WX, resistance to tiamulin (64 µg/mL) was associated with the clbA gene (target mutation). In Lactobacillus plantarum, Pediococcus acidilactici, and Enterococcus faecium, gentamicin resistance (32 µg/mL) may be attributed to the AAC(6’)-Ii gene (enzymatic inactivation). In Pediococcus acidilactici, resistance to oxytetracycline (32 µg/mL) and doxycycline (16 µg/mL) could be caused by the msrC or eatAv genes (target mutation). Additionally, all three strains exhibited resistance to florfenicol (8 µg/mL) and tiamulin (>64 µg/mL), potentially due to activation of the msrC or eatAv genes (target mutation).
For Fecinor Soluble Plus, observed aminoglycoside resistance (32 µg/mL) could be linked to the AAC(6’)-Ii gene (enzymatic inactivation). Resistance to florfenicol (8 µg/mL) and tiamulin (64 µg/mL) may also result from activation of the msrC or eatAv genes (target mutation) [78]. The elevated MIC values for other active substances suggest inherent (ab ovo) resistance. However, to conclusively determine which phenotypic resistance manifestations result from gene activation, further transcriptomic studies are required.

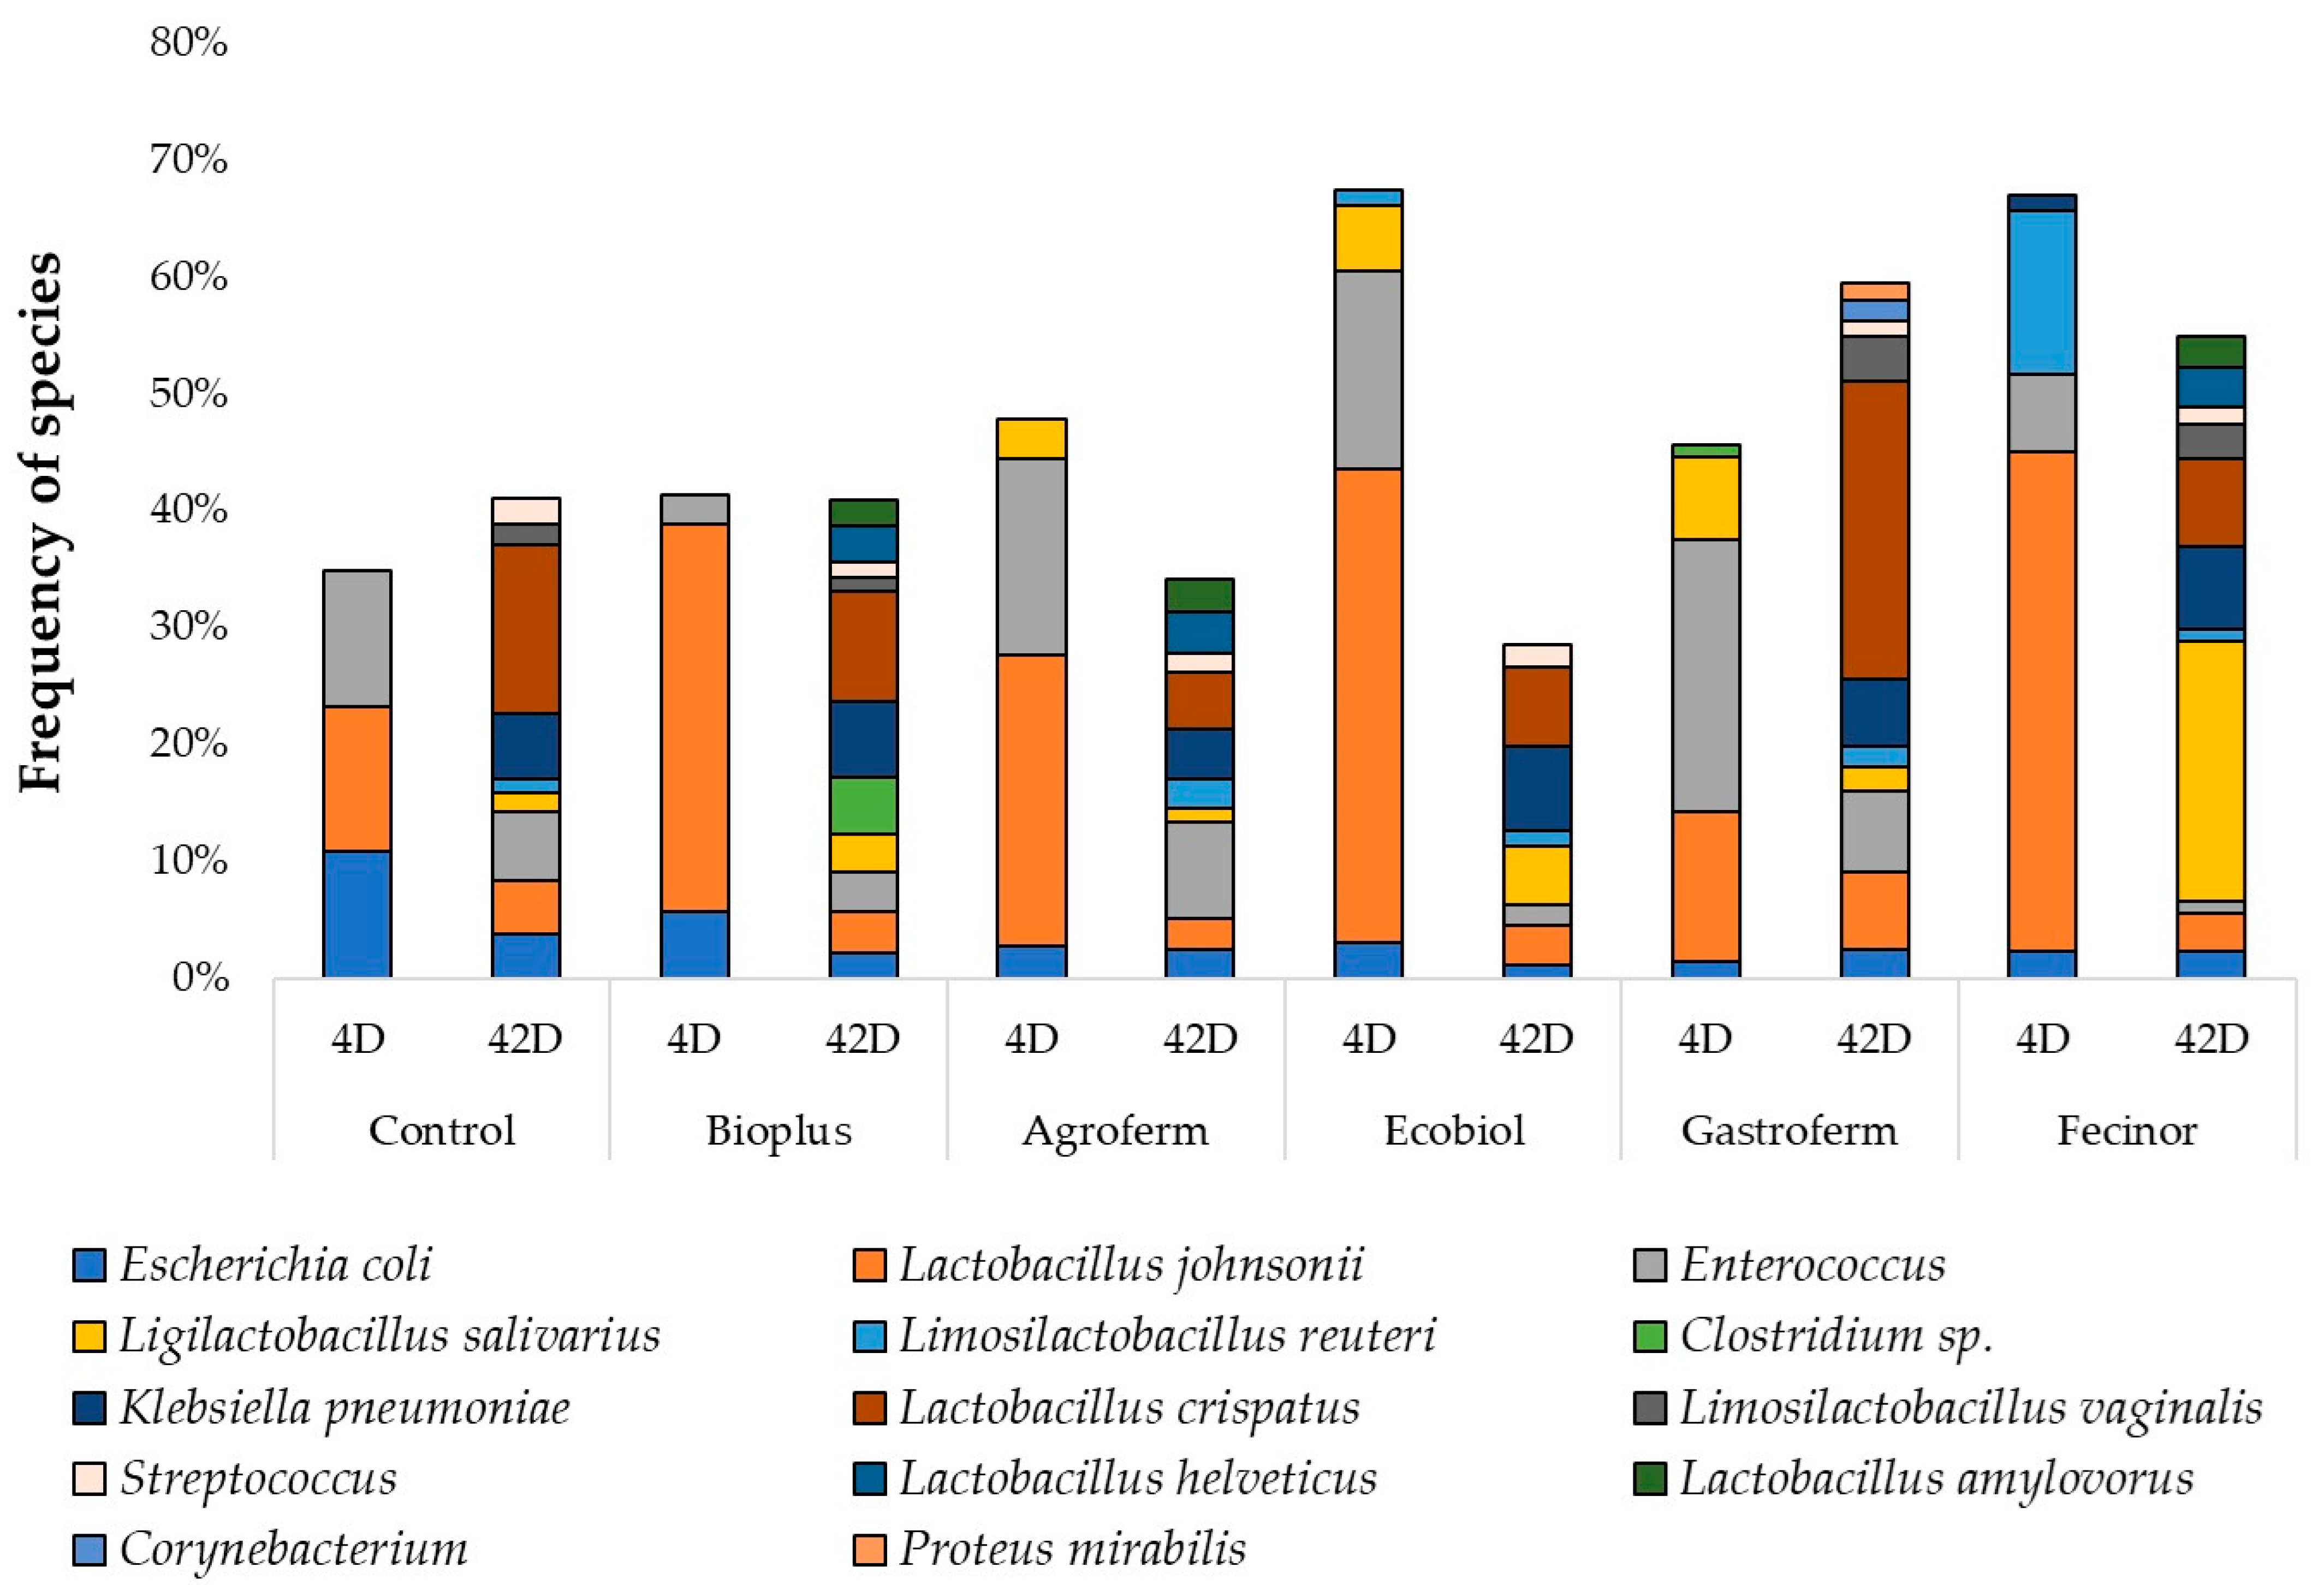
3.4. Gut Microbiome Composition and Antimicrobial Resistance Gene Expression

An average of 36,549,401 reads (minimum: 16,105,059; median: 36,387,144; maximum: 59,792,673) were obtained from the bacterial kingdom across the samples, with 29,277,955 reads (minimum: 14,359,056; median: 26,649,405; maximum: 54,262,552) classified at the genus level and 25,885,945 reads (minimum: 7,610,791; median: 24,713,784; maximum: 51,592,030) at the species level. The core bacteriome, defined as genomes present in at least 10% of the samples with a minimum abundance of 1%, was analyzed.
At the strain level, Firmicutes and Proteobacteria were dominant. In the control group, the proportion of Firmicutes increased from 28.5% to 59%, while Proteobacteria decreased from 66% to 31% by the end of the experiment. In contrast, when fed BioPlus, the proportions of these phyla remained stable (from 63.5% to 66% for Firmicutes and from 26.5% to 25% for Proteobacteria). However, in groups fed other probiotics, the initial dominance of Firmicutes significantly decreased by the end of rearing, with corresponding increases in Proteobacteria.
The proportion of Bacteroidetes rose markedly in the control group (from 0.04% to 10.03%) but remained below 1% in all other groups. The addition of tiamulin and florfenicol noticeably altered the microbiome in the Ecobiol-fed group, drastically reducing the proportion of Firmicutes, including Gram-positive bacteria (from 81% to 1.3% at the beginning and from 64% to 4% at the end of rearing), while dramatically increasing the proportion of Proteobacteria, including Gram-negative bacteria (from 6% to 97% and from 25.5% to 93.5%).
At the genus level, Lactobacillus was predominant in most samples. In the control group, the proportion of Lactobacillus increased from 18.5% to 34%. Similarly, in the group fed Gastroferm, Lactobacillus levels rose from 19% to 50%. In contrast, the other groups showed a decrease. The proportion of Enterococcus, the second dominant genus, declined slightly in the control group (from 7.5% to 6.5%) and also in all the other groups, except for BioPlus, which saw an increase (from 4% to 5.5%). At the genus level, Shannon diversity distributions by group and sampling time did not show significant results, nor did the Mann–Whitney test reveal significant differences in gene composition before and after feeding probiotics (Supplementary Figure S1). Likewise, no significant difference in the number of genes observed was found by the Mann–Whitney test (Supplementary Figure S2). NMDS ordination based on Bray–Curtis distances between samples is shown before feeding in Supplementary Figure S3 and after feeding in Supplementary Figure S4. The abundance of the core bacteriome (genes present in at least 10% of the samples and at a minimum abundance of 1%) in the pre- and post-feeding samples is summarized in Supplementary Figure S5.
Regarding the genus Escherichia from the Proteobacteria phylum, increases were noted in the Agroferm (from 4% to 5.5%) and Fecinor groups (from 3.5% to 5.5%), while decreases were observed in all other groups. The proportion of Klebsiella significantly increased across all groups: control (from 0.1% to 9%); BioPlus (from 0.05% to 11%); Agroferm (from 0.02% to 8.5%); Ecobiol (from 0.06% to 17.5%); Gastroferm (from 0.02% to 8%); and Fecinor (from 1.01% to 12%).
In enriched samples from the Ecobiol group, a dominant selection of Gram-negative bacteria was observed at the genus level. The percentage of Escherichia increased from 2.5% to 21% and Proteus from 0.09% to 10%, as illustrated in Figure 2.
The variation in species composition of each probiotic-treated group over time is illustrated in Figure 3. At a few days old, the samples were dominated by Escherichia coli, Lactobacillus johnsonii, Enterococcus species, and Ligilactobacillus salivarius. By day 42, there was a significant decrease in the proportion of Enterococcus species compared to the first day, while the proportion of Klebsiella pneumoniae increased significantly. Lactobacillus crispatus, Lactobacillus helveticus, and Lactobacillus amylovorus species became dominant after treatment with each probiotic, except for Lactobacillus johnsonii, which showed a significant decrease in all cases. Shannon’s species-level analysis of diversity between groups and Mann–Whitney tests of paired samples within groups revealed no significant differences before and after feeding probiotics (Supplementary Figure S6). The distribution of the number of species observed, controlled for sampling time and feeding, in samples paired within groups using Mann–Whitney tests showed no significant difference between samples taken at the beginning and end of the period (Supplementary Figure S7). NMDS ordination based on Bray–Curtis distances between samples at the species level before feeding is shown in Supplementary Figure S8 and after feeding in Supplementary Figure S9. Abundances of the core bacteriome, defined as bacterial species present in at least 10% of samples at a minimum abundance of 1%, are displayed in Supplementary Figure S10.
The changes in the gut microbiome at the strain level due to enrichment are illustrated in Figure 4. This figure clearly shows the selection of Gram-negative bacteria, while the prevalence of Gram-positive bacteria is only minimally reduced. The abundances of the core bacteriome per sample, defined as at least 1% of the genes being present in at least 10% of the samples, are shown in Supplementary Figure S11. The same data at the species level are displayed in Supplementary Figure S12.
A total of 172 antimicrobial resistance genes (ARGs) were identified across all samples. The ARGs were categorized by antibiotic drug class and mechanism of resistance. Analysis revealed no significant differences in the distribution of these genes between the control group and the groups fed each probiotic product, neither at the beginning nor at the end of the rearing period (Supplementary Figures S13–S18).
The AAC(6’)-Ii gene (associated with resistance to aminoglycosides via enzymatic inactivation), the eatAv gene (associated with resistance to pleuromutilins via target protection), and the efmA gene (associated with resistance to macrolides and fluoroquinolones via efflux pumping) were present in initial samples taken on day 4. These genes were not detected in samples collected at the end of the rearing period, with the exception of the Gastroferm group, where these genes were inherently carried by the probiotic used.
Additionally, it is concerning that genes such as SHV-38, TEM-1, and TEM-163, which are responsible for the production of extended-spectrum β-lactamases (ESBLs), were identified in several samples taken from 4-day old chicks.

4. Discussion

In this study, the effects of five different probiotic products on broiler chickens over a 42-day rearing period were evaluated. Although no statistically significant differences in weight gain were observed between the control group and the probiotic-fed groups (p > 0.05), specific formulations such as BioPlus YC and Ecobiol WX demonstrated a commercially relevant increase in weight gain by the fourth week (+3–6%). Notably, only BioPlus YC and Ecobiol WX maintained this increase by the fifth week (+3%). The Ecobiol group consistently showed significantly more weight gain compared to the control throughout the rearing period.
These findings partially align with Xu et al., who observed significant increases in feed intake and weight gain with Bacillus subtilis and Bacillus licheniformis (109 CFU/g) in a similar study involving 360 roosters [79]. However, in our study, BioPlus, containing the same probiotics, did not yield a statistically significant difference from the control group (p > 0.05). This contrasts with the results from Ma et al., who reported significant weight gains on day 42 with Bacillus subtilis compared to the control group (p = 0.022) [80], whereas our findings showed no significant difference (p = 0.32).
Further comparisons reveal a mixed response to probiotic supplementation in poultry. Trela et al. reported significant weight gains in the early stages of rearing with Bacillus licheniformis, but no differences in later stages [81]. Similarly, Wang et al. noted a significant weight gain with Lactobacillus plantarum only at day 21, but not after [82]. Conversely, studies by Reuben et al. with Pediococcus acidilactici [83], Wu et al. with Enterococcus faecium [84], and Han et al. with Enterococcus faecalis saw noticeable weight gain only at day 42 [85] These results indicate significant probiotic-related weight gains occur only during specific phases of the growth period, and underscore the variability in probiotic efficacy across different strains and feeding schedules.
Our study highlights the dynamic changes in the gut microbiome of broiler chickens, dominated by shifts in the populations of Firmicutes and Proteobacteria, over a 42-day rearing period. Specifically, in the control group, the amount of Firmicutes increased significantly from 28.5% to 59%, while the proportion of Proteobacteria decreased from 66% to 31%. Interestingly, in chickens fed BioPlus, the proportion of these phyla remained stable (Firmicutes: 63.5% to 66%; Proteobacteria: 26.5% to 25%), suggesting that this probiotic might stabilize populations of these key microbial groups. Furthermore, although the effects were not statistically significant, the weight gain observed in the group fed this diet was consistently better across all measurement points.
Conversely, other probiotic treatments initially increased the proportion of Firmicutes, which subsequently decreased towards the end of the rearing period. This change was accompanied by an inverse trend in Proteobacteria. This fluctuation contrasts with findings by Ma et al., who reported a similar dominance of Firmicutes and Proteobacteria but no significant changes in microbiome diversity between control and treated groups, particularly when Bacillus subtilis was administered [80]. Han et al. also found no change in microbial diversity with Enterococcus faecalis treatment [85], and Trela et al. observed significant differences only in fecal samples from the jejunum [81].
In our analysis, only the control group exhibited a notable increase in Bacteroidetes, reaching 10.03% by the end of the period, while all other groups maintained a rate below 1%. This observation aligns with Ma et al., who reported a significant reduction in Bacteroidetes with probiotic treatment [80]. Similarly, Gao et al. found comparable levels of Firmicutes and Proteobacteria in broilers, across different treatments, underscoring the potential for probiotics to modify the gut flora composition [86].
In our study, the proportion of the Lactobacillus genus in the control group increased significantly from 18.5% to 34%. Among the treated groups, only chickens receiving Gastroferm exhibited a substantial increase, from 19% to 50%, whereas all other groups experienced a decrease. This pattern highlights the specific impact of Gastroferm on promoting Lactobacillus growth, aligning with findings by Sureshkumar et al., who reported a prevalence of 22.82% [87], and Gao et al., who noted a 16.69% prevalence in similar settings at the end of the study period [86]. Conversely, the Enterococcus genus displayed a slight decrease in the control group, from 7.5% to 6.5%, while increasing slightly in the BioPlus-treated group from 4% to 5.5%. This indicates that BioPlus may support Enterococcus growth. Furthermore, our study found that the Escherichia genus saw increases in groups treated with Agroferm and Fecinor, from 4% to 5.5% and 3.5% to 5.5%, respectively. In contrast, all other groups showed a decrease in this genus, suggesting that Agroferm and Fecinor may selectively promote growth of Escherichia species. Remarkably, we observed a significant increase in the Klebsiella genus across all groups, with percentages rising considerably during the rearing period (Control: 0.1% to 9%; BioPlus: 0.05% to 11%; Agroferm: 0.02% to 8.5%; Ecobiol: 0.06% to 17.5%; Gastroferm: 0.02% to 8%; Fecinor: 1.01% to 12%). These findings are consistent with those reported by Khan et al., who also observed a notable increase in Klebsiella following probiotic treatment [88]. This raises potential concerns about the pathogenic risks associated with this genus. Moreover, compared to other studies reporting higher prevalences for Enterococcus, Blautia, and Clostridium, our results indicated lower average prevalences (0.41% and 0.84%, respectively) for the latter two genera, which could reflect variations in dietary composition, probiotic formulations, or baseline microbiota [87].
Our analysis of the ARG pool within the tested probiotic products revealed a diverse array of resistance genes. Notably, the BioPlus product contained a significant number of genes, including the fluoroquinolone resistance genes blt and bmr. The blt gene, identified in Bacillus subtilis by Ahmed et al. [89], and the bmr gene, described by Neyfakh et al. and Klyachkyo et al. [90,91], are critical markers of resistance in this context. Additionally, the bcrA and bcrB genes, associated with peptide antibiotic resistance and described in Bacillus licheniformis by Podlesek et al. [92], were also present.
The presence of the ykkC and ykkD genes, which confer multidrug resistance to aminoglycosides, tetracycline, and phenicol, further underscores the broad-spectrum resistance potential in these probiotic strains, as detailed in Bacillus subtilis by Jack et al. [93]. The aadk gene, a key player in enzymatic inactivation leading to aminoglycoside resistance, was noted by Argerso et al. in Bacillus licheniformis [94]. Among efflux pump-related genes, the mphk gene implicated in macrolide resistance was shown in Bacillus subtilis by Pawlowski et al. [95], and the bcrC gene, linked to peptide antibiotic resistance as a target mutation, was also highlighted [92].
Target mutations such as those caused by the mprF gene, which can lead to peptide antibiotic resistance, have been identified in Bacillus subtilis [96,97,98]. In the Agroferm and Gastroferm products, the efmA gene was observed encoding an MFS-type efflux pump that contributes to resistance against macrolides and fluoroquinolones, as identified in Enterococcus faecium by Urshev et al. Furthermore, the AAC(6’)-Ii gene, responsible for aminoglycoside resistance, was found in Agroferm, Gastroferm, and Fecinor Soluble Plus, indicating a notable prevalence of this resistance mechanism in Enterococcus faecium [99].
In our study, the differences in antimicrobial resistance genes (ARGs) within the fecal microbiomes of treated and control groups were not statistically significant over the 42-day period. This observation aligns with findings by Chen et al., who reported a reduction in the variety of ARG (Fisher’s alpha) in chickens fed probiotics [51]. However, the persistence of certain ARGs warrants special attention due to their implications for public health.
Notably, the AAC(6’)-Ii gene, which is involved in the enzymatic inactivation of aminoglycosides, was lost from all treatment groups, except those fed Agroferm, by the end of the rearing period. This gene has been extensively studied in Enterococcus faecium and is recognized for its clinical significance [99]. The persistence of this gene in the Agroferm group suggests a selective pressure maintained by the probiotic formulation that may affect the dissemination of resistance traits.
Additionally, the detection of the TEM-1 gene in all groups and the TEM-163 gene in one group of 4-day old chicks, along with the emergence of the SHV-38 gene, raises concerns. These genes are associated with extended-spectrum beta-lactamase (ESBL) production, a major resistance mechanism that complicates treatment of bacterial infections. Hassen et al. found the TEM-1 gene in 25.8% of chicken feces and meat samples, highlighting its prevalence in poultry environments [100]. The SHV-38 gene, typically identified in Klebsiella pneumoniae, has not been previously reported in chicken feces [101]. Similarly, the presence of the TEM-163 gene, also linked to ESBL production and identified in E. coli, underscores the potential risk of resistance transfer through the food chain [102].
These findings indicate that while probiotics can influence the ARG profile of the gut microbiome, the emergence and persistence of significant resistance genes such as AAC(6’)-Ii, TEM-1, SHV-38, and TEM-163 require careful monitoring. The potential for these ARGs to spread within agricultural settings and into clinical environments calls for enhanced surveillance and targeted interventions to mitigate the risks associated with antibiotic resistance in poultry production. Further studies should explore the mechanisms by which different probiotics influence microbial populations and their long-term impacts on poultry health and productivity.

5. Conclusions

The carriage of antimicrobial resistance genes (ARGs) in probiotics approved for poultry represents a critical yet under-researched area posing significant public health threats. Our study utilized next-generation sequencing to examine the ARG profiles in various probiotic products and analyzed changes in the fecal resistome and microbiome of broiler chickens, correlating these with phenotypic expressions of resistance through minimum inhibitory concentration (MIC) values.
We identified several genes responsible for resistance to critically important antibiotics, including fluoroquinolone efflux pumps and peptide antibiotic target mutations. Notably, genes facilitating aminoglycoside enzymatic inactivation, such as aadK and AAC(6’)-Ii, were of significant public health relevance. Multiple multidrug resistance genes, such as vmlR, ykkC, ykkD, msrC, clbA, and eatAv, were also found. However, our findings indicated the absence of mobile genetic element (MGE) or plasmid-encoded genes, with only one phage-encoded gene (dfrA43) detected. No evidence of direct gene transfer from probiotics to the gut microbiome was observed.
Phenotypic resistance testing through MIC scoring revealed specific resistance-associated genes in the examined strains, but no significant differences were noted in Shannon diversity distribution and Mann–Whitney tests of the fecal metagenome at the genus level over time and across different probiotic groups. These findings highlight the potential transmission of ARGs through probiotic products in poultry, emphasizing the need for careful selection and monitoring of probiotics concerning antimicrobial resistance traits. Ongoing surveillance and research are crucial to ensure that probiotic benefits do not inadvertently contribute to antibiotic resistance spread.
Further research into the molecular genetics of probiotics is imperative. Future studies should include transcriptomic analyses to better understand the expression and regulation of ARGs within probiotic strains. Such studies are crucial for developing strategies to mitigate the risks associated with resistance gene transfer through probiotics in poultry farming.

Supplementary Materials

The following supporting information can be downloaded at https://www.mdpi.com/article/10.3390/ani14131927/s1: Figure S1: Analysis of Shannon diversity distribution at the genus level; Figure S2: Distribution of the number of genes observed across different sampling times; Figure S3: Non-metric multidimensional scaling (NMDS) ordination based on Bray–Curtis distances between pre-feeding samples at the genus level; Figure S4: Non-metric multidimensional scaling (NMDS) ordination of Bray–Curtis distances between post-feeding samples at the genus level; Figure S5: Abundances of the core bacteriome per sample, for genes present in at least 10% of the samples at a minimum abundance of 1%; Figure S6: Shannon’s diversity distribution at the species level by group for probiotic-treated samples; Figure S7: Distribution of the number of species observed showed no significant differences when analyzed using the paired Mann–Whitney test within groups; Figure S8: Non-metric multidimensional scaling (NMDS) ordination based on Bray–Curtis distances among pre-feeding samples at the species level; Figure S9: Non-metric multidimensional scaling (NMDS) ordination based on Bray–Curtis distances among post-feeding samples at the species level; Figure S10: Abundances of the core bacteriome per sample, defined as species present in at least 10% of the samples at a minimum abundance of 1%; Figure S11: Core-bacteriome abundances for enrichment samples, defined as having at least 1% of genes present in at least 10% of the samples; Figure S12: Core bacteriome abundances in enrichment samples, defined by the presence of at least 1% of species in at least 10% of the samples; Figure S13: Frequency of antimicrobial resistance genes (ARGs) identified during sequencing of the control group day 42 sample by drug class based on the individual resistance mechanisms (>90% coverage); Figure S14: Frequency of antimicrobial resistance genes (ARGs) identified during sequencing of the Bioplus group day 42 sample by drug class based on the individual resistance mechanisms (>90% coverage); Figure S15: Frequency of antimicrobial resistance genes (ARGs) identified during sequencing of the Agroferm group day 42 sample by drug class based on the individual resistance mechanisms (>90% coverage); Figure S16: Frequency of antimicrobial resistance genes (ARGs) identified during sequencing of the Ecobiol group day 42 sample by drug class based on the individual resistance mechanisms (>90% coverage); Figure S17: Frequency of antimicrobial resistance genes (ARGs) identified during sequencing of the Gastroferm group day 42 sample by drug class based on the individual resistance mechanisms (>90% coverage); Figure S18: Frequency of antimicrobial resistance genes (ARGs) identified during sequencing of the Fecinor group day 42 sample by drug class based on the individual resistance mechanisms (>90% coverage); Table S1: Environmental parameters required during the rearing period of broiler chickens; Table S2: The main ingredients of broiler feed; Table S3: Statistics for groups and body mass at week 6, for all individuals with a body mass exceeding 2000 g.

Author Contributions

Conceptualization, Á.K., G.K. and Á.J.; methodology, Á.K.; sequencing and sample processing, E.K. and K.B. (Krisztina Bali); software, M.P.; validation, Á.J., K.B. (Krisztián Bányai), and L.M.; formal analysis, M.P.; investigation, I.L.R.; resources, Á.S.; data curation, I.L.R., E.K. and K.B. (Krisztina Bali); writing—original draft preparation, I.L.R.; writing—review and editing, Á.K.; visualization, Á.K.; supervision, Á.K.; project administration, Á.K.; funding acquisition, Á.J. All authors have read and agreed to the published version of the manuscript.

Funding

This research was supported by Project no. RRF-2.3.1-21-2022-00001 and was implemented with the support provided by the Recovery and Resilience Facility (RRF), financed under the National Recovery Fund budget estimate, RRF-2.3.1-21 funding scheme. This paper was prepared with the professional support of the Doctoral Student Scholarship Program of the Co-operative Doctoral Program of the Ministry of Innovation and Technology, financed by the National Research, Development, and Innovation Fund.

Institutional Review Board Statement

The animal experiments were conducted in strict accordance with the guidelines of Hungarian Government Decree No. 40/2013 (II. 14.) and were approved by the ethical committee of the Veterinary University of Budapest (ÁTET/EA/23/2022). The result of Act No. 28 of 1998.3. § (9), as well as 40/2013. 1. § (4), (c), and especially points (f) of the Government Decree, they are not classified as examination adversely affecting animal welfare, so no ethical permit is required.

Informed Consent Statement

Not applicable.

Data Availability Statement

The datasets used and/or analyzed during the current study are available from the corresponding author on reasonable request. The sequencing files are available at the LINK below.

Acknowledgments

We wish to extend our heartfelt thanks to all who contributed to this research. Special thanks to Éva Borbás, whose excellent animal care ensured that the daily needs of our study subjects were met with great diligence. We also greatly appreciate the indispensable assistance provided by Katalin Balogh and Bianka Paliczné Kustán during the laboratory tests.

Conflicts of Interest

László Makrai is employed at Autovakcina Kft. company. This organization played no role in sponsoring this research or product advertising. The authors declare no financial interest or relevant conflicts of interest.

References

  1. Hill, C.; Guarner, F.; Reid, G.; Gibson, G.R.; Merenstein, D.J.; Pot, B.; Morelli, L.; Canani, R.B.; Flint, H.J.; Salminen, S.; et al. The International Scientific Association for Probiotics and Prebiotics Consensus Statement on the Scope and Appropriate Use of the Term Probiotic. Nat. Rev. Gastroenterol. Hepatol. 2014, 11, 506–514. [Google Scholar] [CrossRef] [PubMed]
  2. Macpherson, A.J.; Uhr, T. Induction of Protective IgA by Intestinal Dendritic Cells Carrying Commensal Bacteria. Science 2004, 303, 1662–1665. [Google Scholar] [CrossRef] [PubMed]
  3. Matsuo, K.; Ota, H.; Akamatsu, T.; Sugiyama, A.; Katsuyama, T. Histochemistry of the Surface Mucous Gel Layer of the Human Colon. Gut 1997, 40, 782–789. [Google Scholar] [CrossRef] [PubMed]
  4. Collado, M.C.; Meriluoto, J.; Salminen, S. Role of Commercial Probiotic Strains against Human Pathogen Adhesion to Intestinal Mucus. Lett. Appl. Microbiol. 2007, 45, 454–460. [Google Scholar] [CrossRef] [PubMed]
  5. Mack, D.R. Extracellular MUC3 Mucin Secretion Follows Adherence of Lactobacillus Strains to Intestinal Epithelial Cells in Vitro. Gut 2003, 52, 827–833. [Google Scholar] [CrossRef] [PubMed]
  6. Asahara, T.; Shimizu, K.; Nomoto, K.; Hamabata, T.; Ozawa, A.; Takeda, Y. Probiotic Bifidobacteria Protect Mice from Lethal Infection with Shiga Toxin-Producing Escherichia Coli O157:H7. Infect. Immun. 2004, 72, 2240–2247. [Google Scholar] [CrossRef] [PubMed]
  7. Maqueda, M.; Sánchez-Hidalgo, M.; Fernández, M.; Montalbán-López, M.; Valdivia, E.; Martínez-Bueno, M. Genetic Features of Circular Bacteriocins Produced by Gram-Positive Bacteria. FEMS Microbiol. Rev. 2008, 32, 2–22. [Google Scholar] [CrossRef] [PubMed]
  8. Kovács, L.; Nagy, D.; Könyves, L.; Jerzsele, Á.; Kerek, Á. Antimicrobial Properties of Essential Oils—Animal Health Aspects. Hung. Vet. J. 2023, 145, 497–510. [Google Scholar]
  9. Sebők, C.; Márton, R.A.; Meckei, M.; Neogrády, Z.; Mátis, G. Antimicrobial Peptides as New Tools to Combat Infectious Diseases. Hung. Vet. J. 2024, 146, 181–191. [Google Scholar]
  10. Olasz, Á.; Jerzsele, Á.; Balta, L.; Dobra, P.F.; Kerek, Á. In Vivo Efficacy of Different Extracts of Propolis in Broiler Salmonellosis. Hung. Vet. J. 2023, 145, 461–475. [Google Scholar]
  11. Kerek, Á.; Csanády, P.; Jerzsele, Á. Antibacterial Efficiency of Propolis—Part 1. Hung. Vet. J. 2022, 144, 285–298. [Google Scholar]
  12. Kerek, Á.; Csanády, P.; Jerzsele, Á. Antiprotozoal and Antifungal Efficiency of Propolis—Part 2. Hung. Vet. J. 2022, 144, 691–704. [Google Scholar]
  13. Kerek, Á.; Csanády, P.; Tuska-Szalay, B.; Kovács, L.; Jerzsele, Á. In Vitro Efficacy of Hungarian Propolis against Bacteria, Yeast, and Trichomonas Gallinae Isolated from Pigeons—A Possible Antibiotic Alternative? Resources 2023, 12, 101. [Google Scholar] [CrossRef]
  14. Fredenucci, I.; Chomarat, M.; Boucaud, C.; Flandrois, J.P. Saccharomyces Boulardii Fungemia in a Patient Receiving Ultra-Levure Therapy. Clin. Infect. Dis. 1998, 27, 222–223. [Google Scholar] [CrossRef]
  15. Henry, S.; D’Hondt, L.; André, M.; Holemans, X.; Canon, J.L. Saccharomyces Cerevisiae Fungemia in a Head and Neck Cancer Patient: A Case Report and Review of the Literature. Acta Clin. Belg. 2004, 59, 220–222. [Google Scholar] [CrossRef] [PubMed]
  16. Lolis, N.; Veldekis, D.; Moraitou, H.; Kanavaki, S.; Velegraki, A.; Triandafyllidis, C.; Tasioudis, C.; Pefanis, A.; Pneumatikos, I. Saccharomyces Boulardii Fungaemia in an Intensive Care Unit Patient Treated with Caspofungin. Crit. Care 2008, 12, 414. [Google Scholar] [CrossRef]
  17. Muñoz, P.; Bouza, E.; Cuenca-Estrella, M.; Eiros, J.M.; Pérez, M.J.; Sánchez-Somolinos, M.; Rincón, C.; Hortal, J.; Peláez, T. Saccharomyces Cerevisiae Fungemia: An Emerging Infectious Disease. Clin. Infect. Dis. 2005, 40, 1625–1634. [Google Scholar] [CrossRef] [PubMed]
  18. Niault, M.; Thomas, F.; Prost, J.; Ansari, F.H.; Kalfon, P. Fungemia Due to Saccharomyces Species in a Patient Treated with Enteral Saccharomyces Boulardii. Clin. Infect. Dis. 1999, 28, 930. [Google Scholar] [CrossRef]
  19. Land, M.H.; Rouster-Stevens, K.; Woods, C.R.; Cannon, M.L.; Cnota, J.; Shetty, A.K. Lactobacillus Sepsis Associated with Probiotic Therapy. Pediatrics 2005, 115, 178–181. [Google Scholar] [CrossRef]
  20. Oggioni, M.R.; Pozzi, G.; Valensin, P.E.; Galieni, P.; Bigazzi, C. Recurrent Septicemia in an Immunocompromised Patient Due to Probiotic Strains of Bacillus Subtilis. J. Clin. Microbiol. 1998, 36, 325–326. [Google Scholar] [CrossRef]
  21. Ohishi, A.; Takahashi, S.; Ito, Y.; Ohishi, Y.; Tsukamoto, K.; Nanba, Y.; Ito, N.; Kakiuchi, S.; Saitoh, A.; Morotomi, M.; et al. Bifidobacterium Septicemia Associated with Postoperative Probiotic Therapy in a Neonate with Omphalocele. J. Pediatr. 2010, 156, 679–681. [Google Scholar] [CrossRef] [PubMed]
  22. Zein, E.F.; Karaa, S.; Chemaly, A.; Saidi, I.; Daou-Chahine, W.; Rohban, R. Lactobacillus rhamnosus septicemia in a diabetic patient associated with probiotic use: A case report. Ann. Biol. Clin. 2008, 66, 195–198. [Google Scholar] [CrossRef]
  23. Vaarala, O. Immunological Effects of Probiotics with Special Reference to Lactobacilli. Clin. Exp. Allergy 2003, 33, 1634–1640. [Google Scholar] [CrossRef] [PubMed]
  24. Veckman, V.; Miettinen, M.; Pirhonen, J.; Sirén, J.; Matikainen, S.; Julkunen, I. Streptococcus Pyogenes and Lactobacillus Rhamnosus Differentially Induce Maturation and Production of Th1-Type Cytokines and Chemokines in Human Monocyte-Derived Dendritic Cells. J. Leukoc. Biol. 2004, 75, 764–771. [Google Scholar] [CrossRef]
  25. Rijkers, G.T.; de Vos, W.M.; Brummer, R.-J.; Morelli, L.; Corthier, G.; Marteau, P. Health Benefits and Health Claims of Probiotics: Bridging Science and Marketing. Br. J. Nutr. 2011, 106, 1291–1296. [Google Scholar] [CrossRef] [PubMed]
  26. Sniffen, J.C.; McFarland, L.V.; Evans, C.T.; Goldstein, E.J.C. Choosing an Appropriate Probiotic Product for Your Patient: An Evidence-Based Practical Guide. PLoS ONE 2018, 13, e0209205. [Google Scholar] [CrossRef] [PubMed]
  27. Hempel, S.; Newberry, S.; Ruelaz, A.; Wang, Z.; Miles, J.N.V.; Suttorp, M.J.; Johnsen, B.; Shanman, R.; Slusser, W.; Fu, N.; et al. Safety of Probiotics Used to Reduce Risk and Prevent or Treat Disease. Evid. Rep. Technol. Assess. (Full Rep.) 2011, 200, 1–645. [Google Scholar]
  28. Harbarth, S.; Balkhy, H.H.; Goossens, H.; Jarlier, V.; Kluytmans, J.; Laxminarayan, R.; Saam, M.; Van Belkum, A.; Pittet, D.; for the World Healthcare-Associated Infections Resistance Forum participants. Antimicrobial Resistance: One World, One Fight! Antimicrob. Resist. Infect. Control 2015, 4, 49. [Google Scholar] [CrossRef]
  29. Baquero, F. Threats of Antibiotic Resistance: An Obliged Reappraisal. Int. Microbiol. 2021, 24, 499–506. [Google Scholar] [CrossRef]
  30. Van Boeckel, T.P.; Gandra, S.; Ashok, A.; Caudron, Q.; Grenfell, B.T.; Levin, S.A.; Laxminarayan, R. Global Antibiotic Consumption 2000 to 2010: An Analysis of National Pharmaceutical Sales Data. Lancet Infect Dis 2014, 14, 742–750. [Google Scholar] [CrossRef]
  31. Zheng, M.; Zhang, R.; Tian, X.; Zhou, X.; Pan, X.; Wong, A. Assessing the Risk of Probiotic Dietary Supplements in the Context of Antibiotic Resistance. Front. Microbiol. 2017, 8, 908. [Google Scholar] [CrossRef]
  32. Sanders, M.E.; Akkermans, L.M.A.; Haller, D.; Hammerman, C.; Heimbach, J.; Hörmannsperger, G.; Huys, G.; Levy, D.D.; Lutgendorff, F.; Mack, D.; et al. Safety Assessment of Probiotics for Human Use. Gut Microbes 2010, 1, 164–185. [Google Scholar] [CrossRef] [PubMed]
  33. Vankerckhoven, V.; Huys, G.; Vancanneyt, M.; Vael, C.; Klare, I.; Romond, M.-B.; Entenza, J.M.; Moreillon, P.; Wind, R.D.; Knol, J.; et al. Biosafety Assessment of Probiotics Used for Human Consumption: Recommendations from the EU-PROSAFE Project. Trends Food Sci. Technol. 2008, 19, 102–114. [Google Scholar] [CrossRef]
  34. Kastner, S.; Perreten, V.; Bleuler, H.; Hugenschmidt, G.; Lacroix, C.; Meile, L. Antibiotic Susceptibility Patterns and Resistance Genes of Starter Cultures and Probiotic Bacteria Used in Food. Syst. Appl. Microbiol. 2006, 29, 145–155. [Google Scholar] [CrossRef] [PubMed]
  35. Huys, G.; D’Haene, K.; Swings, J. Genetic Basis of Tetracycline and Minocycline Resistance in Potentially Probiotic Lactobacillus Plantarum Strain CCUG 43738. Antimicrob. Agents Chemother. 2006, 50, 1550–1551. [Google Scholar] [CrossRef] [PubMed]
  36. Xing, S.-C.; Chen, J.-Y.; Cai, Y.-F.; Huang, C.-B.; Liao, X.-D.; Mi, J.-D. Bacillus Coagulans R11 Consumption Influenced the Abundances of Cecum Antibiotic Resistance Genes in Lead-Exposed Laying Hens. Environ. Pollut. 2021, 274, 116562. [Google Scholar] [CrossRef] [PubMed]
  37. Zavišić, G.; Popović, M.; Stojkov, S.; Medić, D.; Gusman, V.; Jovanović Lješković, N.; Jovanović Galović, A. Antibiotic Resistance and Probiotics: Knowledge Gaps, Market Overview and Preliminary Screening. Antibiotics 2023, 12, 1281. [Google Scholar] [CrossRef] [PubMed]
  38. Merenstein, D.; Pot, B.; Leyer, G.; Ouwehand, A.C.; Preidis, G.A.; Elkins, C.A.; Hill, C.; Lewis, Z.T.; Shane, A.L.; Zmora, N.; et al. Emerging Issues in Probiotic Safety: 2023 Perspectives. Gut Microbes 2023, 15, 2185034. [Google Scholar] [CrossRef]
  39. Gareau, M.G.; Sherman, P.M.; Walker, W.A. Probiotics and the Gut Microbiota in Intestinal Health and Disease. Nat. Rev. Gastroenterol. Hepatol. 2010, 7, 503–514. [Google Scholar] [CrossRef]
  40. Simon, O. Micro-Organisms as Feed Additives—Probiotics. Adv. Pork Prod. 2005, 16, 161–167. [Google Scholar]
  41. Arias, C.A.; Contreras, G.A.; Murray, B.E. Management of Multidrug-Resistant Enterococcal Infections. Clin. Microbiol. Infect. 2010, 16, 555–562. [Google Scholar] [CrossRef] [PubMed]
  42. Arias, C.A.; Murray, B.E. The Rise of the Enterococcus: Beyond Vancomycin Resistance. Nat. Rev. Microbiol. 2012, 10, 266–278. [Google Scholar] [CrossRef] [PubMed]
  43. Gao, W.; Howden, B.P.; Stinear, T.P. Evolution of Virulence in Enterococcus Faecium, a Hospital-Adapted Opportunistic Pathogen. Curr. Opin. Microbiol. 2018, 41, 76–82. [Google Scholar] [CrossRef] [PubMed]
  44. Doron, S.; Snydman, D.R. Risk and Safety of Probiotics. Clin. Infect. Dis. 2015, 60, S129–S134. [Google Scholar] [CrossRef] [PubMed]
  45. Huang, Y.-F.; Liu, P.-Y.; Chen, Y.-Y.; Nong, B.-R.; Huang, I.-F.; Hsieh, K.-S.; Chen, K.-T. Three-Combination Probiotics Therapy in Children With Salmonella and Rotavirus Gastroenteritis. J. Clin. Gastroenterol. 2014, 48, 37–42. [Google Scholar] [CrossRef] [PubMed]
  46. Poloni, V.; Salvato, L.; Pereyra, C.; Oliveira, A.; Rosa, C.; Cavaglieri, L.; Keller, K.M. Bakery By-Products Based Feeds Borne-Saccharomyces Cerevisiae Strains with Probiotic and Antimycotoxin Effects plus Antibiotic Resistance Properties for Use in Animal Production. Food Chem. Toxicol. 2017, 107, 630–636. [Google Scholar] [CrossRef] [PubMed]
  47. Charteris, W.P.; Kelly, P.M.; Morelli, L.; Collins, J.K. Development and Application of an in Vitro Methodology to Determine the Transit Tolerance of Potentially Probiotic Lactobacillus and Bifidobacterium Species in the Upper Human Gastrointestinal Tract. J. Appl. Microbiol. 1998, 84, 759–768. [Google Scholar] [CrossRef] [PubMed]
  48. Charteris, W.P.; Kelly, P.M.; Morelli, L.; Collins, J.K. Gradient Diffusion Antibiotic Susceptibility Testing of Potentially Probiotic Lactobacilli. J. Food Prot. 2001, 64, 2007–2014. [Google Scholar] [CrossRef]
  49. Nawaz, M.; Wang, J.; Zhou, A.; Ma, C.; Wu, X.; Moore, J.E.; Cherie Millar, B.; Xu, J. Characterization and Transfer of Antibiotic Resistance in Lactic Acid Bacteria from Fermented Food Products. Curr. Microbiol. 2011, 62, 1081–1089. [Google Scholar] [CrossRef]
  50. Belletti, N.; Gatti, M.; Bottari, B.; Neviani, E.; Tabanelli, G.; Gardini, F. Antibiotic Resistance of Lactobacilli Isolated from Two Italian Hard Cheeses. J. Food Prot. 2009, 72, 2162–2169. [Google Scholar] [CrossRef]
  51. Chen, Y.-C.; Yu, Y.-H. Bacillus Licheniformis-Fermented Products and Enramycin Differentially Modulate Microbiota and Antibiotic Resistome in the Cecal Digesta of Broilers. Poult. Sci. 2022, 101, 102010. [Google Scholar] [CrossRef] [PubMed]
  52. Wang, Y.; Hu, Y.; Liu, F.; Cao, J.; Lv, N.; Zhu, B.; Zhang, G.; Gao, G.F. Integrated Metagenomic and Metatranscriptomic Profiling Reveals Differentially Expressed Resistomes in Human, Chicken, and Pig Gut Microbiomes. Environ. Int. 2020, 138, 105649. [Google Scholar] [CrossRef]
  53. Reiczigel, J.; Harnos, A.; Solymosi, N. Biostatisztika Nem Statisztikusoknak, Javított Utánnyomás; Pars Kft.: Budapest, Hungary, 2014. [Google Scholar]
  54. R Core Team. R: A Language and Environment for Statistical Computing; R Foundation for Statistical Computing: Vienna, Austria, 2020. [Google Scholar]
  55. Volume CLSI Standards M07. In Methods for Dilution Antimicrobial Susceptibility Tests for Bacteria That Grow Aerobically, 11th ed.; Clinical and Laboratory Standards Institute: Wayne, PA, USA, 2018.
  56. Sahin-Tóth, J.; Kovács, E.; Tóthpál, A.; Juhász, J.; Forró, B.; Bányai, K.; Havril, K.; Horváth, A.; Ghidán, Á.; Dobay, O. Whole Genome Sequencing of Coagulase Positive Staphylococci from a Dog-and-Owner Screening Survey. PLoS ONE 2021, 16, e0245351. [Google Scholar] [CrossRef]
  57. Modi, A.; Vai, S.; Caramelli, D.; Lari, M. The Illumina Sequencing Protocol and the NovaSeq 6000 System. Methods Mol. Biol. 2021, 2242, 15–42. [Google Scholar] [CrossRef] [PubMed]
  58. Muzzey, D.; Evans, E.A.; Lieber, C. Understanding the Basics of NGS: From Mechanism to Variant Calling. Curr. Genet. Med. Rep. 2015, 3, 158–165. [Google Scholar] [CrossRef] [PubMed]
  59. Mihály, Z.; Győrffy, B. Következő generációs szekvenálási technológiák kifejlődése és alkalmazásai = Next generation sequencing technologies (NGST) development and applications. Orvosi Hetil. 2011, 152, 55–62. [Google Scholar] [CrossRef] [PubMed]
  60. Andrews, S. FastQC A Quality Control Tool for High Throughput Sequence Data. Available online: https://www.bioinformatics.babraham.ac.uk/projects/fastqc/ (accessed on 25 April 2022).
  61. Chen, S.; Zhou, Y.; Chen, Y.; Gu, J. Fastp: An Ultra-Fast All-in-One FASTQ Preprocessor. Bioinformatics 2018, 34, i884–i890. [Google Scholar] [CrossRef] [PubMed]
  62. Benoit, G.; Lavenier, D.; Lemaitre, C.; Rizk, G. Bloocoo, a Memory Efficient Read Corrector. In Proceedings of the European Conference on Computational Biology (ECCB), Strasbourg, France, 7 September 2014. [Google Scholar]
  63. Krueger, F. Trim Galore 2022. Available online: https://github.com/FelixKrueger/TrimGalore (accessed on 25 April 2022).
  64. Dinghua MEGAHIT: An Ultra-Fast Single-Node Solution for Large and Complex Metagenomics Assembly via Succinct de Bruijn Graph. Bioinformatics. Oxford Academic. Available online: https://academic.oup.com/bioinformatics/article/31/10/1674/177884 (accessed on 25 April 2022).
  65. Vicedomini, R.; Vezzi, F.; Scalabrin, S.; Arvestad, L.; Policriti, A. GAM-NGS: Genomic Assemblies Merger for next Generation Sequencing. BMC Bioinform. 2013, 14 (Suppl. S7), S6. [Google Scholar] [CrossRef]
  66. Gurevich, A.; Saveliev, V.; Vyahhi, N.; Tesler, G. QUAST: Quality Assessment Tool for Genome Assemblies. Bioinformatics 2013, 29, 1072–1075. [Google Scholar] [CrossRef]
  67. Langmead, B.; Salzberg, S.L. Fast Gapped-Read Alignment with Bowtie 2. Nat. Methods 2012, 9, 357–359. [Google Scholar] [CrossRef]
  68. Wood, D.E.; Lu, J.; Langmead, B. Improved Metagenomic Analysis with Kraken 2. Genome Biol. 2019, 20, 257. [Google Scholar] [CrossRef]
  69. Pruitt, K.D.; Tatusova, T.; Maglott, D.R. NCBI Reference Sequences (RefSeq): A Curated Non-Redundant Sequence Database of Genomes, Transcripts and Proteins. Nucleic Acids Res. 2007, 35, D61–D65. [Google Scholar] [CrossRef]
  70. McMurdie, P.J.; Holmes, S. Phyloseq: An R Package for Reproducible Interactive Analysis and Graphics of Microbiome Census Data. PLoS ONE 2013, 8, e61217. [Google Scholar] [CrossRef] [PubMed]
  71. Lahti, L.; Shetty, S. Microbiome R Package. 2012. Available online: https://www.bioconductor.org/packages/release/bioc/html/microbiome.html (accessed on 25 April 2022).
  72. Nurk, S.; Meleshko, D.; Korobeynikov, A.; Pevzner, P.A. MetaSPAdes: A New Versatile Metagenomic Assembler. Genome Res. 2017, 27, 824–834. [Google Scholar] [CrossRef] [PubMed]
  73. Hyatt, D.; Chen, G.-L.; Locascio, P.F.; Land, M.L.; Larimer, F.W.; Hauser, L.J. Prodigal: Prokaryotic Gene Recognition and Translation Initiation Site Identification. BMC Bioinform. 2010, 11, 119. [Google Scholar] [CrossRef] [PubMed]
  74. Alcock, B.P.; Raphenya, A.R.; Lau, T.T.Y.; Tsang, K.K.; Bouchard, M.; Edalatmand, A.; Huynh, W.; Nguyen, A.-L.V.; Cheng, A.A.; Liu, S.; et al. CARD 2020: Antibiotic Resistome Surveillance with the Comprehensive Antibiotic Resistance Database. Nucleic Acids Res. 2020, 48, D517–D525. [Google Scholar] [CrossRef] [PubMed]
  75. Johansson, M.H.K.; Bortolaia, V.; Tansirichaiya, S.; Aarestrup, F.M.; Roberts, A.P.; Petersen, T.N. Detection of Mobile Genetic Elements Associated with Antibiotic Resistance in Salmonella Enterica Using a Newly Developed Web Tool: MobileElementFinder. J. Antimicrob. Chemother. 2021, 76, 101–109. [Google Scholar] [CrossRef] [PubMed]
  76. Krawczyk, P.S.; Lipinski, L.; Dziembowski, A. PlasFlow: Predicting Plasmid Sequences in Metagenomic Data Using Genome Signatures. Nucleic Acids Res. 2018, 46, e35. [Google Scholar] [CrossRef] [PubMed]
  77. Roux, S.; Enault, F.; Hurwitz, B.L.; Sullivan, M.B. VirSorter: Mining Viral Signal from Microbial Genomic Data. PeerJ 2015, 3, e985. [Google Scholar] [CrossRef] [PubMed]
  78. FEEDAP. Guidance on the Assessment of Bacterial Susceptibility to Antimicrobials of Human and Veterinary Importance. EFSA J. 2012, 10. [Google Scholar] [CrossRef]
  79. Xu, Y.; Yu, Y.; Shen, Y.; Li, Q.; Lan, J.; Wu, Y.; Zhang, R.; Cao, G.; Yang, C. Effects of Bacillus Subtilis and Bacillus Licheniformis on Growth Performance, Immunity, Short Chain Fatty Acid Production, Antioxidant Capacity, and Cecal Microflora in Broilers. Poult. Sci. 2021, 100, 101358. [Google Scholar] [CrossRef] [PubMed]
  80. Ma, Y.; Wang, W.; Zhang, H.; Wang, J.; Zhang, W.; Gao, J.; Wu, S.; Qi, G. Supplemental Bacillus Subtilis DSM 32315 Manipulates Intestinal Structure and Microbial Composition in Broiler Chickens. Sci. Rep. 2018, 8, 15358. [Google Scholar] [CrossRef] [PubMed]
  81. Trela, J.; Kierończyk, B.; Hautekiet, V.; Józefiak, D. Combination of Bacillus Licheniformis and Salinomycin: Effect on the Growth Performance and GIT Microbial Populations of Broiler Chickens. Animals 2020, 10, 889. [Google Scholar] [CrossRef] [PubMed]
  82. Wang, B.; Gong, L.; Zhou, Y.; Tang, L.; Zeng, Z.; Wang, Q.; Zou, P.; Yu, D.; Li, W. Probiotic Paenibacillus Polymyxa 10 and Lactobacillus Plantarum 16 Enhance Growth Performance of Broilers by Improving the Intestinal Health. Anim. Nutr. 2021, 7, 829–840. [Google Scholar] [CrossRef] [PubMed]
  83. Reuben, R.C.; Sarkar, S.L.; Ibnat, H.; Roy, P.C.; Jahid, I.K. Novel Mono- and Multi-Strain Probiotics Supplementation Modulates Growth, Intestinal Microflora Composition and Haemato-Biochemical Parameters in Broiler Chickens. Vet. Med. Sci. 2022, 8, 668–680. [Google Scholar] [CrossRef] [PubMed]
  84. Wu, Y.; Zhen, W.; Geng, Y.; Wang, Z.; Guo, Y. Effects of Dietary Enterococcus Faecium NCIMB 11181 Supplementation on Growth Performance and Cellular and Humoral Immune Responses in Broiler Chickens. Poult. Sci 2019, 98, 150–163. [Google Scholar] [CrossRef] [PubMed]
  85. Han, W.; Zhang, X.L.; Wang, D.W.; Li, L.Y.; Liu, G.L.; Li, A.K.; Zhao, Y.X. Effects of Microencapsulated Enterococcus Fecalis CG1.0007 on Growth Performance, Antioxidation Activity, and Intestinal Microbiota in Broiler Chickens. J. Anim. Sci. 2013, 91, 4374–4382. [Google Scholar] [CrossRef] [PubMed]
  86. Gao, P.; Hou, Q.; Kwok, L.-Y.; Huo, D.; Feng, S.; Zhang, H. Effect of Feeding Lactobacillus Plantarum P-8 on the Faecal Microbiota of Broiler Chickens Exposed to Lincomycin. Sci. Bull. 2017, 62, 105–113. [Google Scholar] [CrossRef]
  87. Sureshkumar, S.; Jung, S.K.; Kim, D.; Oh, K.B.; Yang, H.; Lee, H.C.; Jo, Y.J.; Lee, H.S.; Lee, S.; Byun, S.J. Administration of L. Salivarius Expressing 3D8 ScFv as a Feed Additive Improved the Growth Performance, Immune Homeostasis, and Gut Microbiota of Chickens. Anim. Sci. J. 2020, 91, e13399. [Google Scholar] [CrossRef]
  88. Khan, S.; Chousalkar, K.K. Short-Term Feeding of Probiotics and Synbiotics Modulates Caecal Microbiota during Salmonella Typhimurium Infection but Does Not Reduce Shedding and Invasion in Chickens. Appl. Microbiol. Biotechnol. 2020, 104, 319–334. [Google Scholar] [CrossRef]
  89. Ahmed, M.; Lyass, L.; Markham, P.N.; Taylor, S.S.; Vázquez-Laslop, N.; Neyfakh, A.A. Two Highly Similar Multidrug Transporters of Bacillus Subtilis Whose Expression Is Differentially Regulated. J. Bacteriol. 1995, 177, 3904–3910. [Google Scholar] [CrossRef]
  90. Neyfakh, A.A.; Bidnenko, V.E.; Chen, L.B. Efflux-Mediated Multidrug Resistance in Bacillus Subtilis: Similarities and Dissimilarities with the Mammalian System. Proc. Natl. Acad. Sci. USA 1991, 88, 4781–4785. [Google Scholar] [CrossRef] [PubMed]
  91. Klyachko, K.A.; Schuldiner, S.; Neyfakh, A.A. Mutations Affecting Substrate Specificity of the Bacillus Subtilis Multidrug Transporter Bmr. J. Bacteriol. 1997, 179, 2189–2193. [Google Scholar] [CrossRef] [PubMed]
  92. Podlesek, Z.; Comino, A.; Herzog-Velikonja, B.; Zgur-Bertok, D.; Komel, R.; Grabnar, M. Bacillus Licheniformis Bacitracin-Resistance ABC Transporter: Relationship to Mammalian Multidrug Resistance. Mol. Microbiol. 1995, 16, 969–976. [Google Scholar] [CrossRef]
  93. Jack, D.L.; Storms, M.L.; Tchieu, J.H.; Paulsen, I.T.; Saier, M.H. A Broad-Specificity Multidrug Efflux Pump Requiring a Pair of Homologous SMR-Type Proteins. J. Bacteriol. 2000, 182, 2311–2313. [Google Scholar] [CrossRef] [PubMed]
  94. Agersø, Y.; Bjerre, K.; Brockmann, E.; Johansen, E.; Nielsen, B.; Siezen, R.; Stuer-Lauridsen, B.; Wels, M.; Zeidan, A.A. Putative Antibiotic Resistance Genes Present in Extant Bacillus Licheniformis and Bacillus Paralicheniformis Strains Are Probably Intrinsic and Part of the Ancient Resistome. PLoS ONE 2019, 14, e0210363. [Google Scholar] [CrossRef]
  95. Pawlowski, A.C.; Stogios, P.J.; Koteva, K.; Skarina, T.; Evdokimova, E.; Savchenko, A.; Wright, G.D. The Evolution of Substrate Discrimination in Macrolide Antibiotic Resistance Enzymes. Nat. Commun. 2018, 9, 112. [Google Scholar] [CrossRef]
  96. Hachmann, A.-B.; Sevim, E.; Gaballa, A.; Popham, D.L.; Antelmann, H.; Helmann, J.D. Reduction in Membrane Phosphatidylglycerol Content Leads to Daptomycin Resistance in Bacillus Subtilis. Antimicrob. Agents Chemother. 2011, 55, 4326–4337. [Google Scholar] [CrossRef]
  97. Hachmann, A.-B.; Angert, E.R.; Helmann, J.D. Genetic Analysis of Factors Affecting Susceptibility of Bacillus Subtilis to Daptomycin. Antimicrob. Agents Chemother. 2009, 53, 1598–1609. [Google Scholar] [CrossRef] [PubMed]
  98. Ernst, C.M.; Staubitz, P.; Mishra, N.N.; Yang, S.-J.; Hornig, G.; Kalbacher, H.; Bayer, A.S.; Kraus, D.; Peschel, A. The Bacterial Defensin Resistance Protein MprF Consists of Separable Domains for Lipid Lysinylation and Antimicrobial Peptide Repulsion. PLoS Pathog. 2009, 5, e1000660. [Google Scholar] [CrossRef]
  99. Urshev, Z.; Yungareva, T. Initial Safety Evaluation of Enterococcus Faecium LBB.E81. Biotechnol. Biotechnol. Equip. 2021, 35, 11–17. [Google Scholar] [CrossRef]
  100. Hassen, B.; Abbassi, M.S.; Ruiz-Ripa, L.; Mama, O.M.; Hassen, A.; Torres, C.; Hammami, S. High Prevalence of Mcr-1 Encoding Colistin Resistance and First Identification of BlaCTX-M-55 in ESBL/CMY-2-Producing Escherichia Coli Isolated from Chicken Faeces and Retail Meat in Tunisia. Int. J. Food Microbiol. 2020, 318, 108478. [Google Scholar] [CrossRef] [PubMed]
  101. Poirel, L.; Héritier, C.; Podglajen, I.; Sougakoff, W.; Gutmann, L.; Nordmann, P. Emergence in Klebsiella Pneumoniae of a Chromosome-Encoded SHV Beta-Lactamase That Compromises the Efficacy of Imipenem. Antimicrob. Agents Chemother. 2003, 47, 755–758. [Google Scholar] [CrossRef] [PubMed]
  102. Di Conza, J.A.; Badaracco, A.; Ayala, J.; Rodríguez, C.; Famiglietti, A.; Gutkind, G.O. β-Lactamases Produced by Amoxicillin-Clavulanate-Resistant Enterobacteria Isolated in Buenos Aires, Argentina: A New BlaTEM Gene. Rev. Argent. Microbiol. 2014, 46, 210–217. [Google Scholar] [CrossRef]
Figure 1. Average weight gain of broilers per week, per group (n = 10 chickens/group). Group I served as the negative control and did not receive probiotics. Group II was treated with BioPlus YC, containing Bacillus licheniformis and Bacillus subtilis. Group III received Agroferm M+C, which includes Enterococcus faecium, Lactobacillus plantarum, and Pediococcus acidilactici. Group IV was given Ecobiol WX, containing Bacillus amyloliquefaciens. Group V received Gastroferm M+C, consisting of Lactobacillus plantarum, Pediococcus acidilactici, and Enterococcus faecium. Finally, Group VI was administered Fecinor Soluble Plus, which contains Enterococcus faecium.
Animals 14 01927 g001
Figure 2. Composition and variation of each sample in response to rearing and different probiotics fed at genus level, expressed as % of total sequence. D—day.
Animals 14 01927 g002
Figure 3. Changes in the microbiome composition at 4 and 42 days of age. D—day.
Animals 14 01927 g003
Figure 4. The enrichment solution containing tiamulin and florfenicol not only eliminated resistant strains in the samples but also led to an enrichment of Gram-negative bacteria. D—day.
Animals 14 01927 g004
Table 1. List and specifications of the selected probiotic products fed mixed with poultry feed.
No.ProductProbiotic StrainTribal NumberCFU/gTarget Animal
1.BioPlus YCBacillus licheniformisDSMZ57491.6 × 109poultry, swine, cattle
Bacillus subtilisDSMZ57501.6 × 109
2.Agroferm M+CEnterococcus faeciumDSM71341 × 109broiler, goose, turkey, duck
Lactobacillus plantarumDSM12837
Pediococcus acidilacticiDSM16243
3.Ecobiol WXBacillus amyloliquefacieusCECT59401 × 1010poultry
4.Gastroferm M+CLactobacillus plantarumDSM128371 × 109poultry
Pediococcus acidilacticiDSM16243
Enterococcus faeciumDSM7134
5.Fecinor Soluble PlusEnterococcus faeciumCECT45151 × 1010poultry, swine
Table 2. ARGs identified in each formulation. Coverage is the accuracy of the sequencing, with multiple coverage ensuring that the consensus is error-free. Identity is the overlap with the matched sequence.
ProductSequence %ARGMechanismResistance
CoverageIdentity
BioPlus YC 100 99.25 bltefflux pumpfluoroquinolones
10098.91vmlRtarget mutationmacrolides, lincosamides, pleuromutilinek, phenicols, tetracyclines, streptogramin, oxazolidone
10098.59aadKenzymatic inactivationaminoglycosides
10099.49tmrBpermeability reductionnucleosides
10099.79lmrBefflux pumplincosamides
10098.68mphKenzymatic inactivationmacrolides
100100mprFtarget mutationpeptide antibiotics
10099.74bmrefflux pumpfluoroquinolones, phenicols, nucleosides
86.1535.52dfrA43target mutationdiaminopyrimidines
10099.65ermDtarget mutationmacrolides, lincosamides
10098.03bcrCtarget mutationpeptide antibiotics
10098.56bcrBefflux pumppeptide antibiotics
96.0899.32bcrAefflux pumppeptide antibiotics
100100ykkCefflux pumpaminoglycosides, tetracyclines, phenicols
10099.05ykkDefflux pumpaminoglycosides, tetracyclines, phenicols
Agroferm M+C100100efmAefflux pumpmacrolides, fluoroquinolones
10098.9AAC(6’)-Iienzymatic inactivationaminoglycosides
10097.15msrCtarget mutationmacrolides, lincosamides, pleuromutilinek, phenicols, tetracyclines, streptogramin, oxazolidone
10099eatAvtarget mutation
Ecobiol WX10099.43clbAtarget mutationphenicols, lincosamides, pleuromutilinek, streptogramin, oxazolidone
82.5635.75dfrA43target mutationdiaminopyrimidines
Gastroferm M+C100100efmAefflux pumpmacrolides, fluoroquinolones
10097.15msrCtarget mutationmacrolides, lincosamides, pleuromutilines, phenicols, tetracyclines, streptogramin, oxazolidone
10098.9AAC(6’)-Iienzymatic inactivationaminoglycosides
10099eatAvtarget mutationmacrolides, lincosamides, pleuromutilines, phenicols, tetracyclines, streptogramin, oxazolidone
Fecinor Soluble Plus10098.9AAC(6’)-Iienzymatic inactivationaminoglycosides
10097.15msrCtarget mutationmacrolides, lincosamides, pleuromutilines, phenicols, tetracyclines, streptogramin, oxazolidone
10099eatAvtarget mutation
Table 3. Minimum inhibitory concentration (MIC) values for strains isolated from each formulation. Green indicates where phenotypic resistance was observed in addition to the antimicrobial resistance gene (ARG) content presumably caused by them.
No.Probiotic StrainPENAMAMCCTRGENOTCDOXTIL
µg/mL
1.Bacillus licheniformis0.121216880.060.5
Bacillus subtilis10.50.50.25160.125320.5
2.Enterococcus faecium81116320.250.1251
Lactobacillus plantarum1164168842
Pediococcus acidilactici116816440.50.125
3.Bacillus amyloliquefacieus0.06124320.250.250.5
4.Lactobacillus plantarum420.516320.50.1254
Pediococcus acidilactici1164163232164
Enterococcus faecium81116320.250.1251
5.Enterococcus faecium41116320.250.1254
PEN—penicillin; AM—amoxicillin; AMC—amoxicillin–clavulanic acid; CTR—ceftriaxone; GEN—gentamicin; OTC—oxitetraciklin; DOX—doxycycline; TIL—tilozin.
Table 4. Minimum inhibitory concentration (MIC) values for strains isolated from each formulation. Green indicates where phenotypic resistance was observed in addition to the antimicrobial resistance gene (ARG) content presumably caused by them (continued).
No.Probiotic StrainFLOCLITIAVANGATPSASULTRI
µg/mL
1.Bacillus licheniformis232640.250.034640.25
Bacillus subtilis22640.250.032640.5
2.Enterococcus faecium846420.5128128128
Lactobacillus plantarum40.066432212812864
Pediococcus acidilactici40.061320.512864128
3.Bacillus amyloliquefacieus20.56410.0341280.5
4.Lactobacillus plantarum846432112812864
Pediococcus acidilactici80.0664328128128128
Enterococcus faecium846412128128128
5.Enterococcus faecium846421128128128
FLO—florfenicol; CLI—clindamycin; TIA—tiamulin; VAN—vancomycin; GAT—gatifloxacin; PSA—potential sulphonamide; SUL—sulfamethoxazole; TRI—trimetoprim.
Disclaimer/Publisher’s Note: The statements, opinions and data contained in all publications are solely those of the individual author(s) and contributor(s) and not of MDPI and/or the editor(s). MDPI and/or the editor(s) disclaim responsibility for any injury to people or property resulting from any ideas, methods, instructions or products referred to in the content.

