
Influence of Different Feed Particle Sizes on the Growth Performance and Nutrition Composition in Crayfish, Procambarus clarkii Larvae

 and
and
Abstract
Simple Summary
Abstract
1. Introduction
2. Materials and Methods
2.1. Experimental Design and Feeding Trial
2.2. Sample Collection
2.3. Index Determination Method
2.3.1. Growth Performance
| Survival rate, SR = 100% × (Kt/K0) |
| Weight gain, WG = 100% × (Wt − W0)/W0 |
| Specific growth rate, SGR = 100% × (lnWt − ln W0)/t |
| Feed conversion ratio, FCR = 100% × Gd/(Wt − W0) |
| Condition factor, CF = 100 × Wt/L3 |
| Feed intake (FI, g/g of crayfish/day) = feed consumption/((Wt + W0)/2 × the experimental duration in days) |
| Meat content, MC = 100% × Gm/Wt |
2.3.2. Determination of Whole-Body Composition
2.3.3. Determination of Muscle Amino Acids and Fatty Acids
2.4. Statistical Analysis
3. Results
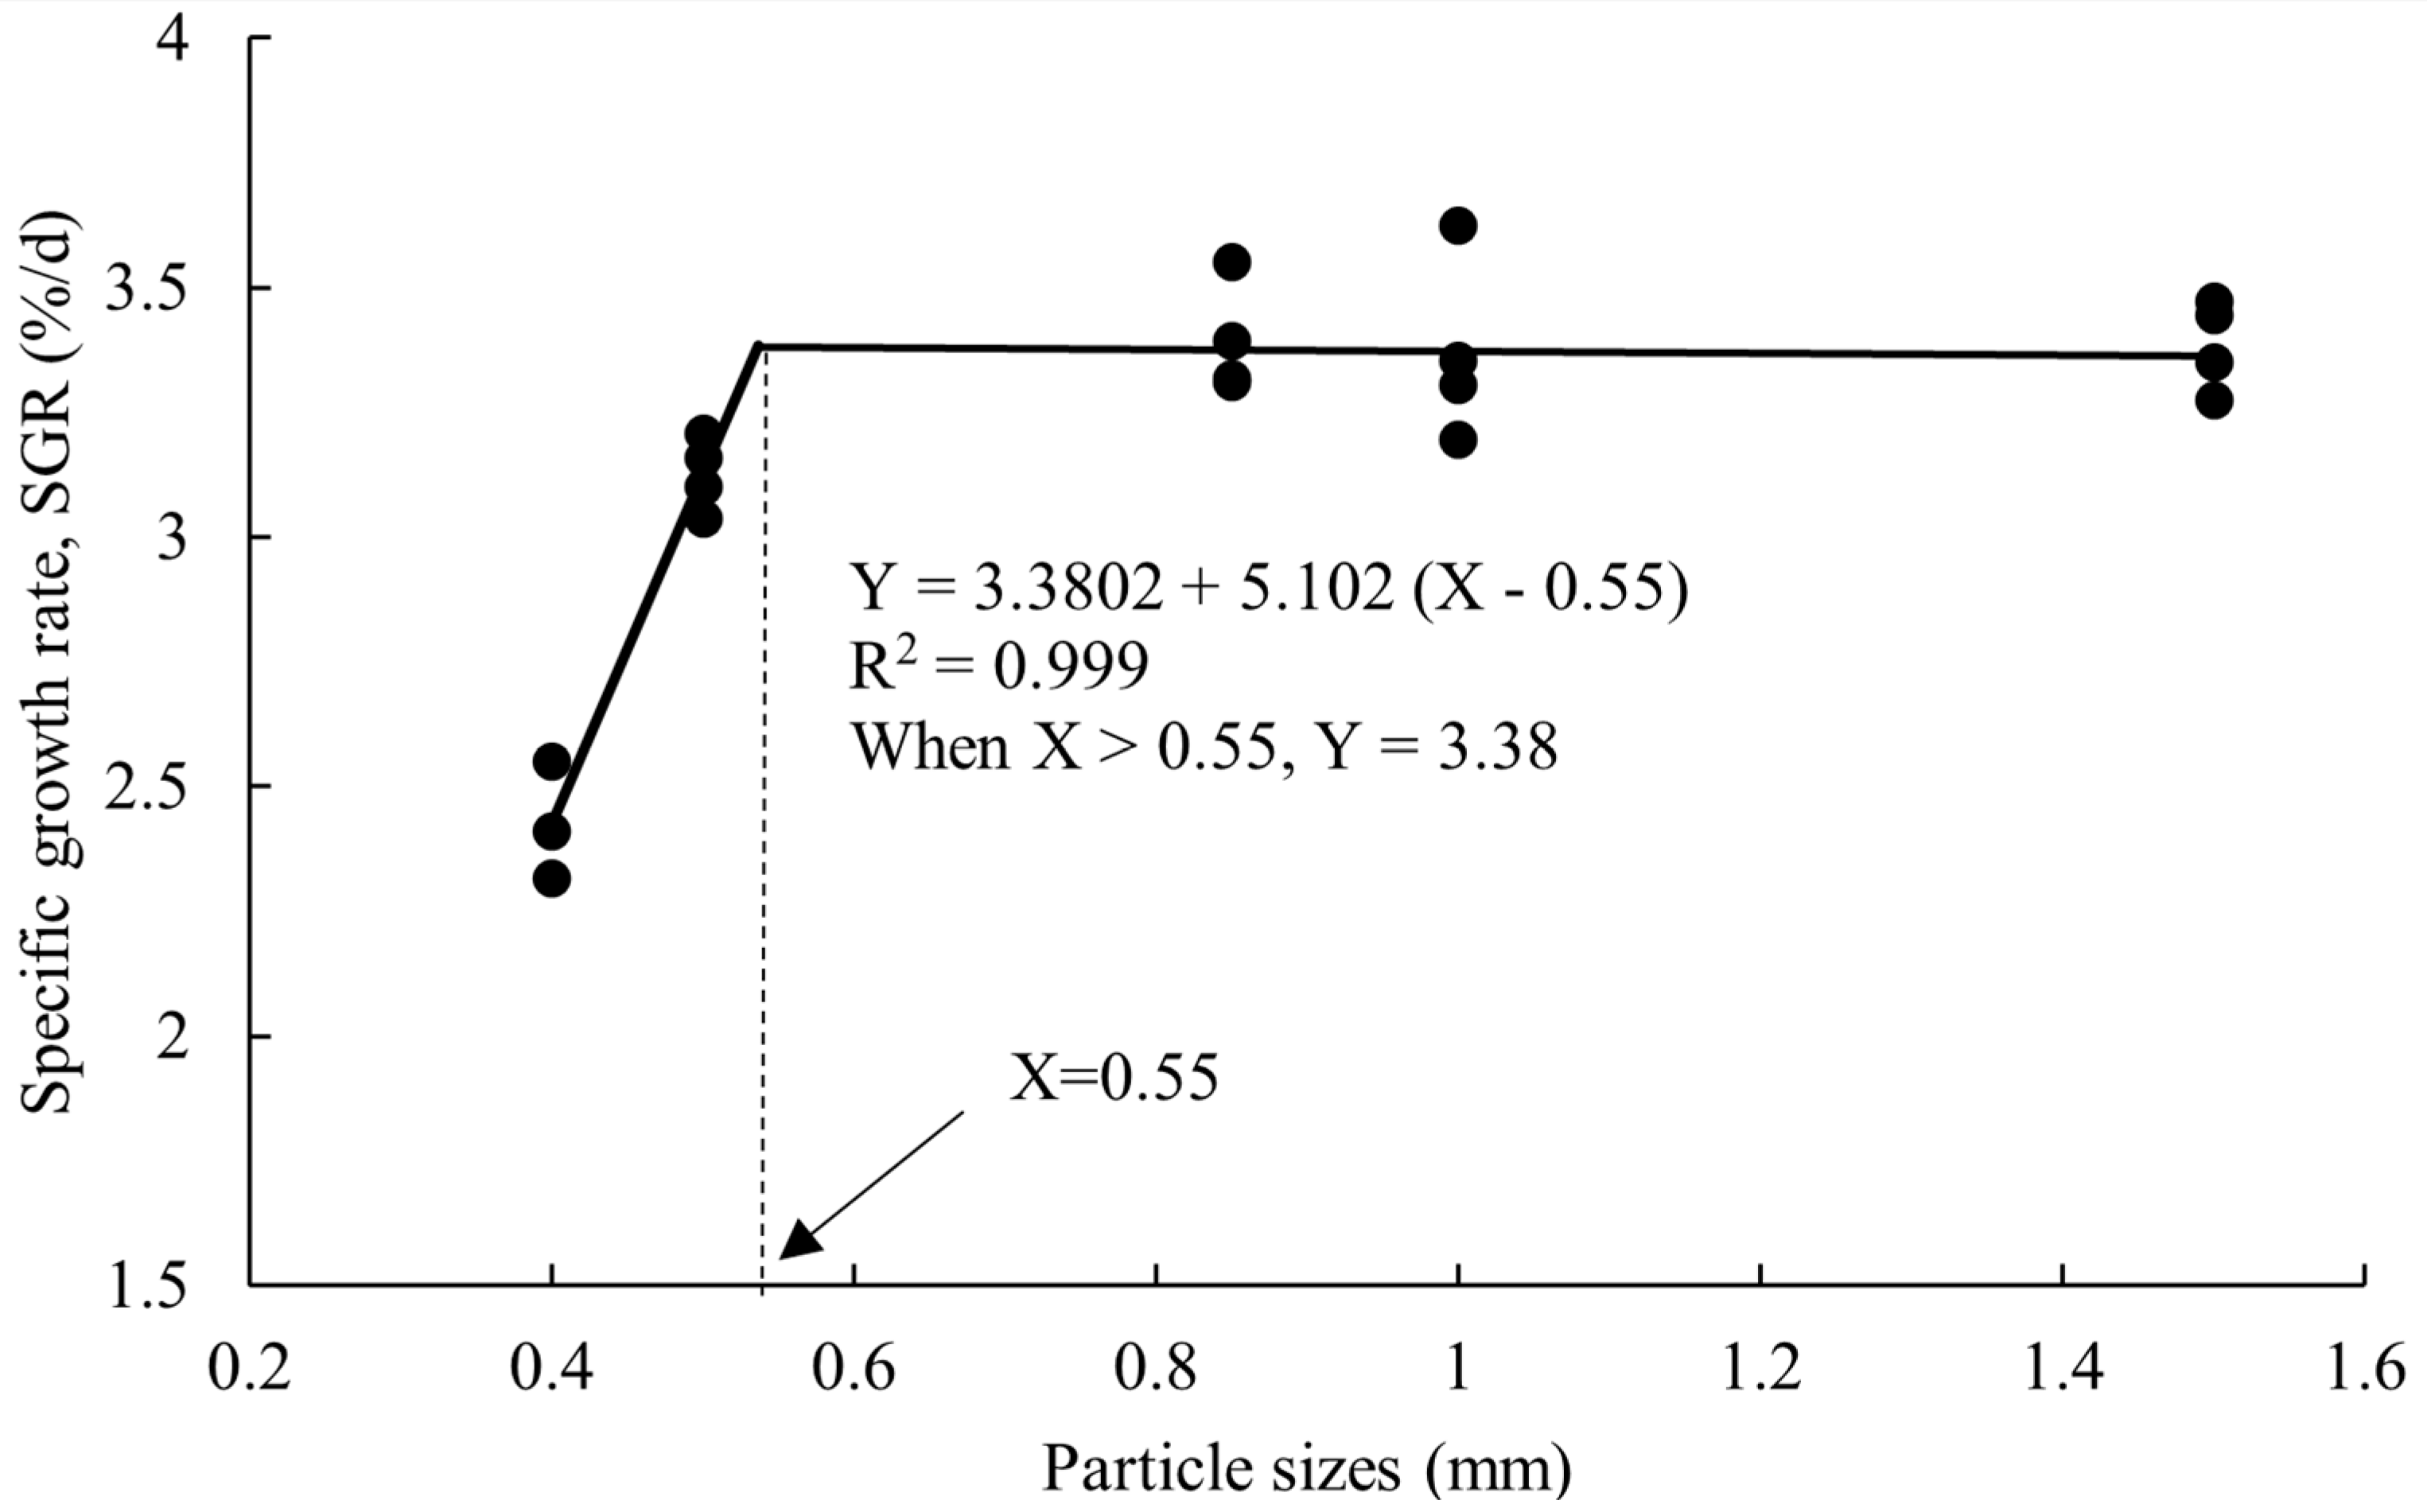
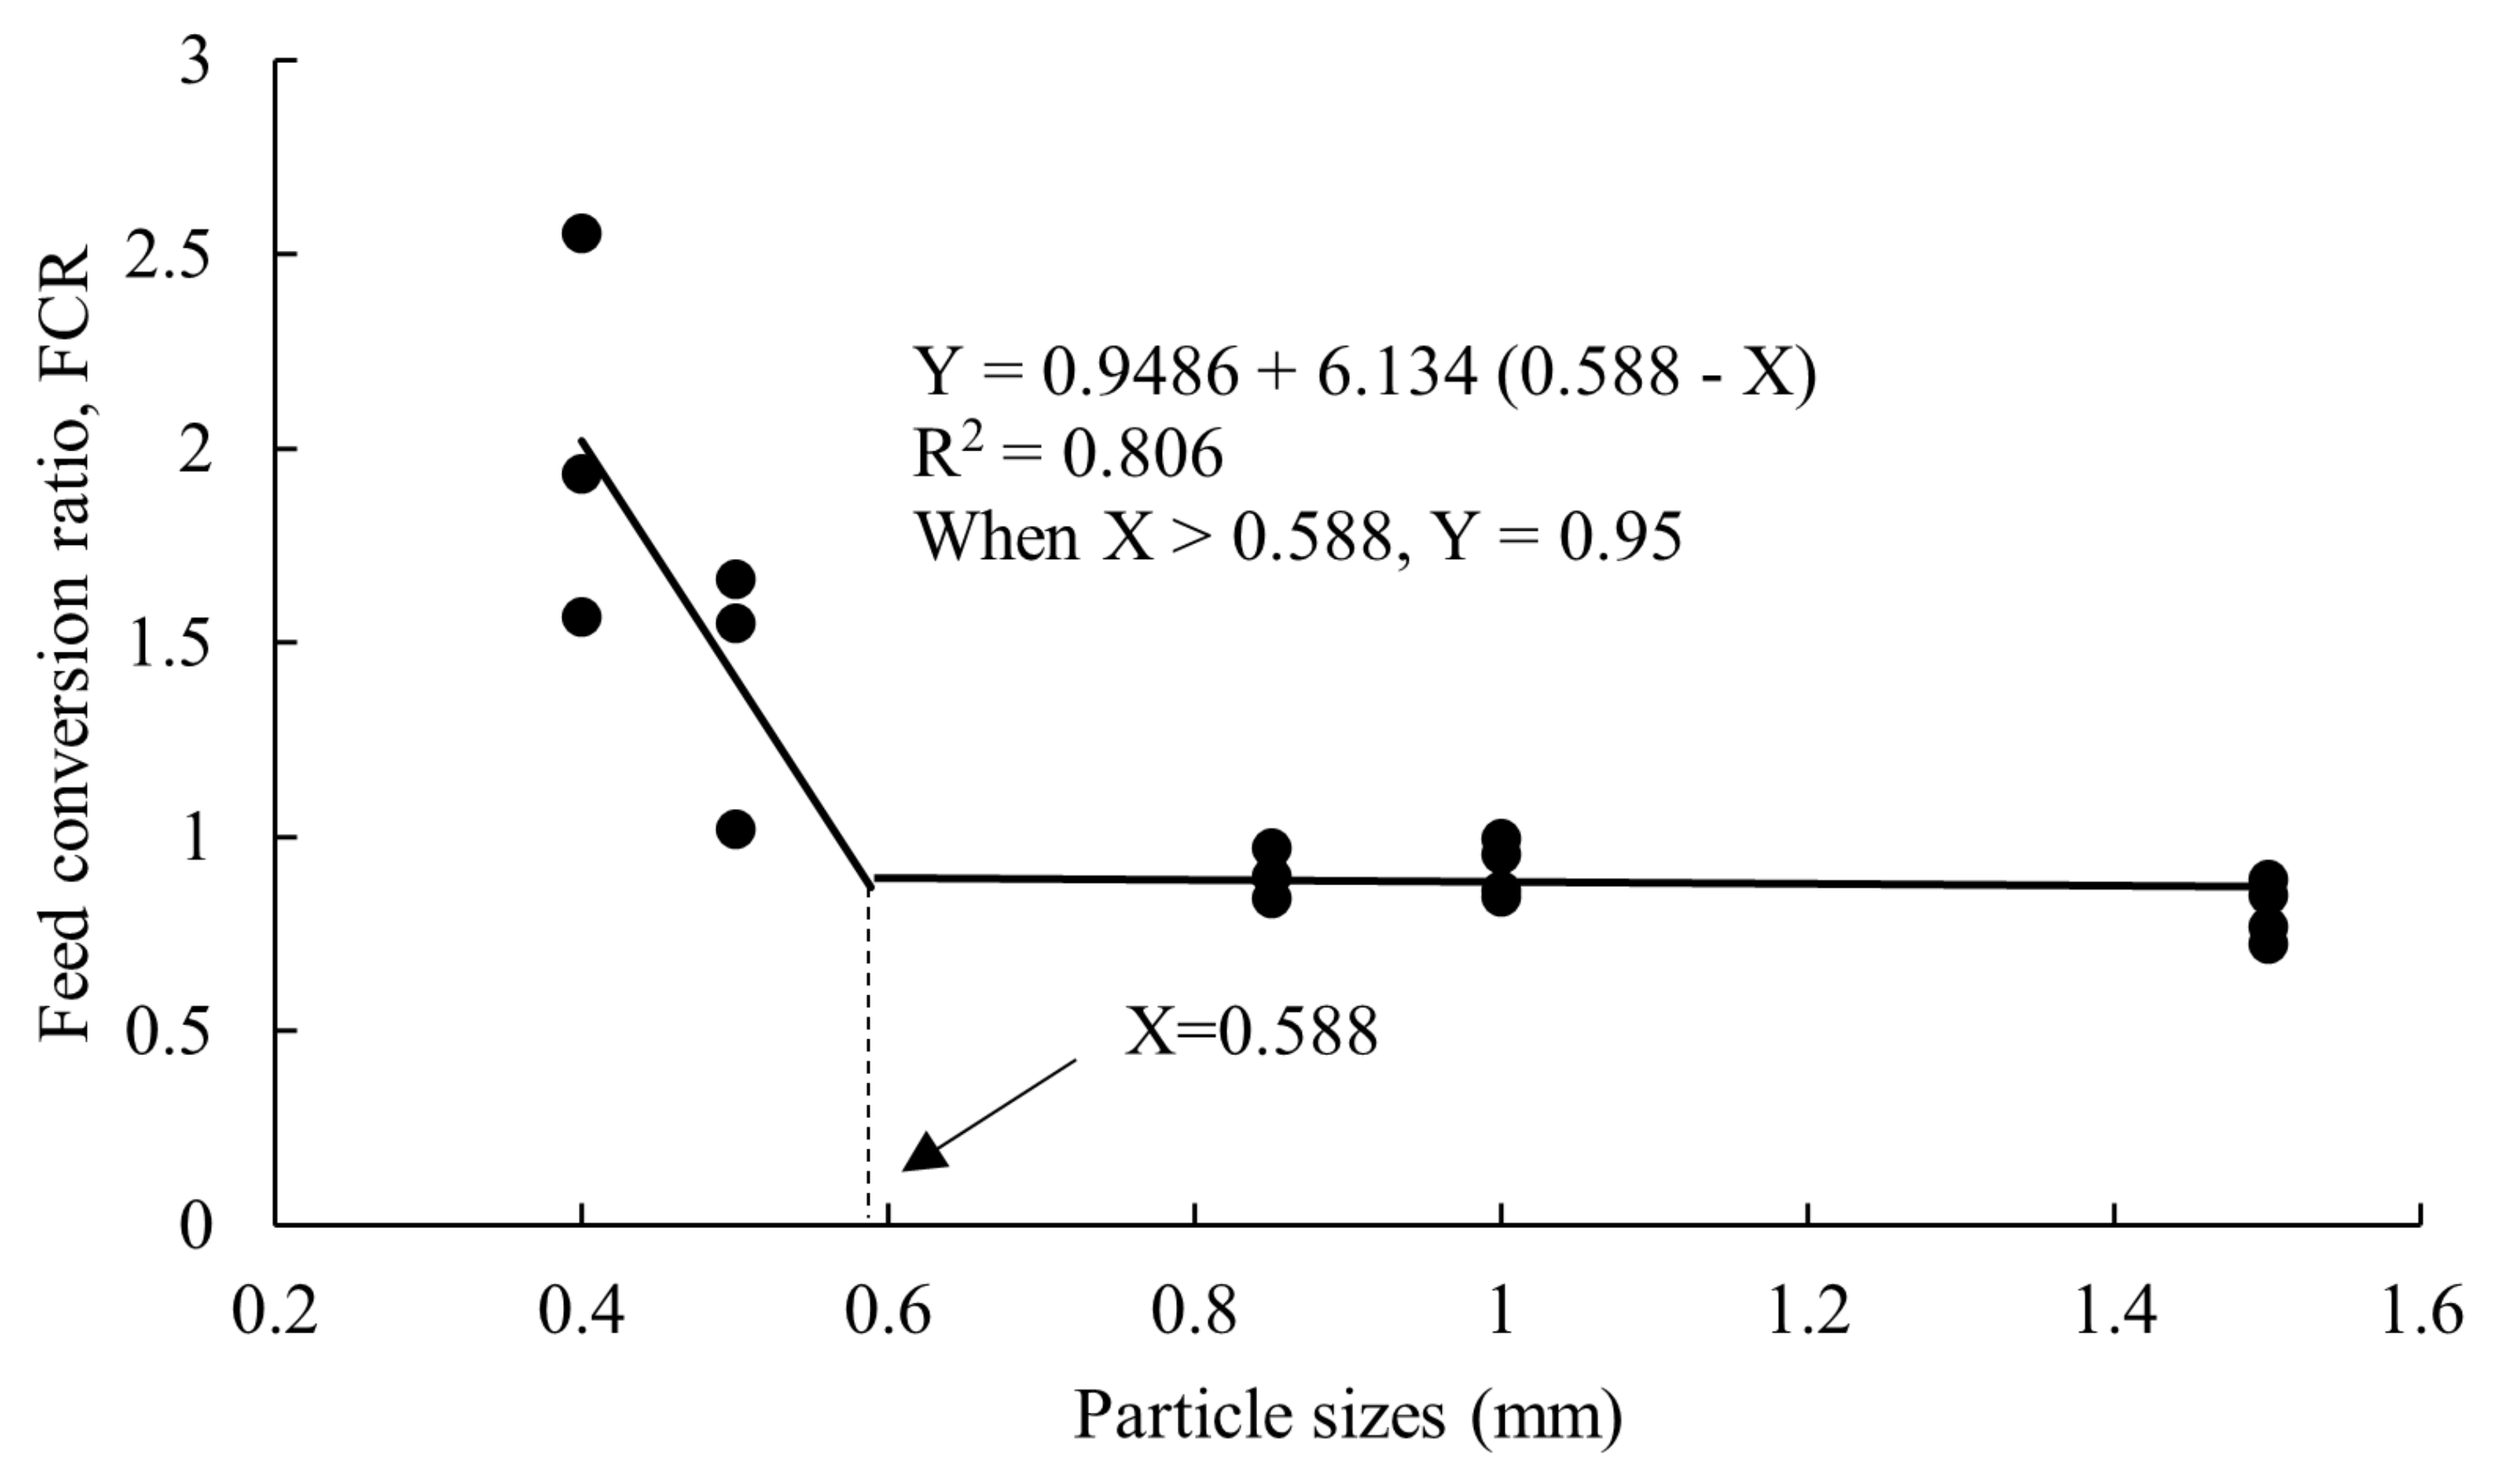
3.1. Growth Performance
3.2. Whole-Body Composition
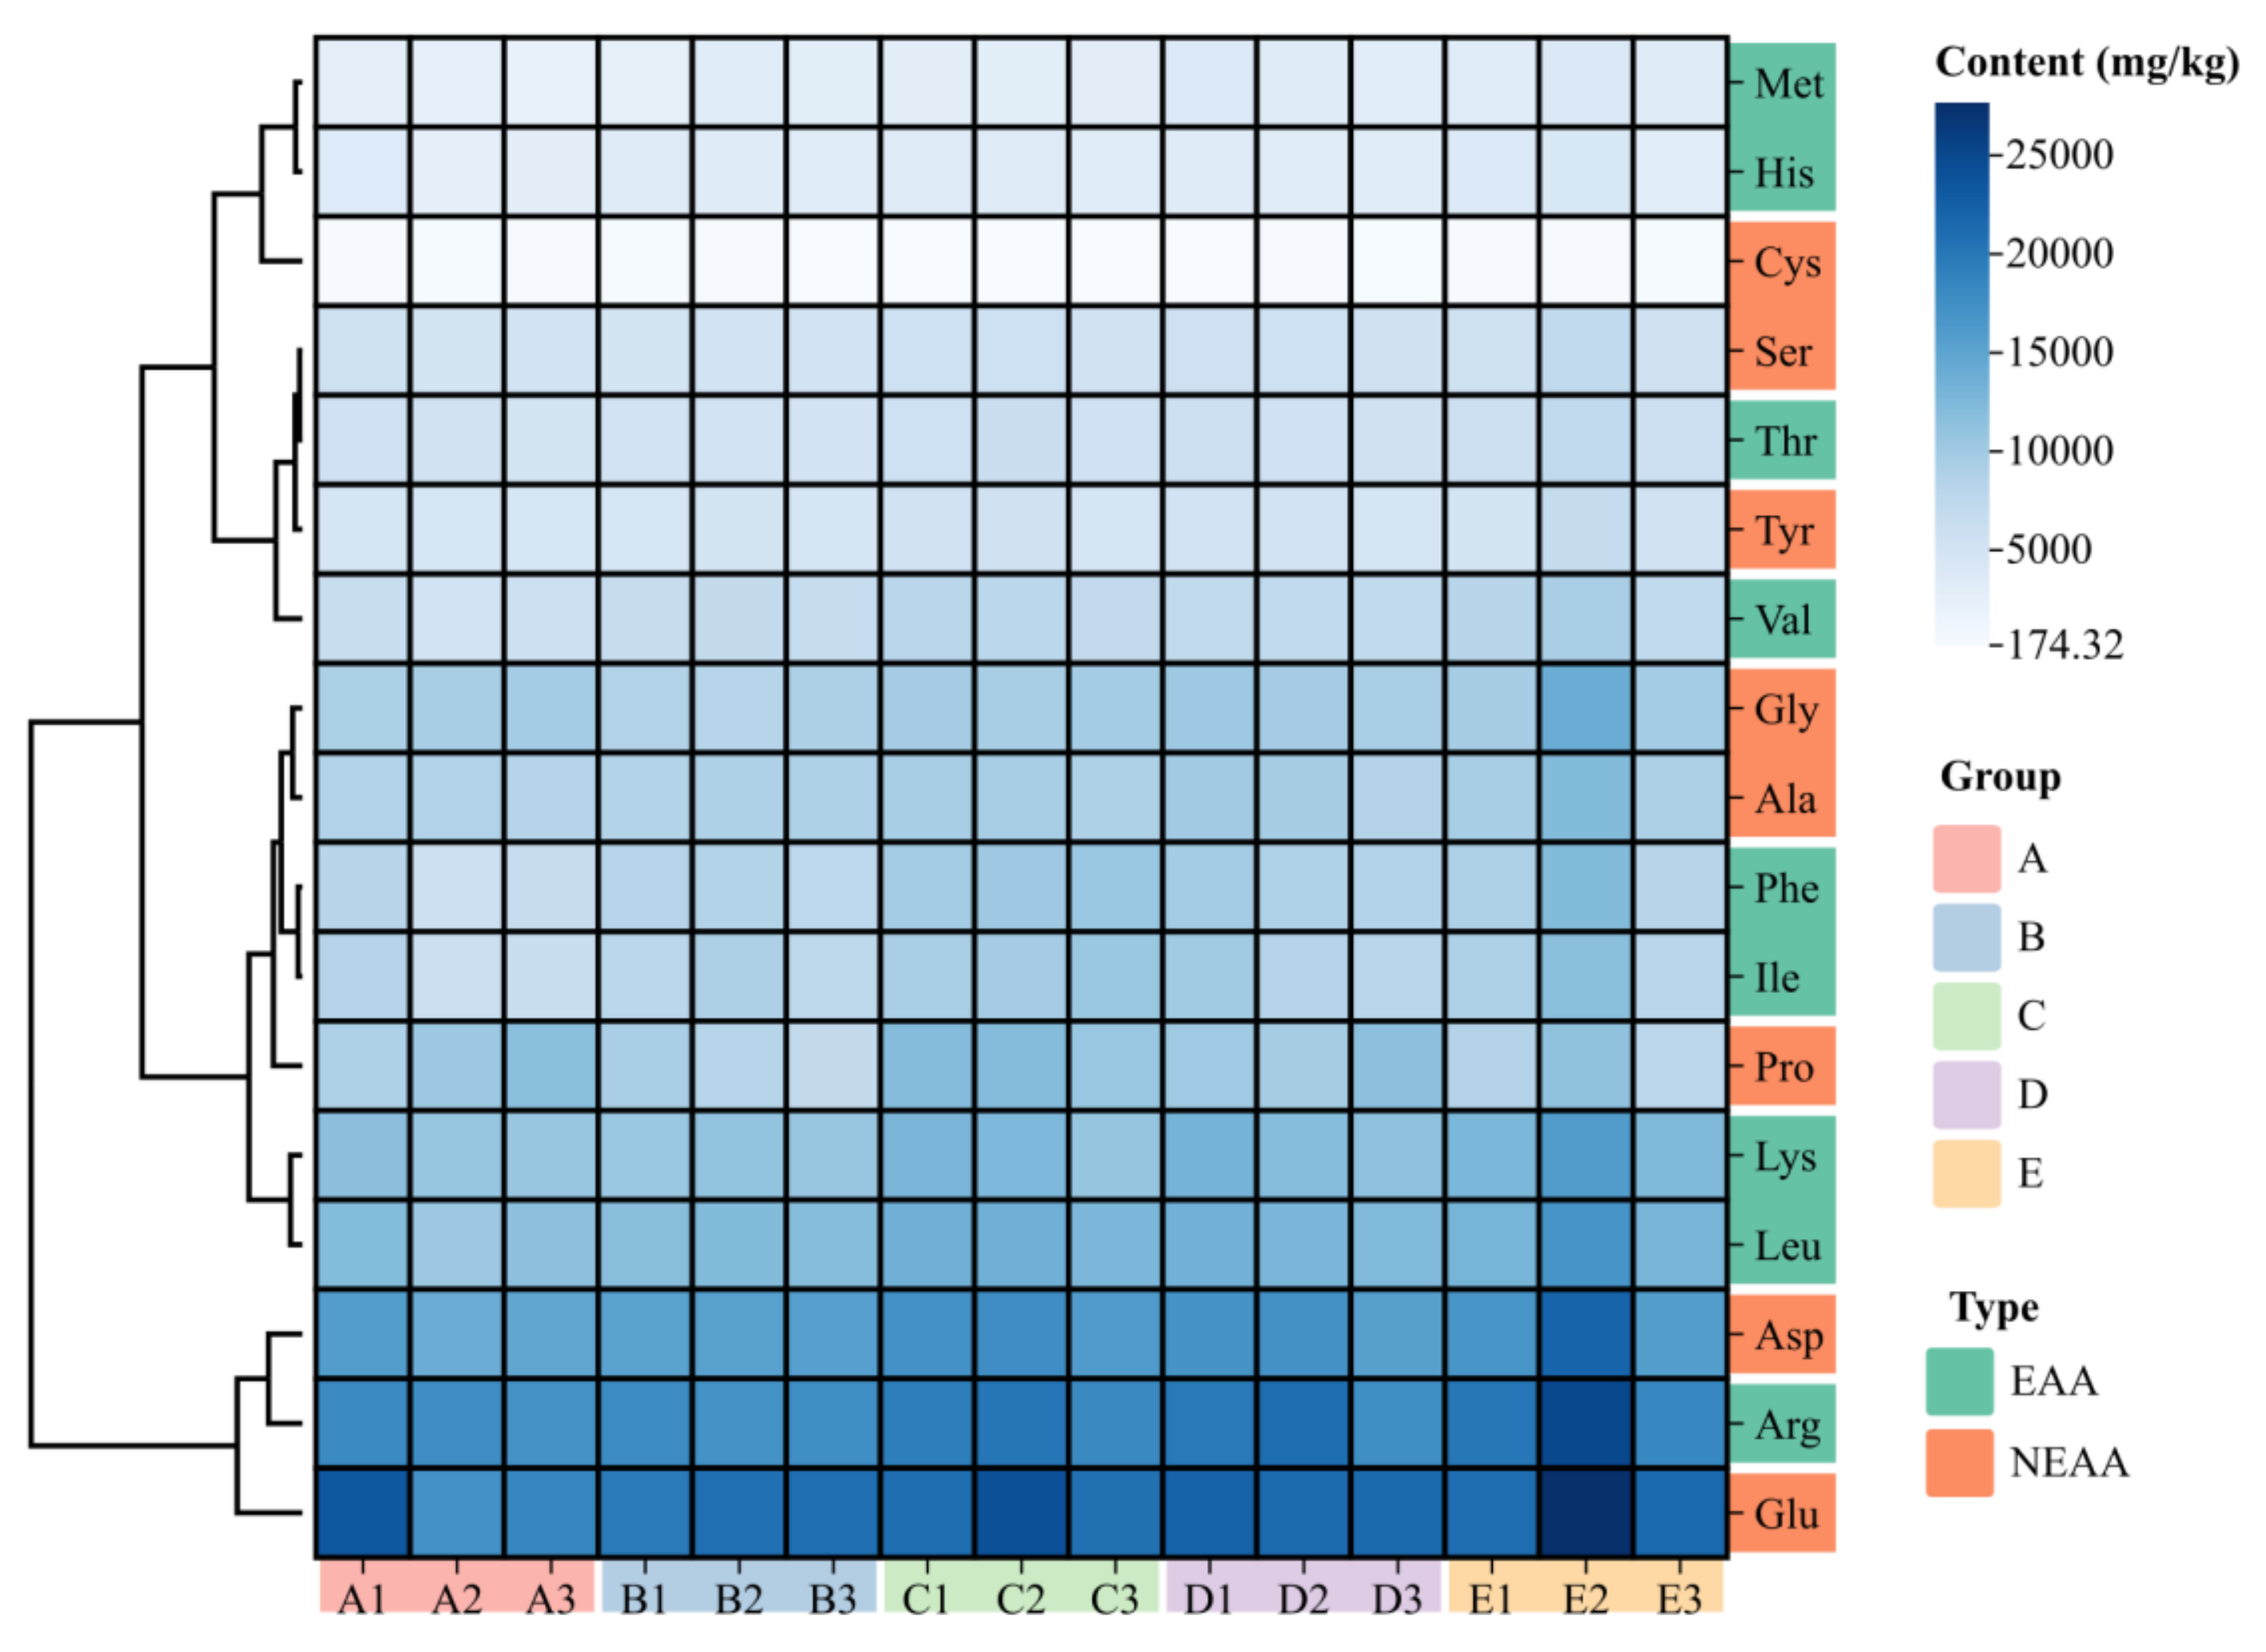
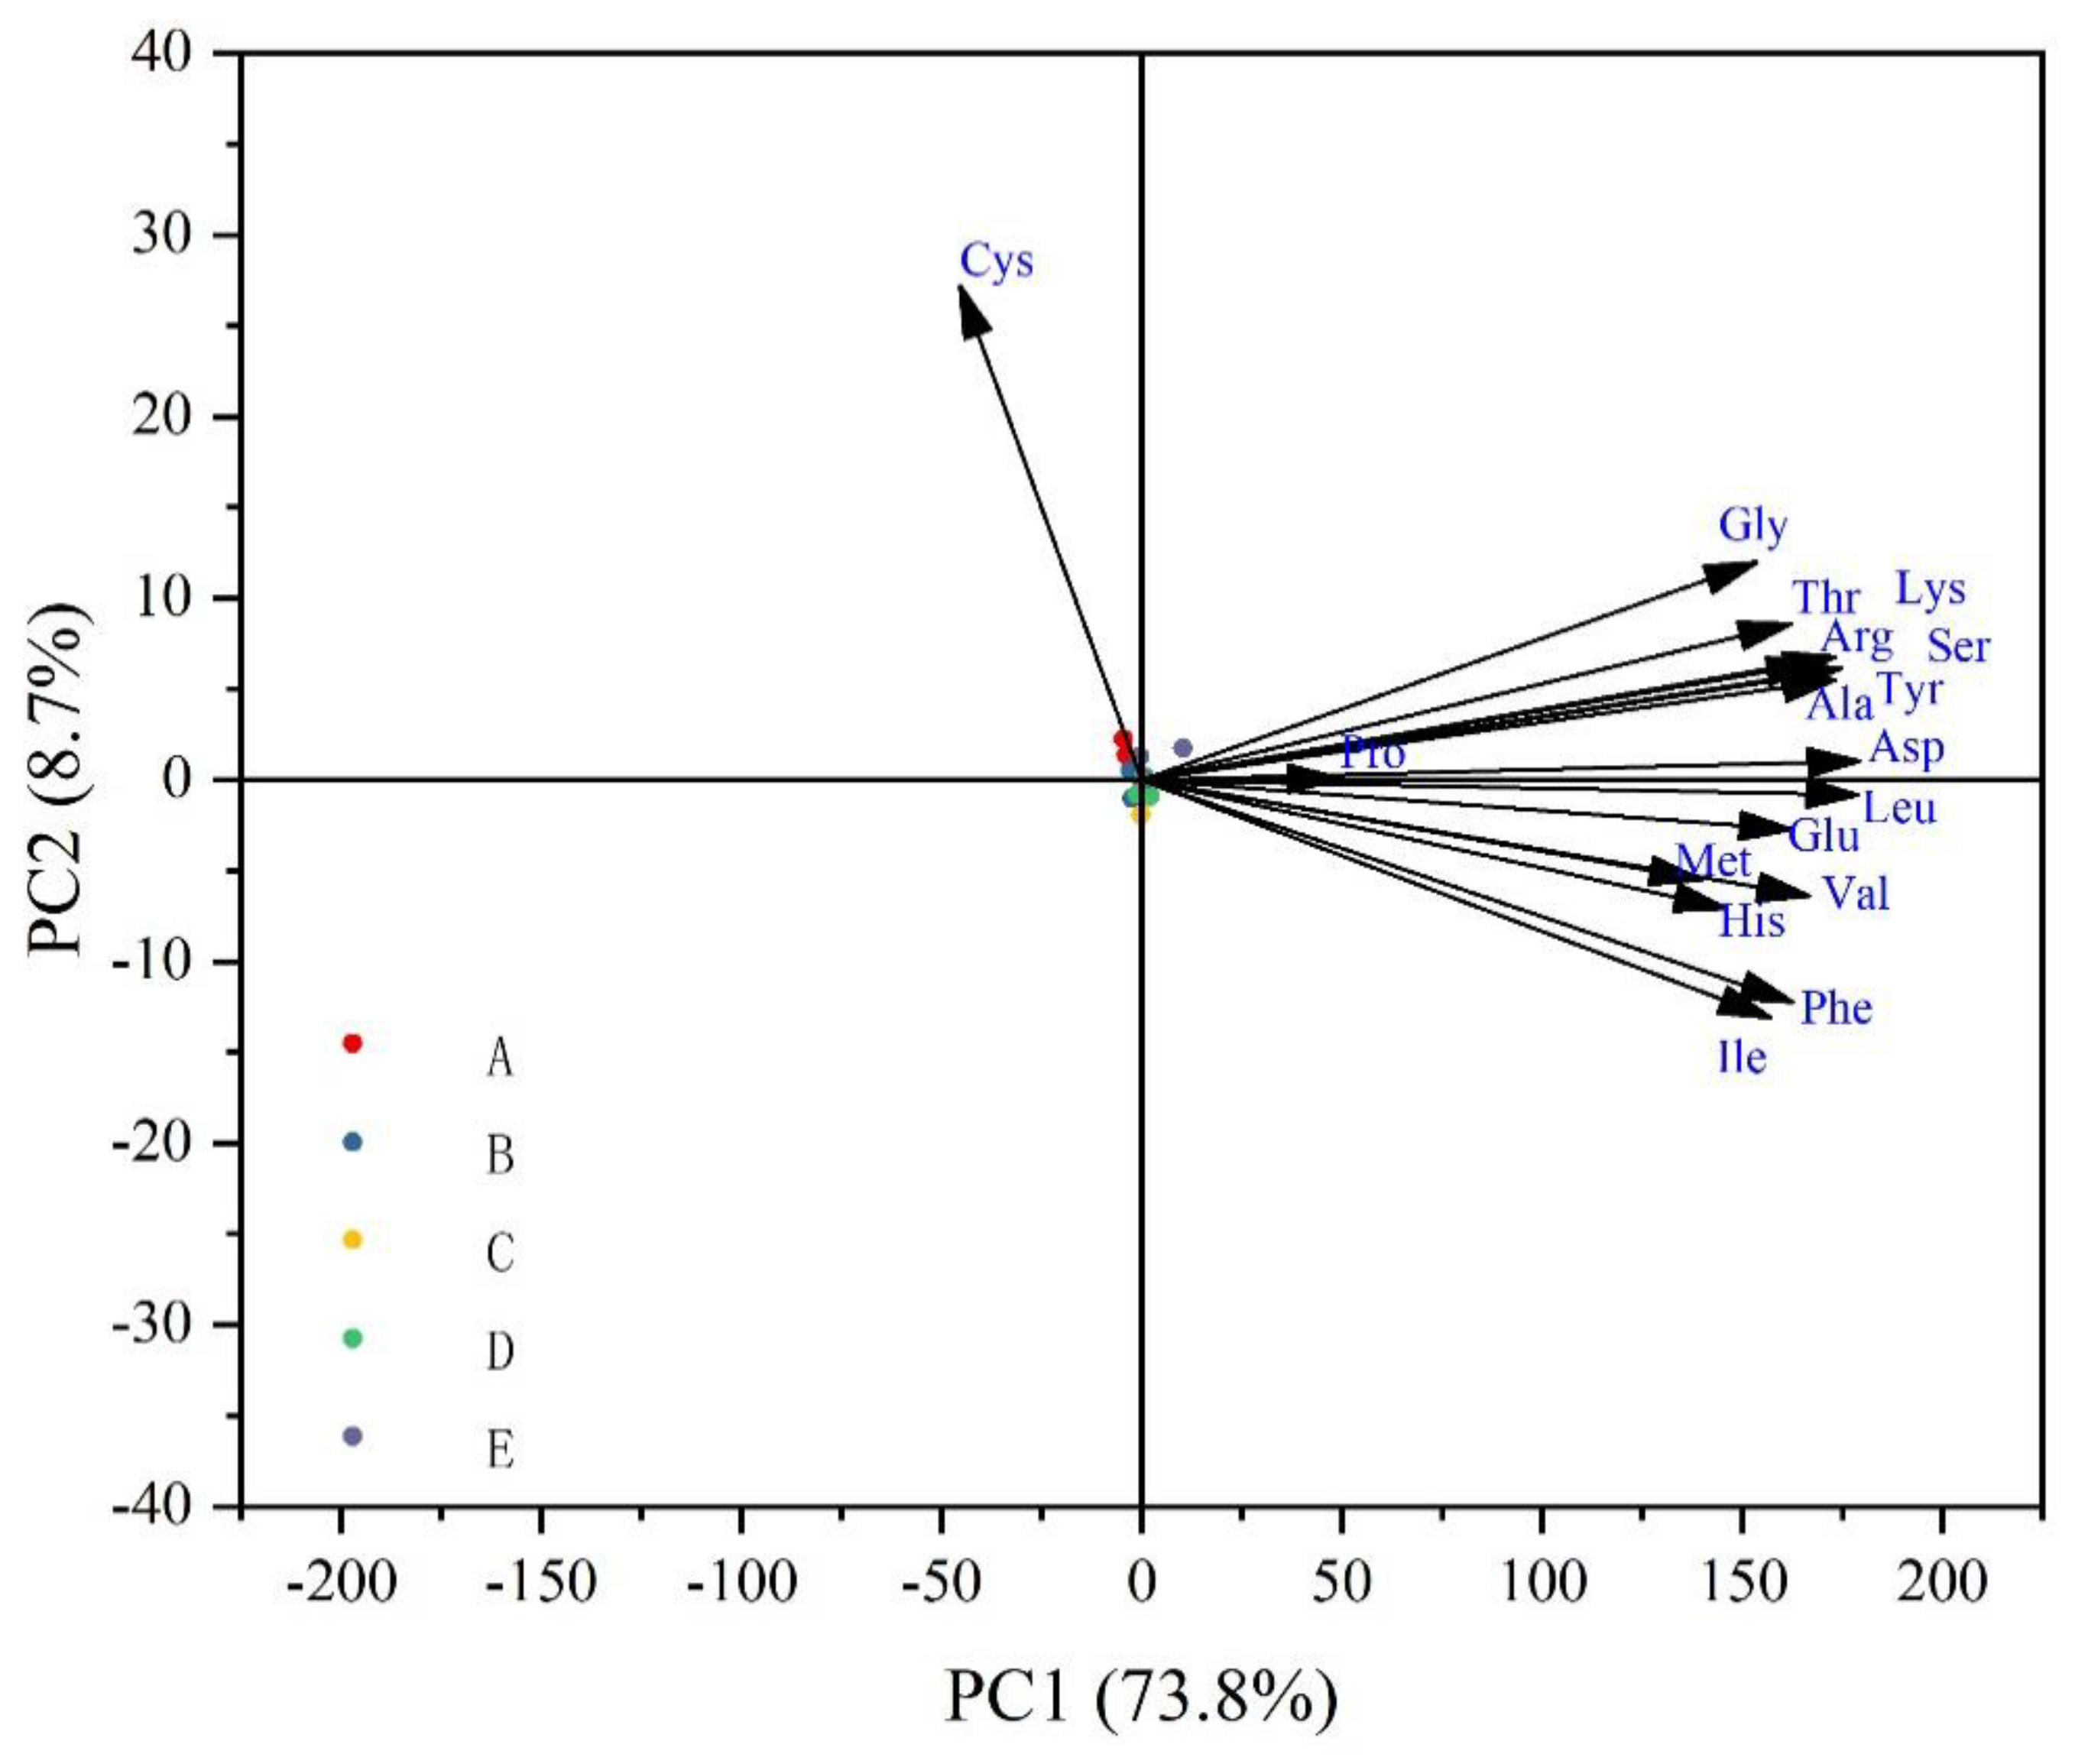
3.3. Amino Acids Composition and Principal Component Analysis
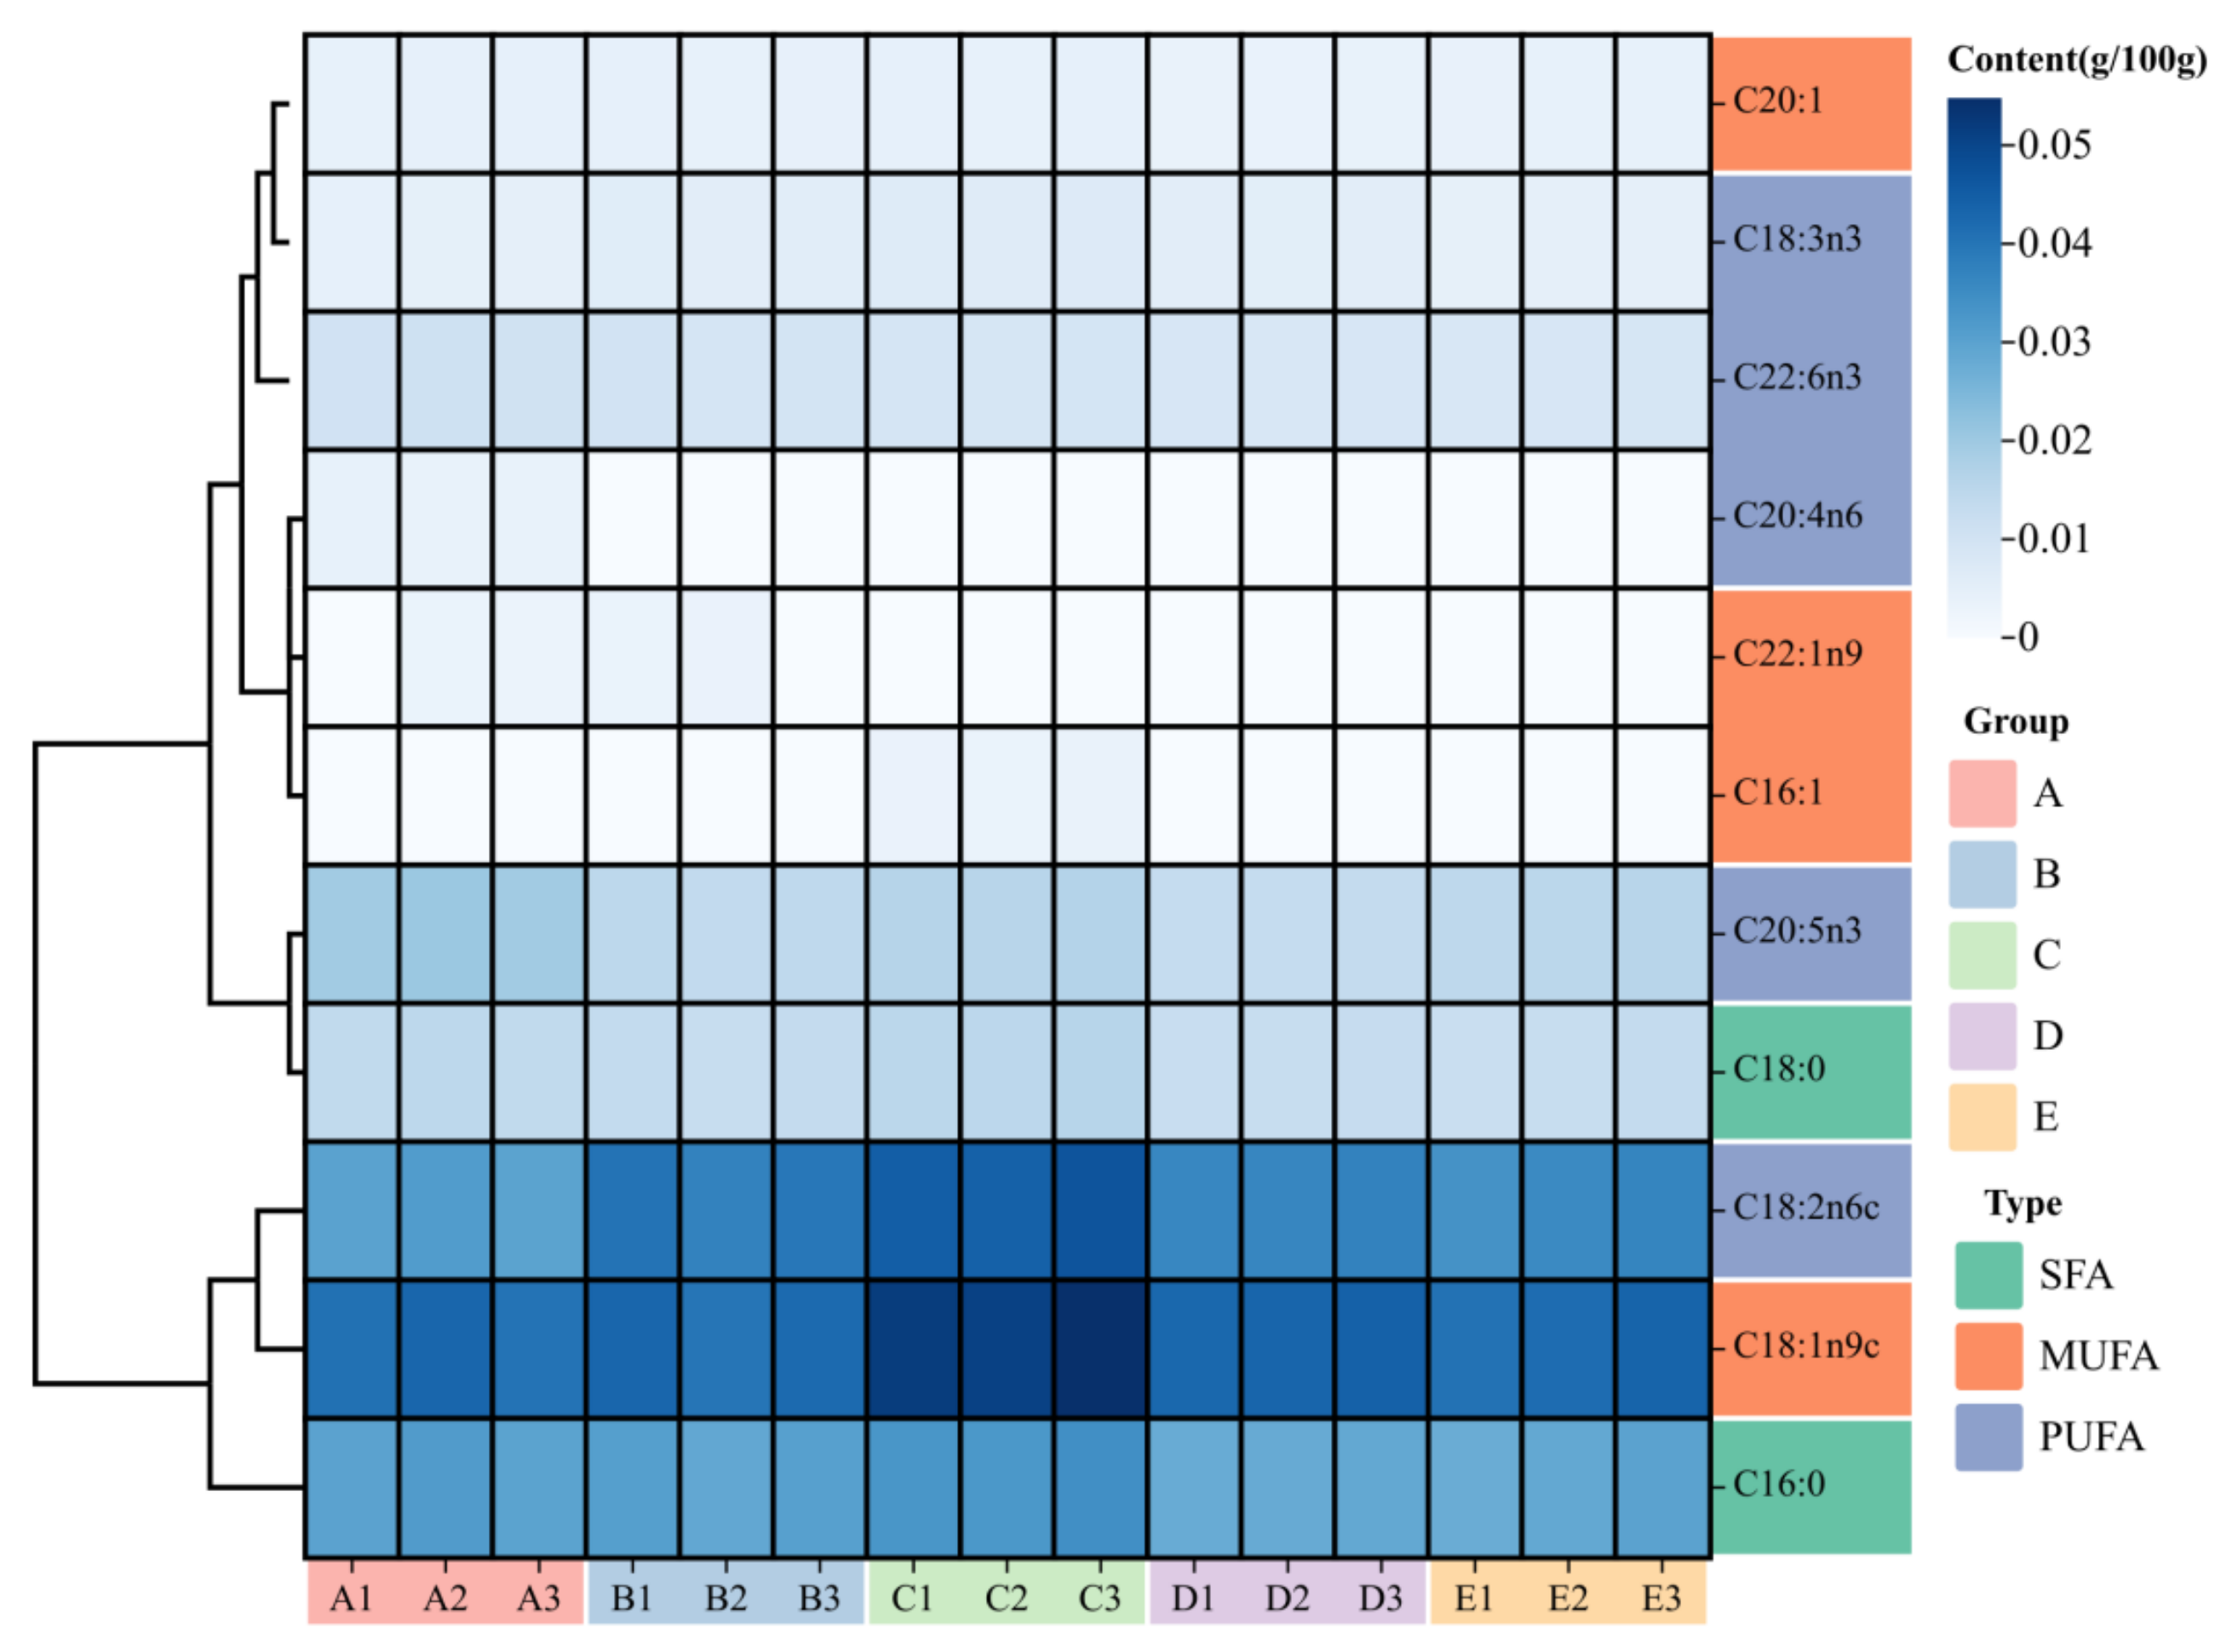
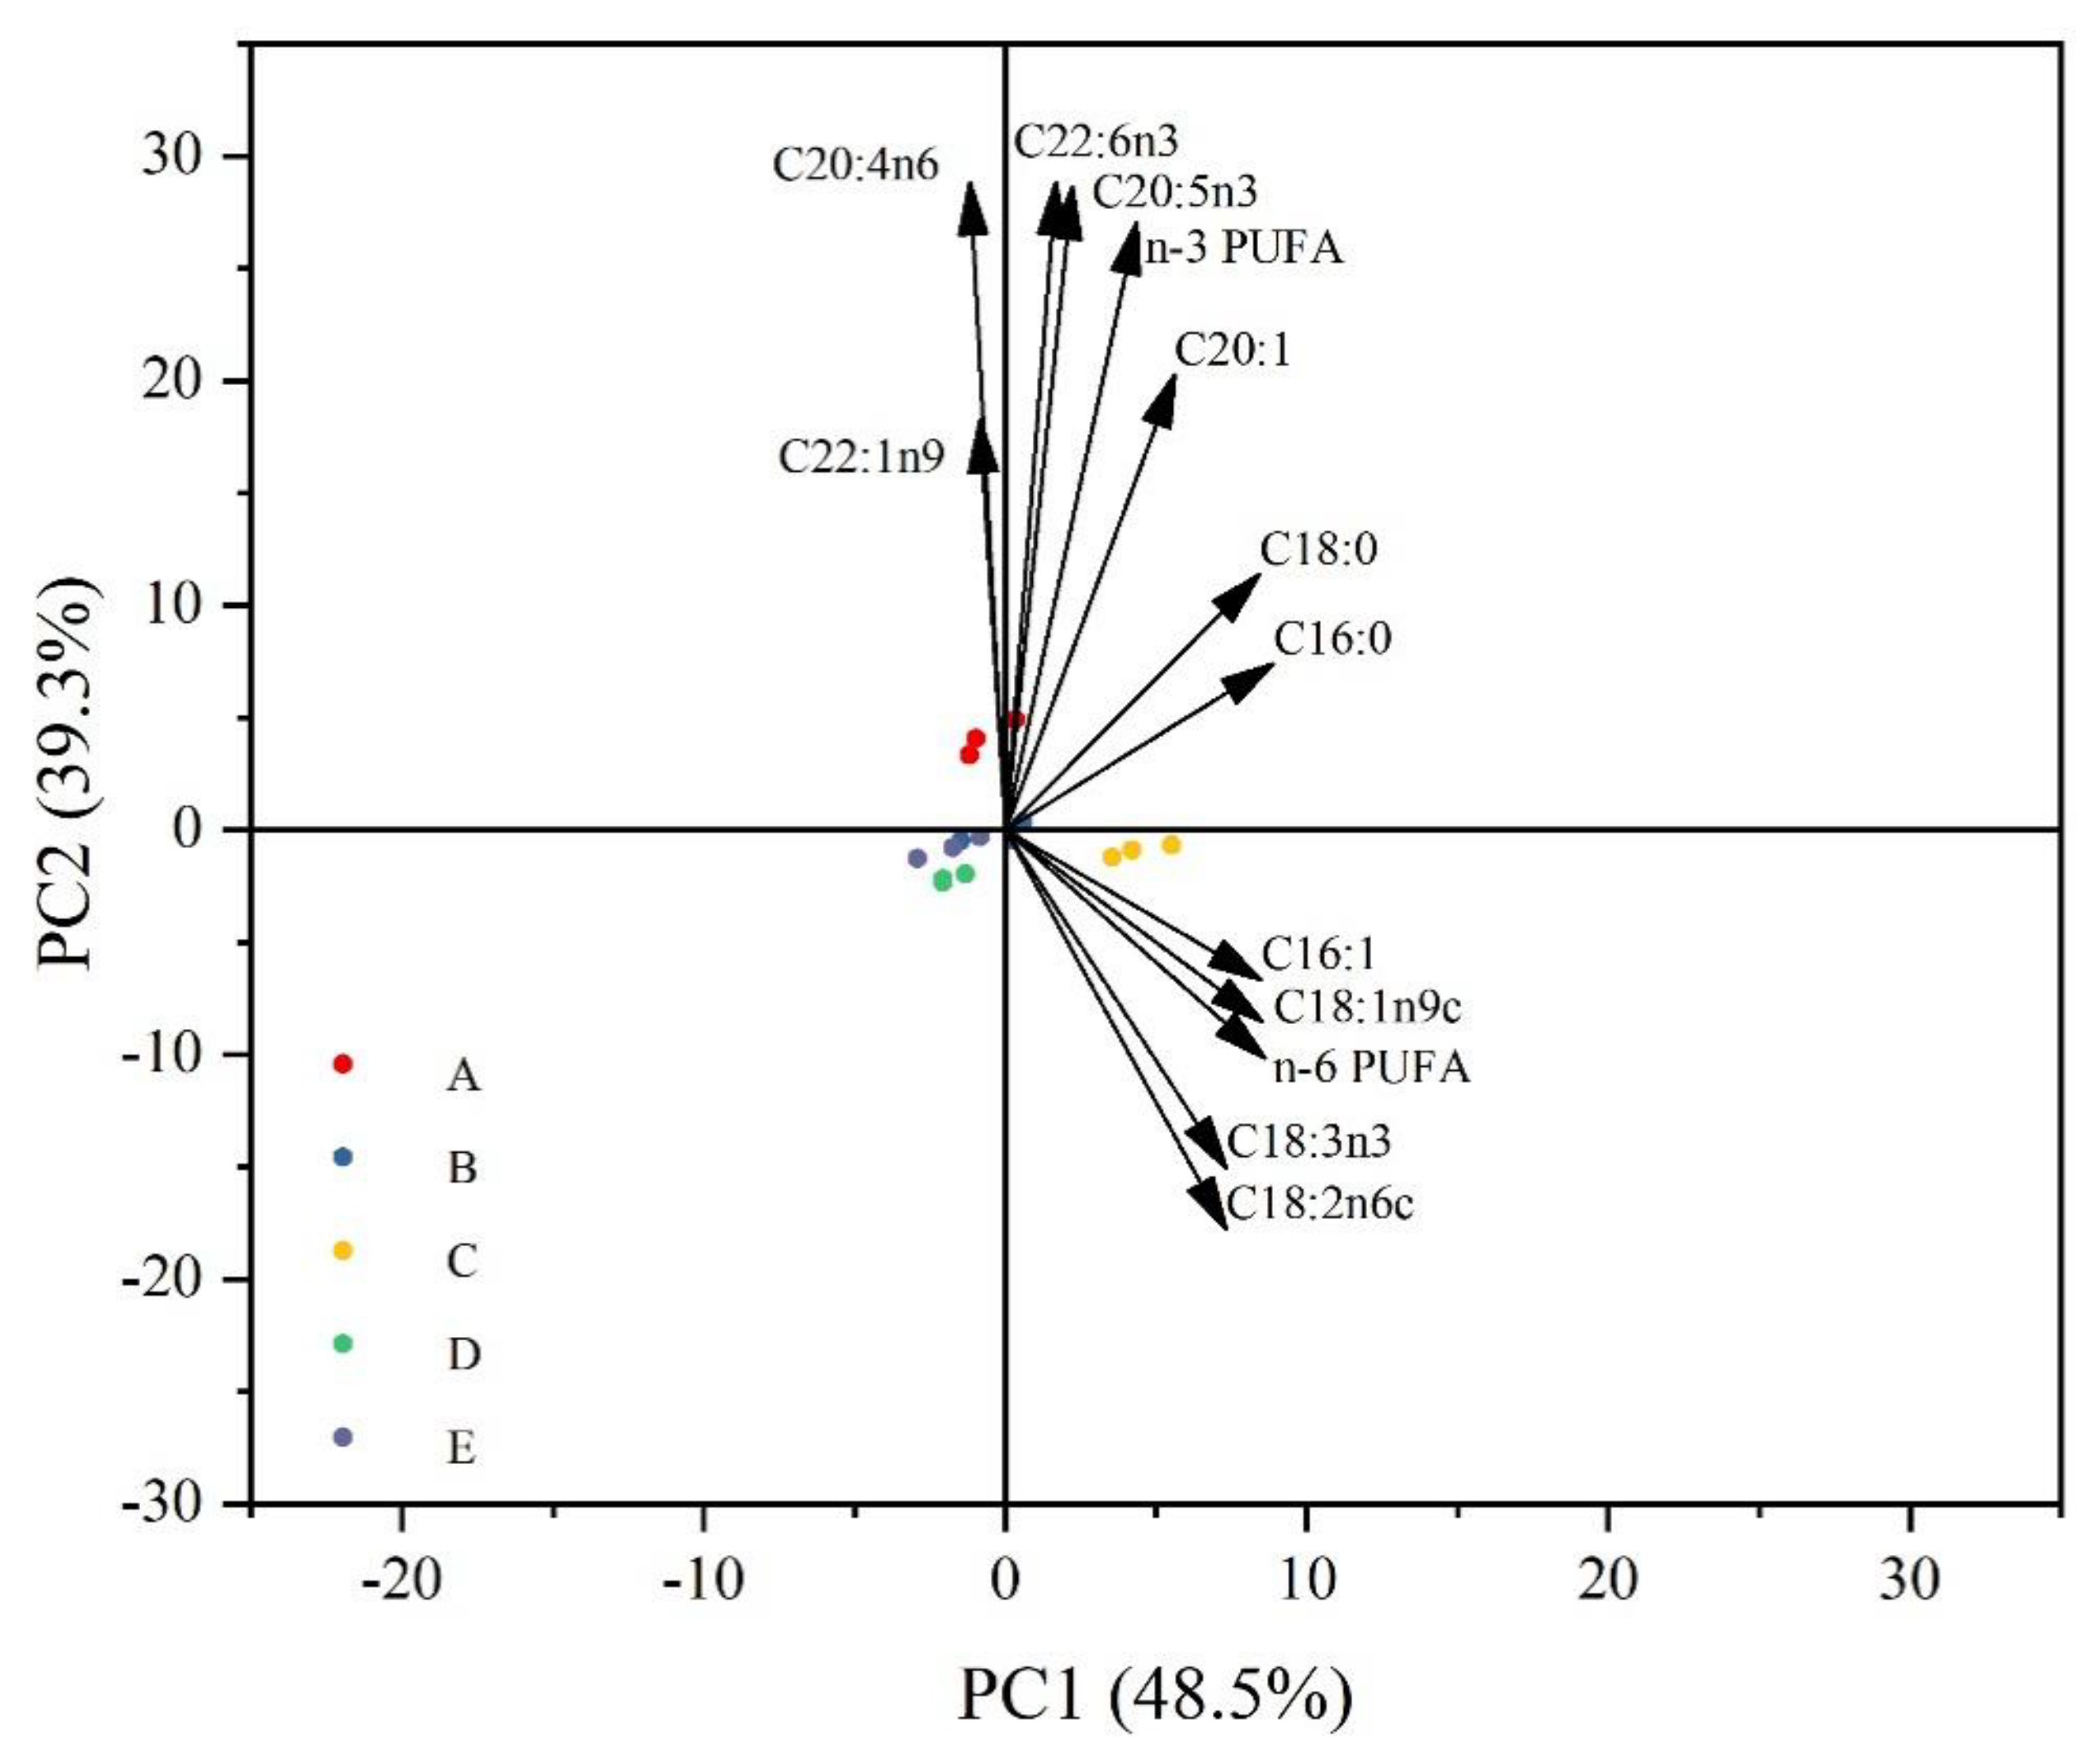
3.4. Fatty Acids Composition and Principal Component Analysis
4. Discussion
5. Conclusions
Author Contributions
Funding
Institutional Review Board Statement
Informed Consent Statement
Data Availability Statement
Conflicts of Interest
References
- Wang, J.T.; Han, T.; Li, X.Y.; Yang, Y.X.; Yang, M.; Hu, S.X.; Jiang, Y.D.; Harpaz, S. Effects of dietary protein and lipid levels with different protein-to-energy ratios on growth performance, feed utilization and body composition of juvenile red-spotted grouper, Epinephelus akaara. Aquacult. Nutr. 2017, 23, 994–1002. [Google Scholar] [CrossRef]
- Adissin, T.O.O.; Manabu, I.; Shunsuke, K.; Saichiro, Y.; Moss, A.S.; Dossou, S. Effects of dietary Nannochloropsis sp. powder and lipids on the growth performance and fatty acid composition of larval and postlarval kuruma shrimp, Marsupenaeus japonicus. Aquacult. Nutr. 2020, 26, 186–200. [Google Scholar] [CrossRef]
- Kamarudin, M.S.; De Cruz, C.R.; Saad, C.R.; Romano, N.; Ramezani-Fard, E. Effects of extruder die head temperature and pre-gelatinized taro and broken rice flour level on physical properties of floating fish pellets. Anim. Feed. Sci. Tech. 2018, 236, 122–130. [Google Scholar] [CrossRef]
- Hasan, M.R.; Macintosh, D.J. Optimum food particle size in relation to body size of common carp, Cyprinus carpio L., fry. Aquac. Res. 1992, 23, 315–325. [Google Scholar] [CrossRef]
- Chen, J.M.; Ye, J.Y.; Wu, W.; Pan, X. A preliminary study on the proper feed size for Curcian Carp Fry and fingerling. J. Zhejiang Ocean. Univ. (Nat. Sci.) 2001, 20, 103–105. (In Chinese) [Google Scholar]
- Hossain, M.A.R.; Haylor, G.S.; Beveridge, M.C.M. The influence of food particle size on gastric emptying and growth rates of fingerling African catfish, Clarias gariepinus Burchell, 1822. Aquacult. Nutr. 2000, 6, 73–76. [Google Scholar] [CrossRef]
- Zakęś, Z.; Hopko, M.; Kowalska, A.; Partyka, K.; Stawecki, K. Impact of feeding pikeperch Sander lucioperca (L.) feeds of different particle size on the results of the initial on-growing phase in recirculation systems. Arch. Pol. Fish. 2013, 21, 3–9. [Google Scholar] [CrossRef]
- Azaza, M.S.; Dhraief, M.N.; Kraiem, M.M.; Baras, E. Influences of food particle size on growth, size heterogeneity, food intake and gastric evacuation in juvenile Nile tilapia, Oreochromis niloticus, L., 1758. Aquaculture 2010, 309, 193–202. [Google Scholar] [CrossRef]
- Gao, S.Y.; Jin, J.Y.; Liu, H.K.; Han, D.; Zhu, X.M.; Yang, Y.X.; Xie, S.Q. Effects of pelleted and extruded feed of different ingredients particle sizes on feed quality and growth performance of gibel carp (Carassius gibelio var. CAS V). Aquaculture 2019, 511, 734236. [Google Scholar] [CrossRef]
- Aguado-Giménez, F. Effect of feed delivery rate and pellet size on rearing performance, feed wastage and economic profitability in gilthead seabream (Sparus Aurata) ongrowing. Water 2020, 12, 954–976. [Google Scholar] [CrossRef]
- Yu, X.J.; Hao, X.J.; Yang, L.K.; Dang, Z.Q.; Wang, X.G.; Zhang, Y.H.; Zhang, X. China crayfish industry development report. China Fish. 2023, 7, 26–31. [Google Scholar]
- Gao, M.X.; Wu, M.L.; He, J.Y.; Liang, H.W.; Dong, L.X.; Wen, H.; Jiang, M.; Huang, F.; Tian, J. Comparative study on the utilization of four forms exogenous methionine by red swamp crayfish (Procambarus clarkii). Aquac. Rep. 2024, 35, 101991. [Google Scholar]
- Jin, H.H.; Li, Y.; Xiao, C.B.; Sun, W.B.; Liu, F.; Ke, Z.L.; Zhao, S.F.; Qin, F.; Lei, K.; Wu, J.Q.; et al. Transcriptome analysis reveals the effects of dietary protein level on growth performance and metabolism in adult Procambarus clarkii farming in rice field. Aquac. Rep. 2024, 35, 101949. [Google Scholar] [CrossRef]
- Tian, H.Y.; Yang, C.C.; Yu, Y.B.; Yang, W.P.; Lu, N.; Wang, H.J.; Liu, F.; Wang, A.M.; Xu, X.G. Dietary cholesterol level affects growth, molting performance and ecdysteroid signal transduction in Procambarus clarkii. Aquaculture 2020, 523, 735198. [Google Scholar] [CrossRef]
- You, C.H.; Lu, F.B.; Wang, S.Q.; Chen, C.Y.; Li, Y.Y. Comparison of the growth performance and long-chain PUFA biosynthetic ability of the genetically improved farmed tilapia (Oreochromis niloticus) reared in different salinities. Br. J. Nutr. 2019, 121, 374–383. [Google Scholar] [CrossRef]
- Ma, Y.; Li, M.; Xie, D.; Chen, S.J.; Dong, Y.W.; Wang, M.; Zhang, G.R.; Zhang, M.; Chen, H.Y.; Ye, R.K.; et al. Fishmeal can be replaced with a high proportion of terrestrial protein in the diet of the carnivorous marine teleost (Trachinotus ovatus). Aquaculture 2020, 519, 734910. [Google Scholar] [CrossRef]
- Chen, F.; Huang, X.; Zhu, H.; Li, Y.Y.; Xu, C.; Xie, D.Z. Molecular characterization and expression analysis of acyl-CoA synthetase 6 in golden pompano Trachinotus ovatus reveal its function in DHA enrichment. Aquaculture 2022, 551, 737966. [Google Scholar] [CrossRef]
- Mattila, J.; Koskela, J. Effect of feed pellet size on production parameters of pike-perch (Sander lucioperca). Aquac. Res. 2018, 49, 586–590. [Google Scholar] [CrossRef]
- Cho, J.H.; Park, J.W.; Lee, B.J.; Kim, K.W.; Hur, S.W. Low extrusion pressure and small feed particle size improve the growth performance and digestive physiology of rockfish (Sebastes schlegeli). Aquaculture 2023, 566, 739199. [Google Scholar] [CrossRef]
- Busti, S.; Bonaldo, A.; Diana, A.; Perfetti, S.; Viroli, C.; Fontanillas, R.; Eriksen, T.B.; Gatta, P.P.; Parma, L. The incidence of different pellet size on growth, gut evacuation, feed digestibility and feed waste in gilthead sea bream (Sparus aurata). Aquaculture 2022, 555, 738204. [Google Scholar] [CrossRef]
- Wang, Y.; Li, M.; Filer, K.; Xue, Y.; Ai, Q.H.; Mai, K.S. Replacement of fish oil with a DHA-rich Schizochytrium meal on growth performance, activities of digestive enzyme and fatty acid profile of Pacific white shrimp (Litopenaeus vannamei) larvae. Aquacult. Nutr. 2017, 23, 1113–1120. [Google Scholar] [CrossRef]
- Deng, J.M.; Mai, K.S.; Ai, Q.H.; Zhang, W.B.; Wang, X.J.; Xu, W.; Liufu, Z.G. Effects of replacing fish meal with soy protein concentrate on feed intake and growth of juvenile Japanese flounder, Paralichthys olivaceus. Aquaculture 2006, 258, 503–513. [Google Scholar] [CrossRef]
- Sun, W.T.; Xu, X.Y.; Li, X.Q.; Pan, W.Q.; Leng, X.J. Effects of dietary geniposidic acid on growth performance, flesh quality and collagen gene expression of grass carp, Ctenopharyngodon Idella. Aquacult. Nutr. 2017, 24, 1112. [Google Scholar] [CrossRef]
- Sveier, H.; Wathne, E.; Lied, E. Growth, feed and nutrient utilisation and gastrointestinal evacuation time in Atlantic salmon (Salmo salar L.): The effect of dietary fish meal particle size and protein concentration. Aquaculture 1999, 180, 265–282. [Google Scholar] [CrossRef]
- Hu, Y.; Chen, Y.F.; Zhang, D.H.; Chen, T.; Liu, B.; Gao, Q.P. Effects of different dietary carbohydrate and protein levels on growth, intestinal digestive enzymes and serum indexes in largesize grass carp (Ctenopharyngodon idella). J. Fish. China 2018, 42, 777–786. [Google Scholar] [CrossRef]
- Bermúdez, R.; Franco, D.; Carballo, J.; Sentandreu, M.Á.; Lorenzo, J.M. Influence of muscle type on the evolution of free amino acids and sarcoplasmic and myofibrillar proteins through the manufacturing process of Celta dry-cured ham. Food Res. Int. 2014, 56, 226–235. [Google Scholar] [CrossRef]
- Rabie, M.A.; Peres, C.; Malcata, F.X. Evolution of amino acids and biogenic amines throughout storage in sausages made of horse, beef and turkey meats. Meat Sci. 2014, 96, 82–87. [Google Scholar] [CrossRef]
- Zhao, F.; Zhuang, P.; Song, C.; Shi, Z.H.; Zhang, L.Z. Amino acid and fatty acid compositions and nutritional quality of muscle in the pomfret, Pampus punctatissimus. Food Chem. 2010, 118, 224–227. [Google Scholar] [CrossRef]
- Ronnestad, I.; Thorsen, A.; Fina, R.N. Fish larval nutrition: A review of recent advances in the roles of amino acids. Aquaculture 1999, 177, 201–216. [Google Scholar] [CrossRef]
- David, F. A worldwide reliable indicator to differentiate wild vs. farmed Penaeid shrimps based on 207 fatty acid profiles. Food Chem. 2019, 292, 247–252. [Google Scholar] [CrossRef]
- Jiang, W.D.; Wu, P.; Tang, R.J.; Liu, Y.; Kuang, S.Y.; Jiang, J.; Tang, L.; Tang, W.N.; Zhang, Y.A.; Zhou, X.Q.; et al. Nutritive values, flavor amino acids, healthcare fatty acids and flesh quality improved by manganese referring to up-regulating the antioxidant capacity and signaling molecules TOR and Nrf2 in the muscle of fish. Food Res. Int. 2016, 89, 670–678. [Google Scholar] [CrossRef] [PubMed]
- Zhu, T.; Yang, R.; Xiao, R.; Ni, W.Q.; Liu, L.W.; Zhao, J.; Ye, Z.Y. Effect of swimming training on the flesh quality in Chinese Perch (Siniperca chuatsi) and its relationship with muscle metabolism. Aquaculture 2023, 577, 739926. [Google Scholar] [CrossRef]
- Calder, P.C. Very long chain omega-3 (n-3) fatty acids and human health. Eur. J. Lipid Sci. Tech. 2014, 116, 1280–1300. [Google Scholar] [CrossRef]
- Hollander, A.; DeJonge, R.; Biesbroek, S.; Hoekstra, J.; Zijp, M.C. Exploring solutions for healthy, safe, and sustainable fatty acids (EPA and DHA) consumption in The Netherlands. Sustain. Sci. 2018, 14, 303–313. [Google Scholar] [CrossRef]
- Muskiet, F.A.; Goor, S.A.V.; Kuipers, R.S.; Velzing-Aarts, F.V.; Smit, E.N.; Bouwstra, H.; Dijck-Brouwer, D.A.; Boersma, E.R.; Hadders-Algra, M. Long-chain polyunsaturated fatty acids in maternal and infant nutrition. Prostaglandins Leukot. Essent. Fat. Acids 2006, 75, 135–144. [Google Scholar] [CrossRef] [PubMed]
- Harrison, K.E. The role of nutrition in maturation, reproduction and embryonic development of decapod crustaceans: A review. J. Shellfish Res. 1990, 9, 1–28. [Google Scholar]
- Fuentes, A.; Fernández-Segovia, I.; Serra, J.A.; Barat, J.M. Comparison of wild and cultured sea bass (Dicentrarchus labrax) quality. Food Chem. 2010, 119, 1514–1518. [Google Scholar] [CrossRef]
- Gisbert, E.; Piedrahita, R.H.; Conklin, D.E. Ontogenetic development of the digestive system in California halibut (Paralichthys californicus) with notes on feeding practices. Aquaculture 2004, 232, 455–470. [Google Scholar] [CrossRef]

| Item | A | B | C | D | E | p Value |
|---|---|---|---|---|---|---|
| Wt (g) | 1.148 ± 0.255 a | 1.795 ± 0.065 b | 2.353 ± 0.136 b | 2.316 ± 0.222 b | 2.330 ± 0.104 b | 0.001 |
| WG (%) | 1355.471 ± 324.521 a | 2180.852 ± 83.579 ab | 2888.868 ± 173.579 b | 2843.702 ± 282.736 b | 2860.242 ± 132.481 b | 0.001 |
| SGR (%/d) | 2.615 ± 0.196 a | 3.125 ± 0.037 b | 3.393 ± 0.056 b | 3.369 ± 0.0913 b | 3.385 ± 0.045 b | 0.000 |
| FCR | 2.245 ± 0.304 b | 1.274 ± 0.196 a | 1.034 ± 0.132 a | 0.915 ± 0.036 a | 0.809 ± 0.038 a | 0.000 |
| CF (g·cm−3) | 2.382 ± 0.104 | 2.377 ± 0.060 | 2.370 ± 0.048 | 2.526 ± 0.0611 | 2.490 ± 0.062 | 0.358 |
| MC (%) | 15.249 ± 0.708 | 15.978 ± 0.651 | 16.200 ± 0.529 | 16.951 ± 0.655 | 15.738 ± 0.452 | 0.285 |
| FI | 1.983 ± 0.308 b | 1.176 ± 0.042 a | 0.911 ± 0.047 a | 0.938 ± 0.078 a | 0.917 ± 0.041 a | 0.000 |
| SR (%) | 55.00 ± 4.916 | 56.25 ± 8.045 | 51.50 ± 6.886 | 57.00 ± 5.745 | 62.00 ± 0.577 | 0.788 |
| Item (%) | A | B | C | D | E | p Value |
|---|---|---|---|---|---|---|
| Moisture | 66.79 ± 1.18 | 65.01 ± 0.78 | 66.02 ± 1.86 | 63.21 ± 3.62 | 67.27 ± 2.82 | 0.741 |
| Crude protein | 24.20 ± 2.06 a | 30.77 ± 1.28 b | 29.53 ± 0.42 b | 32.89 ± 1.42 b | 22.58 ± 0.88 a | 0.001 |
| Crude lipid | 8.64 ± 0.24 c | 7.00 ± 0.41 b | 5.29 ± 0.44 a | 4.37 ± 0.11 a | 5.38 ± 0.27 a | 0.000 |
| Crude ash | 7.71 ± 1.34 | 6.04 ± 0.20 | 6.61 ± 0.45 | 7.64 ± 0.43 | 8.42 ± 0.48 | 0.202 |
| Item (mg/g) | A | B | C | D | E | p Value |
|---|---|---|---|---|---|---|
| Arg | 17.74 ± 0.27 | 17.70 ± 0.22 | 19.37 ± 0.60 | 19.69 ± 1.04 | 21.27 ± 2.00 | 0.170 |
| His | 3.12 ± 0.32 | 3.47 ± 0.07 | 3.57 ± 0.11 | 3.44 ± 0.04 | 3.81 ± 0.31 | 0.291 |
| Ile | 7.01 ± 0.69 a | 8.19 ± 0.48 ab | 9.94 ± 0.32 b | 8.89 ± 0.62 ab | 10.40 ± 1.38 b | 0.038 |
| Leu | 11.43 ± 0.51 a | 12.10 ± 0.09 a | 13.40 ± 0.30 ab | 12.97 ± 0.32 a | 15.11 ± 1.88 b | 0.032 |
| Met | 2.48 ± 0.11 a | 3.02 ± 0.22 ab | 3.03 ± 0.04 ab | 3.54 ± 0.23 bc | 3.64 ± 0.22 c | 0.007 |
| Val | 5.92 ± 0.37 a | 6.82 ± 0.11 ab | 7.67 ± 0.27 bc | 7.24 ± 0.04 bc | 8.31 ± 0.64 c | 0.014 |
| Phe | 6.92 ± 0.67 a | 8.24 ± 0.27 ab | 10.25 ± 0.22 b | 9.11 ± 0.39 ab | 9.85 ± 1.25 b | 0.038 |
| Lys | 11.14 ± 0.31 a | 10.91 ± 0.17 a | 12.16 ± 0.62 ab | 12.33 ± 0.52 ab | 14.47 ± 1.61 b | 0.034 |
| Thr | 5.43 ± 0.23 a | 5.23 ± 0.08 a | 5.95 ± 0.20 ab | 5.71 ± 0.11 a | 6.56 ± 0.61 b | 0.042 |
| Ala | 8.67 ± 0.10 | 8.88 ± 0.13 | 9.42 ± 0.18 | 9.42 ± 0.44 | 10.34 ± 1.00 | 0.233 |
| Gly | 9.55 ± 0.34 | 8.75 ± 0.25 | 9.78 ± 0.10 | 9.90 ± 0.28 | 11.26 ± 1.45 | 0.276 |
| Asp | 15.00 ± 0.56 a | 15.54 ± 0.17 a | 17.15 ± 0.46 ab | 16.73 ± 0.54 ab | 18.36 ± 0.98 b | 0.018 |
| Glu | 19.80 ± 18.90 | 20.62 ± 0.39 | 22.11 ± 1.08 | 21.78 ± 0.25 | 23.58 ± 2.05 | 0.390 |
| Tyr | 4.81 ± 0.05 a | 4.89 ± 0.13 a | 5.27 ± 0.17 ab | 5.16 ± 0.14 ab | 6.12 ± 0.72 b | 0.044 |
| Ser | 5.40 ± 0.13 | 5.26 ± 0.05 | 5.69 ± 0.12 | 5.72 ± 0.11 | 6.12 ± 0.54 | 0.239 |
| Pro | 10.46 ± 0.80 ab | 8.27 ± 0.18 a | 11.68 ± 0.49 b | 10.52 ± 0.56 ab | 9.24 ± 1.08 ab | 0.047 |
| Cys | 0.39 ± 0.02 b | 0.36 ± 0.05 b | 0.19 ± 0.02 a | 0.25 ± 0.04 a | 0.38 ± 0.03 b | 0.029 |
| 1 EAA | 75.13 ± 3.10 | 75.65 ± 1.12 | 85.33 ± 1.55 | 88.88 ± 8.41 | 91.10 ± 8.26 | 0.202 |
| 2 NEAA | 71.91 ± 4.01 | 72.54 ± 0.17 | 81.26 ± 2.19 | 79.55 ± 1.07 | 85.06 ± 8.53 | 0.224 |
| 3 UAA | 62.59 ± 4.83 a | 66.91 ± 0.66 ab | 73.98 ± 1.60 ab | 72.10 ± 1.83 ab | 79.19 ± 4.09 b | 0.026 |
| Item (g/100 g) | A | B | C | D | E | p Value |
|---|---|---|---|---|---|---|
| C16:0 | 0.031 ± 0.0006 b | 0.030 ± 0.0006 b | 0.034 ± 0.0006 c | 0.028 ± 0.0002 a | 0.029 ± 0.0007 ab | 0.001 |
| C16:1 | ND | ND | 0.004 ± 0.0001 | ND | ND | ND |
| C18:0 | 0.014 ± 0.0003 b | 0.013 ± 0.0003 a | 0.016 ± 0.0003 c | 0.013 ± 0.0001 a | 0.013 ± 0.0003 a | 0.000 |
| C18:1n9 | 0.042 ± 0.0008 a | 0.042 ± 0.0010 a | 0.053 ± 0.0011 b | 0.044 ± 0.0004 a | 0.042 ± 0.0009 a | 0.000 |
| C18:2n6 (LA) | 0.031 ± 0.0005 a | 0.039 ± 0.0010 c | 0.046 ± 0.0008 d | 0.037 ± 0.0003 b | 0.036 ± 0.0009 b | 0.000 |
| C18:3n3 (LNA) | 0.005 ± 0.0001 a | 0.006 ± 0.0001 b | 0.007 ± 0.0002 c | 0.006 ± 0.0001 b | 0.005 ± 0.0001 a | 0.000 |
| C20:1 | 0.005 ± 0.0001 c | 0.005 ± 0.0001 bc | 0.005 ± 0.0001 c | 0.004 ± 0.0001 a | 0.004 ± 0.0001 b | 0.001 |
| C22:1n9 | 0.003 ± 0.0001 | 0.004 ± 0.0001 | ND | ND | ND | ND |
| C20:4n6 (AA) | 0.004 ± 0.0001 | ND | ND | ND | ND | ND |
| C20:5n3 (EPA) | 0.020 ± 0.0004 e | 0.015 ± 0.0003 b | 0.016 ± 0.0002 d | 0.013 ± 0.0001 a | 0.015 ± 0.0004 c | 0.000 |
| C22:6n3 (DHA) | 0.011 ± 0.0002 d | 0.010 ± 0.0002 c | 0.009 ± 0.0001 b | 0.009 ± 0.0001 a | 0.009 ± 0.0002 ab | 0.000 |
| SFA | 0.045 ± 0.0009 b | 0.044 ± 0.0009 ab | 0.049 ± 0.0009 c | 0.041 ± 0.0003 a | 0.042 ± 0.0010 a | 0.000 |
| MUFA | 0.049 ± 0.0018 a | 0.049 ± 0.0013 a | 0.062 ± 0.0023 b | 0.050 ± 0.0028 a | 0.047 ± 0.0001 a | 0.001 |
| PUFA | 0.071 ± 0.0011 b | 0.070 ± 0.0016 b | 0.078 ± 0.0013 c | 0.065 ± 0.0008 a | 0.065 ± 0.0015 a | 0.000 |
| n-3 PUFA | 0.036 ± 0.0011 d | 0.030 ± 0.0006 b | 0.033 ± 0.0005 c | 0.029 ± 0.0006 ab | 0.028 ± 0.0002 a | 0.000 |
| n-6 PUFA | 0.035 ± 0.0005 a | 0.039 ± 0.0010 b | 0.046 ± 0.0008 c | 0.037 ± 0.0003 a | 0.036 ± 0.0009 a | 0.000 |
Disclaimer/Publisher’s Note: The statements, opinions and data contained in all publications are solely those of the individual author(s) and contributor(s) and not of MDPI and/or the editor(s). MDPI and/or the editor(s) disclaim responsibility for any injury to people or property resulting from any ideas, methods, instructions or products referred to in the content. |
© 2024 by the authors. Licensee MDPI, Basel, Switzerland. This article is an open access article distributed under the terms and conditions of the Creative Commons Attribution (CC BY) license (https://creativecommons.org/licenses/by/4.0/).
Share and Cite
Jiang, Q.; Xia, S.; Xu, Z.; Yang, Z.; Zhang, L.; Liu, G.; Xu, Y.; Chen, A.; Chen, X.; Liu, F.; et al. Influence of Different Feed Particle Sizes on the Growth Performance and Nutrition Composition in Crayfish, Procambarus clarkii Larvae. Animals 2024, 14, 2228. https://doi.org/10.3390/ani14152228
Jiang Q, Xia S, Xu Z, Yang Z, Zhang L, Liu G, Xu Y, Chen A, Chen X, Liu F, et al. Influence of Different Feed Particle Sizes on the Growth Performance and Nutrition Composition in Crayfish, Procambarus clarkii Larvae. Animals. 2024; 14(15):2228. https://doi.org/10.3390/ani14152228
Chicago/Turabian StyleJiang, Qingqing, Silei Xia, Zhiqiang Xu, Zhigang Yang, Lu Zhang, Guoxing Liu, Yu Xu, Aqin Chen, Xiaoru Chen, Fei Liu, and et al. 2024. "Influence of Different Feed Particle Sizes on the Growth Performance and Nutrition Composition in Crayfish, Procambarus clarkii Larvae" Animals 14, no. 15: 2228. https://doi.org/10.3390/ani14152228
APA StyleJiang, Q., Xia, S., Xu, Z., Yang, Z., Zhang, L., Liu, G., Xu, Y., Chen, A., Chen, X., Liu, F., Yang, W., Yu, Y., Tian, H., Wu, Y., Zhang, W., & Wang, A. (2024). Influence of Different Feed Particle Sizes on the Growth Performance and Nutrition Composition in Crayfish, Procambarus clarkii Larvae. Animals, 14(15), 2228. https://doi.org/10.3390/ani14152228