Article

Impact of Personality Trait Interactions on Foraging and Growth in Native and Invasive Turtles

1
Herpetological Research Center, College of Life Sciences, Nanjing Normal University, Nanjing 210023, China
2
Center of Reproductive Medicine, Jiaxing Maternity and Child Health Care Hospital, College of Medicine, Jiaxing University, Jiaxing 314000, China
3
College of Animal Science and Technology, Nanjing Agricultural University, Nanjing 210095, China
*
Authors to whom correspondence should be addressed.
Animals 2024, 14(15), 2240; https://doi.org/10.3390/ani14152240
Submission received: 18 June 2024 / Revised: 28 July 2024 / Accepted: 30 July 2024 / Published: 1 August 2024
(This article belongs to the Section Herpetology)

Abstract

:

Simple Summary

Animal personalities could affect the behavior and physiology of both native and invasive species during biological invasion. However, little is known about the personality interaction effects on foraging behavior and growth between native and invasive species. We used the red-eared slider turtle and Chinese pond turtle as models to investigate how personality interactions effect the foraging behavior and growth of both these turtle species. The results showed that the foraging behavior of M. reevesii was mainly affected by the personality of T. scripta elegans. However, the foraging behavior of T. scripta elegans was effected by both their own personality and the personalities of M. reevesii. Additionally, the growth of both M. reevesii and T. scripta elegans were not effected by the personality combinations. The results revealed the mechanisms of personality interaction effects on the foraging behavior and growth of both native and invasive species during biological invasion. This study provides empirical evidence to help understand the effects of personalities on invasion dynamics.

Abstract

Animal personalities play a crucial role in invasion dynamics. During the invasion process, the behavioral strategies of native species vary among personalities, just as the invasive species exhibit variations in behavior strategies across personalities. However, the impact of personality interactions between native species and invasive species on behavior and growth are rarely illustrated. The red-eared slider turtle (Trachemys scripta elegans) is one of the worst invasive species in the world, threatening the ecology and fitness of many freshwater turtles globally. The Chinese pond turtle (Mauremys reevesii) is one of the freshwater turtles most threatened by T. scripta elegans in China. In this study, we used T. scripta elegans and M. reevesii to investigate how the personality combinations of native and invasive turtles would impact the foraging strategy and growth of both species during the invasion process. We found that M. reevesii exhibited bolder and more exploratory personalities than T. scripta elegans. The foraging strategy of M. reevesii was mainly affected by the personality of T. scripta elegans, while the foraging strategy of T. scripta elegans was influenced by both their own personality and personalities of M. reevesii. Additionally, we did not find that the personality combination would affect the growth of either T. scripta elegans or M. reevesii. Differences in foraging strategy may be due to the dominance of invasive species and variations in the superficial exploration and thorough exploitation foraging strategies related to personalities. The lack of difference in growth may be due to the energy allocation trade-offs between personalities or be masked by the slow growth rate of turtles. Overall, our results reveal the mechanisms of personality interaction effects on the short-term foraging strategies of both native and invasive species during the invasion process. They provide empirical evidence to understand the effects of personality on invasion dynamics, which is beneficial for enhancing comprehension understanding of the personality effects on ecological interactions and invasion biology.

1. Introduction

The invasion of non-native species is considered a key threat to the integrity of natural habitats and ecosystems worldwide, leading to biodiversity losses [1,2]. Invasive species are known to generate severe economic and environmental harm within native ecosystems [3]. Determining the mechanisms of invasion dynamics and the ecological consequences of non-native species invasion is a crucial question for themes such as invasion ecology, population ecology, and global change ecology [4]. Reptiles, especially freshwater turtles, have become one of the most threatened taxa during biological invasions due to their dependence on freshwater habitats and limited movement abilities [5,6]. Growing evidence shows that invaders are often not a random draw from a population [7,8,9]. Instead, invasive decisions are associated with various ecologically important phenotypic traits, such as personality. For example, bolder and more explorative individuals tend to have a higher rate of success in invading a new habitat [8]. Meanwhile, research has revealed that native species also exhibit individual variations in behavior during biological invasions, which is also related to the various ecologically important phenotypic traits such as personality [10,11].
Animal personality, which refers to an individual’s variety of consistent behavioral differences across time and contexts in a broad range of taxa [12], plays a crucial role in the invasion dynamics of non-native species [13,14,15]. For invasive species, some individuals (e.g., bolder, asocial, more explorative, and active individuals) will colonize empty landscape patches sooner, increasing the probability of an invasive population spreading further, and are more likely to successfully invade new habitats [16,17,18,19]. This variation may be related to their physiological differences, such as body size, energy reserves, and growth rate [20,21]. Moreover, invasive individuals with different personalities respond differently to native species. Some personality types (e.g., bolder, more explorative, and more aggressive) consistently show a greater tendency to compete with native species than others [10,22], which indicates that the reaction of invasive species to native species is also related to personality types. For native species, invasive species have been reported as drivers for behavioral and physiological changes, such as foraging, defending, and growth [23,24,25,26,27,28]. These effects of behavior in native species have been shown to be associated with the personality of invasive species [10,29]. Furthermore, native species with different personalities exhibit differences in behavioral strategies and physiological states in a post-invasion context [10,30]. Even though a growing body evidence has revealed that personality effects the behavior and physiological changes in both native species and invasive species, there is still little known about the impact of personality interaction on behavior and physiological changes between invasive species and native species during a biological invasion. The behavioral and physiological changes when different personalities of invasive species coexist with different personalities of native species remain unclear.
The red-eared slider turtle (Trachemys scripta elegans) is native to the southern United States and northern Mexico. It is now becoming invasive in many countries, including China, posing a serious threat to the survival of local native turtle species [31,32]. The T. scripta elegans is listed as one of the 100 worst invasive species in the world [33]. The introduction of T. scripta elegans would lead to them competing with native freshwater turtle species and lead to the extinction of these native turtles in their native habitats, including species of Mauremys [11,32,33]. The native habitat of T. scripta elegans is similar to the habitat occupied by the Chinese pond turtle (Mauremys reevesii) [34]. Therefore, the M. reevesii has become one of the most widely threatened species by T. scripta elegans in China. The M. reevesii was once the most abundant freshwater turtle in China [35]; however, its wild populations have significantly declined in recent decades and it is currently considered an endangered species [36]. The competition with exotic introduced turtles, mainly the red-eared slider turtle, is one of the major factors responsible for this decline [37,38]. T. scripta elegans can outcompete native M. reevesii for swimming speed and an advantage in feeding kinematics, such as shorter gape cycle time and neck retraction time [39,40]. These advantages may give the T. scripta elegans a competitive edge for food resources, nesting sites, and basking sites [11,32,41]. However, the interaction effects of personality traits in foraging behavior and fitness consequences (e.g., growth) in invasive T. scripta elegans and native M. reevesii have not been fully studied.
In the current study, we experimentally tested whether there were differences in behavior change and growth of two species when M. reevesii with different personalities cohabitated with different personalities of T. scripta elegans. Our aim was to investigate the interaction and influence of personality traits between invasive species and native species on behavior and fitness consequences in a post-invasion context. We also aimed to elucidate the relationships among personality, ecological and fitness consequences, and the underlying mechanisms of invasion biology.

2. Materials and Methods

2.1. Animals

The studied juveniles of M. reevesii and T. scripta elegans were approximately 14 months old and were purchased from a natural pond-rearing turtle hatchery in Baoying County, Jiangsu Province, China. The turtles were transported to the laboratory and reared in tanks (640 × 430 × 310 mm3) filled with tap water (aerated for at least 48 h) with a density of 18 individuals per tank. All turtles were fed a commercial diet (Yahua Ltd., Jining, Shandong, China) once a day at 9:00 a.m. Uneaten food and feces were removed after 1 h, and approximately half of the water was refreshed in the tank each day. All turtles were housed in a room and in a water temperature of 28 ± 1 °C, and they experienced natural photoperiods and an acclimation period of at least three months [42].

2.2. Experimental Procedures

After an acclimation period, we used an open-field test and a simulated predator attack test to measure the boldness and exploration personalities of M. reevesii (n = 49) and T. scripta elegans (n = 52). To ensure the objectivity of our data, we selected 16 of the relatively most bold exploration turtles and 16 of the relatively most shy avoidance turtles from each species as our focal experimental samples. The number (n= 8) of animals in each group was chosen to ensure a statistical significance of the experimental data. Each of the four turtles (randomly selected from the specific personality types) was raised in a tank (520 × 380 × 230 mm3) and was randomly marked with 4 colors of non-toxic paint on its shell for individual identification. All turtles lived with their conspecifics and were divided into 4 groups (4 tanks for each group), as follows: (1) the BE-BE group, where two focal turtles with boldness–exploration personalities lived with two other turtles with boldness–exploration personalities; (2) the BE-SA group, where two focal turtles with boldness–exploration personalities lived with two turtles with shy–avoidance personalities; (3) the SA-BE group, where two focal turtles with shy–avoidance personalities lived with two turtles with boldness–exploration personalities; and (4) the SA-SA group, where two focal turtles with shy–avoidance personalities lived with two other turtles with shy–avoidance personalities. After a 4-week acclimatization period [43], we measured the foraging behavior and morphological data of all turtles during the non-invasion stage, where the focal turtles lived with two conspecific turtles. Subsequently, we randomly selected two specific personality M. reevesii and two specific personality T. scripta elegans reared together in a tank (invasion stage) based on the personality combination groups that developed during the non-invasion stage following a 4-week acclimation period [43]. After this acclimation, we measured their foraging behavior and morphological data again to compare the variations in behavior and growth changes among the species and groups. The foraging behavior was measured in four tanks at a time, and the tanks were selected randomly from each group.

2.3. Personality Assay

Both boldness and exploration tests were measured once again two weeks later to determine the consistency and repeatability of boldness–exploration personality traits in turtles.

2.3.1. Boldness Measurement

We following methods described by Kashon and Carlson [44] and Roth et al. [45] to test the turtles’ personalities in terms of boldness. We placed each turtle in the center of a 600 × 600 mm2 plastic tank and used a soft rubber rod to gently tap the shell of the turtles to ensure that the head and body retracted into the shell. Researchers then retreated to the test room and monitored the turtles via an overhead camera for 5 min. We recorded the time elapsed from turtles retracting into the shell to (1) head emergence, defined as extending the head from the shell such that the eyes surpassed the anterior margin of the carapace; (2) limbs emergence, defined as extending the limbs from the shell; and (3) movement, when the turtle began walking.

2.3.2. Exploration Measurement

To test exploration personality, we used an open field test to measure turtles’ exploration personality. The open field (600 × 600 × 250 mm3) was divided into 4 equal-sized areas. At the beginning of the test, the turtle was placed in the center of the open field and covered by a clear plastic cage for 5 min. Then, we removed the cage and monitored the turtles’ behavior via an overhead camera for 10 min. We used the total number of area crossed and distance moved during the 10 min assay as proxies for exploratory behavior [46,47].

2.4. Foraging Behavior

All turtles were given half of their food pellets (approximately 0.5% of body weight) 48 h before the experiment [42] and fasted for 24 h before the experiment. Then, foraging behavior was measured starting at 9:00 a.m. All turtles were given approximately 3% of their body weight in food pellets. We used an overhead camera to monitor the turtles’ behavior for 60 min and then removed any remaining food pellets. The foraging behavior tests were conducted three times during both the non-invasion and invasion stages, with a one-week interval occurring between each test. We recorded the latency, frequency, and duration of foraging during the experiment.

2.5. Morphology Traits

Morphological traits included body mass, carapace height, carapace width, and carapace length. Body mass was measured by an electronic balance (Sartorius Model BL 1500, ±0.1 g). Maximum carapace height, carapace straight width, and carapace straight length were measured with a digital caliper (Pro skit, PR China) to the nearest millimeter.

2.6. Statistical Analysis

2.6.1. Boldness–Exploration Personality Assessment

We conducted a principal component analysis (PCA) using the “ade4” package in R 4.1.3 to derive composite boldness–exploration scores for each individual [48]. These scores were based on five performance parameters collected during the initial bold and exploration assay [49] and were utilized as individual boldness–exploration personality scores. Subsequently, the second personality assay data were used predict function into the previous PCA model to obtain the second boldness–exploration score. A Markov chain Monte Carlo (MCMC) generalized linear mixed model approach (“MCMCglmm” package in R) was used to assess the repeatability [50]. The repeatability of boldness–exploration personality was evaluated using linear mixed models with the experiment number as a fixed effect, with the turtle’s ID and tank ID acting as random effects. We calculated 95% credible intervals (95% CIs) to assess the repeatability by running 1000 permutations of each test and using the posterior distributions to calculate the repeatability as R = Vind/(Vind + Ve), where Vind = inter-individual variance and Ve = residual variance. The difference in five behavioral parameters between M. reevesii and T. scripta elegans was analyzed by a one-way ANOVA.

2.6.2. Foraging Behavior

The normality and homogeneity of variance of the foraging behavior data were examined using Shapiro–Wilk and Levene tests, respectively. Due to the non-normal distribution of foraging behavior data, and the presence of zero values, all data were normalized by taking the logarithm base 10 of (x + 1). We conducted a repeated-measures analysis by the GLM procedure to examine the differences in foraging latency, foraging frequency, and foraging duration of M. reevesii and T. scripta elegans under non-invasion and invasion conditions, followed by Tukey’s post hoc tests. The experimental stage was included as a within-subjects factor. The species of the turtle subjects and the groups were included as two between-subjects factors. Because Mauchly’s test of sphericity for the three behavioral parameters showed p < 0.001, the results were reported after a Greenhouse–Geisser correction. Behavioral changes between groups and species were analyzed using a two-way ANOVA followed by Bonferroni correction of post hoc tests. Statistical analyses were performed using the SPSS 20.0 software package.

2.6.3. Morphological Traits

The normality and homogeneity of variance of the morphological traits data were examined using Shapiro–Wilk and Levene tests, respectively. Body mass and carapace height/width ratio were analyzed across experimental stages, species, and groups using a repeated-measures analysis by the GLM procedure followed by Tukey’s post hoc tests. Carapace height, width, and length were analyzed between experimental stages, species, and groups using a repeated-measures analysis by the GLM procedure, with body mass as the covariate, followed by Bonferroni correction post hoc tests. Statistical analyses were performed using the SPSS 20.0 software package.

3. Results

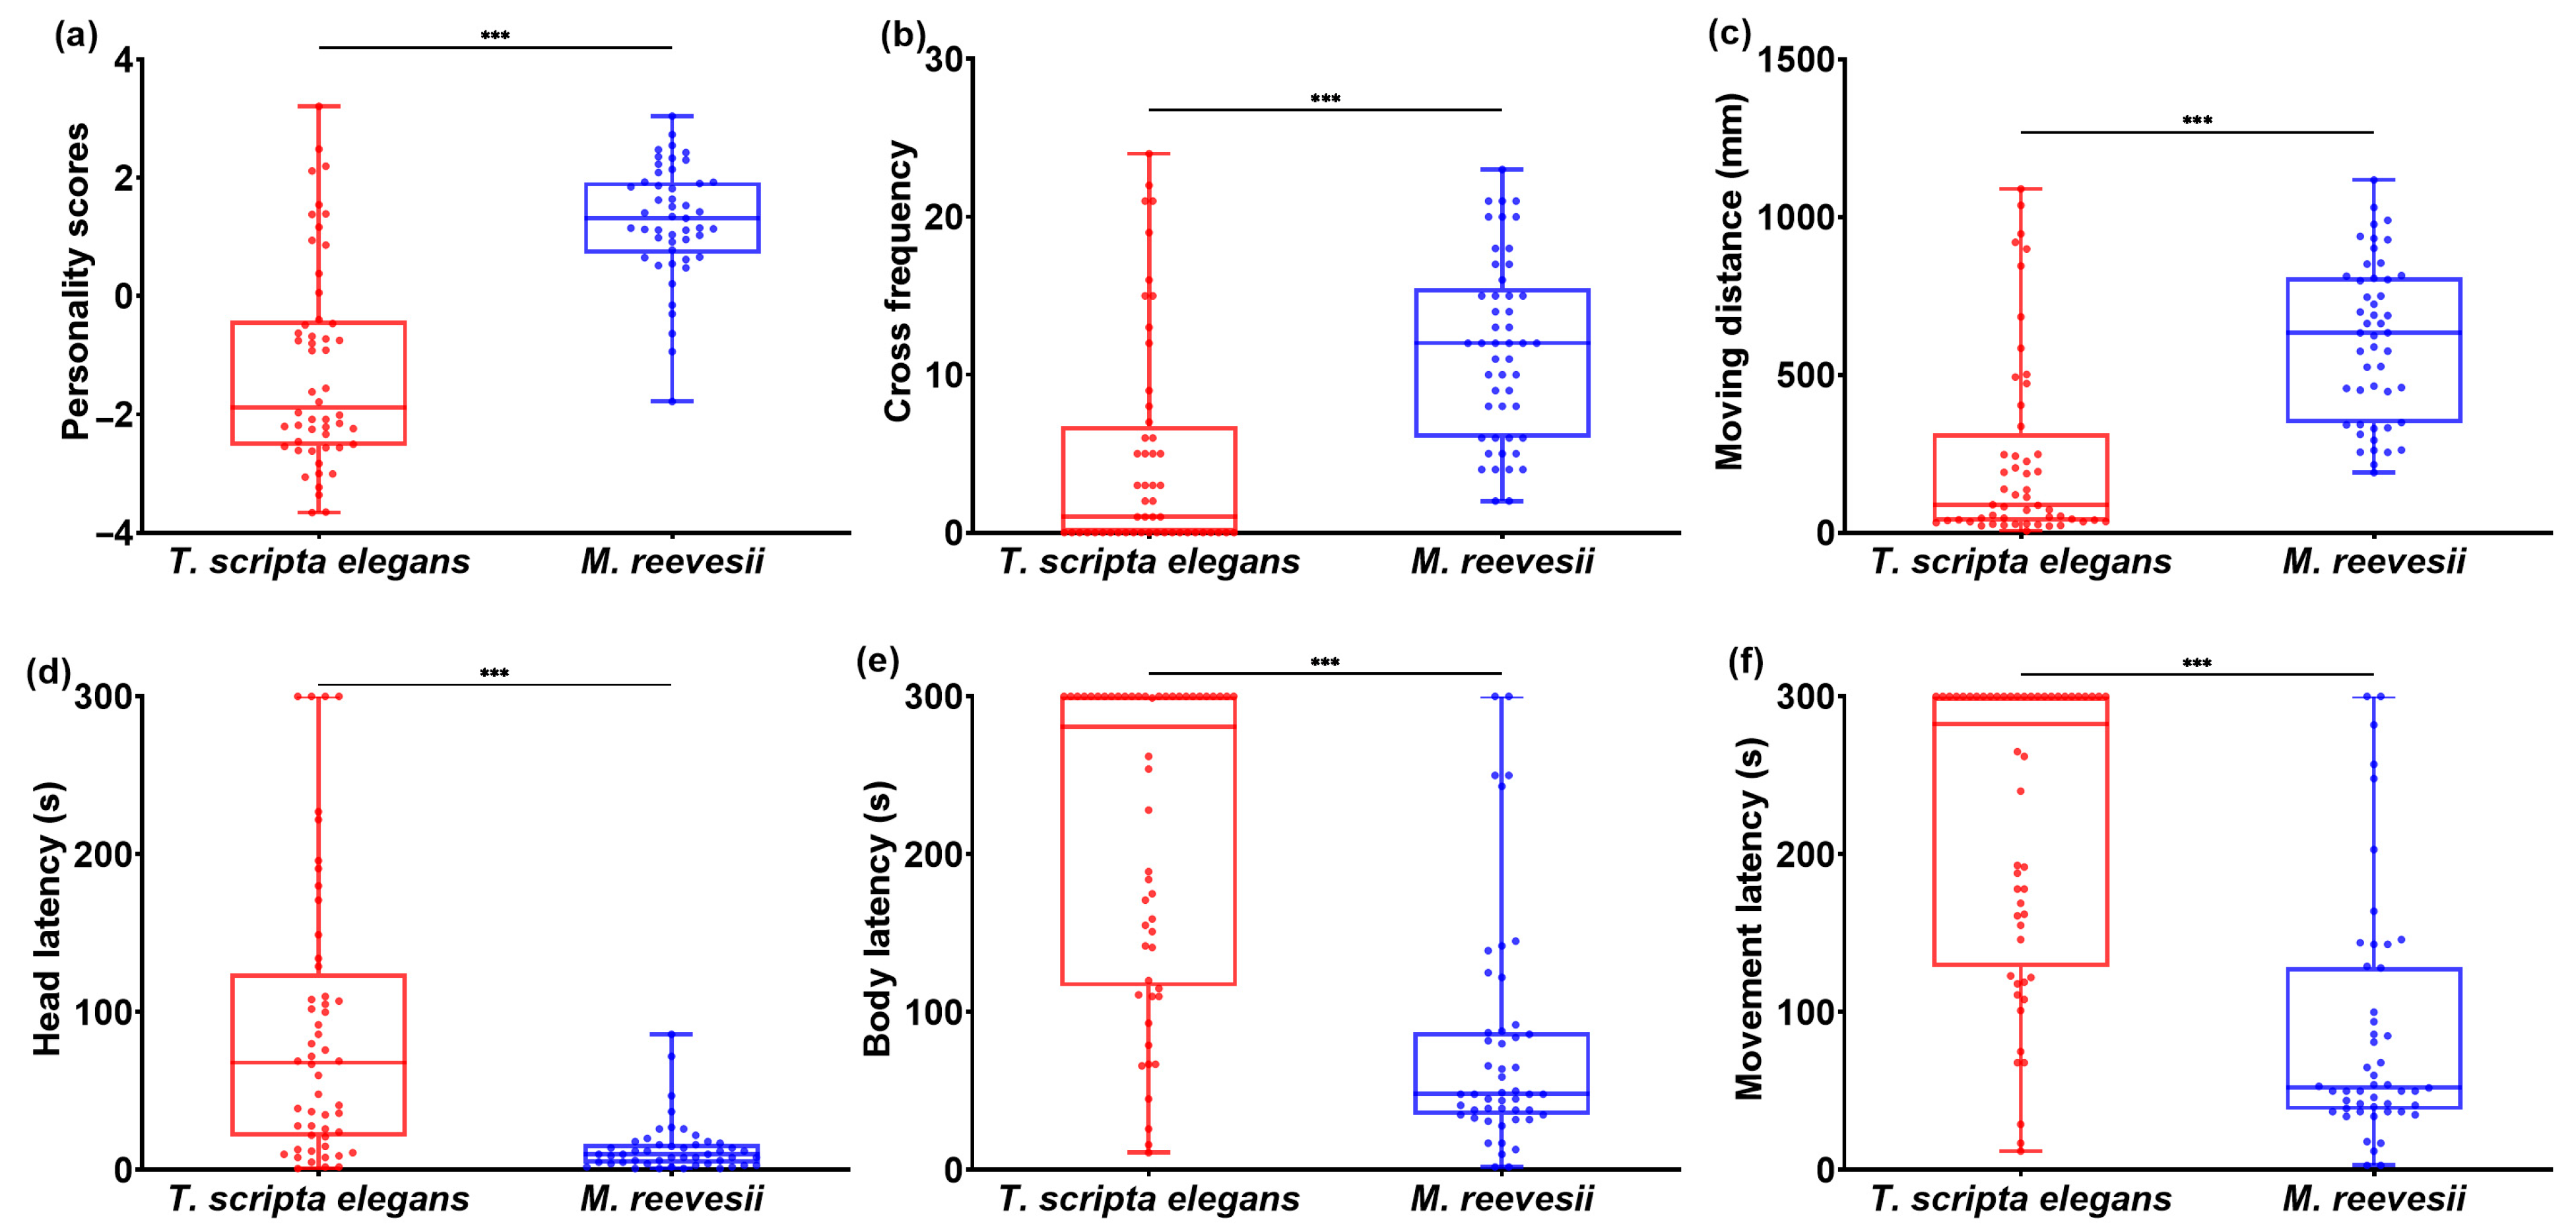
3.1. Boldness–Exploration Personality

The Principal Component Analysis (PCA) reduced the number of variables to two components with an eigenvalue >1 (Table 1). Together, these components account for 90.11% of the total variance. The PCA results showed that PC1 explained 70.02% of the total variance. It was positively correlated with the exploration test and negatively correlated with the latency measurements of the boldness test. Therefore, we chose to retain the transformed data obtained from PC1 in our study as boldness–exploration scores. The scale of boldness–exploration scores ranged from 3.31 to −3.66. Repeatability analysis revealed that the boldness–exploration personalities of M. reevesii and T. scripta elegans were highly repeatable. The total repeatability was R = 0.567 (95% confidence interval 0.415–0.677), with R = 0.540 (95% confidence interval 0.339–0.744) for M. reevesii and R = 0.610 (95% confidence interval 0.367–0.731) for T. scripta elegans.
The M. reevesii exhibited a significantly higher boldness–exploration score (1.27 ± 0.14) than T. scripta elegans (−1.19 ± 0.14) (F(1, 100) = 75.54, p < 0.001, as shown in Figure 1a). In terms of behavioral variables, M. reevesii exhibited a higher crossing frequency (F(1, 100) = 28.21, p < 0.001, Figure 1b) and covered a longer distance while moving (F(1, 100) = 743.14, p < 0.001, Figure 1c) than T. scripta elegans during exploration tests. M. reevesii showed shorter head emergence latency (F(1, 100) = 34.65, p < 0.001, Figure 1d), body emergence latency (F(1, 100) = 58.13, p < 0.001, Figure 1e), and movement latency (F(1, 100) = 56.62, p < 0.001, Figure 1f) than T. scripta elegans during boldness tests.

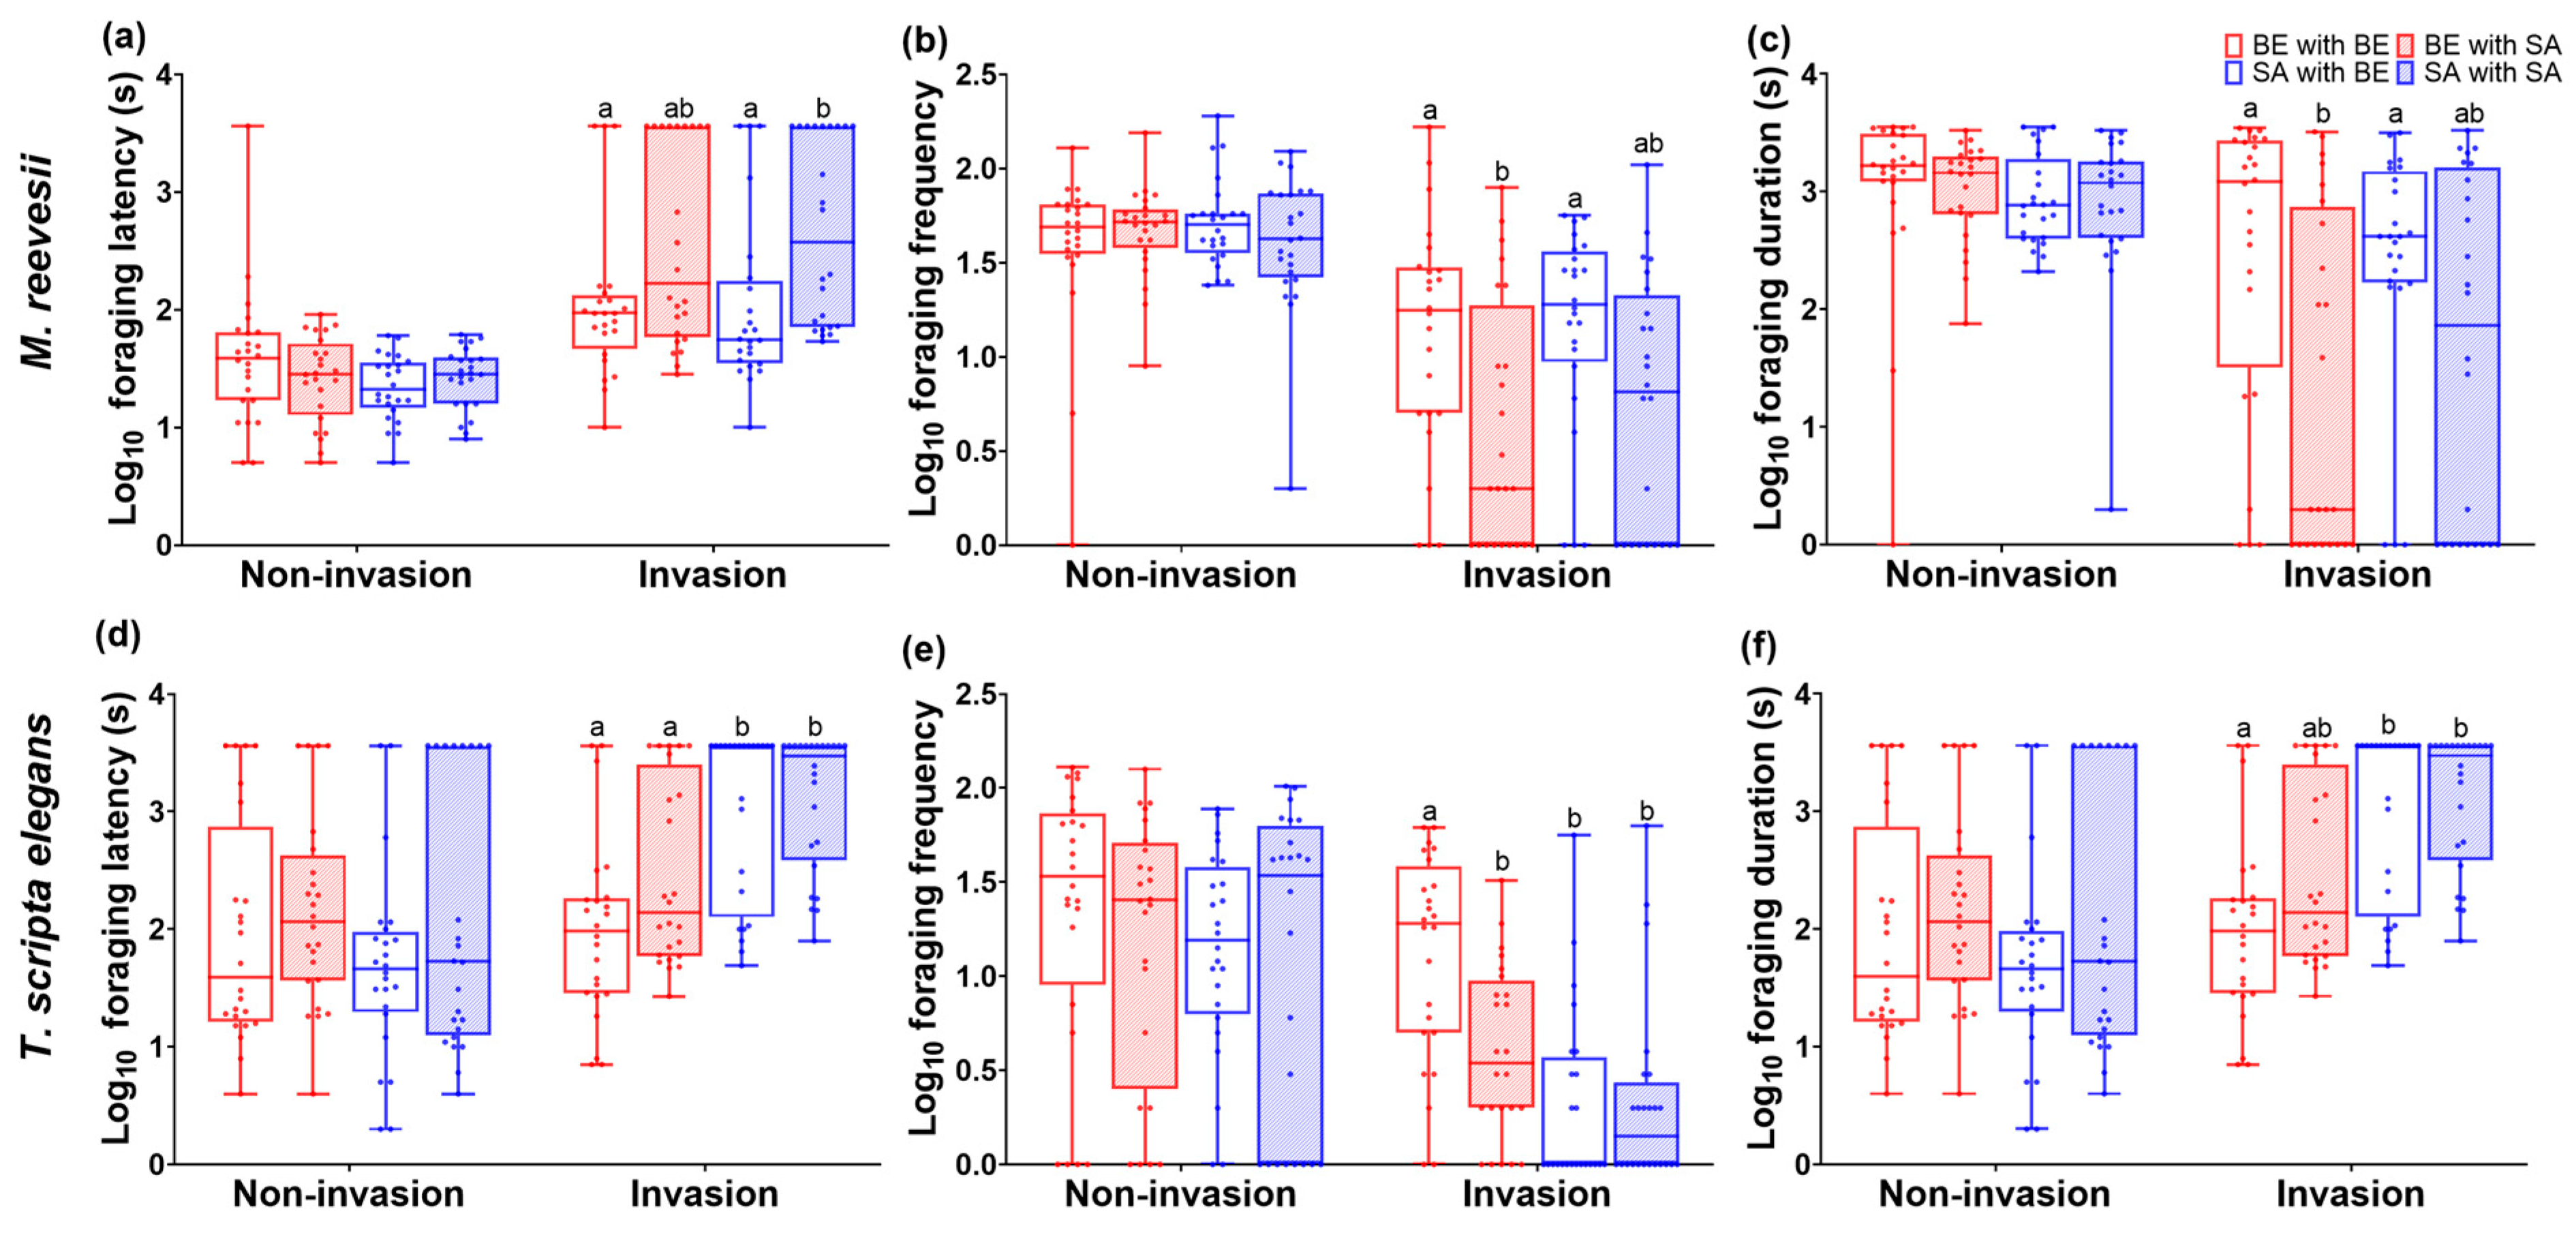
3.2. Foraging Behavior

3.2.1. Foraging Latency

We found a significant difference in foraging latency between stages (F(1, 184) = 119.49, p < 0.001), species (F(1, 184) = 29.64, p < 0.001) and groups (F(1, 184) = 5.53, p = 0.001). However, there was no interaction effect between species and groups (F(3, 184) = 2.07, p = 0.106). The foraging latency between groups of M. reevesii showed no significant difference during the non-invasion phase (F(3, 96) = 1.59, p = 0.198, Figure 2a). However, there was a significant difference during the invasion phase (F(3, 96) = 4.95, p = 0.003, Figure 2a), with the SA-SA group exhibiting a longer foraging latency than the BE-BE and SA-BE groups. The foraging latency between groups of T. scripta elegans showed no significant difference during the non-invasion phase (F(3, 96) = 1.15, p = 0.333, Figure 2d). However, there was a significant difference during the invasion phase (F(3, 96) = 12.51, p < 0.001, Figure 2d), with the SA-BE and SA-SA groups exhibiting longer foraging latency than the BE-BE and BE-SA groups. The foraging latency changes between the non-invasion and invasion phases showed a significant difference for M. reevesii and T. scripta elegans (F(1, 64) = 4.57, p = 0.037). However, there was no significant difference between groups (F(3, 64) = 2.16, p = 0.102) and no significant interaction effects between species and groups (F(3, 64) = 0.54, p = 0.659).

3.2.2. Foraging Frequency

The foraging frequency showed a significant difference between phase (F(1, 184) = 144.32, p < 0.001), species (F(1, 184) = 45.83, p < 0.001) and groups (F(3, 184) = 6.86, p < 0.001). There was also a significant interaction effect between species and groups (F(3, 184) = 4.98, p = 0.002). The foraging frequency between groups of M. reevesii showed no significant difference during the non-invasion phase (F(3, 96) = 0.67, p = 0.674, Figure 2b). However, there was a significant difference during the invasion phase (F(3, 96) = 4.52, p = 0.005, Figure 2b), with the BE-BE and SA-BE groups exhibiting higher foraging frequency than the SA-SA group. The foraging latency between groups of T. scripta elegans showed no significant difference during the non-invasion phase (F(3, 96) = 0.75, p = 0.524, Figure 2e). However, there was a significant difference during the invasion phase (F(3, 96) = 13.33, p < 0.001, Figure 2e), with the BE-BE group exhibiting a higher foraging frequency than the other groups. The foraging frequency changes between the non-invasion and invasion phases were significantly different between M. reevesii and T. scripta elegans (F(1, 64) = 5.50, p = 0.023), but there was no significant difference between groups (F(3, 64) = 1.25, p = 0.300) and no significant interaction effects between species and groups (F(3, 64) = 0.50, p = 0.684).

3.2.3. Foraging Duration

The foraging duration showed a significant difference between stages (F(1, 184) = 71.04, p < 0.001), species (F(1, 184) = 63.53, p < 0.001) and groups (F(3, 184) = 7.71, p < 0.001). Additionally, there was a significant interaction effect between species and groups (F(3, 184) = 2.82, p = 0.040). The foraging duration between groups of M. reevesii showed no significant difference during the non-invasion phase (F(3, 96) = 0.31, p = 0.815, Figure 2c). However, there was a significant difference during the invasion phase (F(3, 96) = 4.62, p = 0.005, Figure 2c), with the BE-BE and SA-BE groups having a longer foraging duration than the BE-SA group. The foraging duration between groups of T. scripta elegans showed no significant difference during the non-invasion phase (F(3, 96) = 0.49, p = 0.692, Figure 2f). However, there was a significant difference during the invasion phase (F(3, 96) = 9.16, p < 0.001, Figure 2f), with the SA-BE and SA-SA groups exhibiting a longer foraging duration than the BE-BE group. The foraging duration changes between the non-invasion and invasion stages were significantly different between M. reevesii and T. scripta elegans (F(1, 64) = 10.97, p = 0.002), but there was no significant difference between groups (F(3, 64) = 2.51, p = 0.068) and no significant interaction effects between species and groups (F(3, 64) = 0.20, p = 0.099).

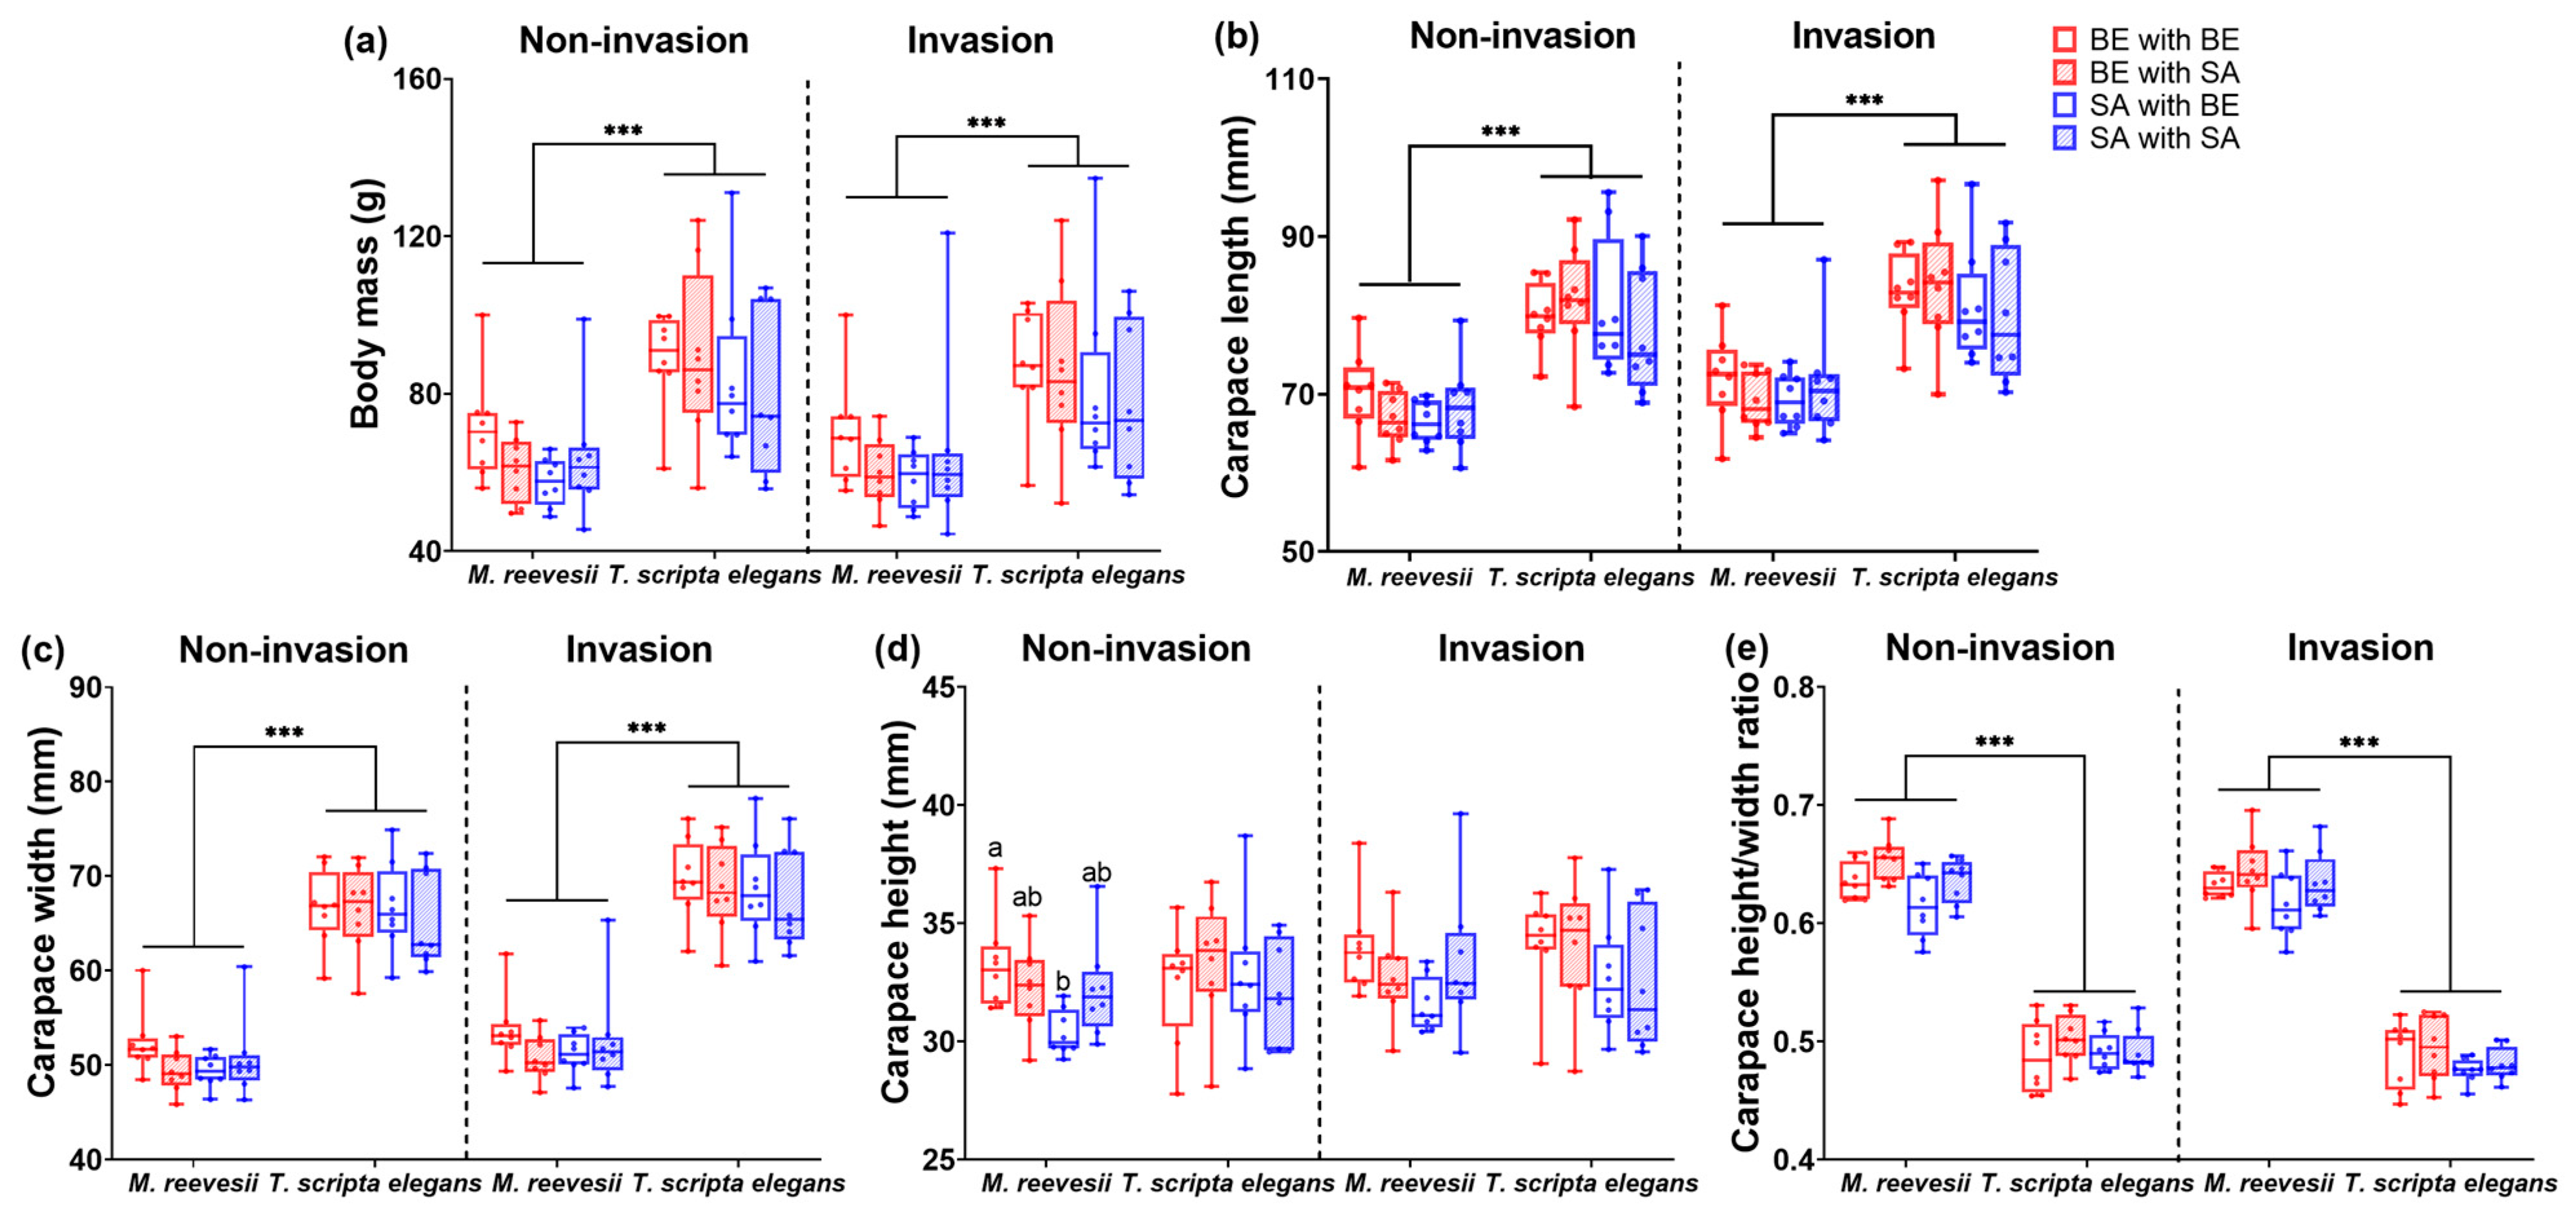
3.3. Morphology Traits

3.3.1. Body Mass

The body mass showed a significant difference between species (F(1, 56) = 23.89, p < 0.001, Figure 3a), with the body mass of M. reevesii being lower than that of T. scripta elegans. But there was no significant difference between groups (F(3, 56) = 0.87, p = 0.464, Figure 3a) and no interaction effect between species and groups (F(3, 56) = 0.47, p = 0.706, Figure 3a). Body mass showed a significant difference over time (F(1, 56) = 6.59, p = 0.013, Figure 3a), and there was an interaction effect between time and species (F(1, 56) = 7.11, p = 0.010). However, there were no interaction effects between time and groups (F(3, 56) = 0.41, p = 0.748) or among time, species, and groups (F(3, 56) = 0.76, p = 0.524).

3.3.2. Carapace Length

The carapace length showed a significant difference between species (F(1, 55) = 65.79, p < 0.001, see Figure 3b), with the carapace length of M. reevesii being shorter than that of T. scripta elegans. But there was no significant difference between groups (F(3, 55) = 1.03, p = 0.388, see Figure 3b) and no interaction effect between species and groups (F(3, 55) = 0.41, p = 0.747, see Figure 3b). The carapace length showed a significant difference among time points (F(1, 55) = 6.42, p = 0.014, Figure 3b). There was also an interaction effect between time and species (F(1, 55) = 5.42, p = 0.024), but no interaction effects were observed between time and groups (F(3, 55) = 0.41, p = 0.745) or among time, species, and groups (F(3, 55) = 2.36, p = 0.081).

3.3.3. Carapace Width

The carapace width showed a significant difference between species (F(1, 55) = 586.36, p < 0.001, Figure 3c), with the carapace length of M. reevesii being shorter than that of T. scripta elegans. But there was no significant difference between groups (F(3, 55) = 1.11, p = 0.354, Figure 3c) and there was no interaction effect between species and groups (F(3, 55) = 0.14, p = 0.934, Figure 3c). The carapace width showed a significant difference over time (F(1, 55) = 13.37, p = 0.001, see Figure 3c), with no interaction effects being observed between time and species (F(1, 55) = 0.40, p = 0.532), time and groups (F(3, 55) = 0.43, p = 0.734), or time, species, and groups (F(3, 55) = 2.24, p = 0.094).

3.3.4. Carapace Height

The carapace height showed a significant difference between species (F(1, 56) = 34.83, p < 0.001, Figure 3d), with the carapace length of M. reevesii being shorter than that of T. scripta elegans. But there was no significant difference between groups (F(3, 55) = 1.66, p = 0.185, Figure 3d) and there was no interaction effect between species and groups (F(3, 55) = 1.27, p = 0.292, Figure 3d). The carapace height showed no significant difference over time (F(1, 55) = 2.74, p = 0.103, Figure 3d). Additionally, there were no interaction effects observed between time and species (F(1, 55) = 2.25, p = 0.139) or between time and groups (F(3, 55) = 1.06, p = 0.372). There were interaction effects between time, species, and groups (F(3, 55) = 3.36, p = 0.025) The carapace height of the BE-BE group was significantly higher than that of the SA-BE group at the non-invasion stage in M. reevesii (p = 0.014).

3.3.5. Carapace Height/Width Ratio

The carapace height/width ratio showed a significant difference between species (F(1, 56) = 794.70, p < 0.001, Figure 3e), with the carapace length of M. reevesii being shorter than that of T. scripta elegans, and there was a significant difference between the groups (F(3, 56) = 3.85, p = 0.016, Figure 3e), but no interaction effect was observed between species and groups (F(3, 56) = 0.70, p = 0.557, Figure 3e). The carapace height/width ratio showed a significant difference over time (F(1, 56) = 6.65, p = 0.013, Figure 3e), with no interaction effects between time and species (F(1, 56) = 0.95, p = 0.333), time and groups (F(3, 56) = 0.77, p = 0.518), or time, species, and groups (F(3, 56) = 1.39, p = 0.256).

4. Discussion

Animal personalities could affect the behavioral and ecological strategies of both invasive species and native species during the invasion process [13,14,15,51]. Variation in personality affects the strength of selection and the evolution of a species [52,53,54]. Thus, behavioral variations among native species and invasive species may be due to their differences in personalities. The results of the current study show that the native species M. reevesii exhibited bolder and more exploratory behavior (1.27 ± 0.14) than the invasive species T. scripta elegans (−1.19 ± 0.24), which remained consistent over time. M. reevesii moved for longer distances and entered different zones more frequently during the exploration test. Additionally, it exhibited lower hiding behavior in response to modeled predation risk during the boldness test than T. scripta elegans. This variation may be due to the potential predator risks in their original habitat. Both M. reevesii and T. scripta elegans face predation by terrestrial mammals and birds. However, for T. scripta elegans, another significant threat comes from aquatic predators, such as caimans and crocodiles [55]. Therefore, it may be safer for M. reevesii to emerge from the shell earlier and escape to water because there is no aquatic predation risk in their original habitat [56]. Furthermore, this variation may also impact the difference in body size between the two species. Turtles exhibit a size-dependent hiding response, with larger individuals spending more time concealed inside their shell after an attack before reappearing [57]. This behavior is attributed to the higher costs that small individuals face when hiding, including missed foraging opportunities and increased thermal expenses. Small turtles cannot afford the metabolic expenditure associated with prolonged hiding, as it would detract from foraging time and lead to greater thermal costs due to a faster thermal exchange rate [58,59]. Therefore, the M. reevesii exhibited bolder and more exploratory personalities than T. scripta elegans. This difference may be an ecological and physiological adaptation consequence and could be crucial for species fitness.
Personality has been well established in regard to having fitness consequences and influencing important life-history decisions, such as foraging strategies [60]. Our results indicate a personality-related variation in foraging behavior between two turtle species. The bolder and more exploratory M. reevesii started foraging sooner, with a higher frequency and longer durations, than the shyer and more avoidant T. scripta elegans. Earlier and more frequent foraging may help boldness–exploration individuals find more food, but it may also increase the duration of foraging and expose animals to predators [61,62]. The foraging behavior variation between M. reevesii and T. scripta elegans may result from a trade-off between potential predator risk and physiological requirements. Individuals with poorer body conditions may have higher energy requirements for maintenance, which necessitates putting more effort into foraging and showing a higher motivation for it [21,63,64]. On the other hand, lower foraging effort may indicate a higher foraging efficiency in T. scripta elegans. Foraging efficiency is known to be a major determinant of individual fitness. Higher foraging efficiencies mean individuals can gain enough energy in a shorter time, reducing the time exposed to predator risks [65,66]. The larger body size (e.g., gape size) and advantages in feeding kinematics, such as faster movement ability, shorter gape cycle time, and neck retraction time during feeding, would benefit T. scripta elegans in completing feeding more quickly than other species [21,39,67]. Therefore, T. scripta elegans can forage enough food with a relatively lower foraging effort than other species.
Further, we found that the effects of biological invasions on foraging behavior were more pronounced for M. reevesii compared to T. scripta elegans. M. reevesii exhibited greater changes in their foraging behavior than T. scripta elegans, such as longer foraging latency, lower foraging frequency, and shorter foraging duration. This difference may be attributed to the competitive advantages of T. scripta elegans [39,67]. Advantages in competitions would presumably be an attempt to increase the profit of dominant species and reduce the overall foraging success of their competitors [68]. Although competition would increase the energy cost for both species, the disadvantaged species experience much lower energetic gains than the advantaged species [68,69]. Consequently, the subordinate M. reevesii tend to adopt avoidance strategies that reduce foraging effort in competitive foraging situations to evade the high energetic costs and low gains associated with losing a competition [21,70].
Moreover, we found that the foraging behavior changes were also correlated with their personality types. There were no variations in foraging behavior among groups in both M. reevesii and T. scripta elegans during the non-invasion stage. During the invasion stage, both M. reevesii and T. scripta elegans decreased their foraging efforts. For the native species M. reevesii, all groups showed increased foraging latency and decreased foraging frequency and duration. Interestingly, we found that the personalities of T. scripta elegans had a greater influence on foraging behavior compared to the personalities of M. reevesii. The shy–avoidance T. scripta elegans significantly reduced the foraging effort of M. reevesii compared to their boldness–exploration counterparts. However, the foraging behavior of T. scripta elegans was influenced by both their own personality types and M. reevesii personality types. Shy–avoidant T. scripta elegans exhibited increased foraging latency and longer foraging duration, as well as decreased foraging frequency compared to boldness–exploration individuals. Additionally, coexisting with the shy–avoidance species M. reevesii led to longer foraging latency and duration, as well as lower foraging frequency compared to coexisting with boldness–exploration M. reevesii. This variation may be related to the competitive advantages and the exploration–exploitation foraging strategies among personalities [21,71,72,73]. Bolder and more exploratory individuals typically adopt an exploration foraging strategy, which involves exploring relatively “superficially” when foraging, while shyer and more avoidant individuals usually opt for an exploitation foraging strategy which involves exploring relatively “thoroughly” when foraging [72,74,75,76]. The exploitation foraging strategy may increase the rate of competition for the same food resources due to the thorough foraging. This exploitation strategy may bring higher competitive pressure than seen with exploration individuals [76]. In the context of interspecific competition, the subordinate species needs to endure larger costs and much lower gains than the dominant species during foraging competition. The food available for the subordinate species is lower when competing with shy–avoidance competitors compared to boldness–exploration competitors [69,72,77,78].
From a net energy gain perspective, reducing the investment in foraging effort is a better trade-off for both the boldness–exploration and shy–avoidance subordinate species. The increased competitive pressures from ‘exploitation’ (shy–avoidance) competitors may further decrease the foraging effort of the subordinate species. Of course, dominant species also need to bear the costs of competition, such as a lower net rate of energy gain from foraging, which requires them to prolong the time spent foraging compared to when there are no inter-specific competitors [69,79]. Due to the intense competition and lower net energy gain rate associated with the exploitation strategy, shy–avoidant individuals need to spend much more time foraging compared to bold–exploratory individuals. Additionally, when competing with shy–avoidant individuals, the foraging time is significantly longer than when competing with bold–exploratory individuals. As competition intensifies, the dominant species will spend a significant amount of time expelling the subordinate species from the food resource [69,80,81]. As a result, the shy–avoidance dominant species would reduce the frequency of foraging more than the boldness–exploration dominant species, and they would also reduce the frequency of foraging more when competing with shy–avoidance competitors than with boldness–exploration competitors.
Even though previous studies have noted that biological invasion could reduce the growth rate of native species [26,82], there have also been many studies reporting differences in growth rates between personality types [83,84]. However, we did not find any effects of either the turtles’ own personality or the personality of their competitors on the growth of both M. reevesii and T. scripta elegans. The energy allocation model could potentially explain this lack of difference, as the turtles may reduce their energy costs in behaviors such as being active or foraging to meet the energy requirements for growth [85]. A recent meta-analysis revealed that the effects of biological invasion on growth were not seen across all taxa but only in certain species [26]. Another recent study provided evidence that there was no significant difference in the growth rates of M. reevesii and T. scripta elegans [34]. Therefore, the correlation between biological invasion and growth may not be significant in M. reevesii and T. scripta elegans. Furthermore, given the short duration of our experiment and the turtles’ lower growth rates, the effects of personality and biological invasion may also be masked by the short period of our study. Additional studies are needed to further investigate this issue.
Our results indicate that personality could affect inter-specific competition during invasion dynamics, as personality drives foraging strategies. The personality types of native species and invasive species have an interaction effect on the foraging strategy of both species and may play a crucial role in invasion speeds and dynamics. Although our study was carried out in a relatively short time, the long-term personality effects in the relationship between native species and invasive species, as well as the population dynamics, remain unclear. Further research is needed to provide deeper insights.

5. Conclusions

We found that personality can affect the foraging strategies of animals. Additionally, we also found that, during the invasion of non-native species with overlapping ecological niches, foraging strategies are influenced by the personalities of competitors. However, these effects of competitors’ personalities differed between native and non-native species. The foraging strategy of the native M. reevesii is mainly influenced by the personality types of the invasive T. scripta elegans, while the foraging strategy of T. scripta elegans is affected by both the personality types of the M. reevesii and T. scripta elegans species. These results suggest that the competitive advantages of invasive species and the foraging strategies among different personalities may play a crucial role in the plasticity of foraging strategies for native and invasive species during invasion dynamics. The foraging strategy of disadvantaged native species is primarily influenced by the competitive pressure from the personality-driven foraging strategy of invasive species. Conversely, the foraging strategy of advantaged invasive species is influenced by both the competitive pressure from the personality-driven foraging strategy of native species and their own personality. However, we did not find personality interaction effects on the growth of both native and invasive species. This result may be attributed to the slow growth of freshwater turtles, which short-term experiments could not differentiate. Alternatively, it could be due to the energetic trade-offs of species, where individuals reduce the energy cost of their behavior to allocate more energy towards growth maintenance. Further research is needed to discuss these results. Overall, our results reveal a personality-driven variation in foraging behavior and reveal the mechanisms of personality interactions in foraging strategies between overlapping ecological niches of native and invasive species during non-native species invasions. Our findings provided empirical evidence of the influence of personality traits on inter-specific competition and foraging strategies during invasion dynamics, which is helpful to enhance understanding of the personality effects on ecological interactions and invasion biology.

Author Contributions

Conceptualization, L.G. and Y.W.; methodology, L.G.; software, L.G.; investigation, L.G., S.Z., R.Z., T.S., L.T., H.Y. and K.H.; resources, L.G. and K.H.; data curation, L.G.; formal analysis, L.G.; writing—original draft preparation, L.G.; writing—review and editing, Y.W. and K.H.; visualization, L.G.; supervision, L.G. and Y.W.; funding acquisition, Y.W. All authors have read and agreed to the published version of the manuscript.

Funding

This work was supported by the National Natural Science Foundation of China (No. 32200701).

Institutional Review Board Statement

All experiments involving animals complied with current laws on animal welfare and research in China and the Guide for the Care and Use of Laboratory Animals (8th edition). The experiments were conducted according to the standards of the Animal Ethical and Welfare Committee of Nanjing Normal University (Approval No. IACUC-20230247). We strived to maximize the health of the animals and reduce their suffering, including feeding them shrimp after experiments, disinfecting tanks monthly, and adding electrolytes to the water once a week.

Informed Consent Statement

Not applicable.

Data Availability Statement

All data included in this study are available upon request from the corresponding author.

Acknowledgments

We are grateful to all the members of the Reptiles Evolutionary Physiological Ecology Group for their helpful discussions.

Conflicts of Interest

The authors declare no conflicts of interest.

References

  1. Blackburn, T.M.; Bellard, C.; Ricciardi, A. Alien versus Native Species as Drivers of Recent Extinctions. Front. Ecol. Environ. 2019, 17, 203–207. [Google Scholar] [CrossRef]
  2. Sala, O.E.; Stuart Chapin, F., III; Armesto, J.J.; Berlow, E.; Bloomfield, J.; Dirzo, R.; Huber-Sanwald, E.; Huenneke, L.F.; Jackson, R.B.; Kinzig, A.; et al. Global Biodiversity Scenarios for the Year 2100. Science 2000, 287, 1770–1774. [Google Scholar] [CrossRef] [PubMed]
  3. Doherty, T.S.; Glen, A.S.; Nimmo, D.G.; Ritchie, E.G.; Dickman, C.R. Invasive Predators and Global Biodiversity Loss. Proc. Natl. Acad. Sci. USA 2016, 113, 11261–11265. [Google Scholar] [CrossRef] [PubMed]
  4. Gallardo, B.; Clavero, M.; Sánchez, M.I.; Vilà, M. Global Ecological Impacts of Invasive Species in Aquatic Ecosystems. Glob. Chang. Biol. 2016, 22, 151–163. [Google Scholar] [CrossRef] [PubMed]
  5. Collins, S.M.; Hendrix, J.G.; Webber, Q.M.R.; Boyle, S.P.; Kingdon, K.A.; Blackmore, R.J.; d’Entremont, K.J.N.; Hogg, J.; Ibáñez, J.P.; Kennah, J.L.; et al. Bibliometric Investigation of the Integration of Animal Personality in Conservation Contexts. Conserv. Biol. 2022, 37, e14021. [Google Scholar] [CrossRef] [PubMed]
  6. Dudgeon, D.; Arthington, A.H.; Gessner, M.O.; Kawabata, Z.-I.; Knowler, D.J.; Lévêque, C.; Naiman, R.J.; Prieur-Richard, A.-H.; Soto, D.; Stiassny, M.L.J.; et al. Freshwater Biodiversity: Importance, Threats, Status and Conservation Challenges. Biol. Rev. 2006, 81, 163–182. [Google Scholar] [CrossRef] [PubMed]
  7. Bowler, D.E.; Benton, T.G. Causes and Consequences of Animal Dispersal Strategies: Relating Individual Behaviour to Spatial Dynamics. Biol. Rev. Camb. Philos. Soc. 2005, 80, 205–225. [Google Scholar] [CrossRef]
  8. Clobert, J.; Le Galliard, J.-F.; Cote, J.; Meylan, S.; Massot, M. Informed Dispersal, Heterogeneity in Animal Dispersal Syndromes and the Dynamics of Spatially Structured Populations. Ecol. Lett. 2009, 12, 197–209. [Google Scholar] [CrossRef]
  9. Cote, J.; Bestion, E.; Jacob, S.; Travis, J.; Legrand, D.; Baguette, M. Evolution of Dispersal Strategies and Dispersal Syndromes in Fragmented Landscapes. Ecography 2017, 40, 56–73. [Google Scholar] [CrossRef]
  10. Winandy, L.; Denoël, M. The Aggressive Personality of an Introduced Fish Affects Foraging Behavior in a Polymorphic Newt. Behav. Ecol. 2015, 26, 1528–1536. [Google Scholar] [CrossRef]
  11. Polo-Cavia, N.; López, P.; Martín, J. Aggressive Interactions during Feeding between Native and Invasive Freshwater Turtles. Biol. Invasions 2011, 13, 1387–1396. [Google Scholar] [CrossRef]
  12. Gosling, S.D. Personality in Non-Human Animals: Animal Personality. Soc. Personal. Psychol. Compass 2008, 2, 985–1001. [Google Scholar] [CrossRef]
  13. Cote, J.; Fogarty, S.; Weinersmith, K.; Brodin, T.; Sih, A. Personality Traits and Dispersal Tendency in the Invasive Mosquitofish. Proc. R. Soc. B Biol. Sci. 2010, 277, 1571–1579. [Google Scholar] [CrossRef] [PubMed]
  14. Duckworth, R.A.; Badyaev, A.V. Coupling of Dispersal and Aggression Facilitates the Rapid Range Expansion of a Passerine Bird. Proc. Natl. Acad. Sci. USA 2007, 104, 15017–15022. [Google Scholar] [CrossRef] [PubMed]
  15. Malange, J.; Izar, P.; Japyassú, H. Personality and Behavioural Syndrome in Necromys Lasiurus (Rodentia: Cricetidae): Notes on Dispersal and Invasion Processes. Acta Ethologica 2016, 19, 189–195. [Google Scholar] [CrossRef]
  16. Chapple, D.G.; Simmonds, S.M.; Wong, B.B.M. Can Behavioral and Personality Traits Influence the Success of Unintentional Species Introductions? Trends Ecol. Evol. 2012, 27, 57–64. [Google Scholar] [CrossRef] [PubMed]
  17. Fogarty, S.; Cote, J.; Sih, A. Social Personality Polymorphism and the Spread of Invasive Species: A Model. Am. Nat. 2011, 177, 273–287. [Google Scholar] [CrossRef]
  18. Galib, S.M.; Sun, J.; Twiss, S.D.; Lucas, M.C. Personality, Density and Habitat Drive the Dispersal of Invasive Crayfish. Sci. Rep. 2022, 12, 1114. [Google Scholar] [CrossRef] [PubMed]
  19. Short, K.H.; Petren, K. Boldness Underlies Foraging Success of Invasive Lepidodactylus Lugubris Geckos in the Human Landscape. Anim. Behav. 2008, 76, 429–437. [Google Scholar] [CrossRef]
  20. Galli, A.; Behrens, J.W.; Gesto, M.; Moran, N.P. Boldness and Physiological Variation in Round Goby Populations along Their Baltic Sea Invasion Front. Physiol. Behav. 2023, 269, 114261. [Google Scholar] [CrossRef]
  21. Sih, A.; Mathot, K.J.; Moirón, M.; Montiglio, P.-O.; Wolf, M.; Dingemanse, N.J. Animal Personality and State–Behaviour Feedbacks: A Review and Guide for Empiricists. Trends Ecol. Evol. 2015, 30, 50–60. [Google Scholar] [CrossRef] [PubMed]
  22. Neumann, K.M.; Pinter-Wollman, N. Collective Responses to Heterospecifics Emerge from Individual Differences in Aggression. Behav. Ecol. 2019, 30, 801–808. [Google Scholar] [CrossRef] [PubMed]
  23. Berger-Tal, O.; Blumstein, D.T.; Carroll, S.; Fisher, R.N.; Mesnick, S.L.; Owen, M.A.; Saltz, D.; St. Claire, C.C.; Swaisgood, R.R. A systematic survey of the integration of animal behavior into conservation. Conserv. Biol. 2016, 30, 744–753. [Google Scholar] [CrossRef] [PubMed]
  24. del Río, L.; Navarro-Martínez, Z.M.; Cobián-Rojas, D.; Chevalier-Monteagudo, P.P.; Angulo-Valdes, J.A.; Rodriguez-Viera, L. Biology and Ecology of the Lionfish Pterois Volitans/Pterois Miles as Invasive Alien Species: A Review. PeerJ 2023, 11, e15728. [Google Scholar] [CrossRef]
  25. Evans, M.V.; Drake, J.M.; Jones, L.; Murdock, C.C. Assessing Temperature-Dependent Competition between Two Invasive Mosquito Species. Ecol. Appl. 2021, 31, e02334. [Google Scholar] [CrossRef] [PubMed]
  26. Nunes, A.L.; Fill, J.M.; Davies, S.J.; Louw, M.; Rebelo, A.D.; Thorp, C.J.; Vimercati, G.; Measey, J. Analysis of the Ecological Impacts of Alien Species on Native Amphibians. Proc. R. Soc. B Biol. Sci. 2019, 286, 20182528. [Google Scholar] [CrossRef]
  27. Ruland, F.; Jeschke, J.M. How Biological Invasions Affect Animal Behaviour: A Global, Cross-Taxonomic Analysis. J. Anim. Ecol. 2020, 89, 2531–2541. [Google Scholar] [CrossRef] [PubMed]
  28. Chapple, D.G.; Naimo, A.C.; Brand, J.A.; Michelangeli, M.; Martin, J.M.; Goulet, C.T.; Brunton, D.H.; Sih, A.; Wong, B.B.M. Biological Invasions as a Selective Filter Driving Behavioral Divergence. Nat. Commun. 2022, 13, 5996. [Google Scholar] [CrossRef]
  29. Ericsson, P.; Persson, A.; Behrens, J.W.; Brodin, T.; Hirsch, P.E.; Sundelin, A.; van Deurs, M.; von Friesen, L.W.; Nilsson, P.A. Personality-Dependent Inter- and Intraspecific Foraging Competition in the Invasive Round Goby, Neogobius melanostomus. J. Fish Biol. 2021, 98, 1234–1241. [Google Scholar] [CrossRef]
  30. Santicchia, F.; Wauters, L.A.; Tranquillo, C.; Villa, F.; Dantzer, B.; Palme, R.; Preatoni, D.; Martinoli, A. Invasive Alien Species as an Environmental Stressor and Its Effects on Coping Style in a Native Competitor, the Eurasian Red Squirrel. Horm. Behav. 2022, 140, 105127. [Google Scholar] [CrossRef]
  31. Pearson, S.H.; Avery, H.W.; Spotila, J.R. Juvenile Invasive Red-Eared Slider Turtles Negatively Impact the Growth of Native Turtles: Implications for Global Freshwater Turtle Populations. Biol. Conserv. 2015, 186, 115–121. [Google Scholar] [CrossRef]
  32. Polo-Cavia, N.; López, P.; Martín, J. Competitive Interactions during Basking between Native and Invasive Freshwater Turtle Species. Biol. Invasions 2010, 12, 2141–2152. [Google Scholar] [CrossRef]
  33. Lowe, S.; Browne, M.; Boudjelas, S.; De Poorter, M. 100 of the World’s Worst Invasive Alien Species: A Selection from the Global Invasive Species Database. In Encyclopedia of Biological Invasions; Simberloff, D., Rejmanek, M., Eds.; University of California Press: Cambridge, UK, 2019; pp. 715–716. ISBN 978-0-520-94843-3. [Google Scholar]
  34. Meng, Q.-Y.; Mo, D.-M.; Li, H.; Wang, W.-L.; Lu, H.-L. Divergent Responses in the Gut Microbiome and Liver Metabolome to Ammonia Stress in Three Freshwater Turtles. Sci. Total Environ. 2023, 859, 160372. [Google Scholar] [CrossRef] [PubMed]
  35. Turtle Taxonomy Working Group; Rhodin, A.G.J.; Iverson, J.B.; Bour, R.; Fritz, U.; Georges, A.; Shaffer, H.B.; van Dijk, P.P. Turtles of the World: Annotated Checklist and Atlas of Taxonomy, Synonymy, Distribution, and Conservation Status, 8th ed.; Chelonian Research Foundation & Turtle Conservancy: Lunenburg, MA, USA, 2017; ISBN 978-1-5323-5026-9. [Google Scholar]
  36. van Dijk, P.P. Mauremys reevesii. In The IUCN Red List of Threatened Species 2011; International Union for Conservation of Nature: Fontainebleau, French, 2011. [Google Scholar] [CrossRef]
  37. Masin, S.; Bonardi, A.; Padoa-Schioppa, E.; Bottoni, L.; Ficetola, G.F. Risk of Invasion by Frequently Traded Freshwater Turtles. Biol. Invasions 2014, 16, 217–231. [Google Scholar] [CrossRef]
  38. Wu, J.; Wu, Y.; Rao, D.; Zhou, T.; Gong, S. China’s Wild Turtles at Risk of Extinction. Science 2020, 368, 838. [Google Scholar] [CrossRef] [PubMed]
  39. Nishizawa, H.; Tabata, R.; Hori, T.; Mitamura, H.; Arai, N. Feeding Kinematics of Freshwater Turtles: What Advantage Do Invasive Species Possess? Zoology 2014, 117, 315–318. [Google Scholar] [CrossRef] [PubMed]
  40. Zhang, C.; Kang, C.; Huang, X.; Lu, H. Differences in swimming, righting performance and heart rate in the invasive Trachemys scripta elegans and native Mauremys reevesii hatchling. Acta Ecol. Sin. 2021, 41, 7204–7211. [Google Scholar] [CrossRef]
  41. Cadi, A.; Joly, P. Competition for Basking Places between the Endangered European Pond Turtle and the Introduced Red-Eared Slider. Can. J. Zool. 2011, 81, 1392–1398. [Google Scholar] [CrossRef]
  42. Jiang, S.; Zhang, C.; Pan, X.; Storey, K.B.; Zhang, W. Distinct Metabolic Responses to Thermal Stress between Invasive Freshwater Turtle Trachemys Scripta Elegans and Native Freshwater Turtles in China. Integr. Zool. 2024, 00, 1–19. [Google Scholar] [CrossRef]
  43. Wu, M.-X.; Hu, L.-J.; Dang, W.; Lu, H.-L.; Du, W.-G. Effect of Thermal Acclimation on Thermal Preference, Resistance and Locomotor Performance of Hatchling Soft-Shelled Turtle. Curr. Zool. 2013, 59, 718–724. [Google Scholar] [CrossRef]
  44. Kashon, E.A.F.; Carlson, B.E. Consistently Bolder Turtles Maintain Higher Body Temperatures in the Field but May Experience Greater Predation Risk. Behav. Ecol. Sociobiol. 2018, 72, 9. [Google Scholar] [CrossRef]
  45. Roth, T.C.; Rosier, M.; Krochmal, A.R.; Clark, L. A Multi-trait, Field-based Examination of Personality in a Semi-aquatic Turtle. Ethology 2020, 126, 851–857. [Google Scholar] [CrossRef]
  46. Miller, S.; Derenne, A.; Ellis-Felege, S.; Rhen, T. Incubation Temperature and Satiety Influence General Locomotor and Exploratory Behaviors in the Common Snapping Turtle (Chelydra serpentina). Physiol. Behav. 2020, 220, 112875. [Google Scholar] [CrossRef] [PubMed]
  47. Reed, B.M.; Hobelman, K.; Gauntt, A.; Schwenka, M.; Trautman, A.; Wagner, P.; Kim, S.; Armstrong, C.; Wagner, S.; Weller, A.; et al. Spatiotemporal Variation of Behavior and Repeatability in a Long-Lived Turtle. Behav. Ecol. Sociobiol. 2023, 77, 88. [Google Scholar] [CrossRef]
  48. Thioulouse, J.; Dray, S.; Dufour, A.-B.; Siberchicot, A.; Jombart, T.; Pavoine, S. Multivariate Analysis of Ecological Data with Ade4; Springer: New York, NY, USA, 2018; ISBN 978-1-4939-8848-8. [Google Scholar]
  49. Wauters, L.A.; Mazzamuto, M.V.; Santicchia, F.; Martinoli, A.; Preatoni, D.G.; Lurz, P.W.W.; Bertolino, S.; Romeo, C. Personality Traits, Sex and Food Abundance Shape Space Use in an Arboreal Mammal. Oecologia 2021, 196, 65–76. [Google Scholar] [CrossRef]
  50. Hadfield, J.D. MCMC Methods for Multi-Response Generalized Linear Mixed Models: The MCMCglmm R Package. J. Stat. Softw. 2010, 33, 1–22. [Google Scholar] [CrossRef]
  51. Sih, A.; Cote, J.; Evans, M.; Fogarty, S.; Pruitt, J. Ecological Implications of Behavioural Syndromes. Ecol. Lett. 2012, 15, 278–289. [Google Scholar] [CrossRef] [PubMed]
  52. Réale, D.; Reader, S.M.; Sol, D.; McDougall, P.T.; Dingemanse, N.J. Integrating Animal Temperament within Ecology and Evolution. Biol. Rev. 2007, 82, 291–318. [Google Scholar] [CrossRef] [PubMed]
  53. Réale, D.; Dingemanse, N.J.; Kazem, A.J.N.; Wright, J. Evolutionary and Ecological Approaches to the Study of Personality. Philos. Trans. R. Soc. B Biol. Sci. 2010, 365, 3937–3946. [Google Scholar] [CrossRef] [PubMed]
  54. Wolf, M.; Weissing, F.J. Animal Personalities: Consequences for Ecology and Evolution. Trends Ecol. Evol. 2012, 27, 452–461. [Google Scholar] [CrossRef]
  55. Greene, H.W. Antipredator Mechanisms in Reptiles. In Biology of the Reptilia; Gans, C., Huey, R.B., Eds.; Alan R. Liss: New York, NY, USA, 1988; Volume 16, pp. 1–152. [Google Scholar]
  56. Polo-Cavia, N.; López, P.; Martín, J. Interspecific Differences in Responses to Predation Risk May Confer Competitive Advantages to Invasive Freshwater Turtle Species. Ethology 2008, 114, 115–123. [Google Scholar] [CrossRef]
  57. Ibáñez, A.; López, P.; Martín, J. Inter-Individual Variation in Antipredator Hiding Behavior of Spanish Terrapins Depends on Sex, Size, and Coloration. Ethology 2014, 120, 742–752. [Google Scholar] [CrossRef]
  58. Krause, J.; Loader, S.P.; McDermott, J.; Ruxton, G.D. Refuge Use by Fish as a Function of Body Length–Related Metabolic Expenditure and Predation Risks. Proc. R. Soc. Lond. B Biol. Sci. 1998, 265, 2373–2379. [Google Scholar] [CrossRef]
  59. Polo-Cavia, N.; López, P.; Martín, J. Interspecific Differences in Heat Exchange Rates May Affect Competition between Introduced and Native Freshwater Turtles. Biol. Invasions 2009, 11, 1755–1765. [Google Scholar] [CrossRef]
  60. Sih, A.; Bell, A.M.; Johnson, J.C.; Ziemba, R.E. Behavioral Syndromes: An Integrative Overview. Q. Rev. Biol. 2004, 79, 241–277. [Google Scholar] [CrossRef] [PubMed]
  61. Anselme, P.; Güntürkün, O. How Foraging Works: Uncertainty Magnifies Food-Seeking Motivation. Behav. Brain Sci. 2018, 42, e35. [Google Scholar] [CrossRef] [PubMed]
  62. Carter, A.J.; Goldizen, A.W.; Tromp, S.A. Agamas Exhibit Behavioral Syndromes: Bolder Males Bask and Feed More but May Suffer Higher Predation. Behav. Ecol. 2010, 21, 655–661. [Google Scholar] [CrossRef]
  63. Ballard, G.; Dugger, K.M.; Nur, N.; Ainley, D.G. Foraging Strategies of Adélie Penguins: Adjusting Body Condition to Cope with Environmental Variability. Mar. Ecol. Prog. Ser. 2010, 405, 287–302. [Google Scholar] [CrossRef]
  64. David, M.; Auclair, Y.; Giraldeau, L.-A.; Cézilly, F. Personality and Body Condition Have Additive Effects on Motivation to Feed in Zebra Finches Taeniopygia Guttata. Ibis 2012, 154, 372–378. [Google Scholar] [CrossRef]
  65. Jeanniard-du-Dot, T.; Trites, A.W.; Arnould, J.P.Y.; Guinet, C. Reproductive Success Is Energetically Linked to Foraging Efficiency in Antarctic Fur Seals. PLoS ONE 2017, 12, e0174001. [Google Scholar] [CrossRef]
  66. Stephens, D.W.; Brown, J.S.; Ydenberg, R.C. (Eds.) Foraging: Behavior and Ecology; University of Chicago Press: Chicago, IL, USA, 2007; ISBN 978-0-226-77264-6. [Google Scholar]
  67. Zhou, Z.; Cai, S.; Liu, Y.; Sun, Y.; Luo, L. Body temperature, thermal dependence of locomotor performance, compensatory growth, and the immunity of hatchling Red-eared turtles and Chinese pond turtles. Acta Ecol. Sin. 2016, 36, 7014–7022. [Google Scholar]
  68. Rankin, D.J.; Bargum, K.; Kokko, H. The Tragedy of the Commons in Evolutionary Biology. Trends Ecol. Evol. 2007, 22, 643–651. [Google Scholar] [CrossRef]
  69. Berger-Tal, O.; Embar, K.; Kotler, B.P.; Saltz, D. Everybody Loses: Intraspecific Competition Induces Tragedy of the Commons in Allenby’s Gerbils. Ecology 2015, 96, 54–61. [Google Scholar] [CrossRef]
  70. Chase, I.D.; Bartolomeo, C.; Dugatkin, L.A. Aggressive Interactions and Inter-Contest Interval: How Long Do Winners Keep Winning? Anim. Behav. 1994, 48, 393–400. [Google Scholar] [CrossRef]
  71. Mathot, K.J.; Wright, J.; Kempenaers, B.; Dingemanse, N.J. Adaptive Strategies for Managing Uncertainty May Explain Personality-Related Differences in Behavioural Plasticity. Oikos 2012, 121, 1009–1020. [Google Scholar] [CrossRef]
  72. Reader, S.M. Causes of Individual Differences in Animal Exploration and Search. Top. Cogn. Sci. 2015, 7, 451–468. [Google Scholar] [CrossRef]
  73. Stamps, J.A.; Groothuis, T.G.G. Developmental Perspectives on Personality: Implications for Ecological and Evolutionary Studies of Individual Differences. Philos. Trans. R. Soc. B Biol. Sci. 2010, 365, 4029–4041. [Google Scholar] [CrossRef]
  74. Gharnit, E.; Dammhahn, M.; Garant, D.; Réale, D. Resource Availability, Sex, and Individual Differences in Exploration Drive Individual Diet Specialization. Am. Nat. 2022, 200, 1–16. [Google Scholar] [CrossRef]
  75. Li, C.; Zhang, X.; Cheng, L.; Zhang, B.; Zhang, F. Food Patch Use of Japanese Quail (Coturnix Japonica) Varies with Personality Traits. Front. Zool. 2023, 20, 30. [Google Scholar] [CrossRef]
  76. Patrick, S.C.; Pinaud, D.; Weimerskirch, H. Boldness Predicts an Individual’s Position along an Exploration–Exploitation Foraging Trade-Off. J. Anim. Ecol. 2017, 86, 1257–1268. [Google Scholar] [CrossRef]
  77. Giraldeau, L.-A.; Dubois, F. Chapter 2 Social Foraging and the Study of Exploitative Behavior. In Advances in the Study of Behavior; Academic Press: Cambridge, MA, USA, 2008; Volume 38, pp. 59–104. [Google Scholar]
  78. Jeffries, P.M.; Patrick, S.C.; Potts, J.R. Be Different to Be Better: The Effect of Personality on Optimal Foraging with Incomplete Knowledge. Theor. Ecol. 2021, 14, 575–587. [Google Scholar] [CrossRef]
  79. Sjerps, M.; Haccou, P. Effects of Competition on Optimal Patch Leaving: A War of Attrition. Theor. Popul. Biol. 1994, 46, 300–318. [Google Scholar] [CrossRef]
  80. Gyimesi, A.; van Rooij, E.P.; Nolet, B.A. Nonlinear Effects of Food Aggregation on Interference Competition in Mallards. Behav. Ecol. Sociobiol. 2010, 64, 1897–1904. [Google Scholar] [CrossRef]
  81. Scharf, I.; Filin, I.; Ovadia, O. An Experimental Design and a Statistical Analysis Separating Interference from Exploitation Competition. Popul. Ecol. 2008, 50, 319–324. [Google Scholar] [CrossRef]
  82. Vodrážková, M.; Šetlíková, I.; Berec, M. Chemical Cues of an Invasive Turtle Reduce Development Time and Size at Metamorphosis in the Common Frog. Sci. Rep. 2020, 10, 7978. [Google Scholar] [CrossRef]
  83. Mas-Muñoz, J.; Komen, H.; Schneider, O.; Visch, S.W.; Schrama, J.W. Feeding Behaviour, Swimming Activity and Boldness Explain Variation in Feed Intake and Growth of Sole Reared in Captivity. PLoS ONE 2011, 6, e21393. [Google Scholar] [CrossRef]
  84. Biro, P.A.; Stamps, J.A. Are Animal Personality Traits Linked to Life-History Productivity? Trends Ecol. Evol. 2008, 23, 361–368. [Google Scholar] [CrossRef]
  85. Careau, V.; Garland, T. Performance, Personality, and Energetics: Correlation, Causation, and Mechanism. Physiol. Biochem. Zool. 2012, 85, 543–571. [Google Scholar] [CrossRef]
Figure 1. Boldness–exploration personality and behavioral variables difference between M. reevesii and T. scripta elegans: (a) personality scores; (b) cross frequency in exploration test; (c) moving distance in exploration test; (d) head emergency latency in boldness test; (e) limbs emergency latency in boldness test; (f) movement latency in boldness test. *** p < 0.001.
Animals 14 02240 g001
Figure 2. Foraging behavior traits of M. reevesii and T. scripta elegans: (a) log10 foraging latency of M. reevesii; (b) log10 foraging frequency of M. reevesii; (c) log10 foraging duration of M. reevesii; (d) log10 foraging latency of T. scripta elegans; (e) log10 foraging frequency of T. scripta elegans; (f) log10 foraging duration of T. scripta elegans. Different letters above bars indicate a significant difference in the pairing success rate between combinations (Bonferroni correction of post hoc tests, p < 0.05), and the same letter indicates that the difference was not significant at p > 0.05).
Animals 14 02240 g002
Figure 3. Morphology traits of M. reevesii and T. scripta elegans between non-invasion and invasion stage: (a) body mass; (b) carapace length; (c) carapace width; (d) carapace height; (e) carapace height/width ratio. *** p < 0.001. Different letters above bars indicate a significant difference in the pairing success rate between combinations (Bonferroni correction of post hoc tests, p < 0.05), and the same letter indicates that the difference was not significant at p > 0.05).
Animals 14 02240 g003
Table 1. Correlation of each behavior observed during the boldness and exploration tests on M. reevesii and T. scripta elegans with the components of the principal component analysis (PCA).
Behavioral VariablesComponent 1 (PC1)Component 2 (PC 2)
Boldness: head latency−0.388−0.470
Boldness: body latency−0.490−0.299
Boldness: movement latency−0.488−0.292
Exploration: moving distance0.442−0.517
Exploration: cross frequency0.419−0.580
Eigenvalue3.501.00
Total variance (%)70.02%20.09%
Disclaimer/Publisher’s Note: The statements, opinions and data contained in all publications are solely those of the individual author(s) and contributor(s) and not of MDPI and/or the editor(s). MDPI and/or the editor(s) disclaim responsibility for any injury to people or property resulting from any ideas, methods, instructions or products referred to in the content.

