
Effects of Early Lactation Milking Frequency in an Automated Milking System on Cow Performance


Abstract
Simple Summary
Abstract
1. Introduction
2. Materials and Methods
2.1. Animal Housing and Management
2.2. Experimental Design
2.3. Sample Collection
2.4. Sample Analysis
2.5. Milk Production, AMS Raw Data, and Biometrics
2.6. Data Analysis
3. Results
4. Discussion
5. Conclusions
Supplementary Materials
Author Contributions
Funding
Institutional Review Board Statement
Informed Consent Statement
Data Availability Statement
Acknowledgments
Conflicts of Interest
References
- Ivanyos, D.; Monostori, A.; Németh, C.; Fodor, I.; Ózsvári, L. Associations between milking technology, herd size and milk production parameters on commercial dairy cattle farms. Mljekarstvo 2020, 70, 103–111. [Google Scholar] [CrossRef]
- De Koning, K. Automatic Milking—Common Practice on Dairy Farms. In Proceedings of the Second North American Conference on Robotic Milking, Toronto, ON, Canada, 2–5 March 2010; Precision Dairy Operators: Elora, ON, Canada, 2010; pp. V59–V63. Available online: http://precisiondairy.com/proceedings/s3dekoning.pdf (accessed on 16 June 2023).
- Woodward, T.E. The Production of Dairy Cows as Affected by Frequency and Regularity of Milking and Feeding; USDA: Washington, DC, USA, 1931; Cir.: 180.
- Hale, S.; Capuco, A.; Erdman, R. Milk Yield and Mammary Growth Effects Due to Increased Milking Frequency During Early Lactation. J. Dairy Sci. 2003, 86, 2061–2071. [Google Scholar] [CrossRef] [PubMed]
- Dahl, G.; Wallace, R.; Shanks, R.; Lueking, D. Hot Topic: Effects of Frequent Milking in Early Lactation on Milk Yield and Udder Health. J. Dairy Sci. 2004, 87, 882–885. [Google Scholar] [CrossRef]
- Eslamizad, M.; Dehghan-Banadaky, M.; Rezayazdi, K.; Moradi-Shahrbabak, M. Effects of 6 times daily milking during early versus full lactation of Holstein cows on milk production and blood metabolites. J. Dairy Sci. 2010, 93, 4054–4061. [Google Scholar] [CrossRef]
- Hanling, H.H.; McGilliard, M.L.; Corl, B.A. The Enhanced Milk Yield Effect of Early Lactation Increased Milking Frequency and Bovine Somatotropin Is Additive and Not Synergistic. Animals 2023, 13, 2202. [Google Scholar] [CrossRef]
- Stelwagen, K. Effect of Milking Frequency on Mammary Functioning and Shape of the Lactation Curve. J. Dairy Sci. 2001, 84, E204–E211. [Google Scholar] [CrossRef]
- Wall, E.; McFadden, T. Optimal Timing and Duration of Unilateral Frequent Milking During Early Lactation of Dairy Cows. J. Dairy Sci. 2007, 90, 5042–5048. [Google Scholar] [CrossRef] [PubMed]
- Wiking, L.; Nielsen, J.; Båvius, A.-K.; Edvardsson, A.; Svennersten-Sjaunja, K. Impact of Milking Frequencies on the Level of Free Fatty Acids in Milk, Fat Globule Size, and Fatty Acid Composition. J. Dairy Sci. 2006, 89, 1004–1009. [Google Scholar] [CrossRef] [PubMed]
- Weaver, S.; Hernandez, L. Autocrine-paracrine regulation of the mammary gland. J. Dairy Sci. 2016, 99, 842–853. [Google Scholar] [CrossRef]
- Knight, C.H.; Wilde, C.J.; Peaker, M. 1—Manipulation of milk secretion. In Nutrition and Lactation in the Dairy Cow, Butterworth-Heinemann; Garnsworthy, P.C., Ed.; Hannah Research Institute: Ayr, UK, 1988; pp. 3–14. [Google Scholar] [CrossRef]
- VanBaale, M.; Ledwith, D.; Thompson, J.; Burgos, R.; Collier, R.; Baumgard, L. Effect of Increased Milking Frequency in Early Lactation With or Without Recombinant Bovine Somatotropin. J. Dairy Sci. 2005, 88, 3905–3912. [Google Scholar] [CrossRef]
- Shoshani, E.; Cohen, M.; Doekes, J.J. Short- and long-term effects of high milking frequency during the first 21 days of lactation on production and reproductive performance in high-lactating cows. Animal 2017, 11, 91–100. [Google Scholar] [CrossRef]
- Elliott, G.M. The effect on milk yield of three times a day milking and of increasing the level of residual milk. J. Dairy Res. 1961, 28, 209–219. [Google Scholar] [CrossRef]
- Morag, M. Two and Three Times-a-day Milking of Cowss. Acta Agric. Scand. 1973, 23, 256–260. [Google Scholar] [CrossRef]
- Hillerton, J.E.; Knight, C.H.; Turvey, A.; Wheatley, S.D.; Wilde, C.J. Milk yield and mammary function in dairy cows milked four times daily. J. Dairy Res. 1990, 57, 285–294. [Google Scholar] [CrossRef]
- Grummer, R.R. Etlology of Lipid-Related Metabolic Disorders in Periparturient Dairy Cows. J. Dairy Sci. 1993, 76, 3882–3896. [Google Scholar] [CrossRef] [PubMed]
- Grummer, R.R. Impact of changes in organic nutrient metabolism on feeding the transition dairy cow. J. Anim. Sci. 1995, 73, 2820–2833. [Google Scholar] [CrossRef]
- Drackley, J.K. Biology of Dairy Cows During the Transition Period: The Final Frontier? J. Dairy Sci. 1999, 82, 2259–2273. [Google Scholar] [CrossRef] [PubMed]
- White, H.M. The Role of TCA Cycle Anaplerosis in Ketosis and Fatty Liver in Periparturient Dairy Cows. Animals 2015, 5, 793–802. [Google Scholar] [CrossRef]
- McNamara, J. Regulation of Adipose Tissue Metabolism in Support of Lactation. J. Dairy Sci. 1991, 74, 706–719. [Google Scholar] [CrossRef]
- Ingvartsen, K.L. Feeding- and management-related diseases in the transition cow: Physiological adaptations around calving and strategies to reduce feeding-related diseases. Anim. Feed Sci. Technol. 2006, 126, 175–213. [Google Scholar] [CrossRef]
- Van Knegsel, A.T.M.; Hammon, H.M.; Bernabucci, U.; Bertoni, G.; Bruckmaier, R.M.; Goselink, R.M.A.; Gross, J.J.; Kuhla, B.; Metges, C.C.; Parmentier, H.K.; et al. Metabolic adaptation during early lactation: Key to cow health, longevity and a sustainable dairy production chain. In CABI Reviews; CABI International: Wallingford, UK, 2014. [Google Scholar] [CrossRef]
- Pralle, R.S.; Erb, S.J.; Holdorf, H.T.; White, H.M. Greater liver PNPLA3 protein abundance in vivo and in vitro supports lower triglyceride accumulation in dairy cows. Sci. Rep. 2021, 11, 2839. [Google Scholar] [CrossRef] [PubMed]
- McArt, J.A.A.; Nydam, D.v.; Overton, M.W. Hyperketonemia in early lactation dairy cattle: A deterministic estimate of component and total cost per case. J. Dairy Sci. 2015, 98, 2043–2054. [Google Scholar] [CrossRef] [PubMed]
- Wathes, D.C.; Cheng, Z.; Bourne, N.; Taylor, V.J.; Coffey, M.P.; Brotherstone, S. Differences between primiparous and multiparous dairy cows in the inter-relationships between metabolic traits, milk yield and body condition score in the periparturient period. Domest. Anim. Endocrinol. 2007, 33, 203–225. [Google Scholar] [CrossRef]
- Vanholder, T.; Papen, J.; Bemers, R.; Vertenten, G.; Berge, A.C. Risk factors for subclinical and clinical ketosis and asso-ciation with production parameters in dairy cows in the Netherlands. J. Dairy Sci. 2015, 98, 880–888. [Google Scholar] [CrossRef] [PubMed]
- Tatone, E.H.; Duffield, T.F.; LeBlanc, S.J.; DeVries, T.J.; Gordon, J.L. Investigating the within-herd prevalence and risk factors for ketosis in dairy cattle in Ontario as diagnosed by the test-day concentration of β-hydroxybutyrate in milk. J. Dairy Sci. 2017, 100, 1308–1318. [Google Scholar] [CrossRef] [PubMed]
- Prescott, N.; Mottram, T.; Webster, A. Relative motivations of dairy cows to be milked or fed in a Y-maze and an automatic milking system. Appl. Anim. Behav. Sci. 1998, 57, 23–33. [Google Scholar] [CrossRef]
- Madsen, J.; Weisbjerg, M.; Hvelplund, T. Concentrate composition for Automatic Milking Systems—Effect on milking frequency. Livest. Sci. 2010, 127, 45–50. [Google Scholar] [CrossRef]
- Filho, L.M.S.; Lopes, M.A.; Brito, S.C.; Rossi, G.; Conti, L.; Barbari, M.; Projetos, D.G.; Firenze, U.d.S.d. Robotic milking of dairy cows: A review. Semin. Agrar. 2020, 41, 2833–2850. [Google Scholar] [CrossRef]
- 9622:2013; Milk and Liquid Milk Products—Guidelines for the Application of Mid-Infrared Spectrometry. International Organization for Standardization: Geneva, Switzerland, 2013.
- Baldin, M.; Zanton, G.; Harvatine, K. Effect of 2-hydroxy-4-(methylthio)butanoate (HMTBa) on risk of biohydrogenation-induced milk fat depression. J. Dairy Sci. 2018, 101, 376–385. [Google Scholar] [CrossRef]
- Rico, D.E.; Harvatine, K.J. Induction of and recovery from milk fat depression occurs progressively in dairy cows switched between diets that differ in fiber and oil concentration. J. Dairy Sci. 2013, 96, 6621–6630. [Google Scholar] [CrossRef]
- Zanton, G.; Hall, M. Substitution of molasses for corn grain at two levels of degradable protein. II. Effects on ruminal fermentation, digestion, and nitrogen metabolism. J. Dairy Sci. 2022, 105, 3954–3968. [Google Scholar] [CrossRef]
- Weimer, P.J.; Shi, Y.; Odt, C.L. A segmented gas/liquid delivery system for continuous culture of microorganisms on insoluble substrates and its use for growth of Ruminococcus flavefaciens on cellulose. Appl. Microbiol. Biotechnol. 1991, 36, 178–183. [Google Scholar] [CrossRef]
- France, A.; Dufour, S.; Kelton, D.; Barkema, H.; Kurban, D.; DeVries, T. Effect of dry-off management on milking behavior, milk yield, and somatic cell count of dairy cows milked in automated milking systems. J. Dairy Sci. 2022, 105, 3544–3558. [Google Scholar] [CrossRef] [PubMed]
- Pralle, R.S.; Amdall, J.D.; Fourdraine, R.H.; Oetzel, G.R.; White, H.M. Hyperketonemia Predictions Provide an On-Farm Management Tool with Epidemiological Insights. Animals 2021, 11, 1291. [Google Scholar] [CrossRef] [PubMed]
- Tyrrell, H.F.; Reid, J.T. Prediction of the Energy Value of Cow’s Milk. J. Dairy Sci. 1965, 48, 1215–1223. [Google Scholar] [CrossRef]
- Gaines, W.L.; Davidson, F.A. Relation between Percentage Fat Content and Yield of Milk. Correction of Milk Yield for Fat Content; Bulletin; University of Illinois Agricultural Experiment Station: Savoy, IL, USA, 1923; No. 245; Available online: https://hdl.handle.net/2142/3304 (accessed on 20 June 2023).
- National Research Council. Nutrient Requirements of Dairy Cattle, 7th ed.; National Academies Press: Washington, DC, USA, 2001; p. 138. ISBN 978-0-309-06997-7. [Google Scholar] [CrossRef]
- Soberon, F.; Ryan, C.; Nydam, D.; Galton, D.; Overton, T. The effects of increased milking frequency during early lactation on milk yield and milk composition on commercial dairy farms. J. Dairy Sci. 2011, 94, 4398–4405. [Google Scholar] [CrossRef] [PubMed]
- Perez-Hernandez, G.; Hanling, H.; Schramm, H.; Lengi, A.; Corl, B. Milk production and anatomical udder capacity changes of udder halves subjected to increased milking frequency at two stages of lactation. J. Dairy Sci. 2023, 106, 9855–9867. [Google Scholar] [CrossRef]
- Wall, E.H.; McFadden, T.B. Use it or lose it: Enhancing milk production efficiency by frequent milking of dairy cows. J. Anim. Sci. 2008, 86, 27–36. [Google Scholar] [CrossRef]
- Fernandez, J.; Ryan, C.M.; Galton, D.M.; Overton, T.R. Effects of milking frequency during early lactation on per-formance and health of dairy cows. J. Dairy Sci. 2004, 82 (Suppl. S1), 424. [Google Scholar]
- Copeland, L. Milk and Butterfat Yields of Jersey Cows as Affected by Frequency of Milking. J. Dairy Sci. 1934, 17, 815–821. [Google Scholar] [CrossRef]
- Allen, D.B.; DePeters, E.; Laben, R. Three Times a Day Milking: Effects on Milk Production, Reproductive Efficiency, and Udder Health. J. Dairy Sci. 1986, 69, 1441–1446. [Google Scholar] [CrossRef] [PubMed]
- DePeters, E.; Smith, N.; Acedo-Rico, J. Three or Two Times Daily Milking of Older Cows, and First Lactation Cows for Entire Lactations. J. Dairy Sci. 1985, 68, 123–132. [Google Scholar] [CrossRef] [PubMed]
- Jacobs, J.A.; Siegford, J.M. Invited review: The impact of automatic milking systems on dairy cow management, behavior, health, and welfare. J. Dairy Sci. 2012, 95, 2227–2247. [Google Scholar] [CrossRef] [PubMed]
- Buggiotti, L.; Cheng, Z.; Salavati, M.; Wathes, C.D. Comparison of the transcriptome in circulating leukocytes in early lactation between primiparous and multiparous cows provides evidence for age-related changes. BMC Genom. 2021, 22, 693. [Google Scholar] [CrossRef] [PubMed]
- Schutz, M.; Hansen, L.; Steuernagel, G.; Kuck, A. Variation of Milk, Fat, Protein, and Somatic Cells for Dairy Cattle. J. Dairy Sci. 1990, 73, 484–493. [Google Scholar] [CrossRef]
- Hanling, H.; McGilliard, M.; Corl, B. Uneven milking intervals are adequate to achieve the benefits of increased milking frequency in early lactation. J. Dairy Sci. 2021, 104, 9355–9361. [Google Scholar] [CrossRef] [PubMed]
- Adewuyi, A.; Gruys, E.; van Eerdenburg, F. Non esterified fatty acids (NEFA) in dairy cattle. A review. Vet. Q. 2005, 27, 117–126. [Google Scholar] [CrossRef] [PubMed]
- Bauman, D.E.; Davis, C.L. Biosynthesis of milk fat. In Lactation: A Comprehensive Treatise; Larson, B.L., Smith, V.R., Eds.; Academic Press: New York, NY, USA, 1974; pp. 31–75. [Google Scholar]
- Palmquist, D.; Beaulieu, A.D.; Barbano, D. Feed and Animal Factors Influencing Milk Fat Composition. J. Dairy Sci. 1993, 76, 1753–1771. [Google Scholar] [CrossRef] [PubMed]
- Miller, N.; Delbecchi, L.; Petitclerc, D.; Wagner, G.; Talbot, B.; Lacasse, P. Effect of Stage of Lactation and Parity on Mammary Gland Cell Renewal. J. Dairy Sci. 2006, 89, 4669–4677. [Google Scholar] [CrossRef]
- Nichols, K.; Bannink, A.; van Baal, J.; Dijkstra, J. Impact of post-ruminally infused macronutrients on bovine mammary gland expression of genes involved in fatty acid synthesis, energy metabolism, and protein synthesis measured in RNA isolated from milk fat. J. Anim. Sci. Biotechnol. 2020, 11, 53. [Google Scholar] [CrossRef]
- Mele, M.; Macciotta, N.; Cecchinato, A.; Conte, G.; Schiavon, S.; Bittante, G. Multivariate factor analysis of detailed milk fatty acid profile: Effects of dairy system, feeding, herd, parity, and stage of lactation. J. Dairy Sci. 2016, 99, 9820–9833. [Google Scholar] [CrossRef]
- Keeney, M.; Katz, I.; Allison, M.J. On the probable origin of some milk fat acids in rumen microbial lipids. J. Am. Oil Chem. Soc. 1962, 39, 198–201. [Google Scholar] [CrossRef]
- Craninx, M.; Steen, A.; Van Laar, H.; Van Nespen, T.; Martín-Tereso, J.; de Baets, B.; Fievez, V. Effect of Lactation Stage on the Odd- and Branched-Chain Milk Fatty Acids of Dairy Cattle Under Grazing and Indoor Conditions. J. Dairy Sci. 2008, 91, 2662–2677. [Google Scholar] [CrossRef]
- Sun, L.; Liu, L.; Brenna, J.; Wu, Z.; Ma, L.; Bu, D. Odd- and branched-chain fatty acids in milk fat from Holstein dairy cows are influenced by physiological factors. Animal 2022, 16, 100545. [Google Scholar] [CrossRef] [PubMed]
- Monteiro, H.F.; Zhou, Z.; Gomes, M.S.; Peixoto, P.M.G.; Bonsaglia, E.C.R.; Canisso, I.F.; Weimer, B.C.; Lima, F.S. Rumen and lower gut microbiomes relationship with feed efficiency and production traits throughout the lactation of Holstein dairy cows. Sci. Rep. 2022, 12, 4904. [Google Scholar] [CrossRef] [PubMed]
- Baumgard, L.; Collier, R.; Bauman, D. A 100-Year Review: Regulation of nutrient partitioning to support lactation. J. Dairy Sci. 2017, 100, 10353–10366. [Google Scholar] [CrossRef] [PubMed]
- McNamara, S.; Murphy, J.; O’Mara, F.; Rath, M.; Mee, J. Effect of milking frequency in early lactation on energy metabolism, milk production and reproductive performance of dairy cows. Livest. Sci. 2008, 117, 70–78. [Google Scholar] [CrossRef]
- Andjelić, B.; Djoković, R.; Cincović, M.; Bogosavljević-Bošković, S.; Petrović, M.; Mladenović, J.; Čukić, A. Relationships between Milk and Blood Biochemical Parameters and Metabolic Status in Dairy Cows during Lactation. Metabolites 2022, 12, 733. [Google Scholar] [CrossRef] [PubMed]
- Stojević, Z.; Piršljin, J.; Milinković-Tur, S.; Zdelar-Tuk, M.; Beer Ljubić, B. Activities of AST, ALT and GGT in clinically healthy dairy cows during lactation and in the dry period. Veterinarski Arh. 2005, 75, 67–73. [Google Scholar]
- Djoković, R.; Šamanc, H.; Jovanović, M.; Fratrić, N.; Dosković, V.; Stanimirović, Z. Relationship among Blood Indicators of Hepatic Function and Lipid Content in the Liver during Transitional Period in High-Yielding Dairy Cows. Acta Sci. Vet. 2013, 41. Available online: https://www.redalyc.org/pdf/2890/289031817034.pdf (accessed on 17 July 2023).
- Hadizadeh, F.; Faghihimani, E.; Adibi, P. Nonalcoholic fatty liver disease: Diagnostic biomarkers. World J. Gastrointest. Pathophysiol. 2017, 8, 11–26. [Google Scholar] [CrossRef]
- Pralle, R.S.; Holdorf, H.T.; Oliveira, R.C.; Seely, C.R.; Kendall, S.J.; White, H.M. Prediction of Liver Triglyceride Content in Early Lactation Multiparous Holstein Cows Using Blood Metabolite, Mineral, and Protein Biomarker Concentrations. Animals 2022, 12, 2556. [Google Scholar] [CrossRef]
- Sutton, J.D.; Hart, I.C.; Brosters, W.H.; Elliott, R.J.; Schuller, E. Feeding Frequency for Lactating Cows: Effects on Rumen Fermentation and Blood Metabolites and Hormones. Br. J. Nutr. 1986, 56, 181–192. [Google Scholar] [CrossRef] [PubMed]
- Pennington, R.J. The metabolism of short-chain fatty acids in the sheep. 1. Fatty acid utilization and ketone body production by rumen epithelium and other tissues. Biochem. J. 1952, 51, 251–258. [Google Scholar] [CrossRef] [PubMed]
- Weigand, E.; Young, J.W.; McGilliard, A.D. Extent of butyrate metabolism by bovine ruminoreticulum epithelium and the relationship to absorption rate. J. Dairy Sci. 1972, 55, 589–597. [Google Scholar] [CrossRef]
- Menahan, L.; Schultz, L. Effect of Leucine and Valine on Ketogenesis in the Ruminant. J. Dairy Sci. 1964, 47, 1086–1091. [Google Scholar] [CrossRef]
- Kristensen, N.B.; Harmon, D.L. Splanchnic metabolism of volatile fatty acids absorbed from the washed reticulorumen of steers. J. Anim. Sci. 2004, 82, 2033–2042. [Google Scholar] [CrossRef] [PubMed]
- Rodenburg, J. Designing feeding systems for robotic milking. In Proceedings of the Tri-State Nutrition Conference, Fort Wayne, IN, USA, 19–20 April 2011; Ohio State University: Columbus, OH, USA, 2011; pp. 127–138. [Google Scholar]
- Antanaitis, R.; Juozaitienė, V.; Malašauskienė, D.; Televičius, M.; Urbutis, M. Biomarkers from automatic milking system as an indicator of subclinical acidosis and subclinical ketosis in fresh dairy cows. Pol. J. Veter Sci. 2019, 22, 685–693. [Google Scholar] [CrossRef] [PubMed]
- Bach, A.; Iglesias, C.; Calsamiglia, S.; Devant, M. Effect of amount of concentrate offered in automatic milking sys-tems on milking frequency, feeding behavior, and milk production of dairy cattle consuming high amounts of corn silage. J. Dairy Sci. 2007, 90, 5049–5055. [Google Scholar] [CrossRef] [PubMed]
- Hare, K.; DeVries, T.; Schwartkopf-Genswein, K.; Penner, G. Does the location of concentrate provision affect voluntary visits, and milk and milk component yield for cows in an automated milking system? Can. J. Anim. Sci. 2018, 98, 399–404. [Google Scholar] [CrossRef]
- Penner, G.; Haisan, J.; Paddick, K.; DeVries, T. Feeding Management for Cows in Automated Milking Systems: What We Know and What We Still Need to Learn. WCDS Adv. Dairy Technol. 2019, 31, 125–140. [Google Scholar]
- Menajovsky, S.B.; Walpole, C.E.; DeVries, T.J.; Schwartzkopf-Genswein, K.S.; Walpole, M.E.; Penner, G.B. The effect of the forage-to-concentrate ratio of the partial mixed ration (PMR) and the quantity of concentrate in an automatic milking system (AMS) for lactating Holstein cows. J. Dairy Sci. 2018, 101, 9941–9953. [Google Scholar] [CrossRef]
- Wenzel, C.; Nitzschke, A. Study on the incidence of ketosis in dairy cows in an automatic milking system versus a conventional milking system. In Automatic Milking—A Better Understanding; Meijering, A., Hogeveen, H., de Koning, C.J.A.M., Eds.; Wageningen Academic Publishers: Wageningen, Ethiopia, 2004; pp. 184–185. [Google Scholar]
- Abeni, F.; Calamari, L.; Calza, F.; Speroni, M.; Bertoni, G.; Pirlo, G. Welfare assessment based on metabolic and endocrine aspects in primiparous cows milked in a parlor or with an automatic milking system. J. Dairy Sci. 2005, 88, 3542–3552. [Google Scholar] [CrossRef] [PubMed]
- Abeni, F.; Terzano, M.; Speroni, M.; Migliorati, L.; Capelletti, M.; Calza, F.; Bianchi, L.; Pirlo, G. Evaluation of milk enzymes and electrolytes, plasma metabolites, and oxidative status in twin cows milked in an automatic milking system or twice daily in a conventional milking parlor. J. Dairy Sci. 2008, 91, 3372–3384. [Google Scholar] [CrossRef] [PubMed]


| Diet Variables | Inclusion, % DM |
|---|---|
| Feed Ingredients | |
| Corn silage | 33.7 |
| Alfalfa silage | 11.5 |
| Baleage | 12.7 |
| Concentrate 2 | 15.4 |
| Corn, ground | 14.3 |
| MS pellet 3 | 11.8 |
| Mineral 4 | 0.5 |
| Analysis 5 | |
| DM | 50.3 |
| CP | 16.41 |
| aNDFom | 27 |
| NFC | 43.76 |
| WSC | 3.41 |
| Starch | 31.77 |
| EE | 3.8 |
| Ash | 9.03 |
| NEL3×, Mcal/kg DM | 1.72 |
| Treatments | p-Values 2 | |||||||||
|---|---|---|---|---|---|---|---|---|---|---|
| 3X | 6X | TRT | TRT × LG | TRT × DIM | LG × DIM | TRT × LG × DIM | ||||
| Variables 3 | Phase | LSM | VAR | LSM | VAR | |||||
| Parity | 2.31 | 0.26 | 2.37 | 0.26 | 0.85 | - | - | - | - | |
| MPD | ||||||||||
| EXP | 3.10 | 0.14 | 4.96 | 0.19 | <0.01 | 0.75 | 0.99 | 0.99 | - | |
| CO | 3.65 | 0.23 | 3.59 | 0.23 | 0.82 | 0.43 | 1 | 1 | - | |
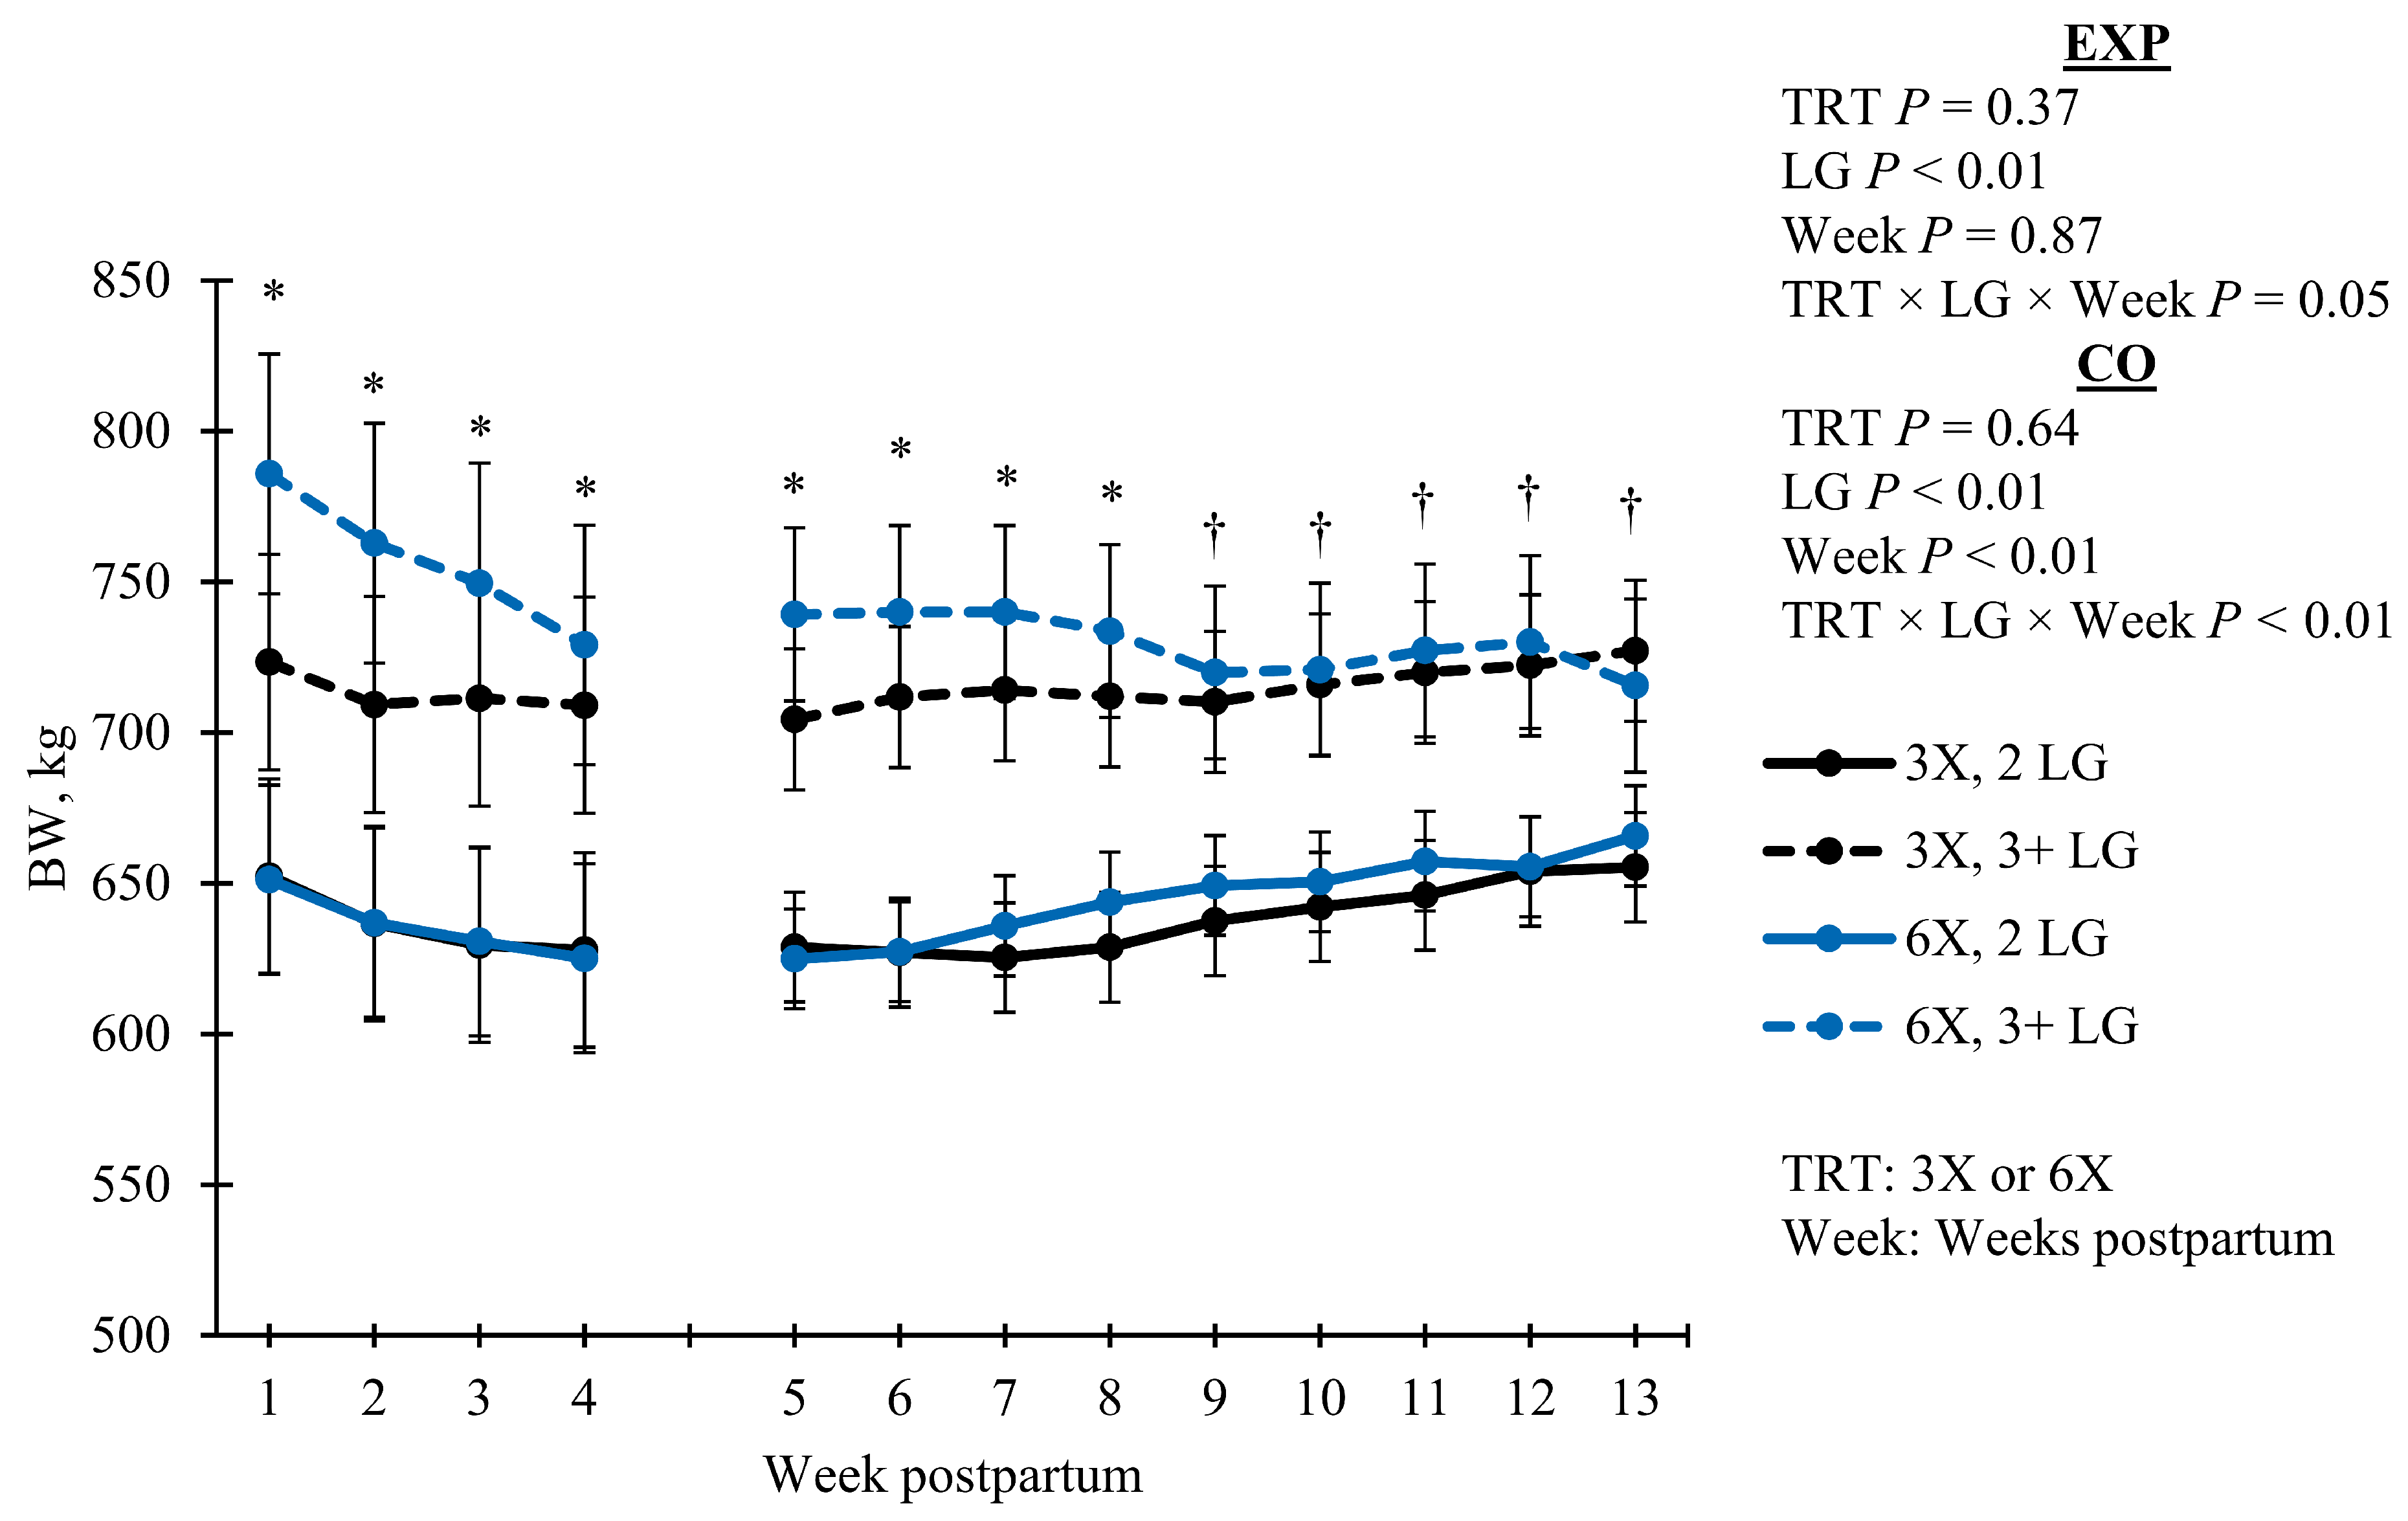
| BW, kg | ||||||||||
| EXP | 675.46 | 17.48 | 697.91 | 19.55 | 0.37 | 0.35 | 0.03 | 0.57 | 0.05 | |
| CO | 676.82 | 14.77 | 687.60 | 16.51 | 0.64 | 0.88 | <0.01 | <0.01 | <0.01 | |
| BW Change, kg | ||||||||||
| EXP | −16.68 | 11.10 | −79.39 | 67.79 | 0.83 | 0.43 | - | - | - | |
| CO | 24.66 | 14.82 | −45.37 | 35.34 | 0.11 | 0.30 | - | - | - | |
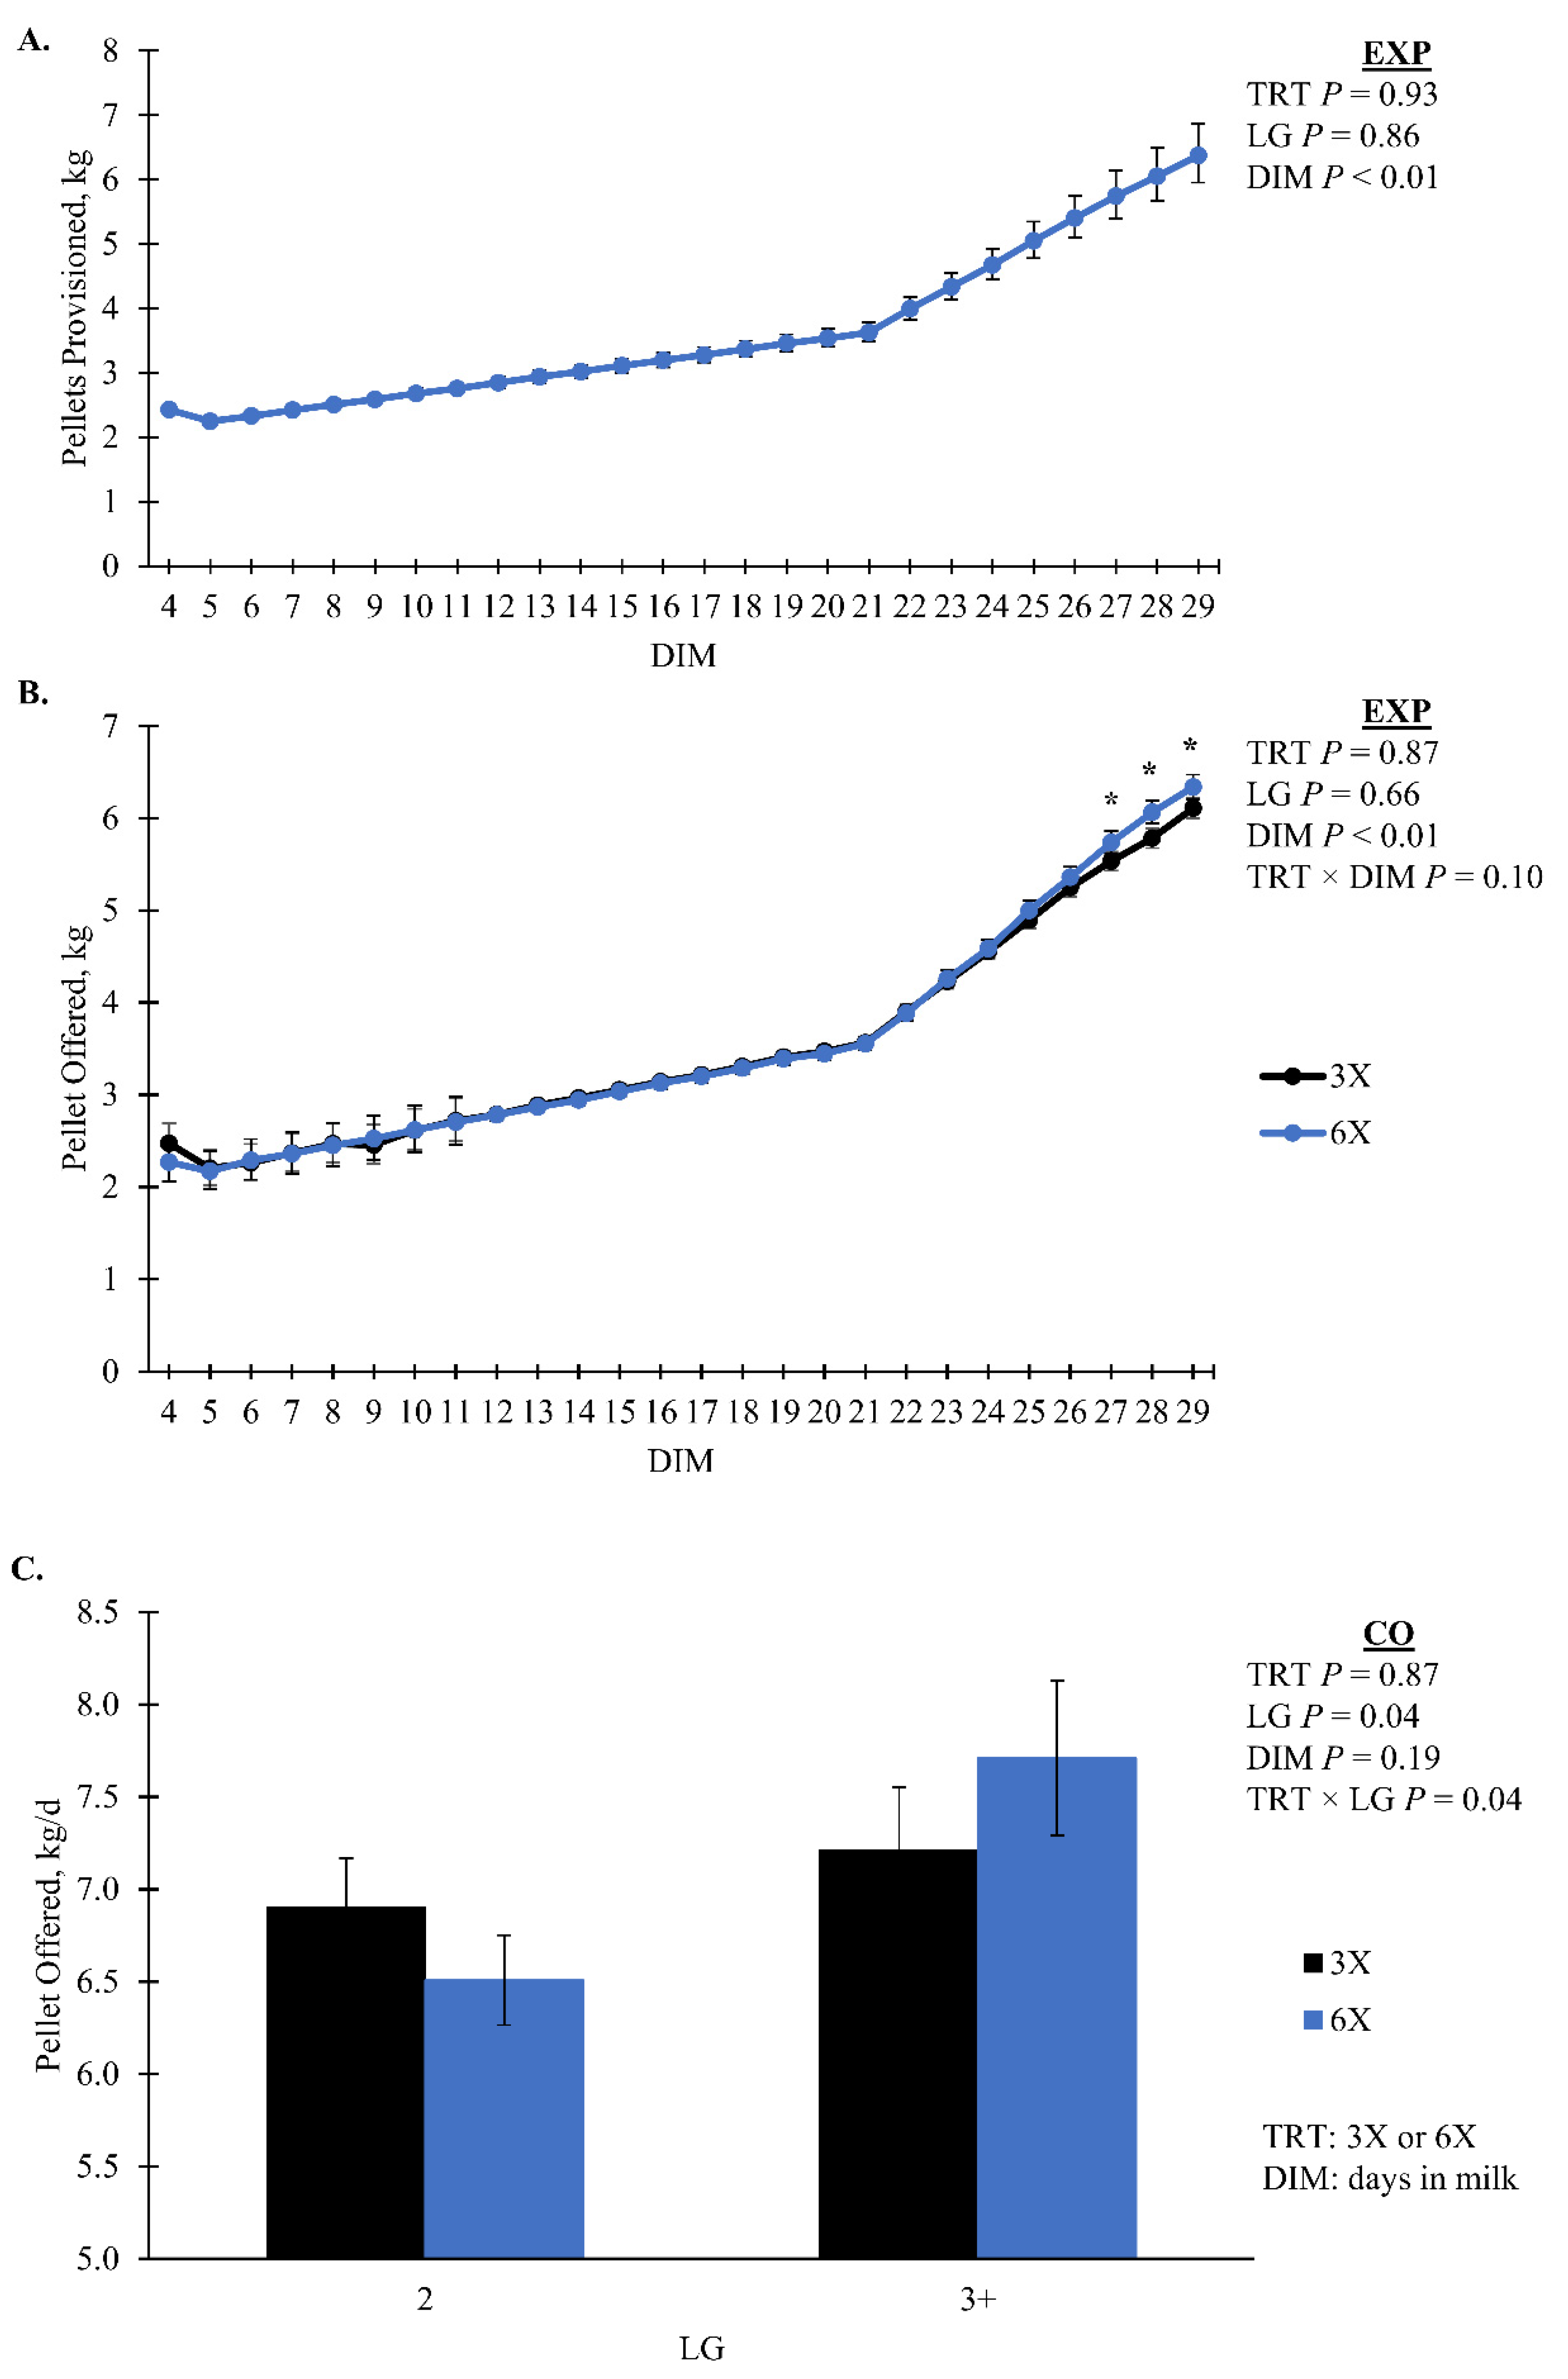
| Pellet Provisioned, kg/d | ||||||||||
| EXP | 3.29 | [3.25, 3.32] | 3.29 | [3.25, 3.34] | 0.93 | 0.36 | 1 | 1 | - | |
| CO | 7.16 | [6.78, 7.55] | 7.36 | [6.94, 7.81] | 0.46 | 0.03 | 0.37 | 0.95 | - | |
| Residual Pellet, kg/d | ||||||||||
| EXP | 0.06 | [0.06, 0.07] | 0.08 | [0.07, 0.09] | <0.01 | 0.84 | 0.32 | 0.54 | 0.23 | |
| CO | 0.14 | 0.11 | 0.32 | 0.11 | 0.20 | 0.35 | 0.04 | <0.01 | - | |
| Pellet Offered, kg/d | ||||||||||
| EXP | 3.36 | [3.32, 3.40] | 3.37 | [3.17, 3.41] | 0.87 | 0.42 | 0.10 | 0.84 | 0.98 | |
| CO | 7.06 | 0.22 | 7.11 | 0.24 | 0.87 | 0.04 | 0.27 | 0.06 | - | |
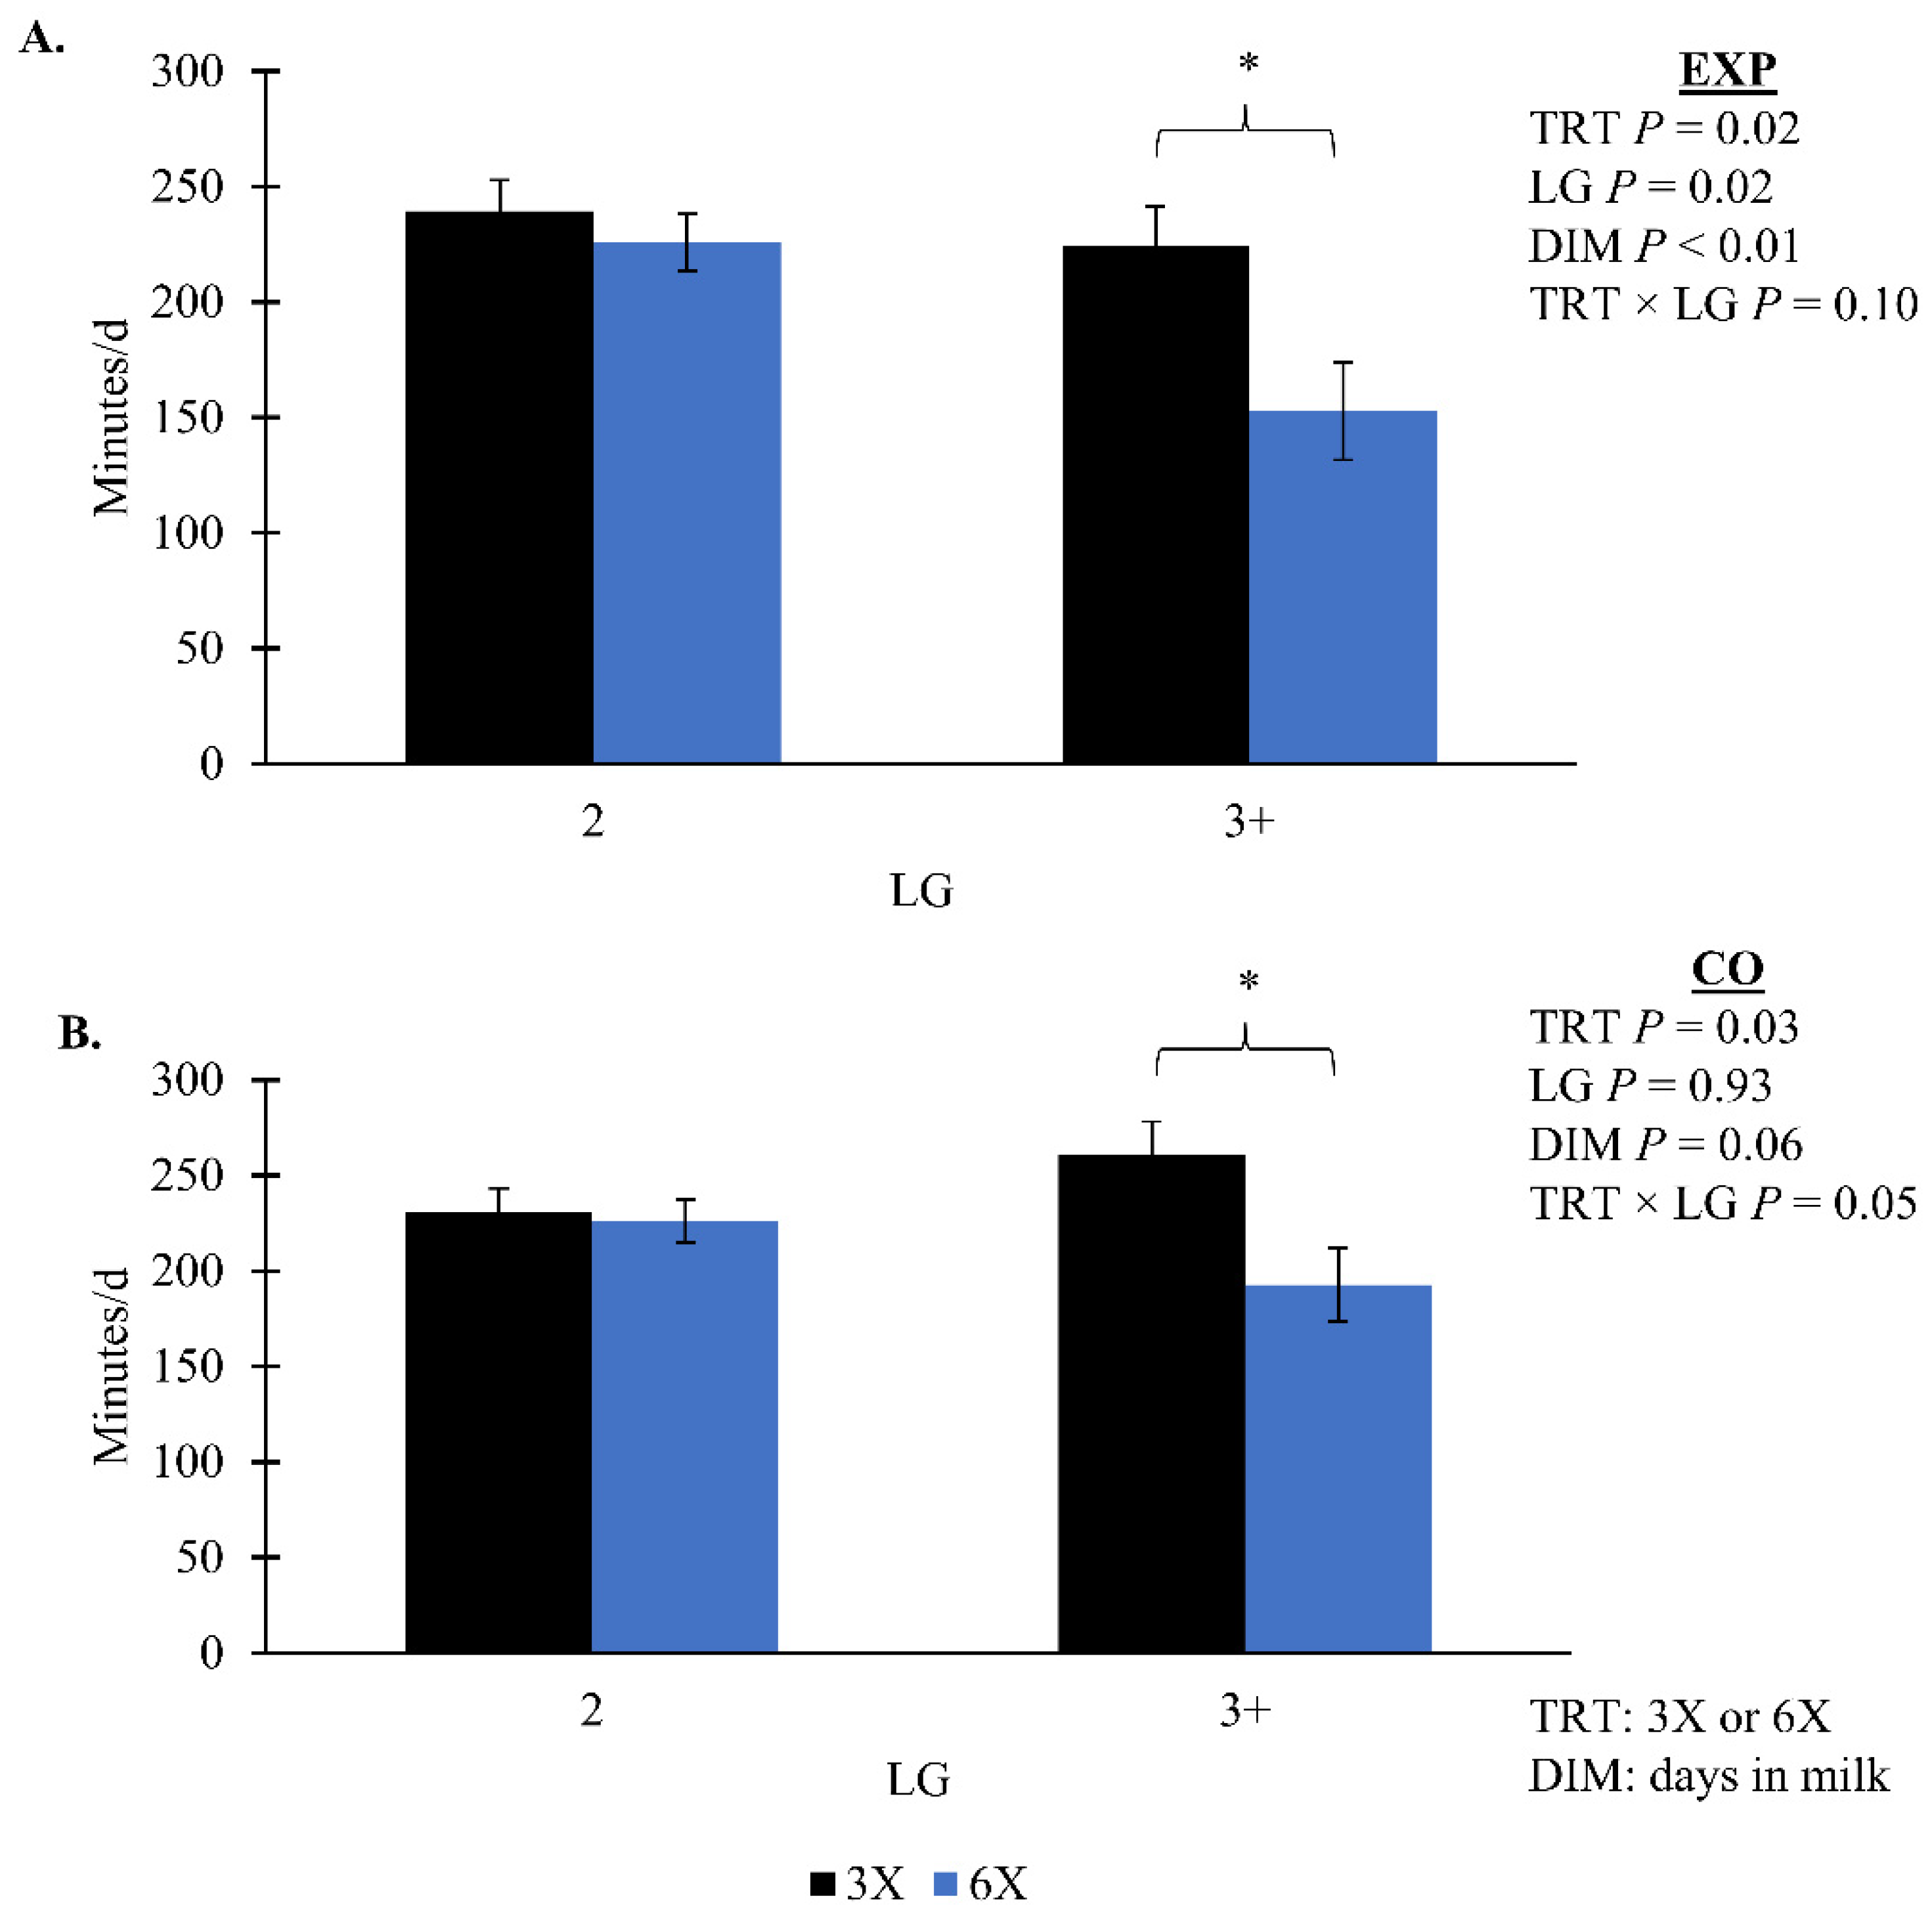
| Total Eating Minutes, min/d | ||||||||||
| EXP | 231.78 | 10.95 | 189.33 | 12.25 | 0.02 | 0.10 | 0.81 | 0.67 | 0.27 | |
| CO | 245.84 | 10.38 | 209.38 | 11.10 | 0.03 | 0.05 | 0.91 | 0.25 | 0.15 | |
| Concentrate, kg/45 kg milk | ||||||||||
| EXP | 3.30 | [3.12, 3.51] | 3.29 | [3.06, 3.55] | 0.92 | 0.59 | 0.33 | 0.17 | 0.66 | |
| CO | 3.59 | 0.10 | 3.48 | 0.13 | 0.74 | 0.35 | 0.22 | 0.95 | - | |
| Concentrate kg/45 kg ECM | ||||||||||
| EXP | 0.07 | 0.01 | 0.07 | 0.01 | 0.55 | 0.35 | 0.85 | 0.10 | - | |
| Rumination Minutes, min/d | ||||||||||
| EXP | 5633.20 | [5244.66, 5996.61] | 5873.08 | [5499.27, 6224.48] | 0.29 | 0.60 | 0.70 | 0.93 | 0.12 | |
| CO | 56,950.50 | [54,439.10, 59,257.90] | 59,690.80 | [57,141.30, 62,039.30] | 0.11 | 0.60 | 0.18 | 0.02 | - | |
| Treatment | p-Value 2 | ||||||||
|---|---|---|---|---|---|---|---|---|---|
| 3X | 6X | TRT | TRT × LG | TRT × DIM | LG × DIM | TRT × LG × DIM | |||
| Variables 3 | LSM | VAR | LSM | VAR | |||||
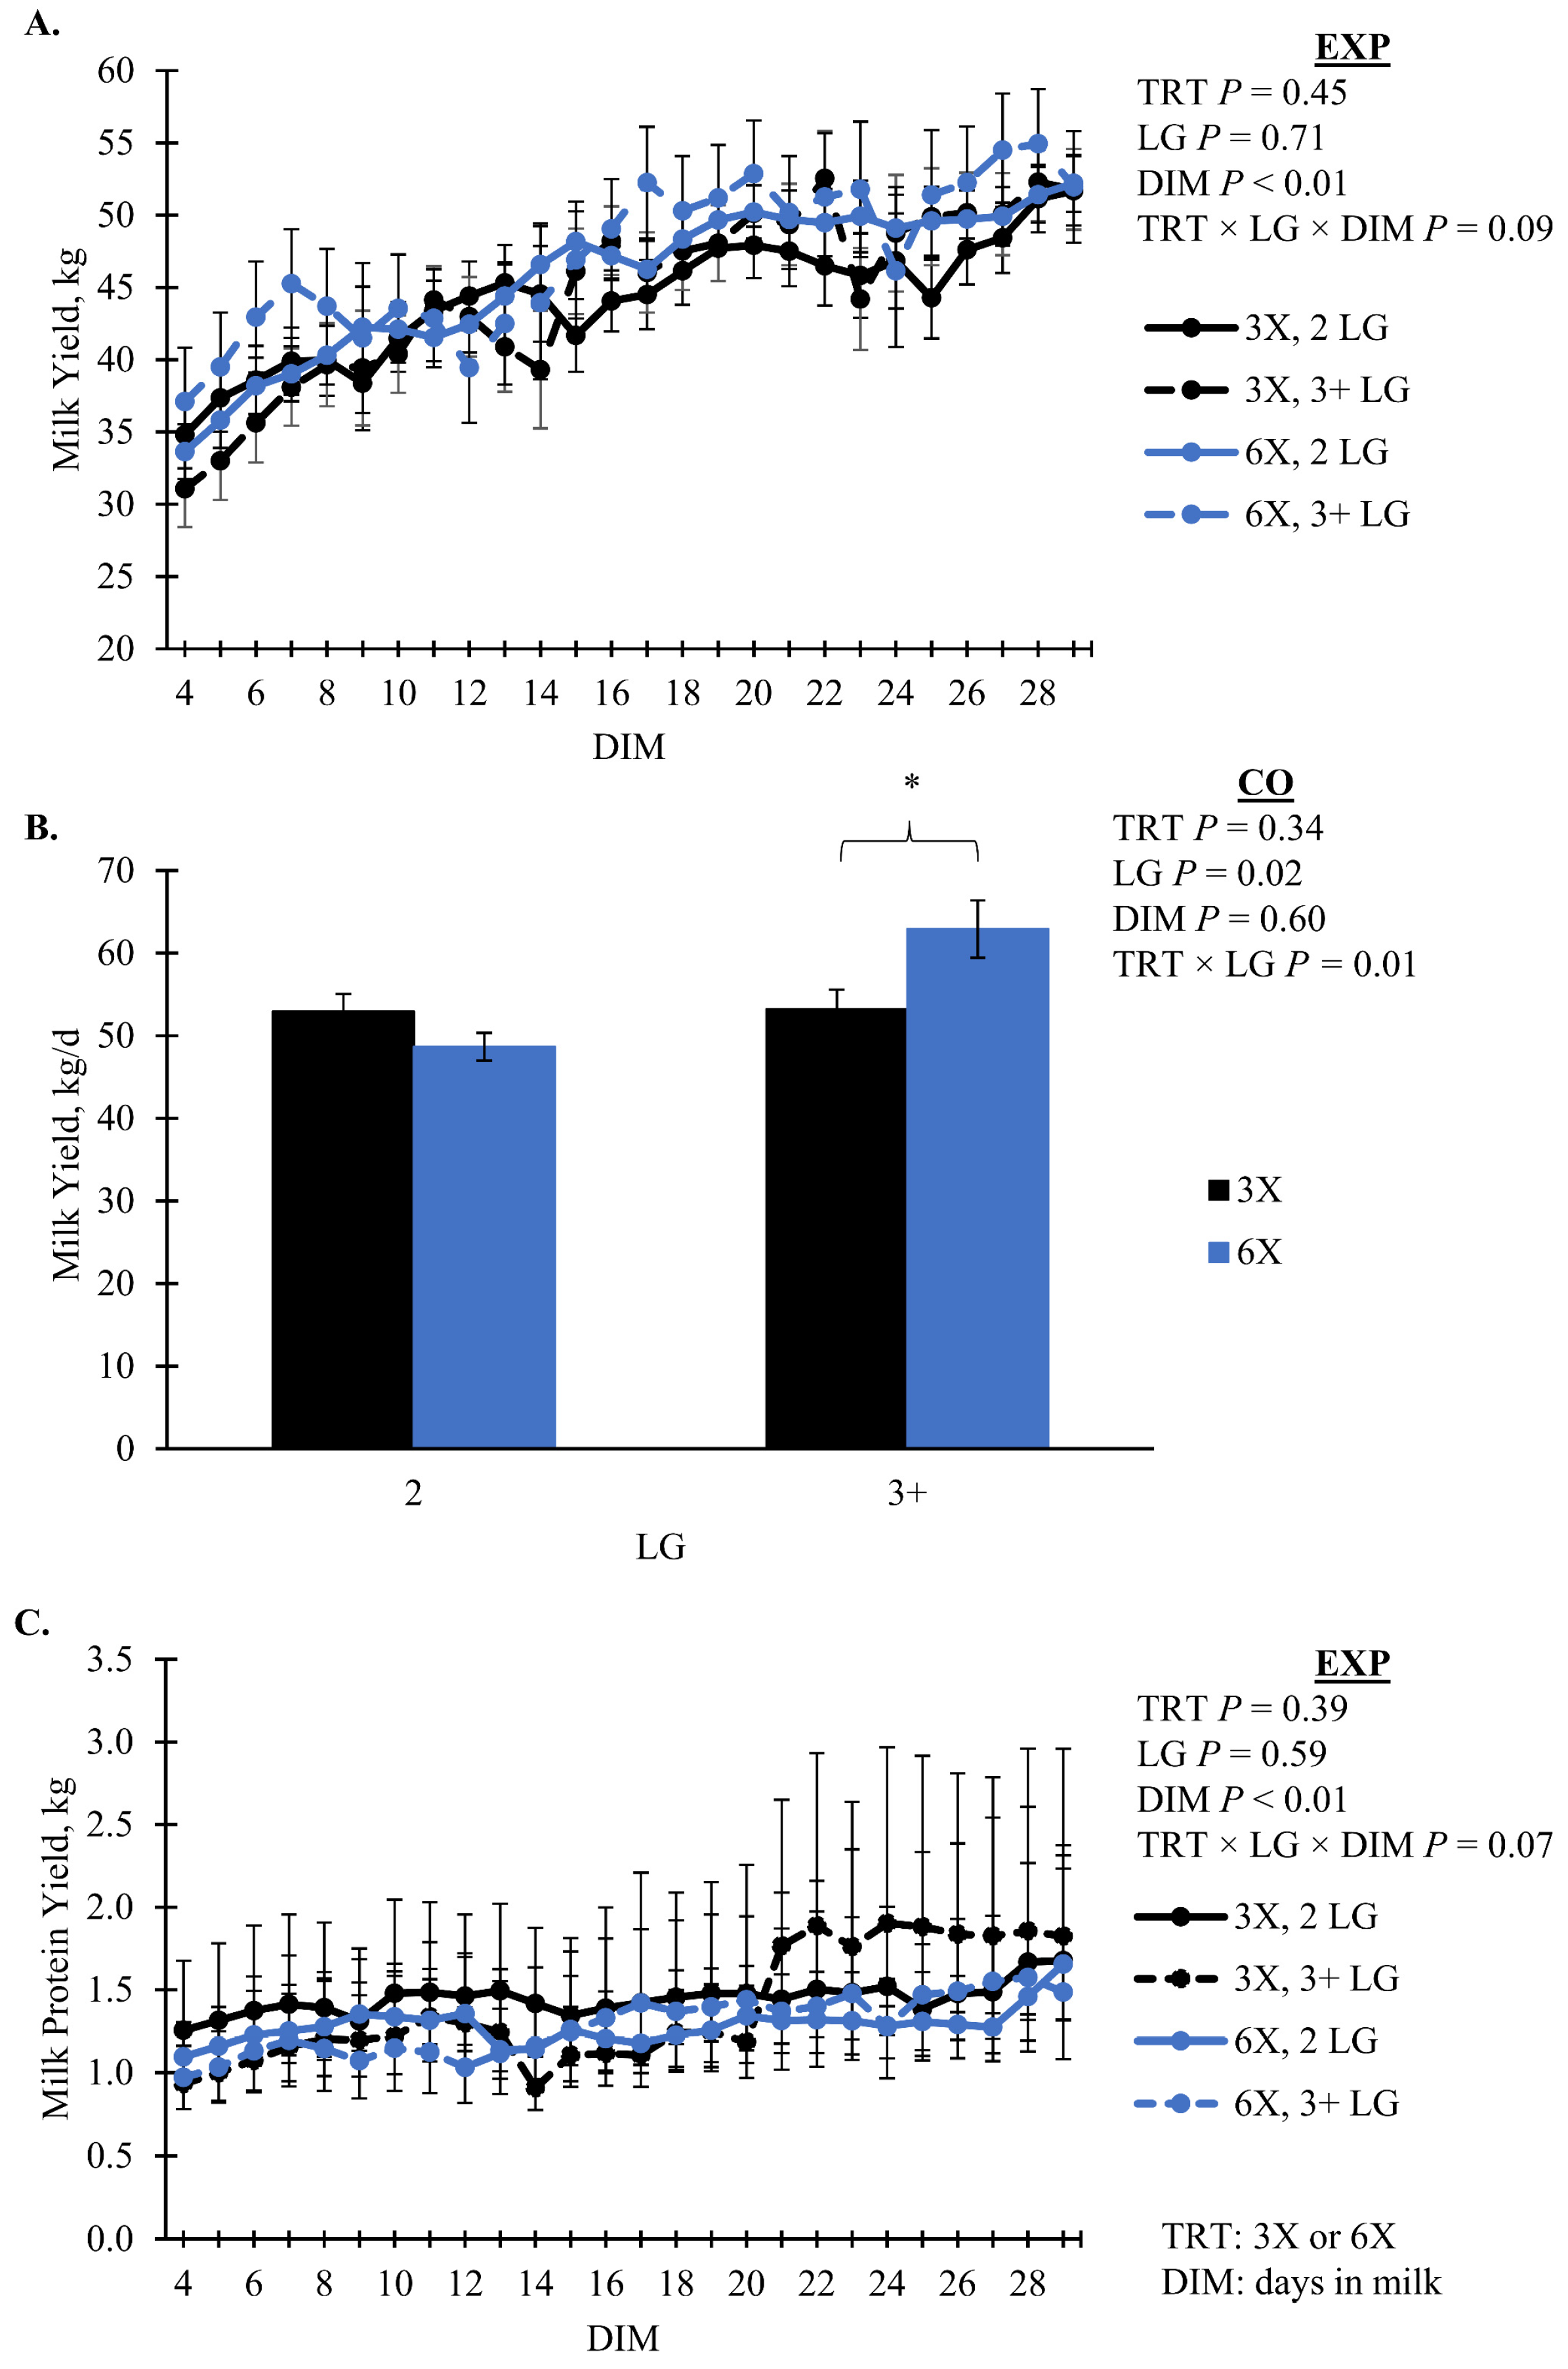
| Milk Yield, kg/d | |||||||||
| EXP | 44.41 | 1.54 | 46.47 | 1.94 | 0.45 | 0.79 | 0.02 | 0.28 | 0.09 |
| CO | 53.08 | 1.57 | 55.78 | 1.98 | 0.34 | 0.01 | 0.80 | 0.68 | - |
| Milk Components | |||||||||
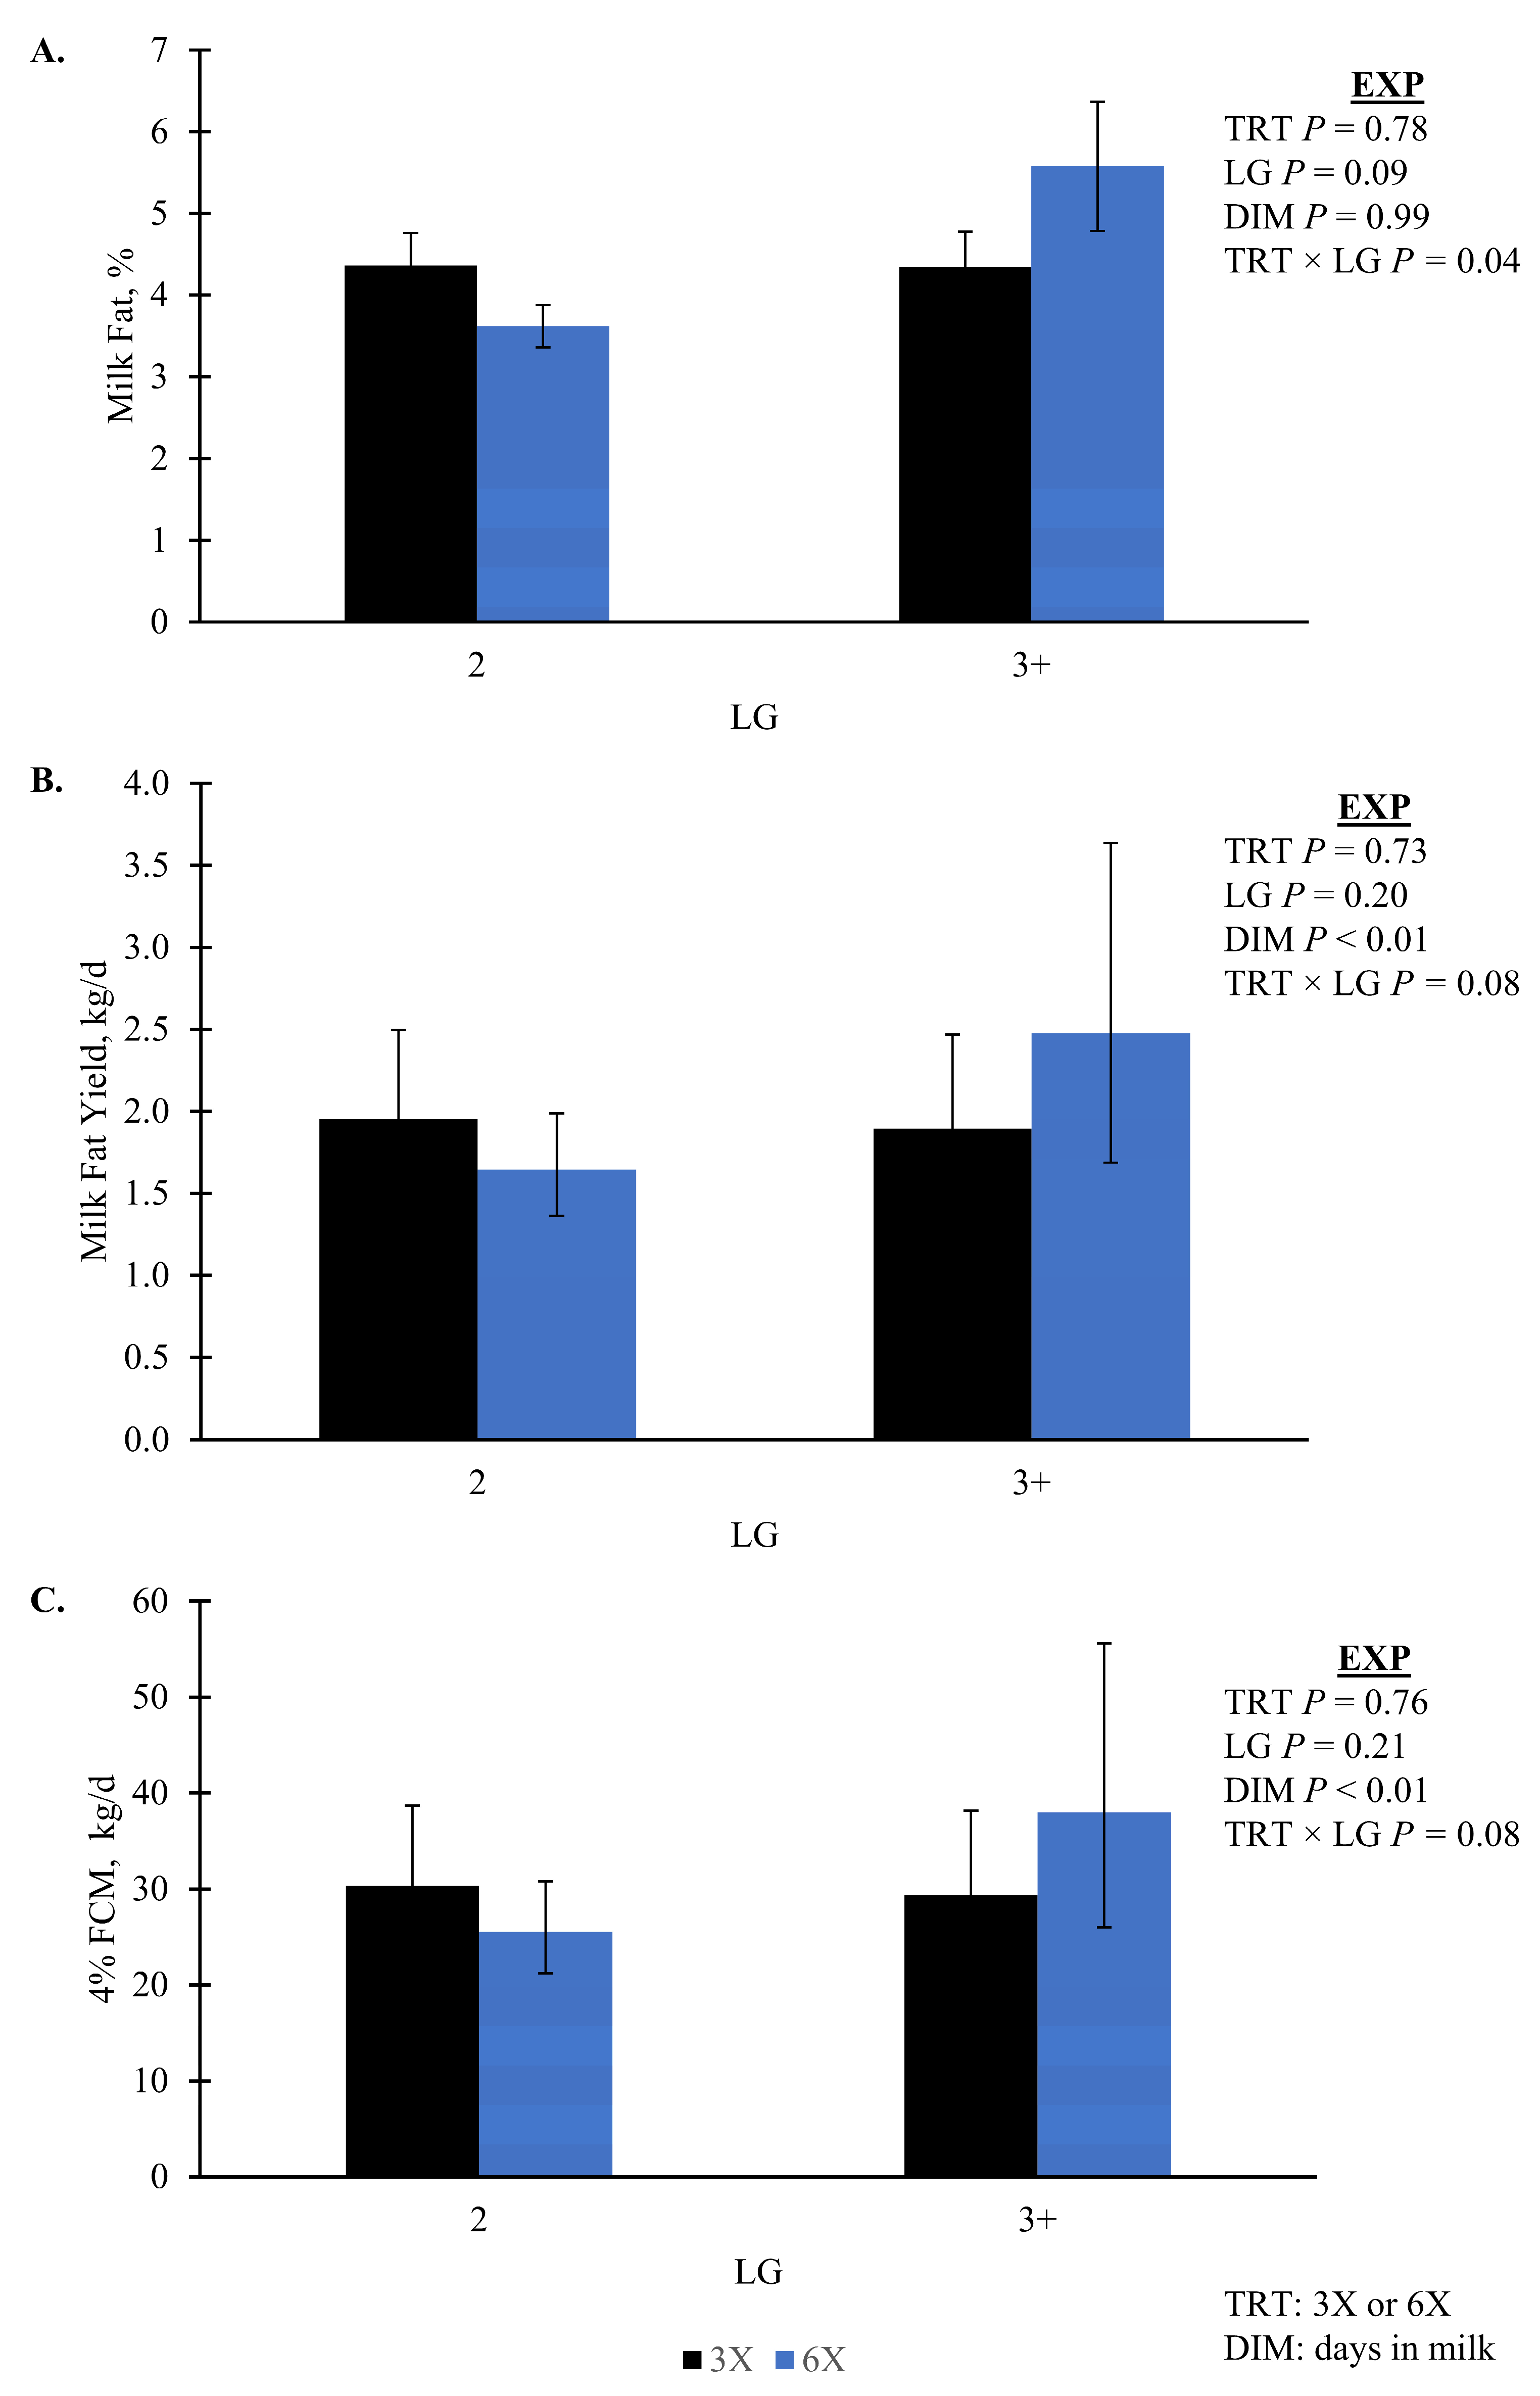
| Fat, kg/d | 1.08 | [1.61, 2.30] | 1.10 | [1.62, 2.51] | 0.73 | 0.08 | 0.82 | 0.91 | - |
| Protein, kg/d | 1.37 | [1.22, 1.57] | 1.27 | [1.12, 1.47] | 0.39 | 0.60 | 0.24 | 0.26 | 0.07 |
| Lactose, kg/d | 1.99 | [1.76, 2.27] | 1.92 | [1.66, 2.25] | 0.72 | 0.46 | 0.83 | 0.07 | - |
| Fat, % | 4.4 | 0.29 | 4.5 | 0.37 | 0.78 | 0.04 | 0.99 | 0.53 | - |
| Protein, % | 3.20 | 0.14 | 2.86 | 0.16 | 0.37 | 0.87 | 0.41 | <0.01 | - |
| Lactose, % | 4.67 | 0.20 | 4.28 | 0.23 | 0.45 | 0.62 | 0.75 | 0.13 | - |
| SNF, % | 9.03 | 0.38 | 8.13 | 0.42 | 0.18 | 0.52 | 0.61 | 0.04 | - |
| MUN, mg/dL | 10.84 | 2.80 | 10.28 | 3.28 | 0.92 | 0.94 | 1 | 1 | - |
| Calculated milk energy | |||||||||
| ECM, kg/d | 49.59 | [43.51, 56.51] | 50.91 | [43.39, 59.73] | 0.80 | 0.19 | 0.60 | 0.59 | - |
| 4% FCM, kg/d | 29.85 | [25.03. 35.03] | 31.16 | [25.13, 38.64] | 0.76 | 0.08 | 0.80 | 0.90 | - |
| Milk Energy, Mcal/d | 0.79 | [0.70, 0.89] | 0.74 | [0.64, 0.86] | 0.54 | 0.19 | 0.88 | 0.71 | - |
| Treatment | p-Value 2 | |||||||||
|---|---|---|---|---|---|---|---|---|---|---|
| 3X | 6X | TRT | LG | DIM | TRT × LG | LG × DIM | ||||
| Variables | Lactation Group | LSM | VAR | LSM | VAR | |||||
| C4:0 | 2 | 3.31 | 0.07 | 3.20 | 0.06 | 0.70 | 0.69 | 0.03 | 0.22 | 0.80 |
| 3+ | 3.08 | 0.14 | 3.30 | 0.23 | ||||||
| C6:0 | 2 | 2.00 | 0.06 | 1.97 | 0.06 | 0.07 | 0.51 | 0.11 | 0.07 | 0.81 |
| 3+ | 2.14 | 0.13 | 1.63 | 0.22 | ||||||
| C8:0 | 2 | 1.09 | 0.05 | 1.09 | 0.05 | 0.01 | 0.31 | 0.02 | 0.01 | 0.65 |
| 3+ | 1.27 | 0.10 | 0.67 | 0.17 | ||||||
| C10:0 | 2 | 1.98 | 0.11 | 2.06 | 0.10 | <0.01 | 0.30 | <0.01 | <0.01 | 0.60 |
| 3+ | 2.57 | 0.23 | 0.89 | 0.39 | ||||||
| C11:0 | 2 | 0.15 | 0.01 | 0.17 | 0.01 | 0.03 | 0.30 | <0.01 | <0.01 | 0.80 |
| 3+ | 0.20 | 0.03 | 0.05 | 0.05 | ||||||
| C12:0 | 2 | 2.05 | 0.11 | 2.14 | 0.10 | <0.01 | 0.23 | <0.01 | <0.01 | 0.12 |
| 3+ | 2.74 | 0.24 | 0.78 | 0.39 | ||||||
| C13:0 | 2 | 0.08 | 0.01 | 0.09 | 0.01 | 0.02 | 0.20 | 0.01 | <0.01 | 0.25 |
| 3+ | 0.12 | 0.02 | - | 0.03 | ||||||
| Iso C14:0 | 2 | 0.73 | 0.05 | 0.84 | 0.04 | 0.32 | 0.09 | 0.11 | 0.04 | 0.47 |
| 3+ | 0.74 | 0.09 | 0.44 | 0.16 | ||||||
| C14:0 | 2 | 8.09 | 0.26 | 8.14 | 0.24 | <0.01 | 0.62 | 0.01 | <0.01 | 0.20 |
| 3+ | 10.08 | 0.55 | 5.54 | 0.91 | ||||||
| Iso C15:0 | 2 | 0.136 | 0.004 | 0.136 | 0.004 | <0.01 | 0.07 | 0.06 | <0.01 | 0.10 |
| 3+ | 0.144 | 0.009 | 0.087 | 0.015 | ||||||
| Anteiso C15:0 | 2 | 0.31 | 0.01 | 0.30 | 0.01 | 0.01 | 0.08 | 0.06 | 0.02 | 0.38 |
| 3+ | 0.32 | 0.02 | 0.20 | 0.03 | ||||||
| C14:1 cis-9 | 2 | 0.55 | 0.02 | 0.61 | 0.02 | 0.97 | 0.49 | <0.01 | 0.18 | 0.17 |
| 3+ | 0.57 | 0.05 | 0.50 | 0.08 | ||||||
| C15:0 | 2 | 0.74 | 0.04 | 0.78 | 0.04 | 0.04 | 0.06 | 0.03 | 0.01 | 0.28 |
| 3+ | 0.78 | 0.08 | 0.36 | 0.13 | ||||||
| Iso C16:0 | 2 | 0.22 | 0.01 | 0.22 | 0.01 | 0.03 | 0.26 | 0.45 | 0.02 | 0.36 |
| 3+ | 0.24 | 0.02 | 0.15 | 0.03 | ||||||
| C16:0 | 2 | 30.44 | 0.43 | 30.96 | 0.40 | 0.03 | 0.58 | 0.21 | <0.01 | 0.71 |
| 3+ | 32.55 | 0.90 | 27.71 | 1.49 | ||||||
| Iso C17:0 | 2 | 0.35 | 0.01 | 0.34 | 0.01 | 0.66 | 0.04 | 0.90 | 0.90 | 0.27 |
| 3+ | 0.30 | 0.02 | 0.29 | 0.03 | ||||||
| Anteiso C17:0 | 2 | 0.60 | 0.02 | 0.60 | 0.01 | 0.69 | 0.02 | 0.72 | 0.75 | 0.16 |
| 3+ | 0.49 | 0.03 | 0.51 | 0.05 | ||||||
| C16:1 cis-9 | 2 | 2.13 | 0.10 | 2.16 | 0.09 | 0.04 | 0.99 | 0.83 | 0.04 | 0.98 |
| 3+ | 1.70 | 0.20 | 2.60 | 0.33 | ||||||
| C17:0 | 2 | 0.76 | 0.02 | 0.78 | 0.02 | 0.49 | 0.09 | 0.17 | 0.93 | 0.24 |
| 3+ | 0.67 | 0.04 | 0.70 | 0.07 | ||||||
| C17:1 cis-10 | 2 | 0.32 | 0.01 | 0.34 | 0.01 | 0.02 | 0.84 | 0.28 | 0.03 | 0.75 |
| 3+ | 0.24 | 0.03 | 0.40 | 0.05 | ||||||
| C18:0 | 2 | 12.23 | 0.29 | 12.29 | 0.27 | 0.39 | 0.84 | <0.01 | 0.42 | 0.24 |
| 3+ | 11.90 | 0.61 | 12.91 | 1.01 | ||||||
| C18:1 cis-9 | 2 | 25.87 | 0.95 | 24.76 | 0.87 | 0.02 | 0.22 | 0.15 | <0.01 | 0.39 |
| 3+ | 22.06 | 1.97 | 34.44 | 3.28 | ||||||
| C18:1 cis-11 | 2 | 0.31 | 0.02 | 0.33 | 0.02 | 0.38 | 0.02 | 0.54 | <0.01 | 0.39 |
| 3+ | 0.24 | 0.04 | 0.15 | 0.07 | ||||||
| C18:1 total | 2 | 0.05 | 0.03 | 0.09 | 0.03 | 0.85 | 0.64 | 0.69 | 0.38 | 0.42 |
| 3+ | 0.07 | 0.06 | 0.01 | 0.10 | ||||||
| C19:0 | 2 | 0.16 | 0.01 | 0.17 | 0.01 | <0.01 | 0.94 | 0.61 | 0.04 | 0.37 |
| 3+ | 0.13 | 0.01 | 0.19 | 0.02 | ||||||
| C18:2 cis-9, cis-12 | 2 | 2.48 | 0.06 | 2.55 | 0.06 | 0.07 | 0.96 | 0.16 | 0.14 | 0.63 |
| 3+ | 2.29 | 0.13 | 2.73 | 0.21 | ||||||
| C20:1 cis-11 | 2 | 0.061 | 0.005 | 0.059 | 0.005 | 0.82 | 0.38 | 0.05 | 0.98 | 0.32 |
| 3+ | 0.051 | 0.010 | 0.049 | 0.017 | ||||||
| C18:3 cis-9, cis-12, cis-15 | 2 | 0.38 | 0.03 | 0.39 | 0.02 | 0.24 | 0.31 | <0.01 | 0.22 | 0.07 |
| 3+ | 0.26 | 0.05 | 0.39 | 0.09 | ||||||
| CLA cis-9, trans-11 | 2 | 0.30 | 0.01 | 0.30 | 0.01 | 0.27 | 0.22 | 0.40 | 0.49 | 0.56 |
| 3+ | 0.26 | 0.02 | 0.29 | 0.03 | ||||||
| C20:3n6 | 2 | 0.010 | 0.005 | 0.024 | 0.004 | 0.57 | 0.55 | 0.99 | 0.36 | 0.34 |
| 3+ | 0.012 | 0.010 | 0.009 | 0.016 | ||||||
| C20:4n6 | 2 | 0.15 | 0.01 | 0.18 | 0.01 | 0.19 | 0.14 | 0.05 | 0.97 | 0.70 |
| 3+ | 0.12 | 0.02 | 0.15 | 0.04 | ||||||
| SCFA 3 | 2 | 48.96 | 0.90 | 49.56 | 0.83 | <0.01 | 0.41 | 0.03 | <0.01 | 0.35 |
| 3+ | 54.44 | 1.86 | 40.52 | 3.10 | ||||||
| OBCFA 4 | 2 | 2.36 | 0.09 | 2.53 | 0.09 | 0.02 | 0.03 | 0.01 | <0.01 | 0.20 |
| 3+ | 2.53 | 0.19 | 1.28 | 0.32 | ||||||
| LCFA 5 | 2 | 43.59 | 0.93 | 42.66 | 0.85 | <0.01 | 0.25 | 0.02 | <0.01 | 0.24 |
| 3+ | 38.73 | 1.93 | 52.73 | 3.21 | ||||||
| Total Unknowns (C6:0–C22:6) | 2 | 0.09 | 0.01 | 0.12 | 0.01 | 0.84 | 0.71 | 0.33 | 0.36 | 0.14 |
| 3+ | 0.10 | 0.03 | 0.08 | 0.05 | ||||||
| Treatments | p-Value | ||||||||
|---|---|---|---|---|---|---|---|---|---|
| 3X | 6X | TRT | TRT × LG | TRT × DIM 2 | LG × DIM 2 | TRT × LG × DIM 2 | |||
| Biomarkers 1 | LSM | VAR 3 | LSM | VAR | |||||
| Albumin, g/dL | 3.33 | 0.18 | 3.40 | 0.19 | 0.74 | 0.44 | 0.81 | 0.48 | 0.31 |
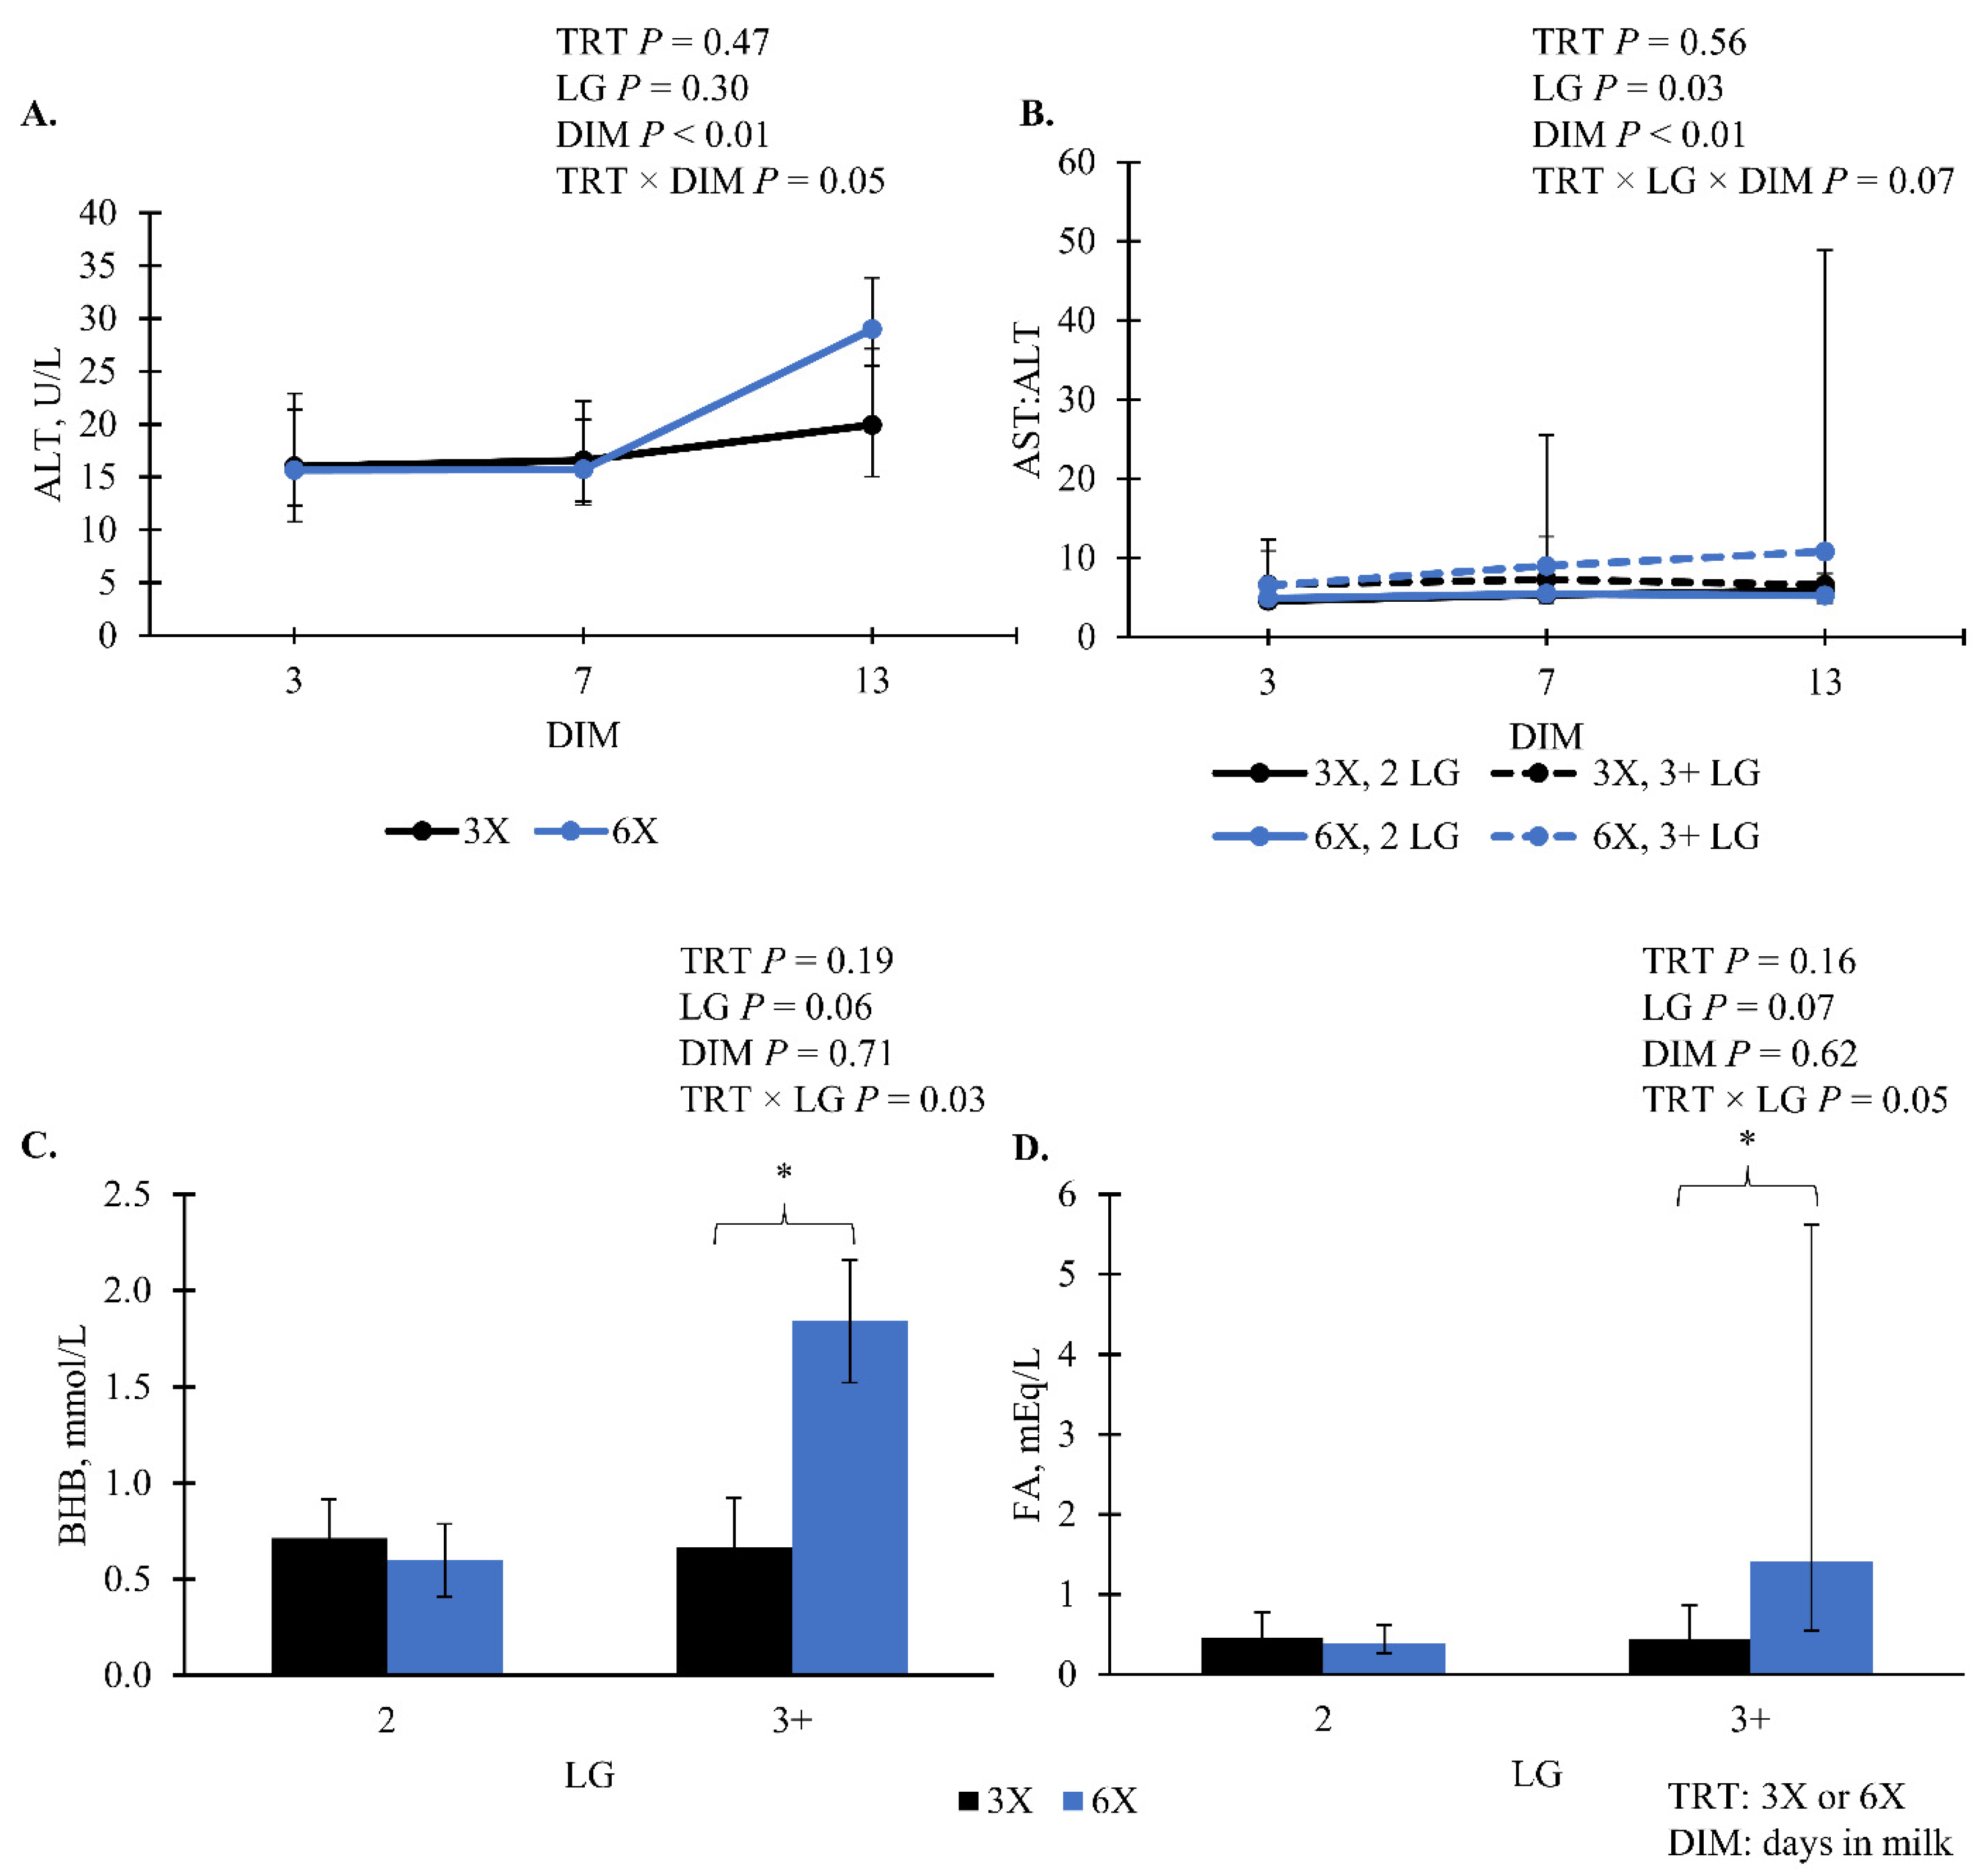
| ALT, U/L | 17.40 | [12.66, 24.85] | 18.99 | [14.63, 25.29] | 0.47 | 0.31 | 0.05 | 0.65 | - |
| AST, U/L | 101.92 | [82.17, 134.19] | 110.89 | [85.69, 156.99] | 0.63 | 0.28 | 0.48 | 0.68 | - |
| AST:ALT | 5.90 | [4.89, 7.44] | 6.42 | [5.12, 8.59] | 0.58 | 0.58 | 0.76 | 0.99 | 0.06 |
| BHB, mmol/L | 0.69 | [0.55, 0.92] | 0.90 | [0.66, 1.42] | 0.19 | 0.03 | 0.34 | 0.87 | 0.72 |
| Cholesterol, mg/dL | 59.88 | [45.62, 78.61] | 63.65 | [48.53, 83.50] | 0.53 | 0.19 | 0.38 | 0.64 | - |
| Glucose, mg/L | 5770.90 | [5296.35, 6178.09] | 5789.66 | [5255.16, 6240.25] | 0.95 | 0.48 | 0.21 | 0.85 | 0.16 |
| FA, mEq/L | 0.45 | [0.31, 0.68] | 0.69 | [0.43, 1.20] | 0.16 | 0.06 | 0.49 | 0.19 | - |
| Treatment | p-Value 2 | ||||||||
|---|---|---|---|---|---|---|---|---|---|
| 3X | 6X | TRT | TRT × LG | TRT × DIM | LG × DIM | TRT × LG × DIM | |||
| Variables | LSM | VAR | LSM | VAR | |||||
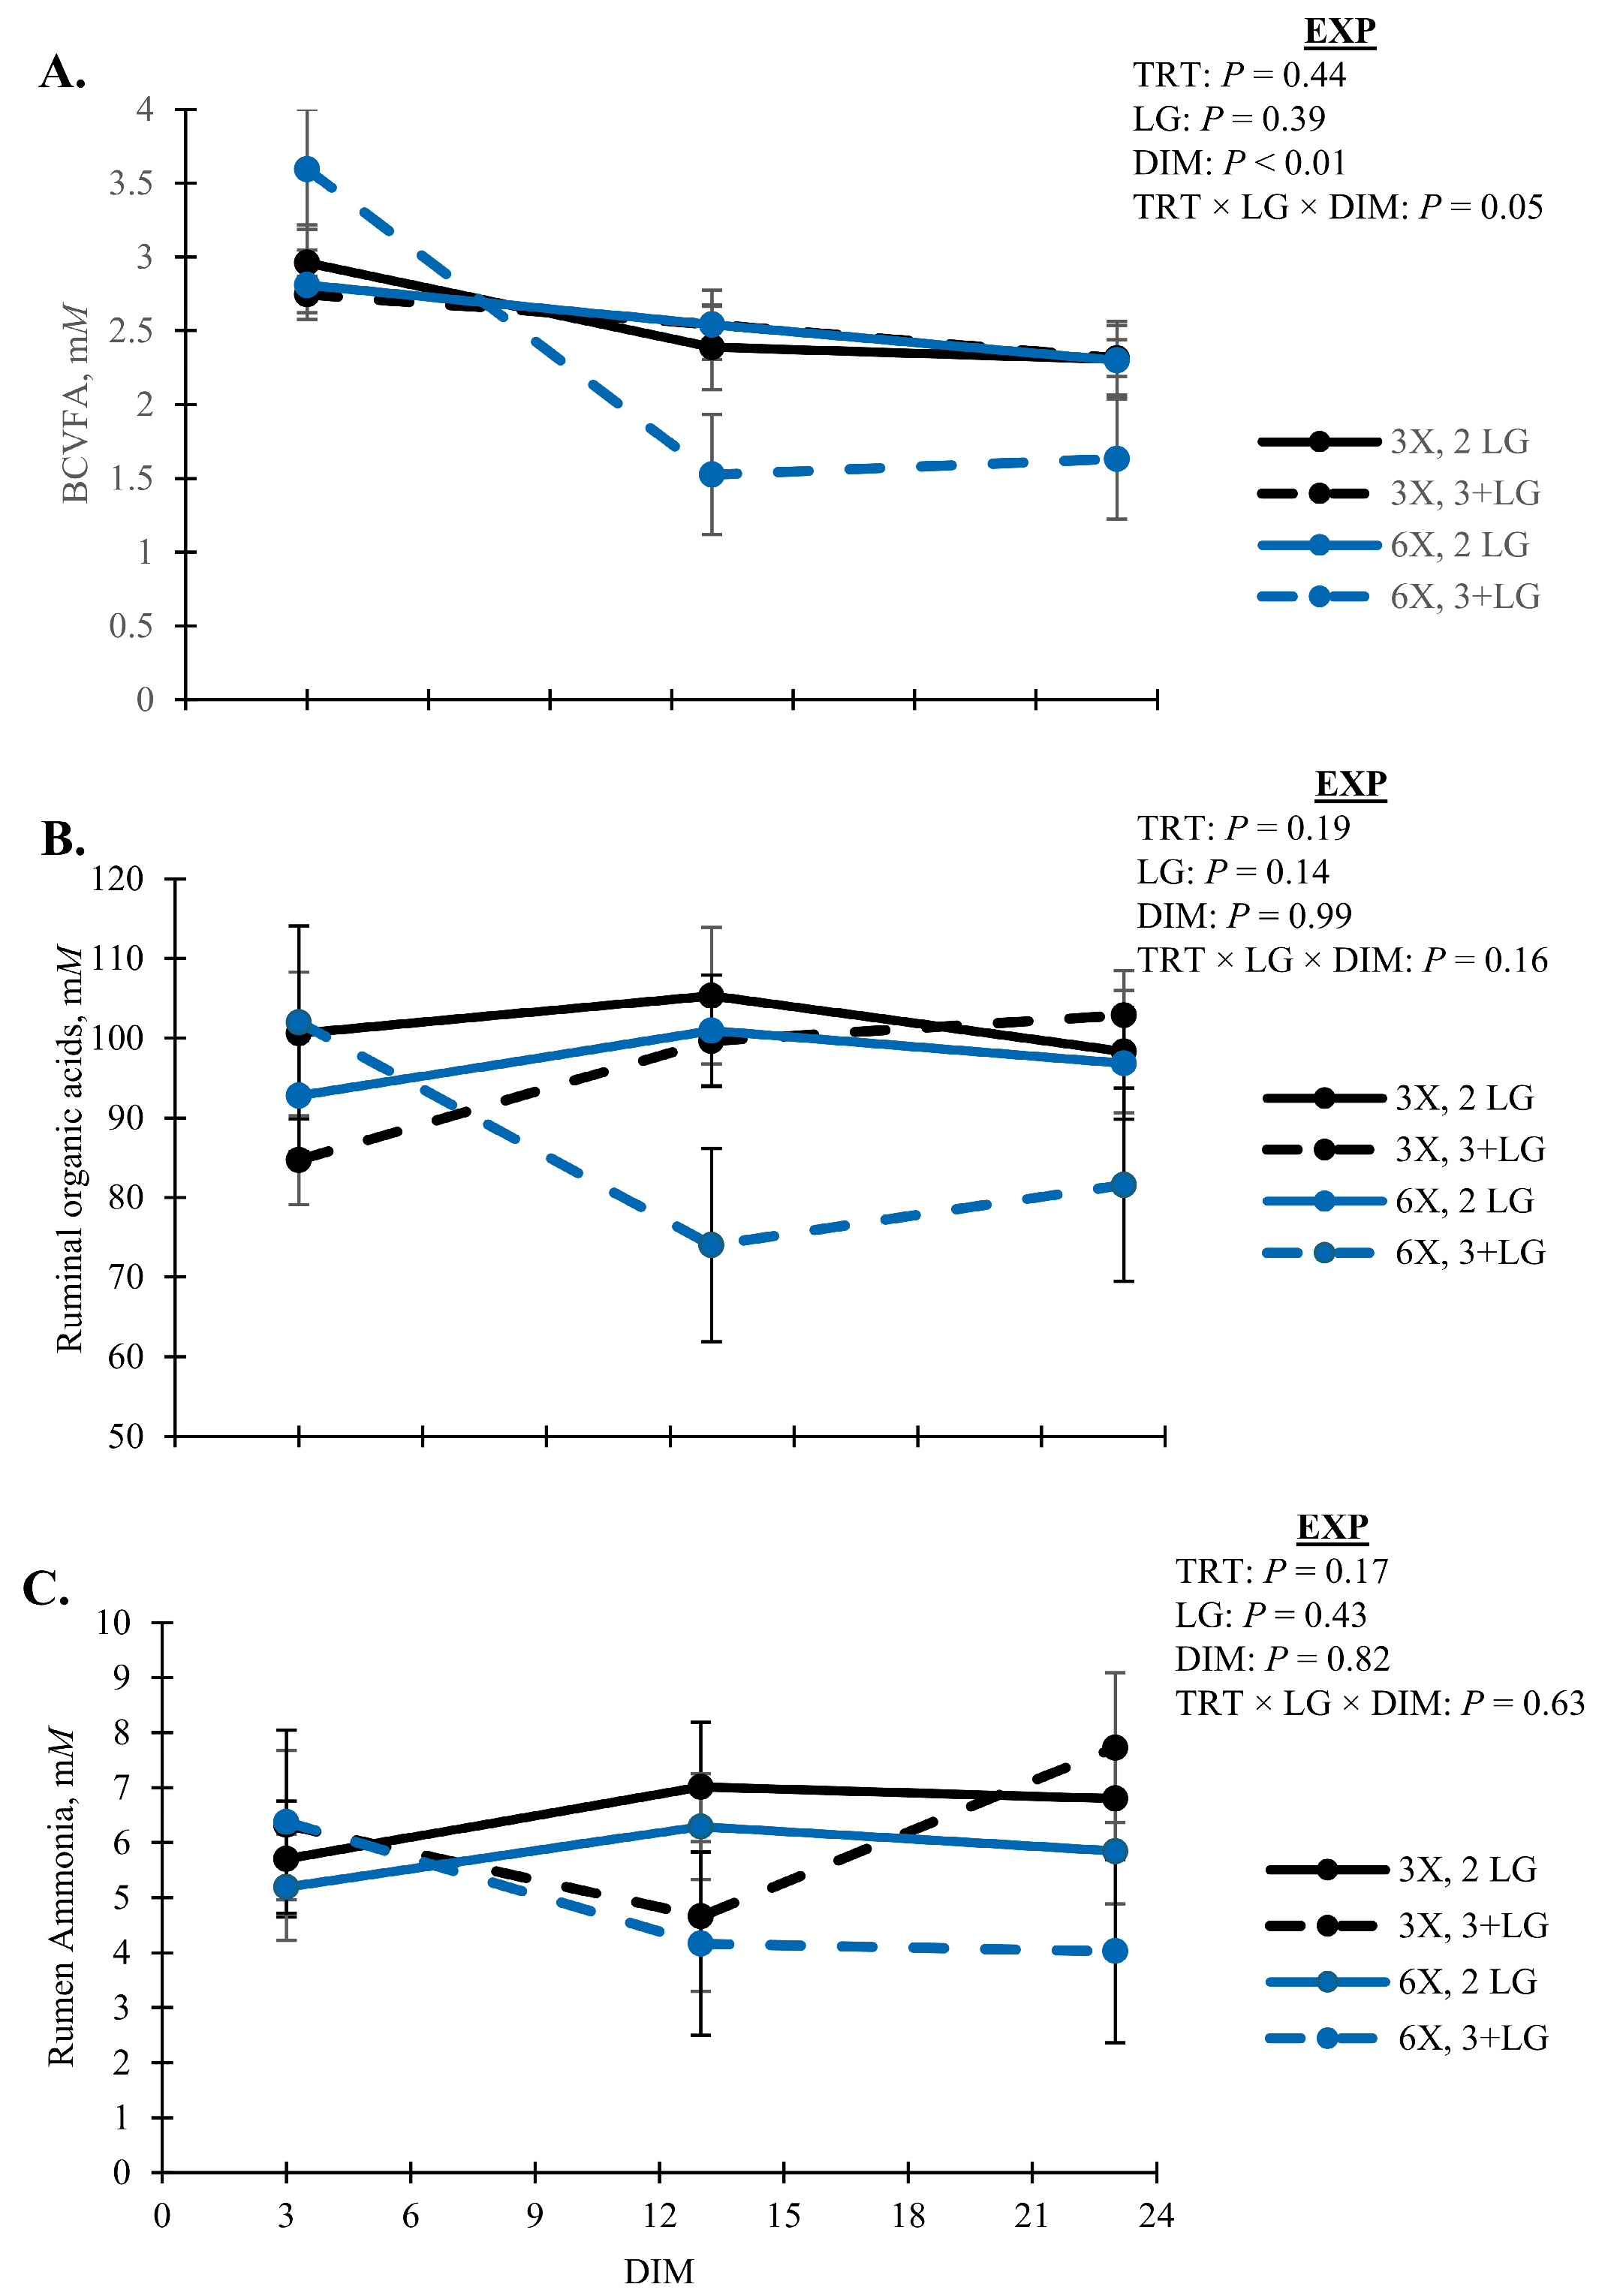
| Organic Acid 3, mM | 99 | 4 | 91 | 4 | 0.19 | 0.63 | 0.30 | 0.59 | 0.16 |
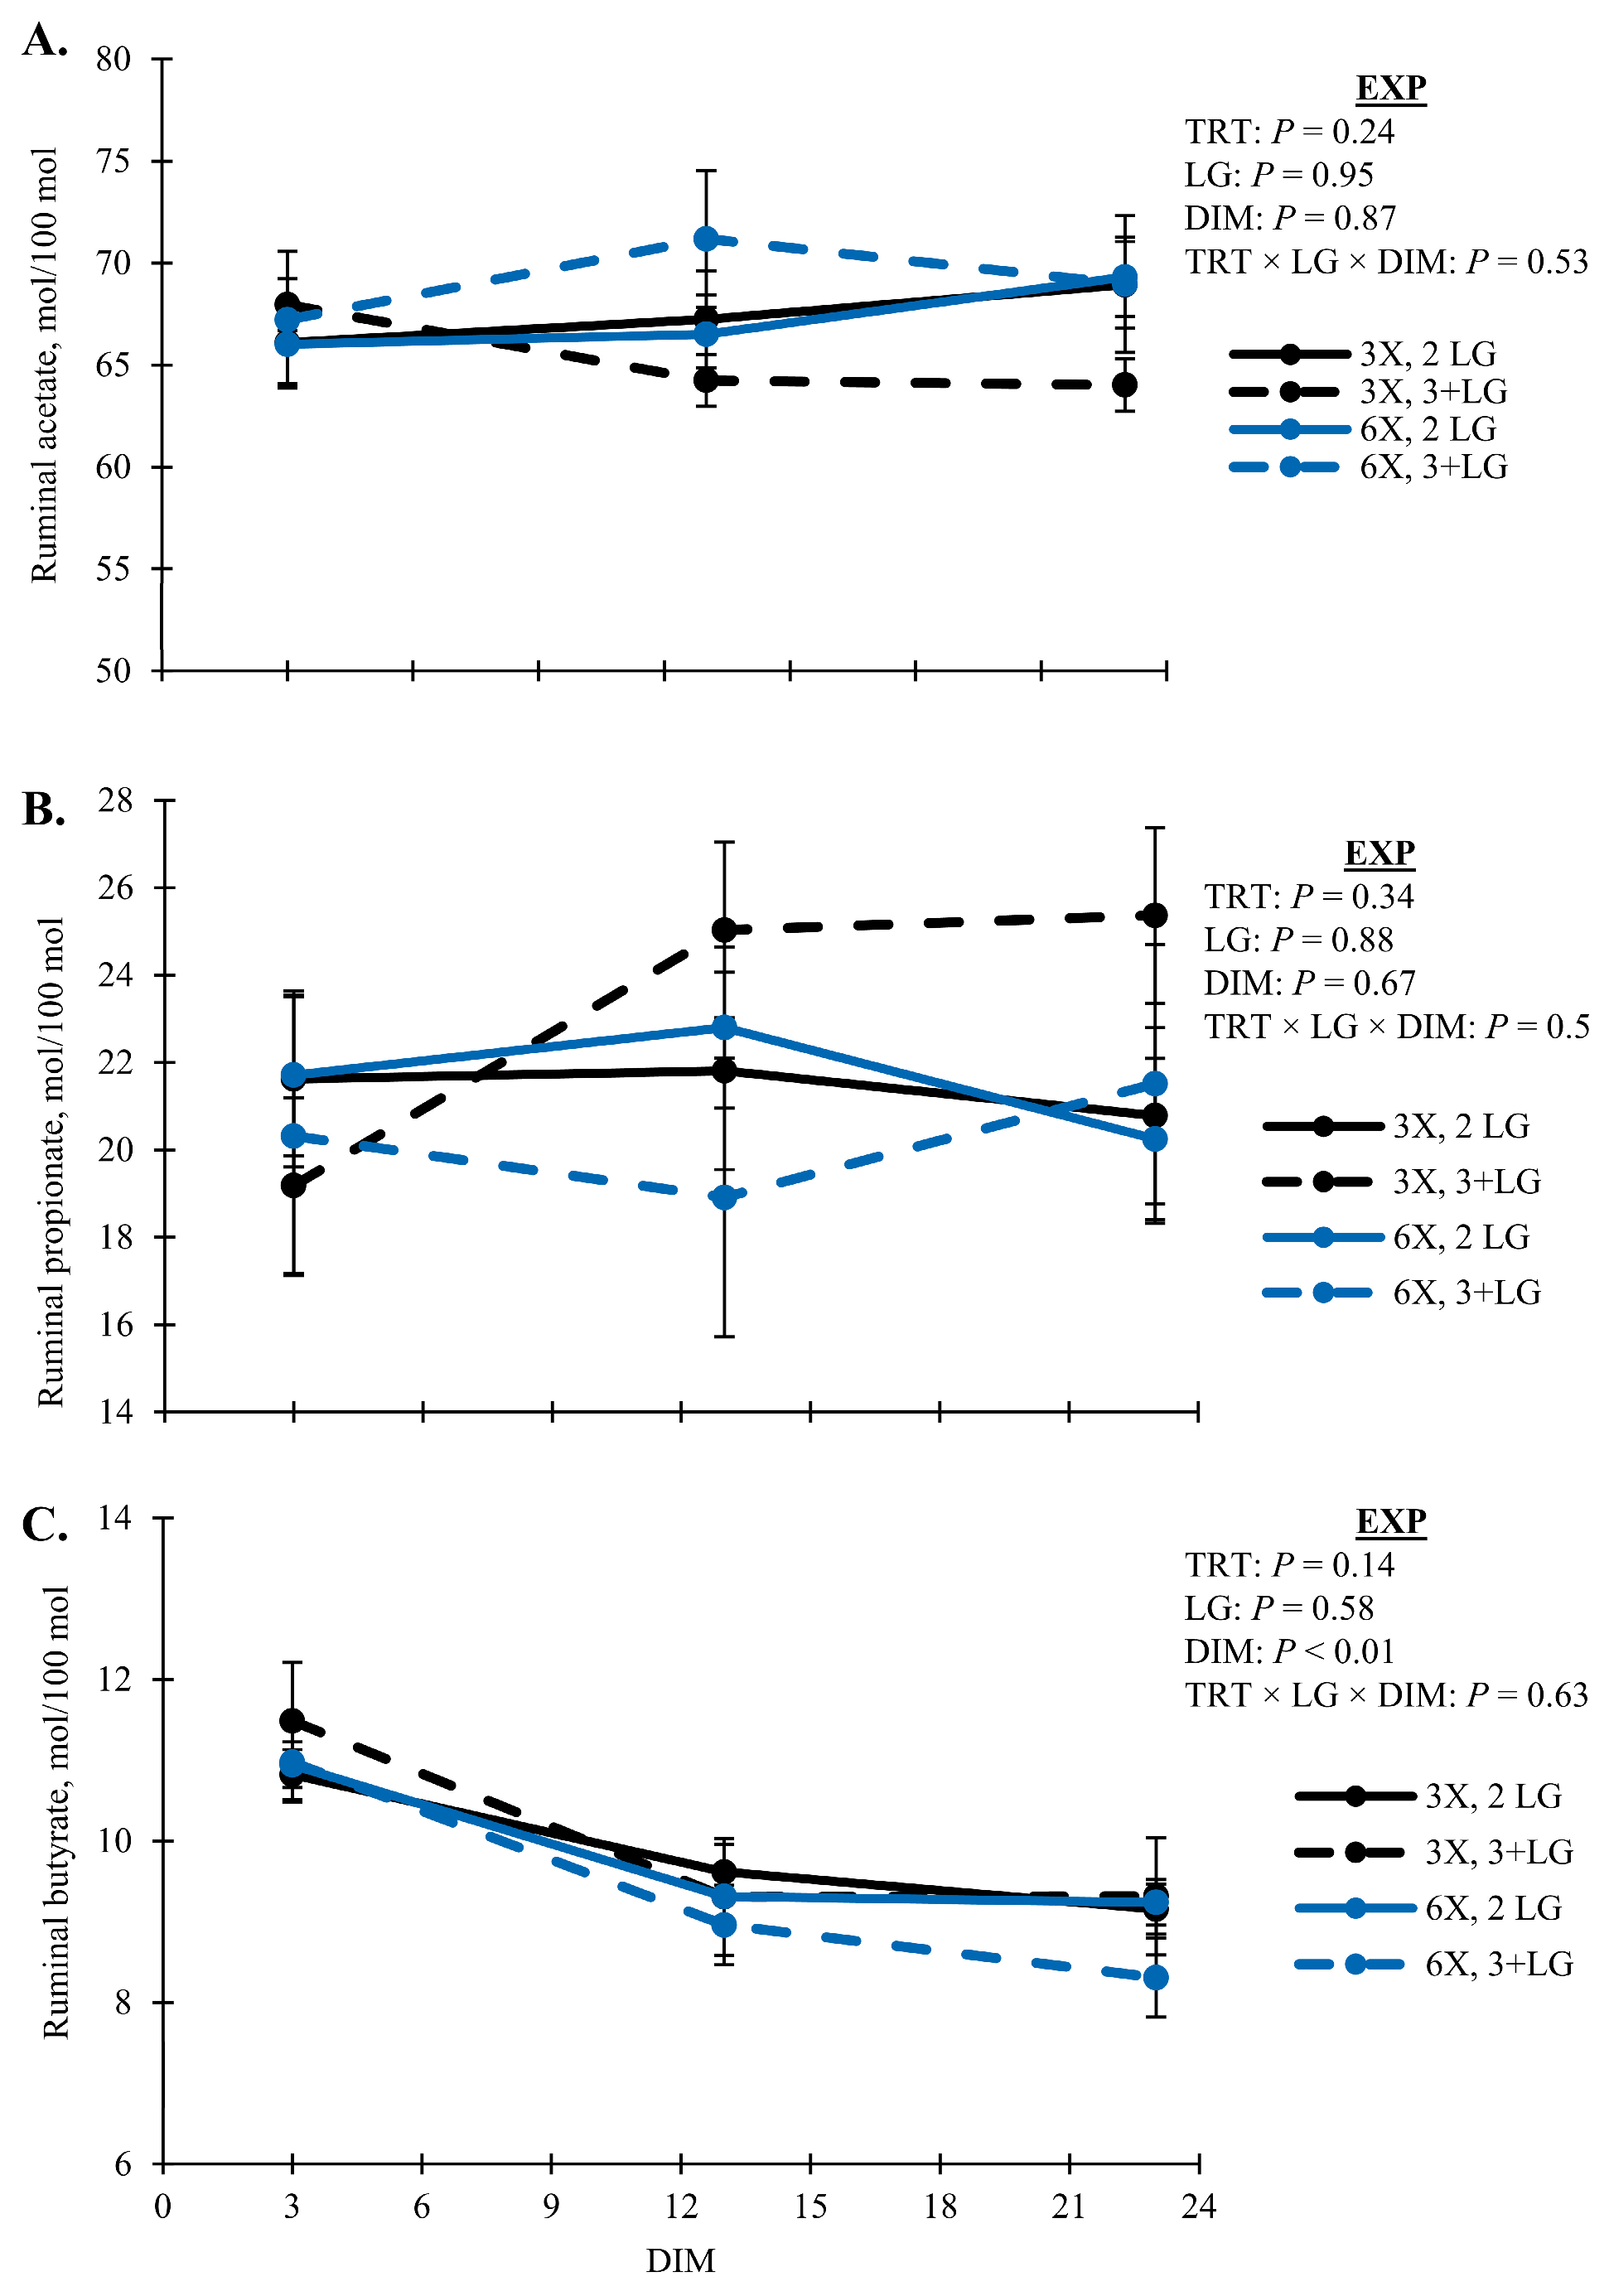
| Acetate, mol/100 mol | 66.41 | 1.02 | 68.20 | 1.12 | 0.24 | 0.59 | 0.49 | 0.49 | 0.53 |
| Propionate, mol/100 mol | 22.30 | 0.97 | 20.91 | 1.06 | 0.34 | 0.28 | 0.62 | 0.38 | 0.52 |
| Butyrate, mol/100 mol | 9.95 | 0.15 | 9.62 | 0.16 | 0.14 | 0.19 | 0.88 | 0.33 | 0.63 |
| Valerate, mol/100 mol | 1.34 | 0.06 | 1.26 | 0.06 | 0.33 | 0.42 | 0.53 | 0.38 | 0.17 |
| Lactate, mM | 1.37 | [0.12, 15.5] | 3.16 | [1.22, 8.13] | 0.54 | 0.19 | 0.81 | 0.81 | - |
| Ammonia, mM | 6.37 | 0.50 | 5.32 | 0.55 | 0.17 | 0.67 | 0.48 | 0.25 | 0.63 |
| Free AA, mM | 4.30 | 0.68 | 4.53 | 0.75 | 0.82 | 0.17 | 0.52 | 0.93 | 0.54 |
| BCVFA 4, mM | 2.5 | 0.1 | 2.4 | 0.1 | 0.44 | 0.45 | 0.18 | 0.24 | 0.05 |
Disclaimer/Publisher’s Note: The statements, opinions and data contained in all publications are solely those of the individual author(s) and contributor(s) and not of MDPI and/or the editor(s). MDPI and/or the editor(s) disclaim responsibility for any injury to people or property resulting from any ideas, methods, instructions or products referred to in the content. |
© 2024 by the authors. Licensee MDPI, Basel, Switzerland. This article is an open access article distributed under the terms and conditions of the Creative Commons Attribution (CC BY) license (https://creativecommons.org/licenses/by/4.0/).
Share and Cite
Kammann, E.M.; French, E.A.; Jozik, N.S.; Li, W.; Pralle, R.S. Effects of Early Lactation Milking Frequency in an Automated Milking System on Cow Performance. Animals 2024, 14, 2293. https://doi.org/10.3390/ani14162293
Kammann EM, French EA, Jozik NS, Li W, Pralle RS. Effects of Early Lactation Milking Frequency in an Automated Milking System on Cow Performance. Animals. 2024; 14(16):2293. https://doi.org/10.3390/ani14162293
Chicago/Turabian StyleKammann, Erin M., Elizabeth A. French, Natalie S. Jozik, Wenli Li, and Ryan S. Pralle. 2024. "Effects of Early Lactation Milking Frequency in an Automated Milking System on Cow Performance" Animals 14, no. 16: 2293. https://doi.org/10.3390/ani14162293
APA StyleKammann, E. M., French, E. A., Jozik, N. S., Li, W., & Pralle, R. S. (2024). Effects of Early Lactation Milking Frequency in an Automated Milking System on Cow Performance. Animals, 14(16), 2293. https://doi.org/10.3390/ani14162293