Communication

Genome-Wide Association Analysis Identifies Important Haplotypes and Candidate Gene XKR4 for Body Size Traits in Pekin Ducks

1
National Engineering Laboratory for Animal Breeding, Key Laboratory of Animal Genetics, Breeding and Reproduction of the Ministry of Agriculture, College of Animal Science and Technology, China Agricultural University, Beijing 100193, China
2
Beijing Nankou Duck Breeding Technology Co., Ltd., Beijing 102202, China
*
Author to whom correspondence should be addressed.
Animals 2024, 14(16), 2349; https://doi.org/10.3390/ani14162349
Submission received: 16 July 2024 / Revised: 5 August 2024 / Accepted: 12 August 2024 / Published: 14 August 2024
(This article belongs to the Section Animal Genetics and Genomics)

Abstract

:

Simple Summary

The body size of ducks reflects their skeletal development and growth status. However, the rapid growth and early large body size of meat ducks negatively affect subsequent slaughter and processing. Therefore, it is necessary to identify candidate genetic markers and genes involved in body size regulation. In this study, we conducted genome-wide association studies (GWASs) on the body length (BL), keel bone length (KBL), neck length (NL), and breast width (BrW) of 42-day-old Pekin ducks (Anas platyrhynchos domestica). The results showed that BL and KBL had similar GWAS signals. Based on these results, we further identified causal haplotypes and candidate genes affecting BL and KBL. This research provides new genetic insights into the growth and development of Pekin ducks and has important implications for their breeding improvement.

Abstract

Body size is an important growth indicator in ducks and is a primary selection criterion for physical improvement. An excessively rapid growth rate in meat ducks can result in excessive body size, which may hinder subsequent processing and slaughter operations. However, only a few molecular markers related to body size have been studied in meat ducks. In this study, we performed a genome-wide association study (GWAS) to identify candidate genes and QTLs affecting body length (BL), keel bone length (KBL), neck length (NL), and breast width (BrW) in Pekin ducks (Anas platyrhynchos domestica). Our results indicate the significant SNP for NL is located within a pseudogene, whereas the significant SNP for BrW is located in an intergenic region. More importantly, our analysis identified a haplotype that was significantly associated with both BL and KBL. This haplotype, containing 48 single-nucleotide polymorphisms (SNPs), is localized within the XKR4 gene. The identification of this haplotype suggests that XKR4 may be a key candidate gene influencing BL and KBL in Pekin ducks. These findings have important implications for the breeding and genetic improvement of Pekin ducks, and provide valuable insights into the genetic architecture of body size traits in this species.

1. Introduction

Duck meat occupies a significant position in the global meat market, being the third largest meat industry after pork and chicken [1]. Body size is an important indicator of the growth status of animals, and the development of their skeleton and skeletal muscles [2]. Skeletal development is a key factor in weight gain, and studies have shown that bigger size means higher meat production. [3]. In addition, carcasses and other by-products of duck have high added value in food processing. However, excessive size has a negative impact on slaughter and processing. For example, larger ducks can be more difficult to process accurately at various stages such as depilation, evisceration, and cutting, leading to inconsistent meat quality and negative economic effects.
Previous studies have shown that body size in poultry may be regulated by multiple genes. Cao et al. found that exon polymorphisms in PITX2 significantly affect the body and carcass traits of Wuliang Mountain Black-bone chickens [4]. Hong et al. found that an SNP downstream of BMP2 can explain nearly 10% of the genetic variation in body length and height in Large White pigs [5]. Compared to chickens and pigs, fewer studies have been conducted on molecular markers related to body size traits in ducks. Zhou et al. constructed F2 hybrid populations of domestic and mallard ducks and found that a haplotype on the IGF2BP1 gene significantly affected body size using genome-wide association analysis (GWAS) [6]. However, this haplotype has been completely fixed in the domestic duck genome over a long period of selection and breeding. In a previous study, we carried out a GWAS of body size and carcass traits in ducks using Genotyping-by-Sequencing (GBS) [7]. Limited by marker density and coverage, a very small proportion of QTLs were detected. Therefore, few effective genomic markers can be used for molecular breeding of Pekin duck body size traits.
In this study, we aim to detect the variation in Pekin ducks by genome resequencing, followed by screening novel functional genes and QTLs related to body size by genome-wide association analysis, haplotype analysis, and other analytical methods. The results of the study can provide candidate genes for subsequent functional studies as well as basic data for the genomic selection of body size traits.

2. Materials and Methods

2.1. Phenotypes and Genotypes

In this study, we measured BL, KBL, NL, and BrW in 642 Pekin ducks (336 males, 306 females) at 42 days of age. These ducks were from three different batches within the same year and were all provided by Beijing Nankou Duck Breeding Technology Ltd. They were raised under identical environmental and feeding conditions. In particular, they were provided ad libitum commercial diets. They were fed a starter diet from 1 to 18 days of age, which contained 19% crude protein (CP) and 12.81 MJ/kg of dietary metabolizable energy (ME). Following this, they received a grower diet containing 17.1% CP and 11.95 MJ/kg ME until 42 days of age.
The BL, KBL, NL, and BrW were measured using a caliper. BL, the distance between the shoulder joint and the ischial tuberosity; KBL, the distance between the anterior and the posterior border of the breast-bone crest; NL, the distance between the first cervical vertebra and the end of neck; BrW, the distance vertically between the backbone and the beginning of the breast-bone crest.
Blood samples were collected, and whole-genome DNA was extracted from the blood samples using a QIAamp DNA Blood Mini Kit (QIAGEN, Hilden, Germany). The whole-genome sequencing data were generated on the Illumina HiSeq 4000 platform using 150 bp paired-end reads, with an average sequencing depth of 2.11×.

2.2. Statistical Analysis

Phenotypes exceeding the Mean ± 3SD range were excluded as outliers. Normality was tested using the Shapiro–Wilk test. If phenotypes deviated from normal distribution, rank transformation [7,8,9] was applied to normalize them for the mixed linear model [10].
Adapters and low-quality reads were removed from all sequencing files using Fastp [11]. The sequencing data were aligned to the reference genome using Sentieon [12], with the reference being the chromosome assembly of the mallard genome (GenBank: ASM874695v1). SNP detection and imputation were performed using STITCH [13], with parameters K = 10 and nGen = 120, keeping other settings default. SNPs with info_score < 0.9 were removed to ensure imputation accuracy. Autosomal SNPs were retained and further filtered using Vcftools with the following criteria: minor allele frequency > 0.01, SNP call rate ≥ 0.95, and individual call rate ≥ 0.8. A total of 4,603,480 SNPs were obtained for GWAS. Principal component analysis (PCA) was conducted by Plink [14] and multiple testing correction for the GWAS was performed using SimpleM [15] to determine the significance threshold.
Asreml [16] was used for heritability estimation. And the kinship matrix was calculated using GEMMA (v0.98) [17] with the ‘-gk 1’ parameter. Subsequently, association analysis was performed using GEMMA’s univariate linear mixed model. The specific mixed model is as follows:
y = + + u + ϵ,
where y is the phenotype vector; W is the covariate matrix (including sex, batch, and the first 5 PCs); α is a vector of corresponding coefficients (including the intercept term); x is the SNP genotype vector; β is the vector of SNP additive effects; u is the random effect vector; and ϵ is the residual. The most significant SNPs (lead SNPs) identified by GWAS were annotated using SnpEff (4.3) [18].

2.3. Post GWAS

To examine if the lead SNP polymorphism affects transcription factor binding, we extracted the sequence 30 bp around the lead SNP and used Alibaba2 [19] for transcription factor binding site (TFBS) prediction.
We also performed fine-mapping to identify the causal variants within a 300 kb range of the lead SNP, given the evidence of the significant association of the lead SNP in GWAS. We used SusieR [20] to estimate the posterior inclusion probability (PIP) of each SNP in the selected region, which indicates the evidence for SNP having a non-zero effect (namely, causal). We then ranked the SNPs by PIP and summed these until the cumulative sum reached 95%. All included SNPs are considered the credible set, which refers to the minimum set of variants that contains all causal SNPs with high probability.
For the SNPs in credible sets, we performed haplotype analysis using Haploview [21] and visualized the results with LDBlockShow [22]. The ggstatsplot R package [23] was used to analyze the association between haplotypes and phenotypes with default parameters.

3. Results and Discussion

3.1. Phenotypes and Heritability

Table 1 shows heritability and phenotype statistics for all individuals. BL averages 26.49 cm, KBL averages 13.58 cm, NL averages 21.06 cm and BrW averages 12.00 cm. FBL and NL are very similar to our previous findings, while BrW increased by approximately 1 cm [7].
The heritability estimations for BL (0.45) and BrW (0.40) suggest that nearly half of the phenotypic variation in body length and breast width can be attributed to genetic factors. BL is consistent with previous studies on similar poultry breeds, which reported heritability reached 0.5 in cross-bred chickens [24], while BrW is slightly higher than our previous results, where the heritability was 0.29 [7]. The heritabilities for KBL (0.30) and NL (0.37) also indicate a significant genetic influence, although slightly lower than for BL and BrW. The heritabilities of KBL and NL are lower compared to our previous research using GBS. This difference is probably due to the limitations of GBS, such as uneven genome coverage, which can lead to reduced sequencing accuracy in certain regions [25]. The relatively high heritability of these traits suggests that selective breeding could effectively improve these phenotypes in Pekin ducks. However, there are limitations to this assessment, such as the specific population and environmental conditions studied. Future research should aim to confirm these findings in larger and more diverse populations, and to investigate the potential effects of gene–environment interactions on these traits.

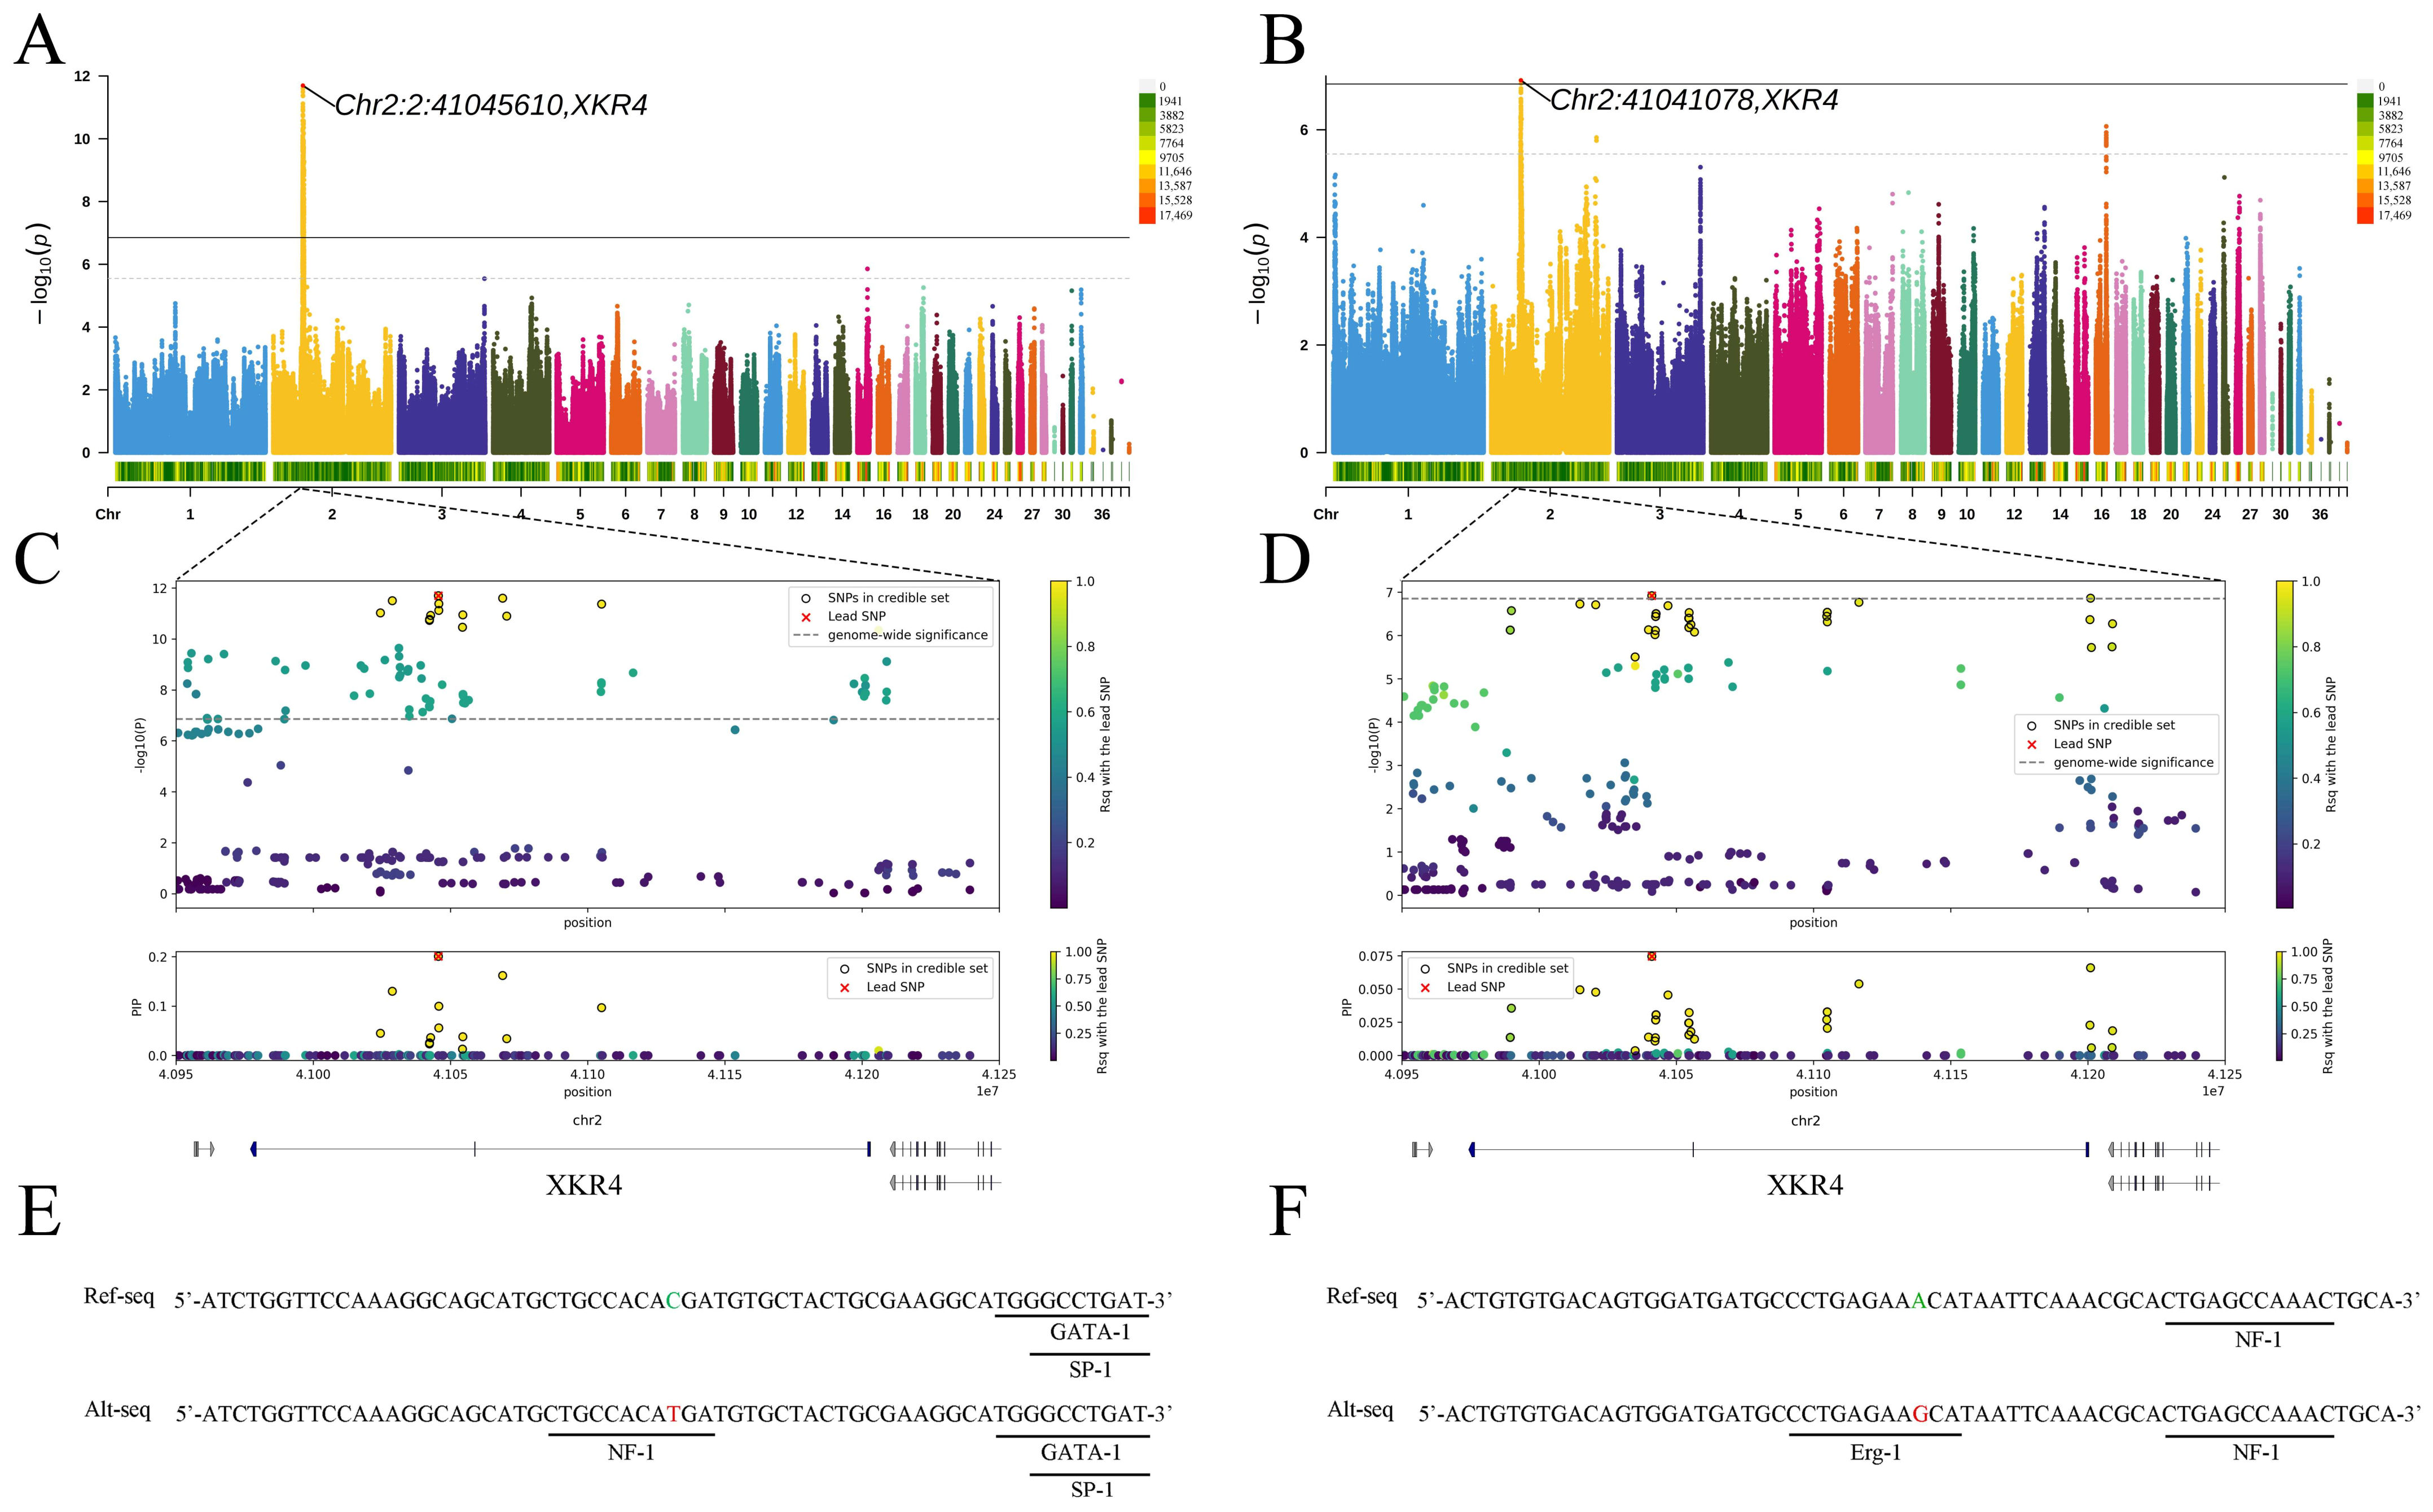
3.2. GWAS and TFBS Prediction

The GWAS results indicate that BL, KBL, and BrW show a significant signal on chromosome 2, while the significant signal for NL is located on chromosome 23. The details of the lead SNPs are shown in Table 2, and we found that the lead SNPs of BL and KBL are very close in position, differing by only 4.5 kb (Figure 1A,B). Furthermore, the allele frequencies of these SNPs are close to 0.5 in the population, suggesting that these alleles are not under strong artificial selection [26,27] and could be candidate genetic markers for selection in body size.
Further annotation using SnpEff revealed that the lead SNP of NL is located in the intergenic region, whereas the lead SNP for BrW is located within a pseudogene. However, both lead SNPs for BL and KBL are located within the intron of XKR4, close to the second exon. We hypothesize that these lead SNPs for BL and KBL may influence the size of Pekin ducks by affecting XKR4. XKR4 (XK, Kell blood group complex subunit-related family, member 4) functions as a phospholipid-scrambling protein [28] and may play an important role in regulating the body size and growth of Pekin ducks. Previous studies have also extensively reported the association of XKR4 with animal growth. Terakado et al. identified a significant association between the XKR4 and birth weight in Nelore cattle using GWAS [29]. An et al. identified the XKR4 as a candidate gene associated with body height and hip height in Chinese Wagyu beef cattle [30]. Lindholm-Perry et al. identified XKR4 as a key candidate gene associated with growth traits in cattle [31]. These studies all point to XKR4 as an important gene influencing growth and skeletal development in animals, providing support for our research findings.
The significant signals for BL and KBL are located in the intron of XKR4, suggesting that variation in these regions may regulate height traits by affecting gene expression or function. Previous research has shown that causal variants in XKR4 may lie outside the coding region [32]. In addition, Yong et al. found that polymorphisms within the intron of the XKR4 gene significantly affected body length, weight, thoracic circumference, and height in Boza goats [33]. Therefore, we used Alibaba2 to predict TFBS in the vicinity of the lead SNPs. The results show that in BL, the mutant allele of the lead SNP creates a binding site for the transcription factor NF-1 (Figure 1E). NF-1 is a widely distributed transcriptional regulatory protein in eukaryotes that plays a crucial role in the regulation of gene expression, cell differentiation, development, and other biological processes. It has been reported that NF-1 can bind to an enhancer element upstream of the mouse growth hormone receptor gene and positively regulate its transcription [34]. Similarly, the lead SNP mutation in KBL creates a binding site for the transcription factor Erg-1 (Figure 1F). Erg-1 is a zinc finger transcription factor that promotes osteoblast differentiation and bone formation by regulating the expression of skeletal-related genes [35,36]. Therefore, the occurrence of mutant alleles of the lead SNPs in BL and KBL may affect gene expression through similar mechanisms, further regulating body size in Pekin ducks.

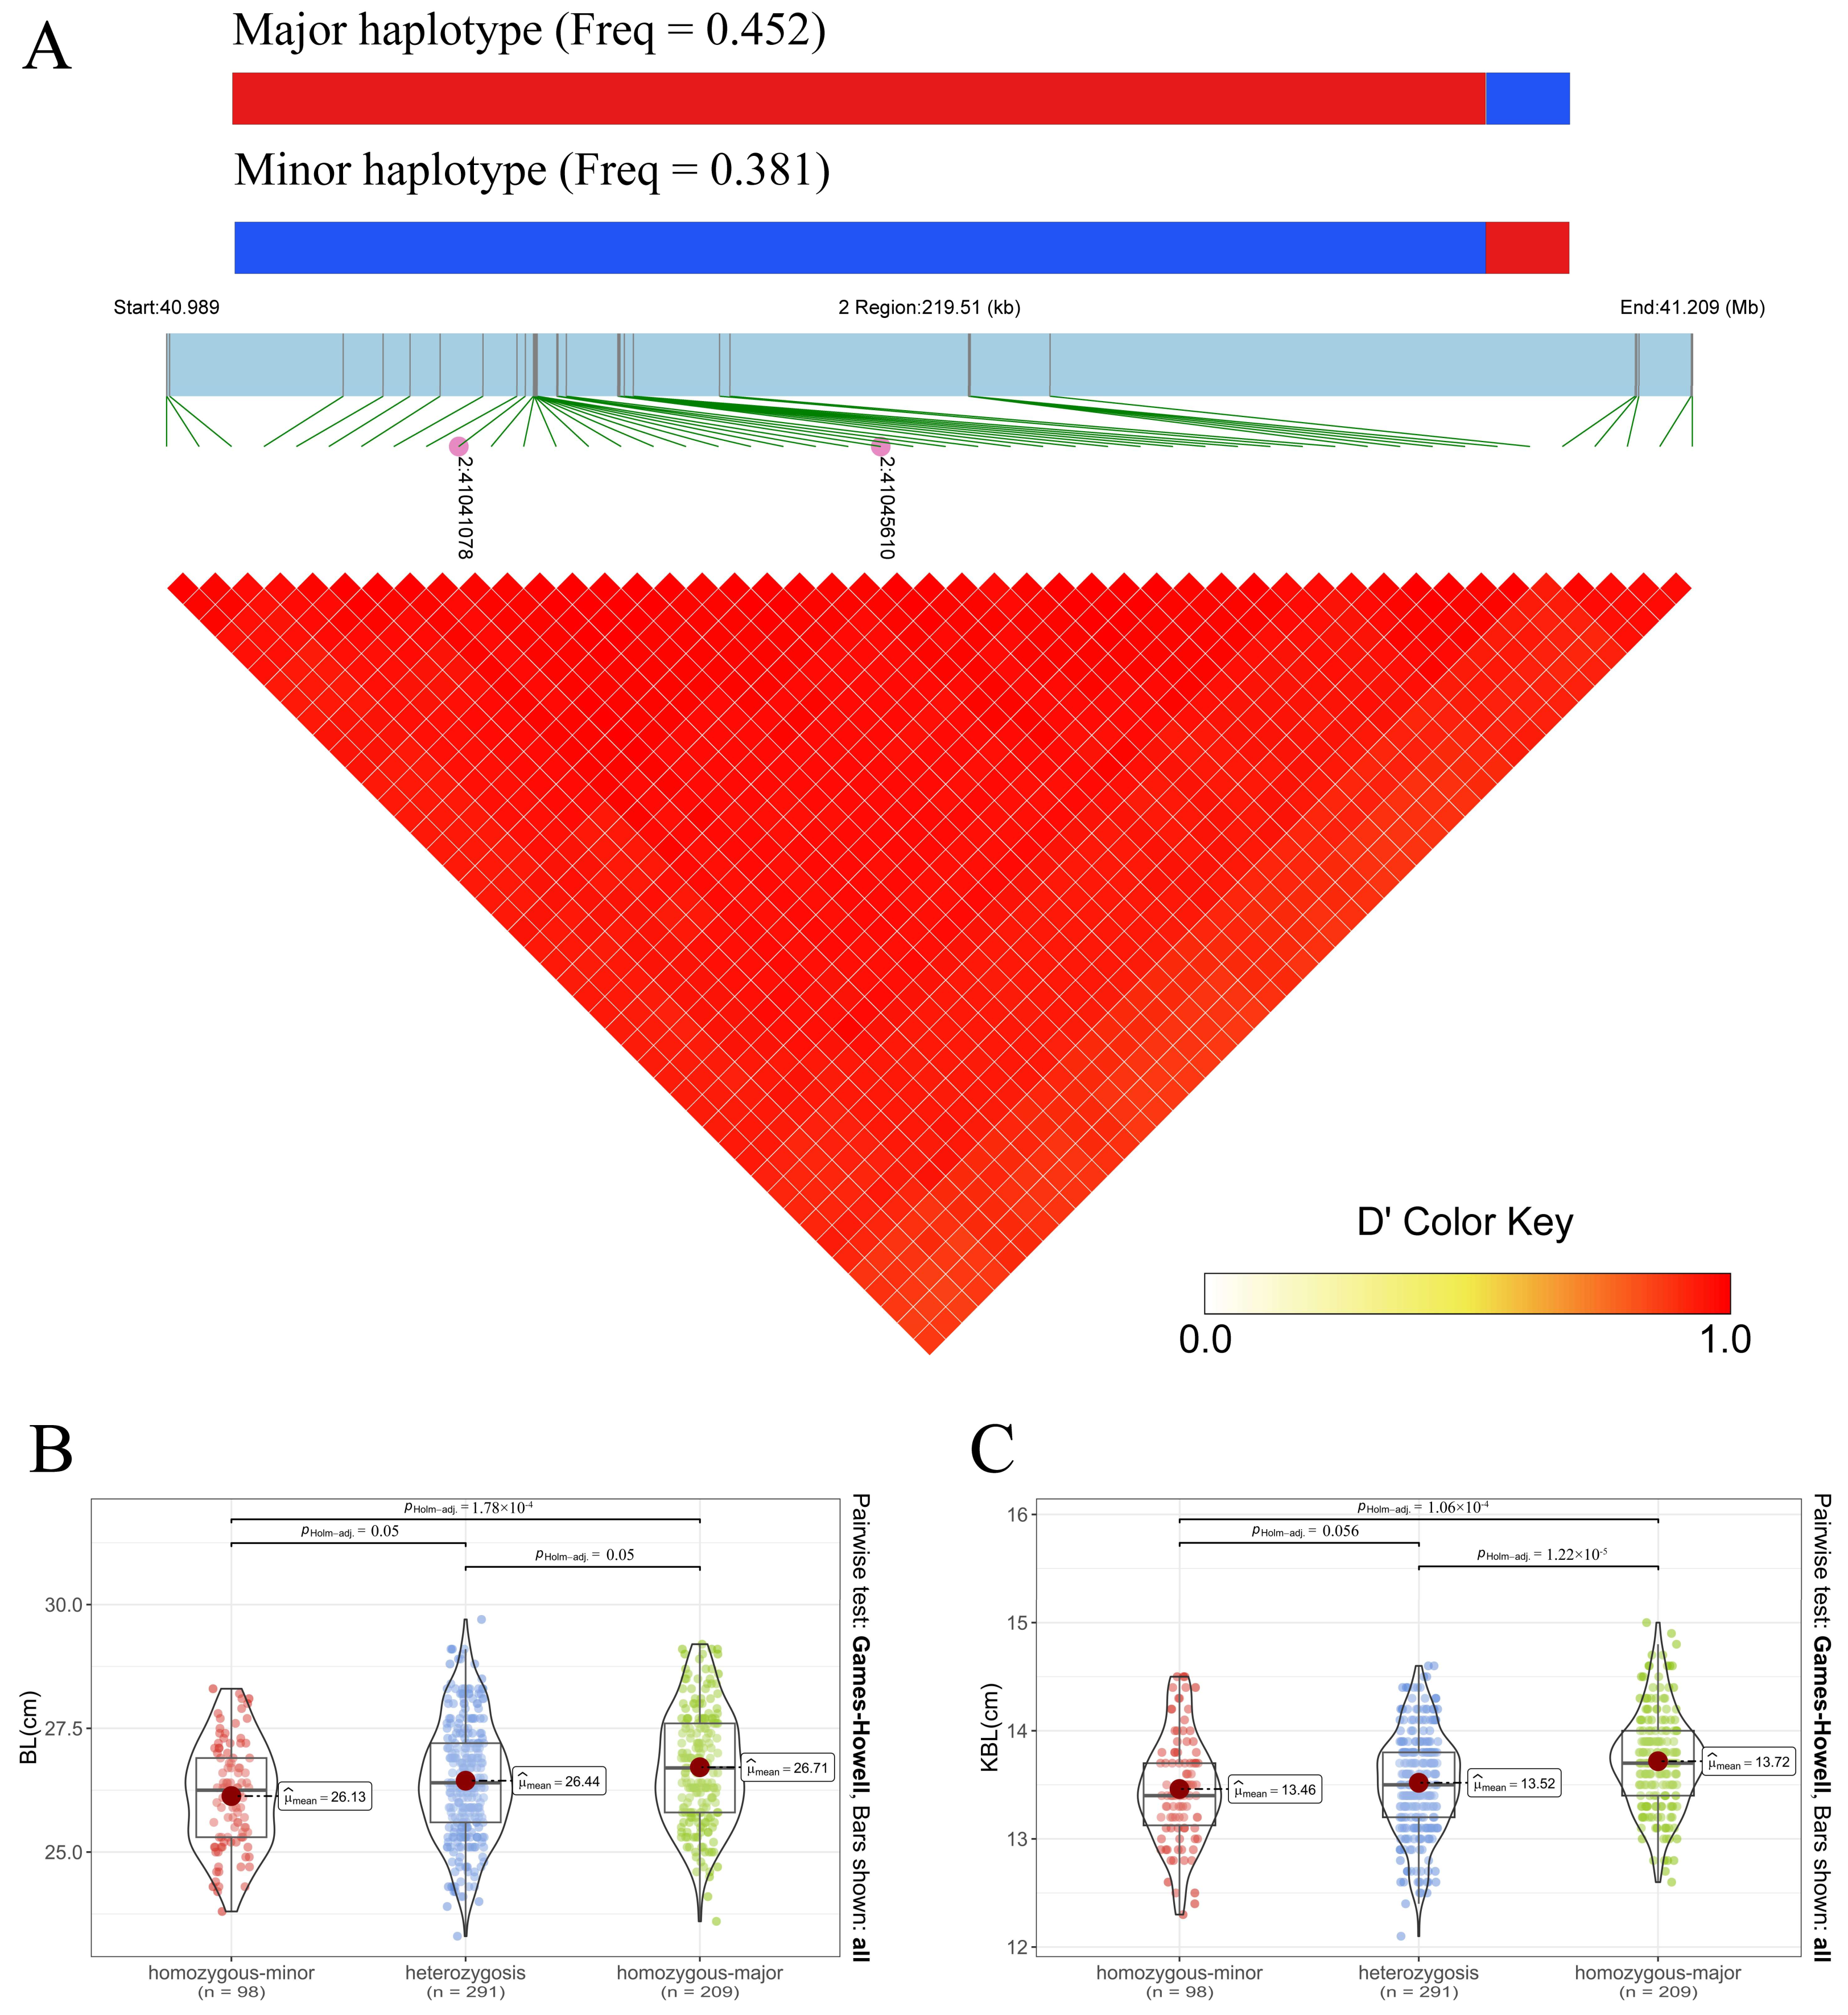
3.3. Fine-Mapping and Haplotype Analysis

To identify the causal variants for BL and KBL, we performed a fine-mapping analysis (Figure 1C,D). The credible sets for BL contained 13 SNPs, while for KBL, there were 35 SNPs. These SNPs represent the smallest sets containing the causal variants. Given their close positions, we combined all SNPs from the credible sets of both traits for linkage disequilibrium and haplotype analyses (Figure 2A). The results showed that these 48 SNPs were in high linkage disequilibrium. Two major haplotypes were present in our study population: the major haplotype with a frequency of 0.452 and the minor haplotype with a frequency of 0.381. The first 45 SNPs of the major haplotype showed the mutant genotype (red), while the last 3 SNPs matched the reference genotype (blue). Further association analysis between haplotypes and phenotypes (Figure 2B,C) showed that the major haplotype significantly increased both BL and KBL. Specifically, individuals homozygous for the major haplotype had an increase of 0.58 cm in BL and 0.26 cm in KBL compared to those homozygous for the minor haplotype. This supports our hypothesis that the lead SNPs cause changes in TFBS.
Explaining phenotypic variation in animals is complex because individual SNPs typically serve as weak instrumental variables for explaining phenotypic differences. However, the genome contains many linked variants, and using haplotypes as instrumental variables can strengthen the association between phenotypes and genetic variation, thereby increasing the reliability of causal inference [37]. Based on the lead SNPs, we identified a haplotype that significantly increased BL and KBL. The identification of this haplotype strengthens the phenotype–genotype association and improves the reliability of causal inference, suggesting that this haplotype is likely to be the causal haplotype responsible for the increase in BL and KBL.

4. Conclusions

This study identified QTL and candidate genes associated with body size traits in Pekin ducks. The results showed that most of the body size-related QTLs were distributed in intergenic and regulatory regions. More importantly, we identified two haplotypes within the XKR4 in Pekin ducks, comprising 48 SNPs. These two haplotypes represent the major variants with a combined frequency of more than 80% and are likely to affect gene regulation by altering transcription factor binding sites. Additionally, we found that the proportion of mutant haplotypes in the population was almost equal to that of wild haplotypes, suggesting that this locus could be a potential candidate marker for future improvement of duck body size.
These findings not only contribute to a better understanding of the genetic basis of body size traits in Pekin ducks but also provide new insights and research strategies for exploring related gene regulatory networks. However, the specific role of these candidate genes or mutations in affecting changes in body size needs to be verified by molecular experiments. Additionally, further investigation into the performance of these haplotypes in different duck breeds and growth stages is necessary to fully understand their role in body size regulation.

Author Contributions

Conceptualization and design of study, Z.-C.H. and F.Z.; methodology and conducting trial, J.-Z.Y. and J.Z.; investigation, J.-Z.Y., J.Z., F.-X.Y. and J.-P.H.; resources, F.-X.Y. and J.-P.H.; data curation, J.Z., F.-X.Y. and J.-P.H.; writing—original draft preparation, J.-Z.Y.; writing—review and editing, Z.-C.H. and F.Z.; visualization, J.-Z.Y.; supervision, Z.-C.H. and F.Z. All authors have read and agreed to the published version of the manuscript.

Funding

This work was supported by the National Key R&D Program of China (2022YFF1000100), the National Natural Science Foundation of China (31572388, 31972525), and China Agriculture Research System of MOF and MARA (CARS-41).

Institutional Review Board Statement

Animal experiments were approved and performed according to the Animal Care and Use Committee of China Agricultural University (permit number: SYXK 2023-0049), (approval date: 9 August 2023).

Informed Consent Statement

Not applicable.

Data Availability Statement

The data used in this study were deposited in the figshare repository (https://doi.org/10.6084/m9.figshare.26056162.v1).

Conflicts of Interest

Author F.-X.Y. and J.-P.H. were employed by the company Beijing Nankou Duck Breeding Technology Co., Ltd. The remaining authors declare that the research was conducted in the absence of any commercial or financial relationships that could be construed as a potential conflict of interest.

References

  1. Jalaludeen, A.; Churchil, R.; Baeza, E. Duck Production and Management Strategies; Springer: Singapore, 2022. [Google Scholar]
  2. Lyu, S.; Arends, D.; Nassar, M.K.; Weigend, A.; Weigend, S.; Wang, E.; Brockmann, G.A. High-density genotyping reveals candidate genomic regions for chicken body size in breeds of Asian origin. Poult. Sci. 2023, 102, 102303. [Google Scholar] [CrossRef] [PubMed]
  3. Gao, Y.; Feng, C.G.; Song, C.; Du, Z.Q.; Deng, X.M.; Li, N.; Hu, X.X. Mapping quantitative trait loci affecting chicken body size traits via genome scanning. Anim. Genet. 2011, 42, 670–674. [Google Scholar] [CrossRef] [PubMed]
  4. Cao, H.; Dong, X.; Mao, H.; Xu, N.; Yin, Z. Expression Analysis of the PITX2 Gene and Associations between Its Polymorphisms and Body Size and Carcass Traits in Chickens. Animals 2019, 9, 1001. [Google Scholar] [CrossRef] [PubMed]
  5. Hong, Y.; Ye, J.; Dong, L.; Li, Y.; Yan, L.; Cai, G.; Liu, D.; Tan, C.; Wu, Z. Genome-Wide Association Study for Body Length, Body Height, and Total Teat Number in Large White Pigs. Front. Genet. 2021, 12, 650370. [Google Scholar] [CrossRef] [PubMed]
  6. Zhou, Z.; Li, M.; Cheng, H.; Fan, W.; Yuan, Z.; Gao, Q.; Xu, Y.; Guo, Z.; Zhang, Y.; Hu, J.; et al. An intercross population study reveals genes associated with body size and plumage color in ducks. Nat. Commun. 2018, 9, 2648. [Google Scholar] [CrossRef] [PubMed]
  7. Deng, M.T.; Zhu, F.; Yang, Y.Z.; Yang, F.X.; Hao, J.P.; Chen, S.R.; Hou, Z.C. Genome-wide association study reveals novel loci associated with body size and carcass yields in Pekin ducks. BMC Genom. 2019, 20, 1. [Google Scholar] [CrossRef] [PubMed]
  8. McCaw, Z.R.; Lane, J.M.; Saxena, R.; Redline, S.; Lin, X. Operating characteristics of the rank-based inverse normal transformation for quantitative trait analysis in genome-wide association studies. Biometrics 2020, 76, 1262–1272. [Google Scholar] [CrossRef] [PubMed]
  9. Chien, L.C. A rank-based normalization method with the fully adjusted full-stage procedure in genetic association studies. PLoS ONE 2020, 15, e0233847. [Google Scholar] [CrossRef] [PubMed]
  10. Shalabi, L.A.A.; Shaaban, Z.; Kasasbeh, B. Data Mining: A Preprocessing Engine. J. Comput. Sci. 2006, 2, 735–739. [Google Scholar] [CrossRef]
  11. Chen, S.; Zhou, Y.; Chen, Y.; Gu, J. fastp: An ultra-fast all-in-one FASTQ preprocessor. Bioinformatics 2018, 34, i884–i890. [Google Scholar] [CrossRef]
  12. Kendig, K.I.; Baheti, S.; Bockol, M.A.; Drucker, T.M.; Hart, S.N.; Heldenbrand, J.R.; Hernaez, M.; Hudson, M.E.; Kalmbach, M.T.; Klee, E.W.; et al. Sentieon DNASeq Variant Calling Workflow Demonstrates Strong Computational Performance and Accuracy. Front. Genet. 2019, 10, 736. [Google Scholar] [CrossRef]
  13. Davies, R.W.; Flint, J.; Myers, S.; Mott, R. Rapid genotype imputation from sequence without reference panels. Nat. Genet. 2016, 48, 965–969. [Google Scholar] [CrossRef]
  14. Purcell, S.; Neale, B.; Todd-Brown, K.; Thomas, L.; Ferreira, M.A.; Bender, D.; Maller, J.; Sklar, P.; de Bakker, P.I.; Daly, M.J.; et al. PLINK: A tool set for whole-genome association and population-based linkage analyses. Am. J. Hum. Genet. 2007, 81, 559–575. [Google Scholar] [CrossRef] [PubMed]
  15. Gao, X.; Starmer, J.; Martin, E.R. A multiple testing correction method for genetic association studies using correlated single nucleotide polymorphisms. Genet. Epidemiol. 2008, 32, 361–369. [Google Scholar] [CrossRef] [PubMed]
  16. Butler, D.; Cullis, B.R.; Gilmour, A.; Gogel, B.J. ASReml-R Reference Manual; The State of Queensland, Department of Primary Industries and Fisheries: Brisbane, Australia, 2009. [Google Scholar]
  17. Zhou, X.; Stephens, M. Genome-wide efficient mixed-model analysis for association studies. Nat. Genet. 2012, 44, 821–824. [Google Scholar] [CrossRef] [PubMed]
  18. Cingolani, P.; Platts, A.; Wang le, L.; Coon, M.; Nguyen, T.; Wang, L.; Land, S.J.; Lu, X.; Ruden, D.M. A program for annotating and predicting the effects of single nucleotide polymorphisms, SnpEff: SNPs in the genome of Drosophila melanogaster strain w1118; iso-2; iso-3. Fly 2012, 6, 80–92. [Google Scholar] [CrossRef] [PubMed]
  19. Grabe, N. AliBaba2: Context specific identification of transcription factor binding sites. In Silico Biol. 2002, 2, S1–S15. [Google Scholar]
  20. Wang, G.; Sarkar, A.; Carbonetto, P.; Stephens, M. A simple new approach to variable selection in regression, with application to genetic fine mapping. J. R. Stat. Society. Ser. B Stat. Methodol. 2020, 82, 1273–1300. [Google Scholar] [CrossRef]
  21. Barrett, J.C.; Fry, B.; Maller, J.; Daly, M.J. Haploview: Analysis and visualization of LD and haplotype maps. Bioinformatics 2005, 21, 263–265. [Google Scholar] [CrossRef]
  22. Dong, S.S.; He, W.M.; Ji, J.J.; Zhang, C.; Guo, Y.; Yang, T.L. LDBlockShow: A fast and convenient tool for visualizing linkage disequilibrium and haplotype blocks based on variant call format files. Brief. Bioinform. 2021, 22, bbaa227. [Google Scholar] [CrossRef]
  23. Patil, I. Visualizations with statistical details: The ‘ggstatsplot’ approach. J. Open Source Softw. 2021, 6, 3167. [Google Scholar] [CrossRef]
  24. Isaac, U.; Nosike, R.; Jonas, E.; Helen Chinweoke, E.; Ezenyilimba, B.; Ibe, S. Heritability of Body Weight and Linear Body Measurements of Isa Brown x Local Chicken Genotypes. Int. J. Agric. Environ. Biores. 2023, 8, 90–102. [Google Scholar] [CrossRef]
  25. Nguyen, T.K.; Lim, J.-H. Tools for Chrysanthemum genetic research and breeding: Is genotyping-by-sequencing (GBS) the best approach? Hortic. Environ. Biotechnol. 2019, 60, 625–635. [Google Scholar] [CrossRef]
  26. Buffalo, V.; Coop, G. Estimating the genome-wide contribution of selection to temporal allele frequency change. Proc. Natl. Acad. Sci. USA 2020, 117, 20672–20680. [Google Scholar] [CrossRef] [PubMed]
  27. Wientjes, Y.C.J.; Bijma, P.; van den Heuvel, J.; Zwaan, B.J.; Vitezica, Z.G.; Calus, M.P.L. The long-term effects of genomic selection: 2. Changes in allele frequencies of causal loci and new mutations. Genetics 2023, 225, iyad141. [Google Scholar] [CrossRef] [PubMed]
  28. Maruoka, M.; Zhang, P.; Mori, H.; Imanishi, E.; Packwood, D.M.; Harada, H.; Kosako, H.; Suzuki, J. Caspase cleavage releases a nuclear protein fragment that stimulates phospholipid scrambling at the plasma membrane. Mol. Cell 2021, 81, 1397–1410.e1399. [Google Scholar] [CrossRef] [PubMed]
  29. Terakado, A.P.N.; Costa, R.B.; de Camargo, G.M.F.; Irano, N.; Bresolin, T.; Takada, L.; Carvalho, C.V.D.; Oliveira, H.N.; Carvalheiro, R.; Baldi, F.; et al. Genome-wide association study for growth traits in Nelore cattle. Anim. Int. J. Anim. Biosci. 2018, 12, 1358–1362. [Google Scholar] [CrossRef] [PubMed]
  30. An, B.; Xia, J.; Chang, T.; Wang, X.; Xu, L.; Zhang, L.; Gao, X.; Chen, Y.; Li, J.; Gao, H. Genome-wide association study reveals candidate genes associated with body measurement traits in Chinese Wagyu beef cattle. Anim. Genet. 2019, 50, 386–390. [Google Scholar] [CrossRef]
  31. Lindholm-Perry, A.K.; Kuehn, L.A.; Smith, T.P.; Ferrell, C.L.; Jenkins, T.G.; Freetly, H.C.; Snelling, W.M. A region on BTA14 that includes the positional candidate genes LYPLA1, XKR4 and TMEM68 is associated with feed intake and growth phenotypes in cattle(1). Anim. Genet. 2012, 43, 216–219. [Google Scholar] [CrossRef]
  32. Porto Neto, L.R.; Bunch, R.J.; Harrison, B.E.; Barendse, W. Variation in the XKR4 gene was significantly associated with subcutaneous rump fat thickness in indicine and composite cattle. Anim. Genet. 2012, 43, 785–789. [Google Scholar] [CrossRef]
  33. Yong, R.; Xiang, C.; Gui-gang, T.; Dong-wei, A.N.; Qi-shun, Z.O.U. Correlation analysis of XKR4 gene polymorphism and growth traits in F3 generation Boza goats. J. South. Agric. 2022, 53, 1752–1758. [Google Scholar] [CrossRef]
  34. Zou, L.; Menon, R.K. A member of the CTF/NF-1 transcription factor family regulates murine growth hormone receptor gene promoter activity. Endocrinology 1995, 136, 5236–5239. [Google Scholar] [CrossRef] [PubMed]
  35. Reumann, M.K.; Strachna, O.; Lukashova, L.; Verdelis, K.; Donnelly, E.; Boskey, A.L.; Mayer-Kuckuk, P. Early growth response gene 1 regulates bone properties in mice. Calcif. Tissue Int. 2011, 89, 1–9. [Google Scholar] [CrossRef] [PubMed]
  36. Toan, N.K.; Tai, N.C.; Kim, S.A.; Ahn, S.G. Soluble Klotho regulates bone differentiation by upregulating expression of the transcription factor EGR-1. FEBS Lett. 2020, 594, 290–300. [Google Scholar] [CrossRef]
  37. Wang, F.; Meyer, N.J.; Walley, K.R.; Russell, J.A.; Feng, R. Causal Genetic Inference Using Haplotypes as Instrumental Variables. Genet. Epidemiol. 2016, 40, 35–44. [Google Scholar] [CrossRef]
Figure 1. GWAS and post-GWAS analysis. The left side of the image represents body length (BL), and the right side represents keel bone length (KBL). (A,B) Manhattan plots of BL and KBL, respectively. the solid lines represent genome-wide significance level threshold lines (p = 1.40 × 10⁻⁷), and the dashed line represents the potential significance level threshold line (p = 2.82 × 10⁻⁶). (C,D) Fine-mapping results of BL and KBL, respectively. The red points represent the lead SNPs, and the points with black outlines represent the SNPs in credible sets. (E,F) Results of TFBS prediction for BL and KBL, respectively. The green bases indicate the reference genotype, while the red bases indicate the mutant genotype.
Animals 14 02349 g001
Figure 2. Linkage disequilibrium and haplotype analysis. (A) The haplotype frequency and linkage disequilibrium block of all 48 SNPs. (B,C) The correlation analysis of BL and KBL, respectively. Homozygous-minor represents individuals homozygous for the minor haplotype; heterozygosis represents individuals heterozygous for the minor and major haplotypes; homozygous-major represents individuals homozygous for the major haplotype; n represents the number of individuals.
Animals 14 02349 g002
Table 1. Heritability estimation and phenotypic statistics.
Traits(h2) 5MeansMinMaxCV 6N 7
BL (cm) 10.45 ± 0.0926.49 ± 1.1623.3029.704.38641
KBL (cm) 20.31 ± 0.0813.58 ± 0.4712.1015.003.48641
NL (cm) 30.37 ± 0.0821.06 ± 0.9418.7023.904.47641
BrW (cm) 40.40 ± 0.0912.00 ± 0.4110.8013.203.46642
Note: 1: BL, body length; 2: KBL, keel bone length; 3: NL, neck length; 4: BrW, breast width; 5: h2, heritability; 6: CV, coefficient of variation; 7: N, the number of individuals.
Table 2. Identification of lead SNPs associated with BL and KBL.
TraitsLead SNPp-ValueRef 1Alt 2MAF 3GeneConsequence 4
BL2:410456102.02 × 10−12CT0.457XKR4Intron variant
KBL2:410410781.21 × 10−7AG0.417XKR4Intron variant
NL23:61028985.24 × 10−7GA0.441-Intergenic variant
BrW2:407131424.00 × 10−7GA0.452PseudogeneDownstream variant
Note: 1: Ref, reference genotype; 2: Alt, mutant genotype; 3: MAF, minor allele frequency; 4: Consequence, the variant type.
Disclaimer/Publisher’s Note: The statements, opinions and data contained in all publications are solely those of the individual author(s) and contributor(s) and not of MDPI and/or the editor(s). MDPI and/or the editor(s) disclaim responsibility for any injury to people or property resulting from any ideas, methods, instructions or products referred to in the content.

