Article

Comparative Analysis of Gut Bacterial Diversity in Wild and Domestic Yaks on the Qinghai–Tibetan Plateau

1
Sichuan Provincial Forest and Grassland Key Laboratory of Alpine Grassland Conservation and Utilization of Tibetan Plateau, Institute of Qinghai–Tibetan Plateau, College of Grassland Resources, Southwest Minzu University, Chengdu 610041, China
2
College of Pastoral Agriculture Science and Technology, Lanzhou University, Lanzhou 730000, China
3
Probiotics and Biological Feed Research Centre, School of Life Sciences, Lanzhou University, Lanzhou 730000, China
4
Animal Husbandry and Veterinary Station, Gangcha County, Haibei 812399, China
5
Key Laboratory of Adaptation and Evolution of Plateau Biota, Northwest Institute of Plateau Biology, Chinese Academy of Sciences, Xining 810008, China
*
Author to whom correspondence should be addressed.
Animals 2024, 14(16), 2380; https://doi.org/10.3390/ani14162380
Submission received: 25 June 2024 / Revised: 1 August 2024 / Accepted: 2 August 2024 / Published: 16 August 2024
(This article belongs to the Section Cattle)

Abstract

:

Simple Summary

Comparative analysis of the gut microbiota in wild grazing (WG) and domestic grazing (DG) yaks reveals distinct differences in bacterial diversity, with WG animals exhibiting a higher diversity than DG animals. Firmicutes dominate both groups, with a greater abundance in the WG type, indicating a stronger fiber-degrading capacity. WG yaks have a higher abundance of Ruminococcaceae and Rikenellaceae families, which are known for their role in fiber degradation, and genus-level differences show a greater presence of fiber-degrading microbes, such as Ruminococcus and Rikenella. In contrast, DG yaks have a higher abundance of Prevotellaceae, Alloprevotella, and Succinivibrio, associated with protein and carbohydrate degradation, reflecting their different dietary habits. These differences in gut microbiota composition suggest that feeding patterns are crucial in shaping the microbial community, influencing yak health and environmental adaptation. The findings presented herein have significant implications for livestock production, highlighting the importance of considering the impact of grazing practices on gut microbiota, and providing valuable insights for developing prebiotics and microbiological agents tailored to specific dietary needs.

Abstract

The gut microbiota is a diverse and complex population, and it has a key role in the host’s health and adaptability to the environment. The present study investigated the fecal bacterial community of wild grazing (WG) and domestic grazing (DG) yaks on natural grazing pastures, analyzing the gut microbiota using 16S rRNA sequencing to assess bacterial diversity. A total of 48 yak fecal samples were selected from two different grazing habitats. The DG group had more crude proteins and non-fiber carbohydrates. The WG group had more OM, insoluble dietary fiber such as NDF, ADF, ether extract, and TC. There were 165 and 142 unique operational taxonomic units (OTUs) in the WG and DG groups, respectively. Shannon index analysis revealed a higher bacterial diversity in the WG group than in the DG group. At the phylum level, Firmicutes were the dominant bacterial taxa in both groups. The relative abundance of Firmicutes in the WG group was higher than in the DG group. At the family level, the WG group had a significantly higher abundance of Ruminococcaceae (p < 0.001) and Rikenellaceae (p < 0.001) than the DG group. The abundances of Alloprevotella and Succinivibrio were more pronounced in the DG group than in the WG group at the genus level. This study presents a novel understanding of the bacterial communities of ruminants and their potential applications for livestock production.

1. Introduction

The Qinghai–Tibetan Plateau (QTP) of China is a vast territory where yaks, cattle, and sheep are the dominant ruminant livestock distributed in a high altitude of 3000 to 5000 m, which covers a region of 2,500,000 km2 [1]. The yak (Bos grunniens) lives in the high altitudes of the QTP where it has been well-adapted to the harsh environmental conditions (e.g., low temperature, low oxygen, strong ultraviolet radiations, and limited poor-quality forage) [2]. Yaks are generously reproducing and living animals in such a crucial environment of the plateau, which was domesticated by nomadic people more than 7300 years ago [3]. Yaks are the only domesticated animals among all the other livestock that can face food shortages and the harsh environment of the QTP [4]. Yaks, an ancient species of bovine, hold significant importance in the lives of local herdsmen and also occupy a vital ecological niche in the plateau’s environment [5]. Yaks provide people living on the plateau with essential resources like meat, milk, fuel, and warm fur [6]. Yak milk contains caseins, which are antihypertensive agents [7]. Yak milk is rich in healthy fats, like linoleic acid, and essential minerals, like phosphorus and calcium. In Tibet, Nepal, and parts of Mongolia, people consume yak milk regularly as a significant part of their diet [8]. Adjacent to productions such as milk and meat, yaks are also used for local herds’ transportation. Therefore, yaks’ productions are of significance in the economy of local people, owing to its uses and being a source of revenue [9,10].
The environment of the QTP is very harsh, mostly in the cold season, because the temperature falls from −5 to −15 °C. During these months (from November to late May) of long snowfall and very cold weather, lesser-quantity and bad-quality grass causes malnutrition and yaks’ retarded growth [11]. Yaks tolerate the harsh conditions with low oxygen because they are endothermic animals. There is no formulated feed provided; although, these yaks are semi-domesticated grazing animals [12]. Early-life malnutrition can disrupt the normal development and functioning of the gut, resulting in growth abnormalities [12,13]. Using various feed additives to enhance the gut health of growth-retarded yaks is crucial for optimal nutrient absorption and normal growth [14]. Research shows that gut bacteria play a crucial role in the health and productivity of farm animals, which is important for agriculture and the economy [15]. The gastrointestinal tract bacterial community plays an important role in the growth and production routine of the animals [16]. The specific bacterial community of the gastrointestinal tract is important for health maintenance and the internal environment of the gastrointestinal tract [15].
The rumen is considered a fermentation tank for anaerobic microbial populations, maintaining the internal environment of their host [17]. The rumen microbial community contains bacteria, fungi, and methanogenic archaea, which produce xylanase and cellulases for the fermentation of complex polysaccharides to generate acetate, butyrate, propionate, and volatile fatty acids (VFAs), which are a major source of energy for the ruminants [18]. There is a symbiotic relationship between the host and the microbial community in the rumen. The host provides nutrients and optimum temperature and moisture for the microbes’ best growth, while microbes synthesize protein and digestive by-products such as VFAs [19], which are considered a major source of energy for the ruminants [20].
Microbial composition and diversity in the rumen of ruminants are not only important for good health and production but also for reducing methane (CH4) emission [21]. Several factors, including age, species, and season, influence the gut bacteria in animals, but diet has the biggest impact [22]. These factors directly or indirectly influence the rumen microbial community, which might change the physiological response of the ruminants [23,24,25]. The microbial community composition in the rumen is dependent on diet and feeding patterns [26].
Moreover, the rumen microbial variations in yaks are dependent on outdoor and indoor grazing patterns [27]. Major bacterial phyla of yak rumens were recorded as Bacteroidetes and Firmicutes, accounting for (~80%), while low abundances of Fibrobacter, Spirochaeta, and Proteobacteria were (<10%) of the total reads [28]. Although, the dominance of major phyla of Bacteroidetes and Firmicutes are diverse for different yaks [28,29]. Under grazing conditions, some studies have shown that 23 phyla, having 159 families in yak rumen fluid, in which Firmicutes account for 46%, are dominant over Bacteroidetes, which have a 40% presence [29], while another study shows Bacteroidetes being dominant over Firmicutes with 52% and 34%, respectively [28].
Research has shown that what yaks eat and where they live (at high or low altitudes) can change the balance of gut bacteria [13,30], but more study is needed to understand how these factors affect their gut health. In particular, few studies have explored how environmental changes affect forage quality and gut microbes in wild and domesticated yaks.Therefore, we used next-generation sequencing to investigate and compare the gut microbiomes of wild and domestic yaks that graze on the same land to identify key differences. We hypothesized that the evolutionary variation of yaks according to climatic changes and pasture forage induces adaptive alterations in the fecal microbial composition. This longitudinal study to evaluate environmental changes in gut microbiota even offers information that could help to improve yak productivity and safety.

2. Materials and Methods

2.1. The Experimental Site, Animals, and Management

This animal study was reviewed and approved by the Ethics Committee of the College of Ecology, Lanzhou University, Lanzhou, Gansu, China.
A total of 48 samples were collected from wild grazing and domestic grazing yak groups with different feeding styles and geographical locations (climatic changes) during October 2017. Fecal samples were collected from two groups with different altitudes in Datong County (elevation, 3200 m) and Haixi prefecture (2994 m), respectively, in Qinghai Province, and we used 16S rRNA sequencing on 24 wild grazing yaks in Datong County (WG) and 24 domestic grazing yaks in Haixi prefecture (DG). After the yaks defecated, we used clean cotton swabs to collect feces from the outside and inside of the droppings. We then placed the swabs in sterile tubes, froze them in liquid nitrogen, and stored them at a very low temperature (−80 °C) for further analysis in the laboratory. The WG yak group was randomly selected from a herd with unrestricted access to natural alpine pasture for 24 h a day, while the DG group was selected from a herd of 200 animals that only grazed in the natural alpine pasture from 7 a.m. to 6 p.m. in the daytime. Both groups had free access to water.
Forage collection was also performed in the same month and year, October 2017, from two geographical locations in Qinghai Province: Datong County (elevation: 3200 m) and Haixi prefecture (elevation: 2994 m). Two groups of yaks were selected, wild grazing (WG) and domestic grazing (DG), with 24 individuals in each group. Forage samples were collected from these areas, respectively, representing their diet.
For the WG group, forage collection was performed in the natural alpine pasture where the yaks grazed freely for 24 h a day. For the DG group, forage collection was performed in the natural alpine pasture where the yaks grazed from 7 a.m. to 6 p.m. The pastures in the area for the DG group were dominated by herbage species of Kobresia humilis, Elymus nutan, Kobresia pygmaea, Anaphalis lacteal, Polyginum viviparum, Potentilla fruticose, Cortaderia jubata, and Sibiraea angustata, while the pastures in the area for the WG group were dominated by herbage (sedge and grass) species of Kobresia humilis, K. pygmaea, K. graminifolia, Elymus nutan, Polygonum viviparum, Anaphalis lacteal, and also some shrub species, with Potentilla fruticos, Sibiraea angustata, and C. jubata as the dominant non-herbaceous vegetation types.

2.2. Determination of Nutritional Composition of Experimental Forages

At 65 °C for 72 h, pasture herbages were dried in an oven, minced, and then passed through a sieve of 1 mm. The measurement of dry matter (DM) was completed by (AOAC, 930.15) at 135 °C for 3 h. The Kjeldahl method (AOAC, 984.13) was used to determine nitrogen using an automatic steam distillation unit, specifically the Kjeltec 2300 Analyzer, manufactured by FOSS, a renowned company based in Hillerød, Denmark. Titration was performed using 0.1 M hydrochloric acid and 1% boric acid. Photometrically, we determined the endpoint. We used nitrogen content multiplied by 6.25 (CP = N × 6.25) to find the crude protein (CP) value. The levels of neutral detergent fiber (NDF) and acid detergent fiber (ADF) were analyzed following the procedure outlined by Goering and Van Soest (1970) [31]. In the NDF method, sodium sulfite was used and values were confirmed for ash contents. Ash content calculation was completed through AOAC, 942.05 [32].

2.3. DNA Extraction, PCR Amplification, and MiSeq Sequencing of 16S rRNA Gene Amplicons

A total of 48 fecal samples were thoroughly mixed, and then DNA was extracted from a small amount of each sample (about 0.2–0.3 mg) using a special buffer and a machine that shakes the mixture (called a bead beater). DNA extraction from fecal samples was performed using the QIAamp DNA Stool Mini Kit (Qiagen, Hilden, Germany). The quality and quantity of the extracted DNA were then assessed using the NanoDrop 2000 spectrophotometer (Thermo Fisher Scientific, Waltham, MA, USA). The DNA samples were then adjusted to a concentration of 80 ng/μL before being amplified by PCR. The universal primers 338F (5′-ACTCCTACGGGAGGCAGCAG-3′) and 806R (5′-GGACTACHVGGGTWTCTAAT-3′) were used to amplify the V3-V4 hypervariable region of the 16S rRNA gene in bacterial DNA [33]. The PCR amplification protocol consisted of an initial denaturation at 94 °C for 90 s, followed by 30 cycles of denaturation at 94 °C for 40 s, annealing at 56 °C for 60 s, and extension at 56 °C for 60 s, with a final extension at 72 °C for 10 min. The PCR products were then gel-purified using the GeneJET Gel Recovery Kit (Thermo Scientific, Waltham, MA, USA) according to the manufacturer’s instructions. The purified amplicons were subsequently used for library construction and sequenced on an Illumina MiSeq system using the MiSeq Reagent Kit v2 (2 × 250 bp, Illumina, San Diego, CA, USA).

2.4. Sequencing and Data Processing

The QIIME (Quantitative Insights into Microbial Ecology) version 1.7.0 program was used for the organized raw sequence analysis [34]. The barcodes, primer sequences, and low-quality sequences were reduced after sequencing [35]. To obtain efficient tags, the obtained chimera sequences were removed from the dataset using the UCHIME Algorithm with reference to the Gold database [36]. After the process of removing singletons and performing quality control, the SILVA database was used to combine optimized sequence reads, and Release128 http://www.arb-silva.de (accessed on 1 August 2024) was used to cluster effective tags into OTUs with 97% sequence similarity [37,38]. Through representative sequence analysis, the Greengenes database was used for the identification of bacterial taxa [39]. By using QIIME software Version 1.9.1, http://qiime.org/ (accessed on 1 August 2024), Alpha indices such as Chao1, ACE, Simpson, Shannon, and Good’s coverage of bacterial diversity were identified for different treatment groups from whole OTUs table. Meanwhile, to assess the whole structural changes of fecal bacterial communities, the β-diversity of bacteria in the WG and DG groups was visualized using non-metric multidimensional scaling (NMDS) analysis based on ANOSIM and the Bray–Curtis dissimilarity matrix in vegan and ggplot2 packages of R4.1.2. GraphPad Prism version 8.00 for Windows https://www.graphpad.com/ (accessed on 1 August 2024) software was used for the correlation heat map. A co-occurrence network analysis was constructed based on significant genera (p < 0.05) with abundance > 0.001 and R-value> 0.4. The co-occurrence network was visualized in Gephi. “Venn Diagram” in R was used for identification of unique and shared OTUs between the WG and DG groups.

2.5. Statistical Analysis

Student’s t-test in SPSS 16.0 software (SPSS Inc., Chicago, IL, USA) was used to compare the nutrient content of natural pasture grasses. The Wilcoxon rank-sum test with false discovery rate (FDR) correction was employed to identify significant differences in alpha diversity and relative abundances of bacterial phyla, families, and genera. Principal Component Analysis (PCA) was performed using R studio, and the anosim function from the vegan package was used to investigate group-wise differences. Significance was set at p < 0.05, and p-values were adjusted using FDR to minimize false positives.

3. Results

The chemical composition of forages in the domestic grazing (DG) and wild grazing (WG) pastures is shown in Table 1. While the dry matter, organic matter, ash, and hemicellulose content were similar in both groups, the DG pasture had significantly higher (p < 0.05) crude protein and non-fiber carbohydrate content compared to the WG pasture. In contrast, the WG pasture had significantly higher (p < 0.05) levels of organic matter, insoluble dietary fiber (NDF and ADF), ether extract, and total carbohydrates (TC) compared to the DG pasture.

3.1. Analysis of Sequencing Data and Bacterial Diversity

In total, 4,002,704 raw reads were generated from bacterial 16S rRNA sequencing of 48 samples. After filtering, quality control, and chimera removal, 3,747,261 sequences were obtained with a mean length of 413 bp. The rarefaction curve plateaued, indicating that the number of operational taxonomic units (OTUs) had stabilized and was no longer increasing with additional sequencing data, suggesting that the current dataset was comprehensive and sufficient for analysis. The Good’s coverage of samples was 96.8%, suggesting that maximum bacterial diversity in the samples was recovered (Figure 1A). The OTU analysis revealed 2756 shared OTUs between the two groups, while 165 OTUs were exclusively found in the wild grazing (WG) group, and 142 OTUs were exclusively found in the domestic grazing (DG) group (Figure 1B).

3.2. Alpha Diversity
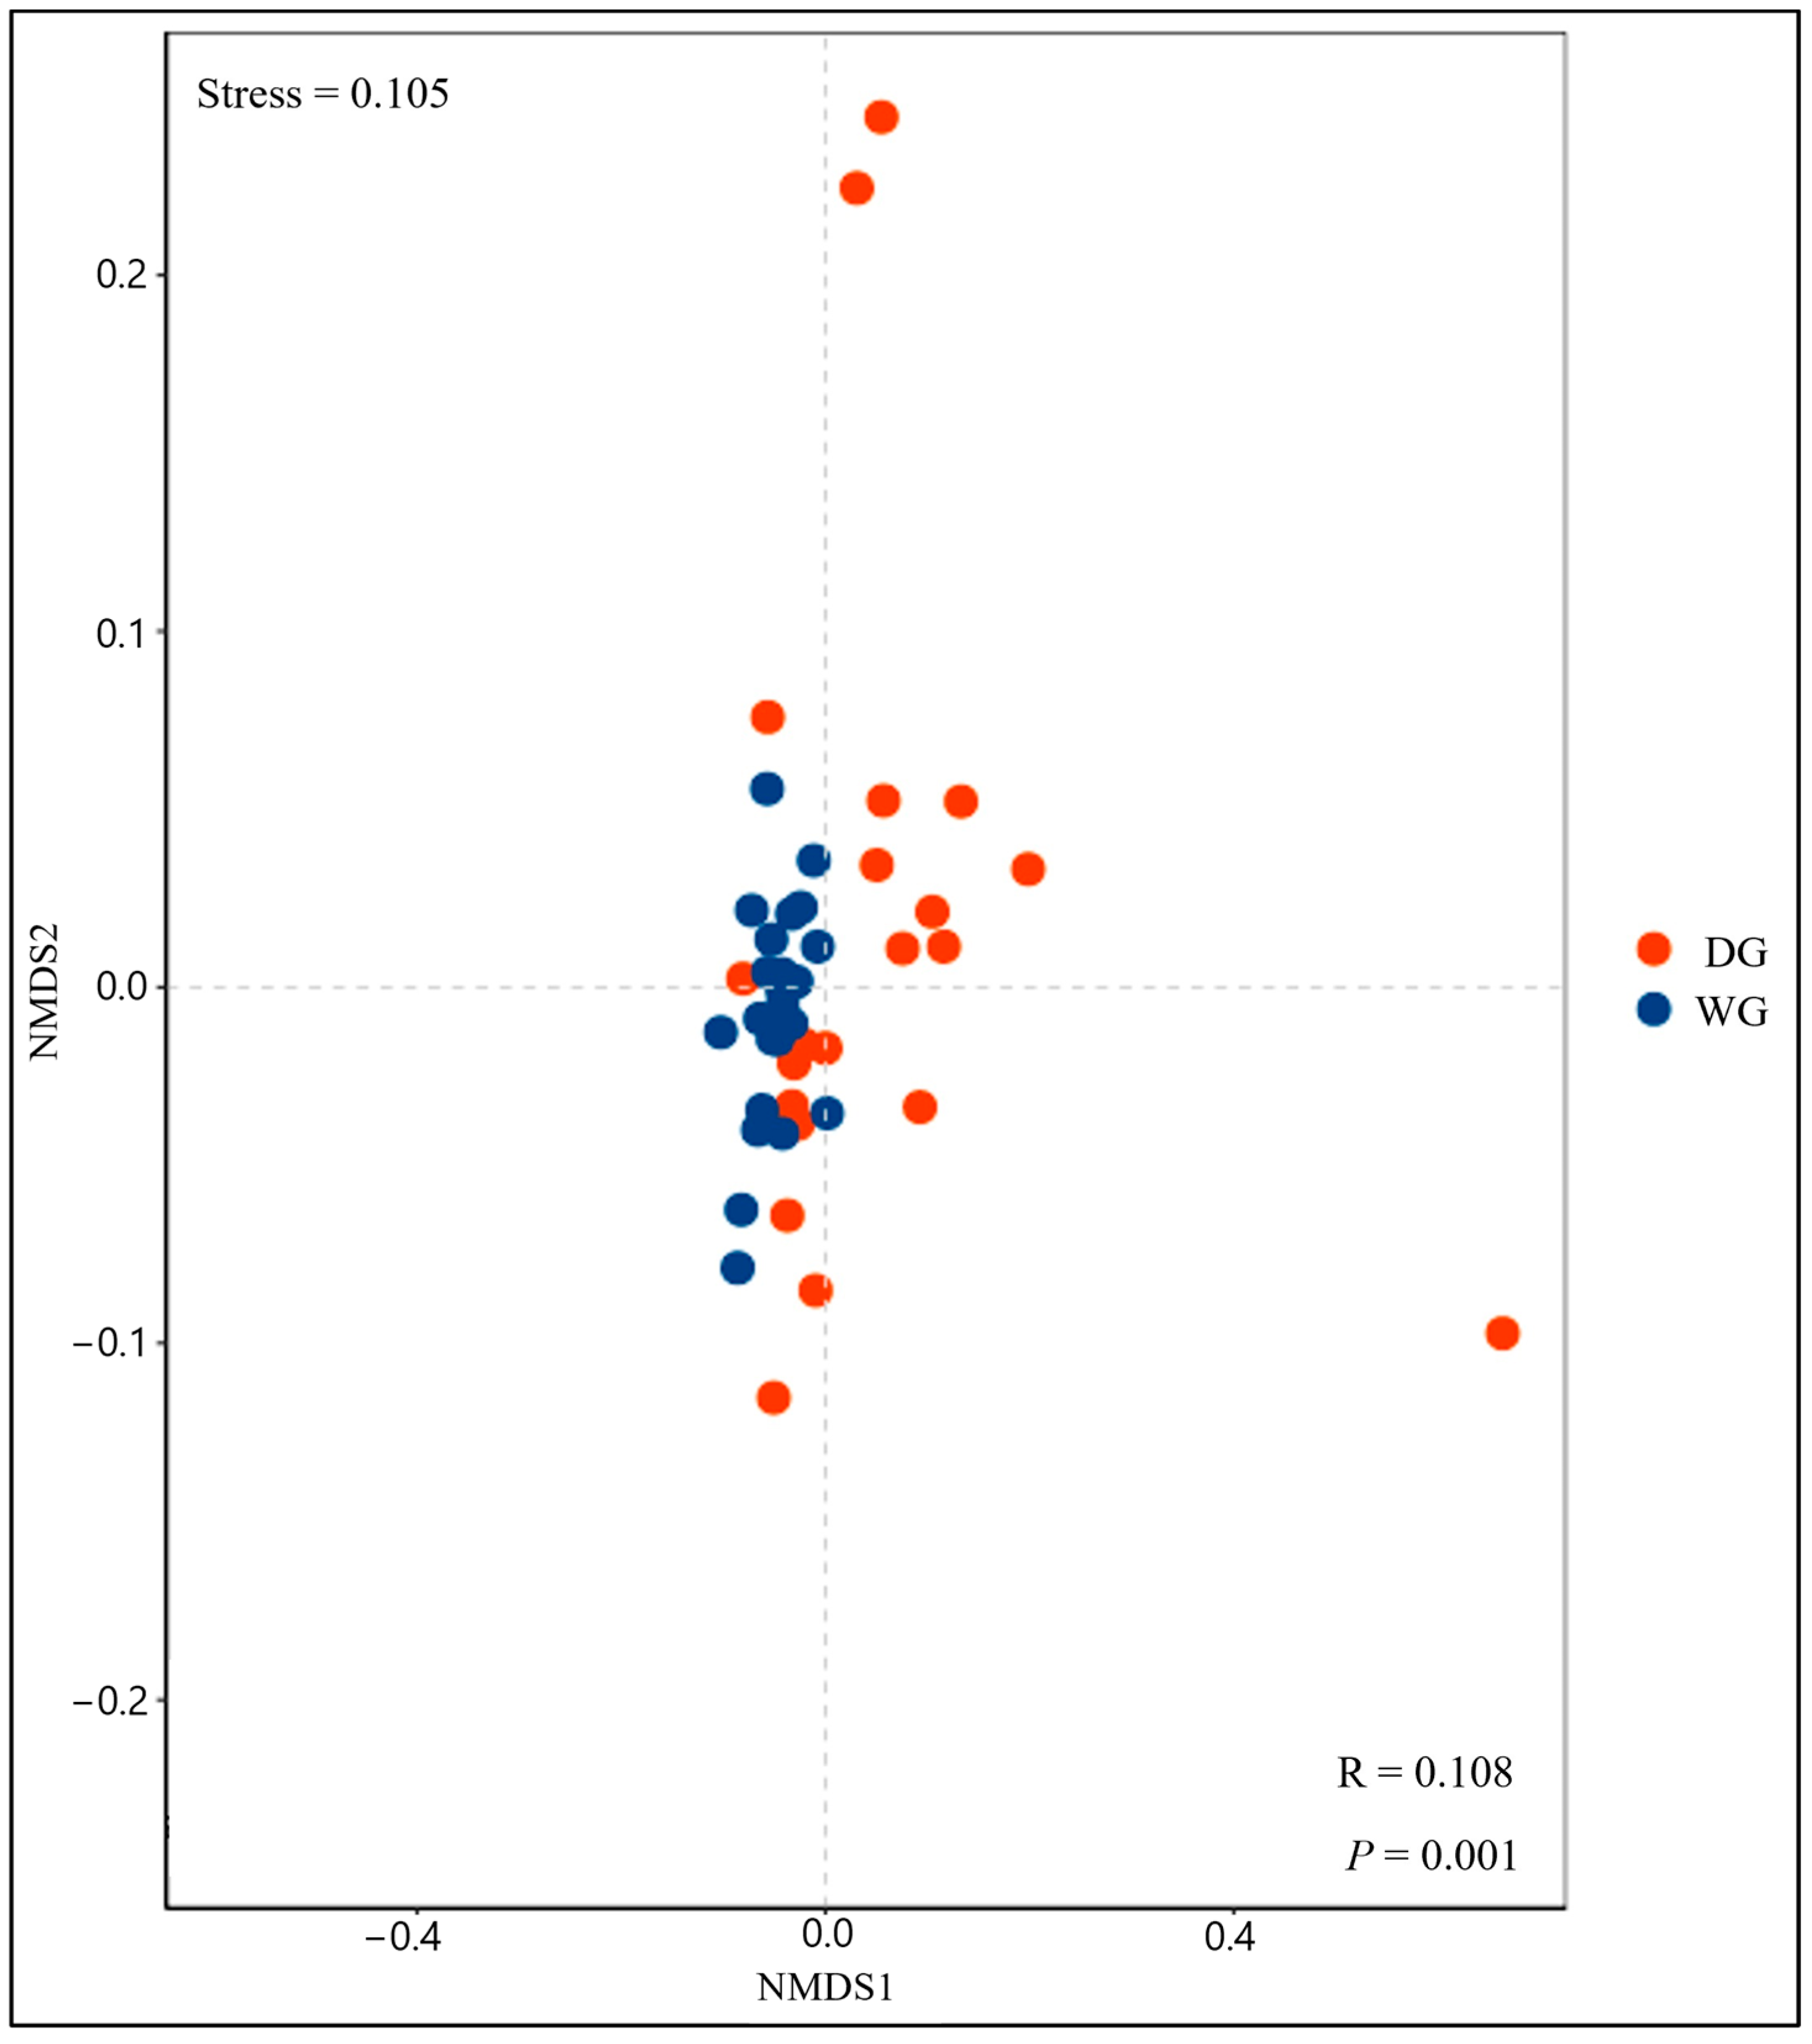
The alpha diversity was evaluated using four metrics: the Abundance-based Coverage Estimator (ACE), the Chao1 index, the Shannon index, and the Simpson index. The WG group showed significantly higher (p < 0.005) ACE and Chao1 index values (1426.11 ± 80.86 and 1414.86 ± 85.60, respectively) compared to the DG group (1277.99 ± 232.44 and 1273.22 ± 238.97, respectively). The Shannon index (8.37 ± 0.22) was higher (p < 0.04) in the WG group than for the DG group (8.13 ± 0.51), whereas the Simpson index did not differ (p < 0.69) between the WG (0.99 ± 0.00) and the DG (0.99 ± 0.00) groups, as presented in (Figure 2A,B).

3.3. Beta Diversity

Non-metric multidimensional scaling (NMDS) analysis revealed that the WG and DG groups formed distinct bacterial clusters in the ordination space (Figure 3), with significant differences at the taxonomic level (p < 0.001). However, the bacterial communities of the DG group were more scattered as compared to the WG group, indicating the dissimilarity of the taxonomy between the two groups.

3.4. Gut Bacterial Composition

The taxonomic analysis showed that the yak gut bacterial community comprised 24 phyla and 228 genera in the groups. The dominant bacterial phyla in the DG group were Firmicutes (57.20% ± 0.05%), Bacteroidetes (35.90% ± 0.05%), and Proteobacteria (2.91% ± 0.02%), whereas, in the WG group, the dominant phyla were Firmicutes (60.76% ± 0.04%), Bacteroidetes (32.80% ± 0.04%), and Proteobacteria (2.31% ± 0.03%) (Figure 4A). Firmicutes in the WG group were significantly higher (p < 0.02) than in the DG group, but Bacteroidetes in the DG group were significantly higher (p < 0.05) than in the WG group, while no significant variations were recorded for Proteobacteria between the WG and DG groups. Elusimicrobia, Fusobacteria, Kiritimatiellaeota, and Fibrobacteres were less abundant phyla, and their relative abundance in the WG group was significantly higher (p < 0.05) than the DG group. The relative abundance of gut bacterial communities at the phylum level in the WG and DG groups is presented in (Table 2).

3.5. Relative Abundance of Bacterial Families

At the family level, 129 families were identified in both the DG and WG yak groups. The major and dominant families in the DG and WG groups are presented in (Figure 4B). The most abundant families in the DG group were Ruminococcaceae (38.98% ± 0.07), Rikenellaceae (15.63% ± 0.04), Lachnospiraceae (9.11% ± 0.03), Bacteroidaceae (5.59% ± 0.01), Prevotellaceae (3.74% ± 0.01), and Succinivibrionaceae (1.32% ± 0.02), which accounted for (74.3%) of the total microbial population. Ruminococcaceae (46.29% ± 0.04), Rikenellaceae (14.78% ± 0.02), Lachnospiraceae (5.51% ± 0.01), Bacteroidaceae (4.97% ± 0.01), Prevotellaceae (2.16%), and Succinivibrionaceae (0.79% ± 0.03) were identified in the WG group, accounting for (74.5%) of the total fecal microbiota. Ruminococcaceae were significantly higher (p < 0.001) in the WG group than in the DG group, whereas Prevotellaceae and Muribaculaceae were significantly higher (p < 0.05) in the DG group than in the WG group. Bacteroidaceae and Rikenellaceae did not differ (p > 0.05) between groups. Some other families were also detected, but their abundance was quite low. The relative abundance of gut bacterial communities at the family level in the WG and DG groups are presented in (Table 3).

3.6. Relative Abundance of Bacterial Genera

To further explore the microbial abundance, classification was performed at genus level. The most dominant genus in the DG group was Bacteroides (5.59% ± 0.01), with Alistipes (5.28% ± 0.01), Alloprevotella (1.63% ± 0.01), and Ruminobacter (1% ± 0.02) accounting for (13.5% ± 0.01) of all genera (Figure 4C), while the dominant genera of the WG group were Alistipes (5.62% ± 0.01), Bacteroides (4.97% ± 0.01), Alloprevotella (0.99%), and Ruminobacter (0.72% ± 0.03), which accounted for (12.3% ± 0.01). Other dominant genera of the DG and WG groups included: Succinivibrio (0.29% ± 0.005) and (0.06%), Faecalibacterium (0.12% ± 0.002) and (0.06%), Mailhella (0.76% ± 0.004) and (1.06% ± 0.003), and Tyzzerella (0.36% ± 0.001) and (0.44% ± 0.001), respectively. Variations in the relative abundance of the top 20 genera in two groups, the DG and the WG, were examined. The abundance of Alloprevotella and Succinivibrio was not significantly (p < 0.06) higher in the DG group compared to the WG group. However, the abundance of Mailhella was significantly (p < 0.01) higher in the WG group compared to the DG group. The relative abundance of Ruminobacter, Faecalibacterium, Bacteroides, Anaerovibrio, Alistipes, and Tyzzerella had no significant difference displayed between the WG and DG groups. The relative abundance of gut bacterial communities at the genus level in the WG and DG groups is presented in (Table 4).
Significant inter-individual variability was observed in the prokaryotic community composition at the phylum, family, and genus levels. To identify distinct microbial communities between the wild grazing (WG) and domestic grazing (DG) groups, Linear Discriminant Analysis Effect Size (LEfSe) was performed, including Linear Discriminant Analysis (LDA). The results revealed that the WG group was characterized by the presence of Oscillibacter, Ruminiclostridium, and Spirochaetes as biomarker taxa, whereas the DG group was distinguished by the presence of Agathobacter, Aeromonadales, and Paeniclostridium as biomarker taxa (Figure 5A,B).

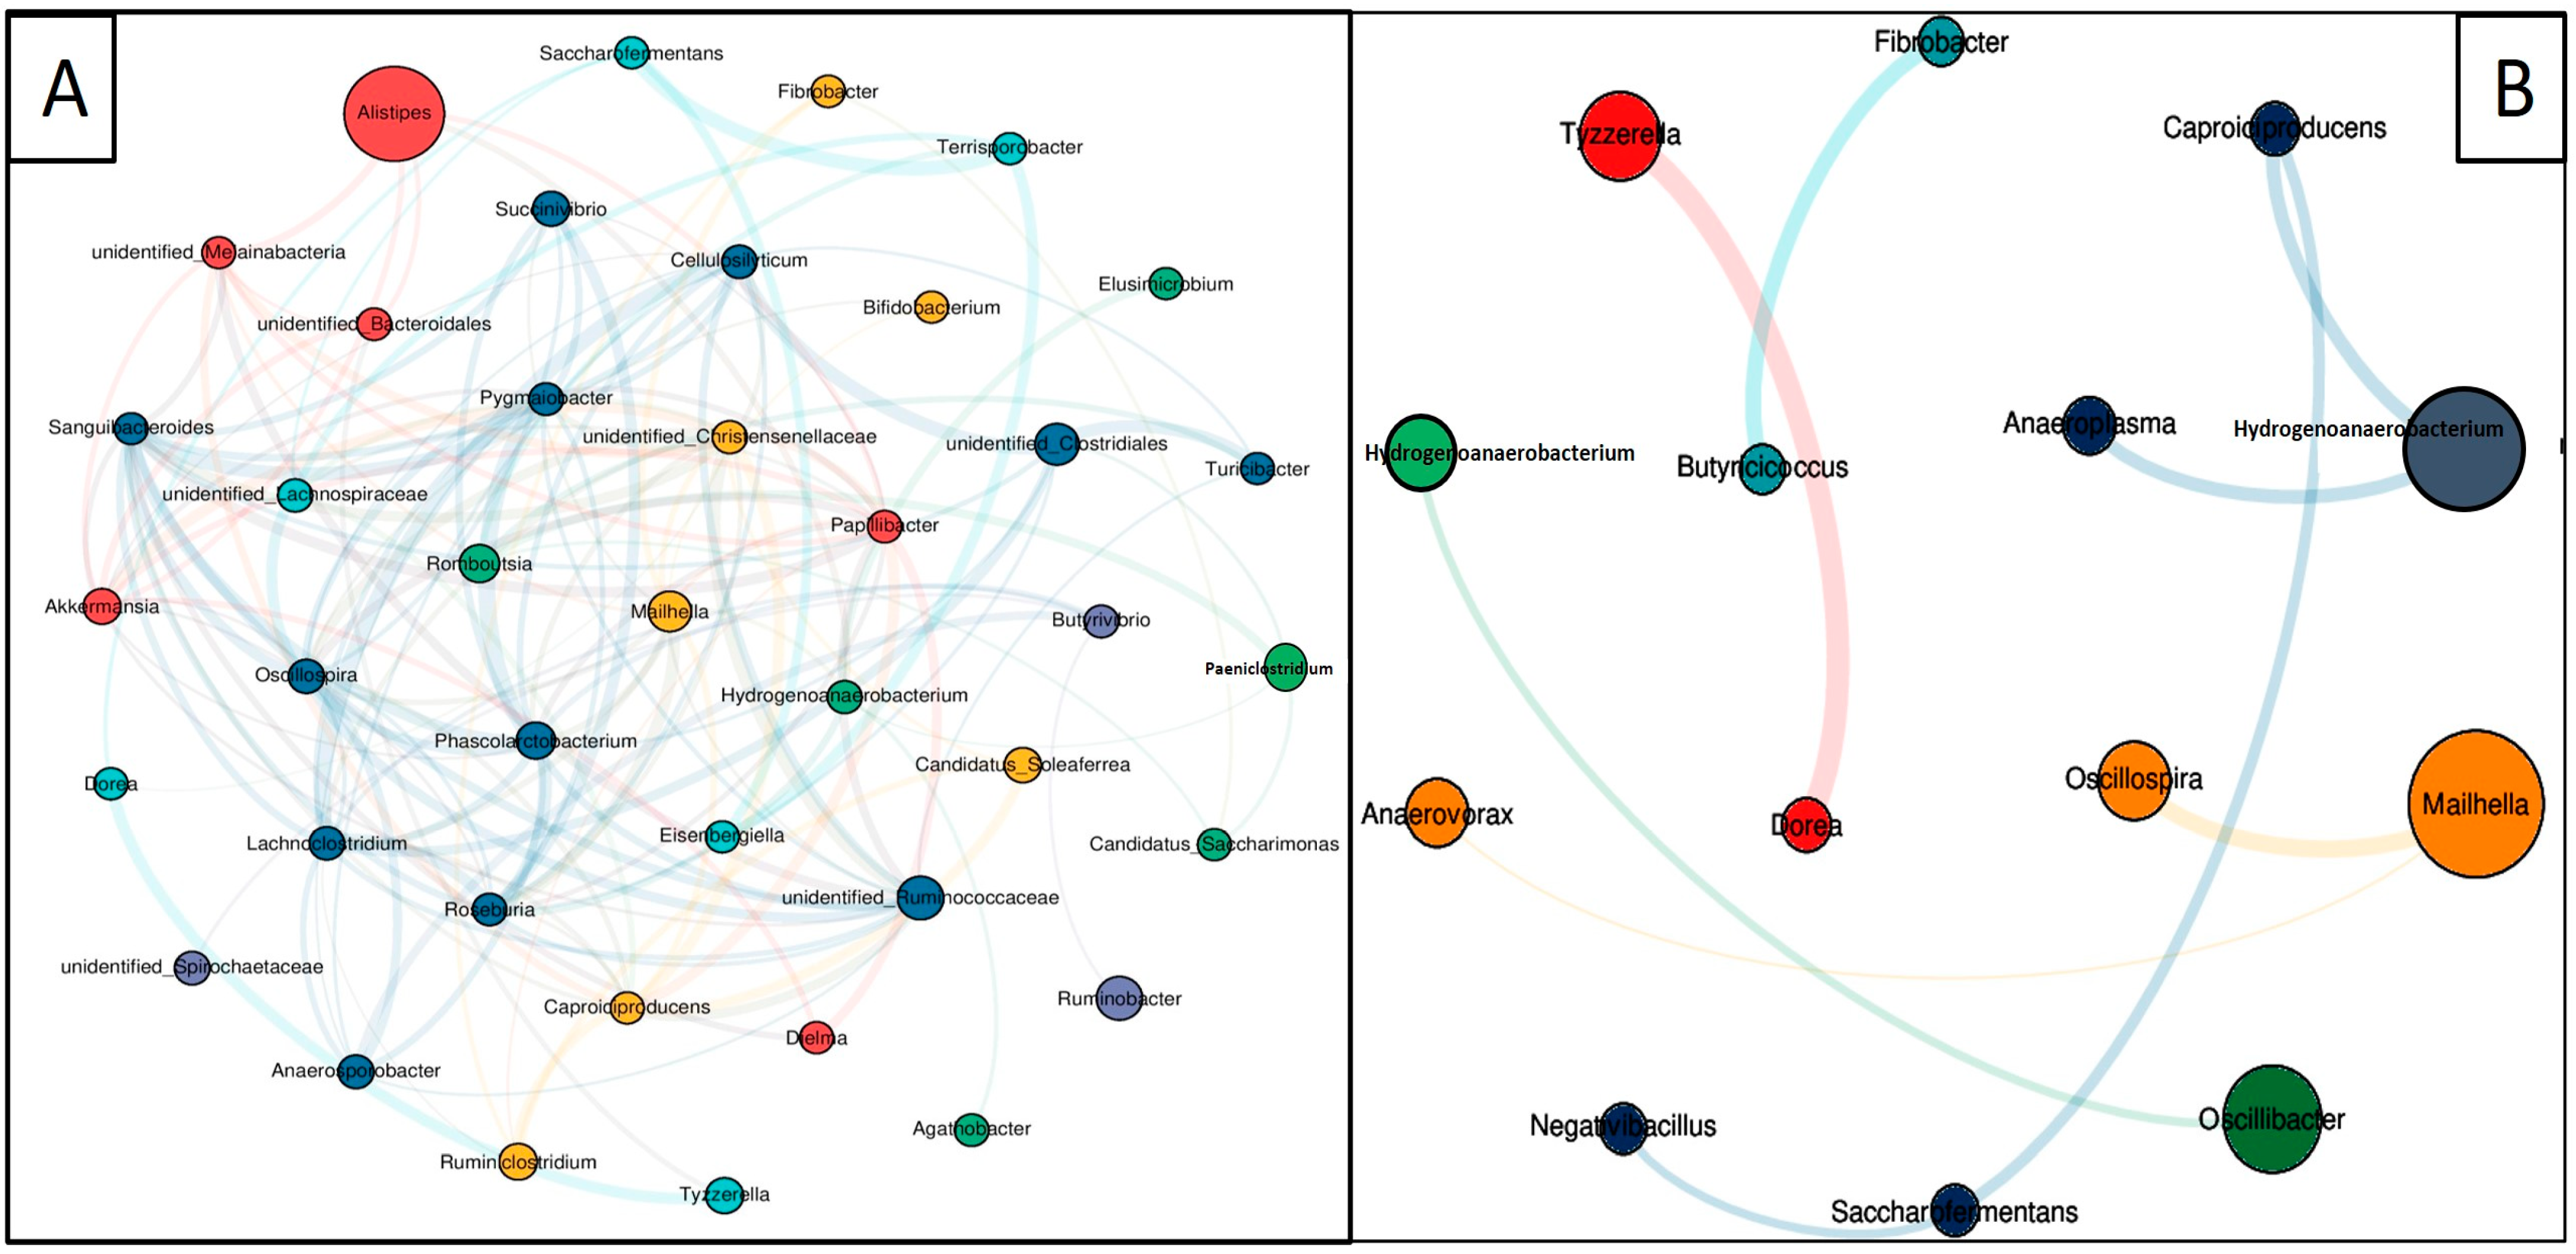
3.7. Co-Occurrence Network Analysis

A co-occurrence network was constructed based on significant genera (p < 0.05), using Spearman’s test and an abundance of more than 0.001 and R-value (R < 0.04) to get insight into the potential mutualistic interaction of bacteria within each group (Figure 6A,B). The co-occurrence network of the DG group displayed that bacterial community complexity was at the peak in the DG group, as evident by the high number of nodes and edges. The total numbers of nodes and edges in the DG group were 40 and 146, and the numbers of positive and negative interactions were 86 and 60, respectively, while the co-occurrence network of the WG group displayed that the total numbers of nodes and edges in the WG group were 14 and 9, and the numbers of positive and negative interactions were 6 and 3, respectively (Table 5).

4. Discussion

Ruminants digest forage and other feedstuffs with the help of rumen microbiota to gain energy and other nutrients required for their growth and body maintenance [40]. The body’s immune system, physiological metabolism, nutritional absorption, growth, and development are all strongly correlated with intestinal flora. Numerous studies demonstrate that domestic yaks or domestic grazing yaks are inferior to wild yaks in many ways. To increase domestic yaks’ ability to produce, it is crucial to understand the structure of their intestinal bacterial flora. Previously, dozens of studies have explored patterns, associations, and the characterization of rumen microbial community structure in different environments and under different feeding systems to find similarities, variations, and associations between yaks and their rumen microbial communities. However, the gut bacterial community differences between wild grazing and domestic grazing yaks remain unclear. In the present study, we explored shifts in the gut bacterial communities of yaks influenced by the environment and herbage of pasture variations.

4.1. Forage Quality and Microbial Diversity

The ash, dry matter, and hemicelluloses contents of forages available to both the wild grazing and domestic grazing groups were the same. The free-range grazing pasture forages had higher levels of OM, poorly fermentable dietary fiber, including NDF ADF, and TC compared to the domestic grazing pasture forages. The variation in the chemical composition of forages is related to different factors such as plant species, diversity, ripeness, or growth stages [41], drying method, growth environment [42], and the kind of soil [43]. The bacterial diversity was higher during January, as the forage was dried and the NDF and ADF values were higher, as previously reported [44]. Alpha diversity analysis (using ACE, Chao1, and Shannon indices) demonstrated that the WG group had a more diverse fecal bacterial community compared to the DG group. This is consistent with existing research, which has found that high-fiber diets support more robust microbial populations, likely due to the superior ability of fiber fermentation to stimulate microbial growth compared to starch fermentation [45,46]. Fiber-based diets work well as prebiotics, as they contain more secondary plant compounds which assist in the enhancement of bacterial diversity [44,47].

4.2. Differences in Gut Mircobiota

In the present study, the WG yaks have different gut bacterial communities than the DG group, as they closely same the natural composition of forages, featuring similar levels of sugars, oligosaccharides, and peptic polysaccharides, which have been identified as crucial ingredients. Interestingly, the WG group exhibited an increase in the beta diversity of gut bacterial communities. Notably, the forage in both the WG and DG groups had similar hemicellulose content and higher digestible dry matter and crude protein levels, which may have contributed to the growth of the microbial community. Additionally, factors such as forage varieties, grazing patterns, environmental changes, and biomass may also play a role in shaping the diversity of the microbial communities in yaks [48].

4.3. Phylum-Level Bacterial Composition

At the phylum level, significant environmental, climatic, and some forage variations were observed in the rumen bacterial composition. Bacteroidetes and Firmicutes were the two dominant phyla in yak fecal samples, and many studies showed that Bacteroidetes and Firmicutes were the dominant phyla in yak rumen [49,50] and other ruminants [51,52]. The occurrence of these two dominant phyla in the rumen of yaks and many ruminants stipulates their biological and functional consequences. The main function of Bacteroidetes is the degradation of carbohydrates, proteins, and fats to produce energy, while Firmicutes are responsible for the generation of volatile fatty acids by the degradation of starch, cellulose, hemicelluloses, and oligosaccharide [53]. We observed a high abundance of Firmicutes in the fecal samples of the WG group, while the ratio of Bacteroidetes was higher in the DG group’s fecal sample, which indicates high fiber and low CP content in pasture herbage with a high abundance of Bacteroidetes, while high quality increased the abundance of Firmicutes in the rumen of yaks, as reported previously [54]. Both of these phyla displayed opposite trends as they changed location and forage nutrients; Firmicutes’ abundance was increased, while Bacteroidetes were decreased.
These variations might be related to nutrient contents, location, and grazing pattern. Evaluation of climatic changes, forage nutrients, and altitude changes by differences in relative abundance at phylum level could better indicate phylum-specific functionalities of the bacterial community among the WG and DG groups. In this study, yaks had sparkling grass with greater CP and less crude fibers (NDF and ADF) during the growing period, while dry and snow-included grass was present in the course of the withering duration, which may have led to one-of-a-kind bacterial compositions at the phylum level. Changes in the relative abundances of Firmicutes and Bacteroidetes show the adaptation of the yak to climatic changes and forage nutrients, while an increase in Firmicutes and a decrease in Bacteroidetes was reported in yaks, which is consistent with our results [28]. Other studies also concluded that variations in diet, climate, and grazing pattern are also responsible for the Bacteroidetes’ or Firmicutes’ dominancy [24]. However, in a firm geographical area, diet composition and host species had little influence on the prevailing point of these two bacterial phyla [55].
Moreover, the Firmicutes-to-Bacteroidetes proportion plays a vital role in assessing the consequences of gut bacterial effect on host energy provisions [56]. In the present study, the Firmicutes-to-Bacteroidetes ratio in the WG group was noticeably higher than in the DG group. Therefore, yaks fed with no time restriction in natural grazing environments obtained more energy at ease, which is considered important for body metabolism. According to previous findings, the Firmicutes-to-Bacteroidetes ratio is associated with roughage proportion and milk-fat yield [57]. Some studies have reported that the ratio of Firmicutes were greater in Qinghai–Tibetan Plateau (QTP) sheep than plain land sheep and goats. The role of Gram-positive bacteria is very important in the digestion of existing grasses at the QTP [58]. These findings are consistent with the present study, as the location and grazing pattern changes might have preceded the ratio of Firmicutes in the WG and DG groups. Favorable conditions for Firmicutes’ proliferation are dependent on environmental changes, forage worth, and varieties of available forage. In this study, a higher abundance of Firmicutes is related to different factors, such as location [58], age [59], and diet [60]. According to previous findings, Firmicutes’ abundance is directly proportional to an increase in starch and fat-rich high-energy diets [61]. Consistent with previous research, the dominant bacterial phyla in the rumen of grazing yaks in the QTP were found to be Firmicutes, Bacteroidetes, and Proteobacteria [55,58,62]. Our study’s results are in agreement with previous findings, showing that Firmicutes, Bacteroidetes, and Proteobacteria were the dominant phyla in both the WG and DG groups. We also found that their abundances were influenced by dietary patterns and environmental factors, as previously reported [58,60].

4.4. Family-Level Bacterial Composition

The predominant families in the WG and DG groups were Ruminococcaceae, Rikenellaceae, Lachnospiraceae, Bacteroidaceae, Prevotellaceae, and Succinivibrionaceae, with Ruminococcaceae being more abundant in the WG group than the DG group. These bacterial families are crucial for fiber and starch degradation, as well as enhanced fiber digestibility [63]. In the grazing pasture, the available high-quality forages and a sufficient amount of nutrients enhanced the quantity of fiber-degrading bacteria such as Ruminococcaceae and Rikenellaceae. Similar studies have reported that Ruminococcaceae is responsible for the degradation of proteins [64]. Lachnospiraceae play a crucial role in the growth stimulation of fibrolytic bacteria found in Holstein cows’ rumens, as reported previously [65,66]. This study also reported that Prevotellaceae lowers the nitrogen thrashing, produces acetate as the fermentation final product, and improves forage consumption [67]. In the present study, Rikenellaceae, Lachnospiraceae, and Succinivibrionaceae in the DG group were higher than in the WG group. This study reported that Prevotellaceae is a dominant bacterium of the saccharolytic group in the rumen and is also important for its protein binding capacity and also digestion of several carbohydrate substrates [68]. The Prevotellaceae in feces of the yaks with high abundance indicated high carbohydrate degradation capability. Previous studies have reported that Ruminococcaceae, Rikenellaceae, and Prevotellaceae are considered as the most important families for forage degradation in the rumens of ruminants until these bacteria tightly stick to forage grass after staying in the rumen [69,70]. These findings are consistent with the present study; a higher ratio of Ruminococcaceae and Rikenellaceae in the WG and DG groups, respectively, are anticipated to improve fiber degradation.

4.5. Genus-Level Bacterial Composition

At the genus level, among the dominant genera, Bacteroides, Alistipes, Alloprevotella, Ruminobacter, Succinivibrio, and Faecalibacterium were the most dominant genera in the WG and DG groups. In the rumens of ruminants, Ruminobacter is important for degrading starch into acetate and propionate [71]. In the rumen of Holstein cows, the abundance of this genus has been reported to be linked with concentrate diet [72], which is in concordance with our results. Succinivibrio is a starch-degrading bacterial genus that makes primarily acetate and succinate. Prevotella, belonging to Alloprevotella, has been characterized by huge genetic variance and possesses efficient adaptability [73], which is important for preliminary dietary protein breakdown [74], starch degradation, proficient utilization of hemicelluloses [75], and peptide metabolism [76]. Alloprevotella has the same work flexibility as Prevotella. Alloprevotella, Ruminobacter and Succinivibrio, all three dominant genera, boost fiber degradation. The most dominant and important bacterial genus, Bacteroides, in the intestinal microbial population of diarrheal yaks, can sop up the nutrients and make short-chain fatty acids (SCFAs) [77], helping in recovering and enhancing the maturation of epithelial cells associated with the fat’s metabolism. Moreover, an Alistipes commensal bacterial genus has the maximum quantity of putrefaction. Putrefaction is a process in which the undigested protein fermentation occurs in the gastrointestinal tract by the gut microbiota and produces harmful metabolites [78]. Our study showed that the Alistipes genus is less dominant, having no significant differences between two groups. Faecalibacterium produce butyrate to support the safeguarding of intestinal mucosa [79] and shield them from inflammation [80].
Many proteins are encoded by Bacteroides and also have the ability to carry out complex carbohydrates and degrade them [68]. Bacteroides and Faecalibacterium help in making SCFAs, which leads in balancing the gut microbe’s structure in yaks and also helps in maintaining the intestinal epithelium. In the current study, Alloprevotella and Succinivibrio were more abundant in the DG group than the WG group. Succinivibrio promotes the production of SCFAs and microbial growth. As a member of the Alloprevotella genus, Prevotella has the capacity to break down dietary fibers from plant cell walls, resulting in the production of a significant amount of SCFAs [81]. Prevotella that metabolize dietary fibers, Alloprevotella, also boost its metabolism. These findings might be endorsed by the nutrient composition of forages and grazing patterns, as higher OM contents increase the growth of these fibrolytic bacteria.
Overall, these variations make known important information related to the nutrient composition of forages and the grazing patterns of different yaks. Forage quality, quantity, varieties, feeding pattern, and environmental effects could be associated with bacterial composition, diversity, and functions of the bacterial community in yak feces. Sufficient amounts of high-quality forage, nutrients, and forage quantity in grazing pastures for yaks improved the gut bacterial diversity.

5. Conclusions

This study investigated the composition and diversity of the fecal bacterial communities in WG and DG groups, revealing that feeding patterns influenced the structure and variation of the fecal bacterial community. Specifically, Firmicutes were more abundant in the WG group, which grazed on natural pastures, than in the DG group. In this study, we also found that changes in the fecal bacterial communities of yaks may be related to their health and external environmental adaptation. The WG group grazing on natural pastures favored the fiber-degradation bacteria (related to Ruminococcaceae), while the DG group improved the abundance of protein and carbohydrate-degrading (Prevotellaceae). Studying the effects of these factors contributes novel insights into the current understanding of the fecal bacterial communities of yaks to help us in our future understanding of the relation between microbes and the host, provides suggestions for better background, and also provides new approaches to prebiotics and microbiological agents.

Author Contributions

T.S. and L.D.: conceptualization. T.S.: methodology, investigation, and writing—original draft preparation. T.S.: software, validation. X.G.: formal analysis. Y.F. and Y.S.: resources. X.G.: data curation. L.D. and X.G.: writing—review and editing, visualization. L.D.: supervision, project administration, and funding acquisition. All authors have read and agreed to the published version of the manuscript.

Funding

This research was conducted with the financial support of the Second Tibetan Plateau Scientific expedition and Research Programme (2019QZKK0302-02); the Wild Yak Protection Project in Qilian Mountain National Park of Subei County (Population Investigation and Monitoring) (SBCB-2023, NO.10); the Scientific and Technological Innovation Team for Qinghai–Tibetan Plateau Research in Southwest Minzu University (2024CXTD01); and the Project of Grassland Multifunctionality Evaluation in Three-River-Source National Park (QHQXD-2023-28).

Institutional Review Board Statement

Not applicable. This study does not require ethical approval as it involves only the collection of plant samples, which were then fed to animals without causing them harm or distress. The animals were not slaughtered, and only fecal samples were collected for analysis. Therefore, this study did not involve any procedures that would require ethical review and approval.

Informed Consent Statement

Informed consent was obtained from the owners of the domesticated yaks involved in the study. We ensured that the animals were not harmed or subjected to any distress during the experiment, and written consent was obtained from their owners before the study. No human subjects were involved in the experiment.

Data Availability Statement

The datasets presented in this study can be found in online repositories. The names of the repository/repositories and accession numbers can be found at https://www.ncbi.nlm.nih.gov/sra/PRJNA981343 (accessed on 1 August 2024).

Conflicts of Interest

The authors declare no conflicts of interest. The funders had no role in the design of the study; in the collection, analyses, or interpretation of data; in the writing of the manuscript; or in the decision to publish the results.

References

  1. Wang, X.; Zhang, Z.; Li, B.; Hao, W.; Yin, W.; Ai, S.; Han, J.; Rujing Wang, R.; Duan, Z. Depicting Fecal Microbiota Characteristic in Yak, Cattle, Yak-Cattle Hybrid and Tibetan Sheep in Different Eco-Regions of Qinghai-Tibetan Plateau. Microbiol. Spectr. 2022, 10, e00021-22. [Google Scholar] [CrossRef]
  2. Wang, H.; Long, R.; Liang, J.B.; Guo, X.; Ding, L.; Shang, Z. Comparison of nitrogen metabolism in yak (Bos grunniens) and indigenous cattle (Bos taurus) on the Qinghai-Tibetan Plateau. Asian-Australasian J. Anim. Sci. 2011, 24, 766–773. [Google Scholar] [CrossRef]
  3. Ren, M.; Song, J.K.; Yang, F.; Zou, M.; Wang, P.X.; Wang, D.; Zhang, H.J.; Zhao, G.H.; Lin, Q. First genotyping of Blastocystis in yaks from Qinghai Province, northwestern China. Parasites Vectors 2019, 12, 171. [Google Scholar] [CrossRef]
  4. Ma, J.; Shah, A.M.; Wang, Z.; Hu, R.; Zou, H.; Wang, X.; Cao, G.; Peng, Q.; Xue, B.; Wang, L.; et al. Comparing the gastrointestinal barrier function between growth-retarded and normal yaks on the Qinghai-Tibetan Plateau. PeerJ 2020, 8, e9851. [Google Scholar] [CrossRef]
  5. Hu, R.; Zou, H.; Wang, Z.; Cao, B.; Peng, Q.; Jing, X.; Wang, Y.; Shao, Y.; Pei, Z.; Zhang, X.; et al. Nutritional interventions improved rumen functions and promoted compensatory growth of growth-retarded yaks as revealed by integrated transcripts and microbiome analyses. Front. Microbiol. 2019, 10, 318. [Google Scholar] [CrossRef]
  6. Xu, T.; Xu, S.; Hu, L.; Zhao, N.; Liu, Z.; Ma, L.; Liu, H.; Zhao, X. Effect of dietary types on feed intakes, growth performance and economic benefit in tibetan sheep and yaks on the qinghai-tibet plateau during cold season. PLoS ONE 2017, 12, e0169187. [Google Scholar] [CrossRef] [PubMed]
  7. Kumar, S.; Teotia, U.; Aswal, A. Antihypertensive Property of Yak Milk Caseinates Hydrolyzed with Different Proteases. Int. J. Livest. Res. 2013, 3, 130. [Google Scholar] [CrossRef]
  8. Nikkhah, A. Equidae, Camel, and Yak Milks as Functional Foods: A Review. J. Nutr. Food Sci. 2011, 1, 116. [Google Scholar] [CrossRef]
  9. Zhang, Z.; Xu, D.; Wang, L.; Hao, J.; Wang, J.; Zhou, X.; Wang, W.; Qiu, Q.; Huang, X.; Zhou, J.; et al. Convergent Evolution of Rumen Microbiomes in High-Altitude Mammals. Curr. Biol. 2016, 26, 1873–1879. [Google Scholar] [CrossRef]
  10. Liu, H.; Li, Z.; Pei, C.; Degen, A.; Hao, L.; Cao, X.; Liu, H.; Zhou, J.; Long, R. A comparison between yaks and Qaidam cattle in in vitro rumen fermentation, methane emission, and bacterial community composition with poor quality substrate. Anim. Feed Sci. Technol. 2022, 291, 115395. [Google Scholar] [CrossRef]
  11. Zi, X.D. Reproduction in female yaks (Bos grunniens) and opportunities for improvement. Theriogenology 2003, 59, 1303–1312. [Google Scholar] [CrossRef] [PubMed]
  12. Ma, J.; Zhu, Y.; Wang, Z.; Yu, X.; Hu, R.; Wang, X.; Cao, G.; Zou, H.; Shah, A.M.; Peng, Q.; et al. Comparing the Bacterial Community in the Gastrointestinal Tracts between Growth-Retarded and Normal Yaks on the Qinghai–Tibetan Plateau. Front. Microbiol. 2020, 11, 600516. [Google Scholar] [CrossRef] [PubMed]
  13. Wu, D.; Vinitchaikul, P.; Deng, M.; Zhang, G.; Sun, L.; Wang, H.; Gou, X.; Mao, H.; Yang, S. Exploration of the effects of altitude change on bacteria and fungi in the rumen of yak (Bos grunniens). Arch. Microbiol. 2021, 203, 835–846. [Google Scholar] [CrossRef] [PubMed]
  14. Celi, P.; Verlhac, V.; Pérez Calvo, E.; Schmeisser, J.; Kluenter, A.M. Biomarkers of gastrointestinal functionality in animal nutrition and health. Anim. Feed Sci. Technol. 2019, 250, 9–31. [Google Scholar] [CrossRef]
  15. Parker, A.; Lawson, M.A.E.; Vaux, L.; Pin, C. Host-microbe interaction in the gastrointestinal tract. Environ. Microbiol. 2018, 20, 2337–2353. [Google Scholar] [CrossRef] [PubMed]
  16. Yeoman, C.J.; White, B.A. Gastrointestinal tract microbiota and probiotics in production animals. Annu. Rev. Anim. Biosci. 2014, 2, 469–486. [Google Scholar] [CrossRef] [PubMed]
  17. Matthews, C.; Crispie, F.; Lewis, E.; Reid, M.; O’Toole, P.W.; Cotter, P.D. The rumen microbiome: A crucial consideration when optimising milk and meat production and nitrogen utilisation efficiency. Gut Microbes 2019, 10, 115–132. [Google Scholar] [CrossRef] [PubMed]
  18. Rodríguez-Carrio, J.; Salazar, N.; Margolles, A.; González, S.; Gueimonde, M.; de los Reyes-Gavilán, C.G.; Suárez, A. Free fatty acids profiles are related to gut microbiota signatures and short-chain fatty acids. Front. Immunol. 2017, 8, 823. [Google Scholar] [CrossRef] [PubMed]
  19. Gordon, G.L.R.; Phillips, M.W. The role of anaerobic gut fungi in ruminants. Nutr. Res. Rev. 1998, 11, 133–168. [Google Scholar] [CrossRef]
  20. Yohe, T.T.; Schramm, H.; White, R.R.; Hanigan, M.D.; Parsons, C.L.M.; Tucker, H.L.M.; Enger, B.D.; Hardy, N.R.; Daniels, K.M. Form of calf diet and the rumen. II: Impact on volatile fatty acid absorption. J. Dairy Sci. 2019, 102, 8502–8512. [Google Scholar] [CrossRef]
  21. Black, J.L.; Davison, T.M.; Box, I. Methane Emissions from Ruminants in Australia: Mitigation Potential and Applicability of Mitigation Strategies. Animals 2021, 11, 951. [Google Scholar] [CrossRef] [PubMed]
  22. Chao, A.; Lee, S. Estimating the number of classes via sample coverage. J. Am. Stat. Assoc. 1992, 87, 210–217. [Google Scholar] [CrossRef]
  23. Ahmad, A.A.; Yang, C.; Zhang, J.; Kalwar, Q.; Liang, Z.; Li, C.; Du, M.; Yan, P.; Long, R.; Han, J.; et al. Effects of Dietary Energy Levels on Rumen Fermentation, Microbial Diversity, and Feed Efficiency of Yaks (Bos grunniens). Front. Microbiol. 2020, 11, 625. [Google Scholar] [CrossRef] [PubMed]
  24. Henderson, G.; Cox, F.; Ganesh, S.; Jonker, A.; Young, W.; Janssen, P.H.; Abecia, L.; Angarita, E.; Aravena, P.; Arenas, G.N.; et al. Rumen microbial community composition varies with diet and host, but a core microbiome is found across a wide geographical range. Sci. Rep. 2015, 5, 14567. [Google Scholar] [CrossRef]
  25. Li, F.; Li, C.; Chen, Y.; Liu, J.; Zhang, C.; Irving, B.; Fitzsimmons, C.; Plastow, G.; Guan, L.L. Host genetics influence the rumen microbiota and heritable rumen microbial features associate with feed efficiency in cattle. Microbiome 2019, 7, 92. [Google Scholar] [CrossRef] [PubMed]
  26. Ziganshin, A.M.; Liebetrau, J.; Pröter, J.; Kleinsteuber, S. Microbial community structure and dynamics during anaerobic digestion of various agricultural waste materials. Appl. Microbiol. Biotechnol. 2013, 97, 5161–5174. [Google Scholar] [CrossRef] [PubMed]
  27. Fang, L.; Zhou, Z.; Ren, L.; Shi, F.; Can, M.; Chai, S.; Meng, Q. Ruminal bacterial diversity of yaks (Bos grunniens) fed by grazing or indoor regime on the Tibetan Plateau by analysis of 16S rRNA gene libraries. Ital. J. Anim. Sci. 2015, 14, 621–627. [Google Scholar] [CrossRef]
  28. Ma, L.; Xu, S.; Liu, H.; Xu, T.; Hu, L.; Zhao, N.; Han, X.; Zhang, X. Yak rumen microbial diversity at different forage growth stages of an alpine meadow on the Qinghai-Tibet Plateau. PeerJ 2019, 7, e7645. [Google Scholar] [CrossRef]
  29. Tajima, K.; Aminov, R.I.; Nagamine, T.; Ogata, K.; Nakamura, M.; Matsui, H.; Benno, Y. Rumen bacterial diversity as determined by sequence analysis of 16S rDNA libraries. FEMS Microbiol. Ecol. 1999, 29, 159–169. [Google Scholar] [CrossRef]
  30. Huang, C.; Ge, F.; Yao, X.; Guo, X.; Bao, P.; Ma, X.; Wu, X.; Chu, M.; Yan, P.; Liang, C. Microbiome and Metabolomics Reveal the Effects of Different Feeding Systems on the Growth and Ruminal Development of Yaks. Front. Microbiol. 2021, 12, 682989. [Google Scholar] [CrossRef]
  31. Van Soest, P.J.; Robertson, J.B.; Lewis, B.A. Methods for Dietary Fiber, Neutral Detergent Fiber, and Nonstarch Polysaccharides in Relation to Animal Nutrition. J. Dairy Sci. 1991, 74, 3583–3597. [Google Scholar] [CrossRef] [PubMed]
  32. Thiex, N.; Novotny, L.; Crawford, A. Determination of ash in animal feed: AOAC Official Method 942.05 revisited. J. AOAC Int. 2012, 95, 1392–1397. [Google Scholar] [CrossRef] [PubMed]
  33. Tamaki, H.; Wright, C.L.; Li, X.; Lin, Q.; Hwang, C.; Wang, S.; Thimmapuram, J.; Kamagata, Y.; Liu, W.T. Analysis of 16S rRNA amplicon sequencing options on the roche/454 next-generation titanium sequencing platform. PLoS ONE 2011, 6, e0025263. [Google Scholar] [CrossRef]
  34. Caporaso, J.G.; Kuczynski, J.; Stombaugh, J.; Bittinger, K.; Bushman, F.D.; Costello, E.K.; Fierer, N.; Peña, A.G.; Goodrich, J.K.; Gordon, J.I.; et al. correspondence QIIME allows analysis of high- throughput community sequencing data Intensity normalization improves color calling in SOLiD sequencing. Nat. Publ. Gr. 2010, 7, 335–336. [Google Scholar]
  35. Li, H.; Qu, J.; Li, T.; Li, J.; Lin, Q.; Li, X. Pika population density is associated with the composition and diversity of gut microbiota. Front. Microbiol. 2016, 7, 758. [Google Scholar] [CrossRef]
  36. Edgar, R.C.; Haas, B.J.; Clemente, J.C.; Quince, C.; Knight, R. UCHIME improves sensitivity and speed of chimera detection. Bioinformatics 2011, 27, 2194–2200. [Google Scholar] [CrossRef]
  37. Quast, C.; Pruesse, E.; Yilmaz, P.; Gerken, J.; Schweer, T.; Yarza, P.; Peplies, J.; Glöckner, F.O. The SILVA ribosomal RNA gene database project: Improved data processing and web-based tools. Nucleic Acids Res. 2013, 41, 590–596. [Google Scholar] [CrossRef]
  38. Yilmaz, P.; Parfrey, L.W.; Yarza, P.; Gerken, J.; Pruesse, E.; Quast, C.; Schweer, T.; Peplies, J.; Ludwig, W.; Glöckner, F.O. The SILVA and “all-species Living Tree Project (LTP)” taxonomic frameworks. Nucleic Acids Res. 2014, 42, 643–648. [Google Scholar] [CrossRef] [PubMed]
  39. Wang, Q.; Garrity, G.M.; Tiedje, J.M.; Cole, J.R. Naïve Bayesian classifier for rapid assignment of rRNA sequences into the new bacterial taxonomy. Appl. Environ. Microbiol. 2007, 73, 5261–5267. [Google Scholar] [CrossRef]
  40. Loor, J.J.; Elolimy, A.A.; McCann, J.C. Dietary impacts on rumen microbiota in beef and dairy production. Anim. Front. 2016, 6, 22–29. [Google Scholar] [CrossRef]
  41. Promkot, C.; Wanapat, M. Ruminal degradation and intestinal digestion of crude protein of tropical protein resources using nylon bag technique and three-step in vitro procedure in dairy cattle. Livest. Res. Rural Dev. 2003, 15, 1–7. [Google Scholar]
  42. Mupangwa, J.F.; Ngongoni, N.T.; Topps, J.H.; Ndlovu, P. Chemical composition and dry matter degradability profiles of forage legumes Cassia rotundifolia cv. Wynn, Lablab purpureus cv. Highworth and Macroptilium atropurpureum cv. Siratro at 8 weeks of growth (pre-anthesis). Anim. Feed Sci. Technol. 1997, 69, 167–178. [Google Scholar] [CrossRef]
  43. Nguyen, V.T.; Preston, T.R. Rumen environment and feed degradability in swamp buffaloes fed different supplements. Livest. Res. Rural Dev. 1999, 11, 10–16. [Google Scholar]
  44. Latham, E.A.; Weldon, K.K.; Wickersham, T.A.; Coverdale, J.A.; Pinchak, W.E. Responses in the rumen microbiome of Bos taurus and indicus steers fed a low-quality rice straw diet and supplemented protein. J. Anim. Sci. 2018, 96, 1032–1044. [Google Scholar] [CrossRef] [PubMed]
  45. Belanche, A.; Doreau, M.; Edwards, J.E.; Moorby, J.M.; Pinloche, E.; Newbold, C.J. Shifts in the Rumen Microbiota Due to the Type of Carbohydrate and Level of Protein Ingested by Dairy Cattle Are Associated with Changes in Rumen Fermentation. J. Nutr. 2012, 142, 1684–1692. [Google Scholar] [CrossRef] [PubMed]
  46. Fernandes, K.A.; Kittelmann, S.; Rogers, C.W.; Gee, E.K.; Bolwell, C.F.; Bermingham, E.N.; Thomas, D.G. Faecal microbiota of forage-fed horses in new zealand and the population dynamics of microbial communities following dietary change. PLoS ONE 2014, 9, e0112846. [Google Scholar] [CrossRef] [PubMed]
  47. Chen, X.L.; Wang, J.K.; Wu, Y.M.; Liu, J.X. Effects of chemical treatments of rice straw on rumen fermentation characteristics, fibrolytic enzyme activities and populations of liquid- and solid-associated ruminal microbes in vitro. Anim. Feed Sci. Technol. 2008, 141, 1–14. [Google Scholar] [CrossRef]
  48. Guo, N.; Wu, Q.; Shi, F.; Niu, J.; Zhang, T.; Degen, A.A.; Fang, Q.; Ding, L.; Shang, Z.; Zhang, Z.; et al. Seasonal dynamics of diet–gut microbiota interaction in adaptation of yaks to life at high altitude. NPJ Biofilms Microbiomes 2021, 7, 38. [Google Scholar] [CrossRef] [PubMed]
  49. Nie, Y.; Zhou, Z.; Guan, J.; Xia, B.; Luo, X.; Yang, Y.; Fu, Y.; Sun, Q. Dynamic changes of yak (Bos grunniens) gut microbiota during growth revealed by polymerase chain reaction-denaturing gradient gel electrophoresis and metagenomics. Asian-Australas. J. Anim. Sci. 2017, 30, 957–966. [Google Scholar] [CrossRef]
  50. Liu, C.; Wu, H.; Liu, S.; Chai, S.; Meng, Q.; Zhou, Z. Dynamic alterations in yak rumen bacteria community and metabolome characteristics in response to feed type. Front. Microbiol. 2019, 10, 1116. [Google Scholar] [CrossRef] [PubMed]
  51. Zhong, Y.; Xue, M.; Liu, J. Composition of Rumen Bacterial Community in Dairy Cows with Different Levels of Somatic Cell Counts. Front. Microbiol. 2018, 9, 3217. [Google Scholar] [CrossRef] [PubMed]
  52. Xin, J.; Chai, Z.; Zhang, C.; Zhang, Q.; Zhu, Y.; Cao, H.; Zhong, J.; Ji, Q. Comparing the microbial community in four stomach of dairy cattle, yellow cattle and three yak herds in qinghai-tibetan plateau. Front. Microbiol. 2019, 10, 1547. [Google Scholar] [CrossRef]
  53. Flint, H.J.; Scott, K.P.; Duncan, S.H.; Louis, P.; Forano, E. Microbial degradation of complex carbohydrates in the gut. Gut Microbes 2012, 3, 289–306. [Google Scholar] [CrossRef] [PubMed]
  54. Ali Ahmad, A.; Bo Zhang, J.; Liang, Z.; Yang, C.; Kalwar, Q.; Shah, T.; Du, M.; Muhammad, I.; Zheng, J.; Yan, P.; et al. Dynamics of rumen bacterial composition of yak (Bos grunniens) in response to dietary supplements during the cold season. PeerJ 2021, 9, e11520. [Google Scholar] [CrossRef]
  55. Xue, D.; Chen, H.; Chen, F.; He, Y.; Zhao, C.; Zhu, D.; Zeng, L.; Li, W. Analysis of the rumen bacteria and methanogenic archaea of yak (Bos grunniens) steers grazing on the Qinghai-Tibetan Plateau. Livest. Sci. 2016, 188, 61–71. [Google Scholar] [CrossRef]
  56. Jami, E.; White, B.A.; Mizrahi, I. Potential role of the bovine rumen microbiome in modulating milk composition and feed efficiency. PLoS ONE 2014, 9, e0085423. [Google Scholar] [CrossRef] [PubMed]
  57. Patel, V.; Patel, A.K.; Parmar, N.R.; Patel, A.B.; Reddy, B.; Joshi, C.G. Characterization of the rumen microbiome of Indian Kankrej cattle (Bos indicus) adapted to different forage diet. Appl. Microbiol. Biotechnol. 2014, 98, 9749–9761. [Google Scholar] [CrossRef] [PubMed]
  58. Huang, J.; Li, Y.; Luo, Y. Bacterial community in the rumen of tibetan sheep and gansu alpine fine-wool sheep grazing on the Qinghai-Tibetan Plateau, China. J. Gen. Appl. Microbiol. 2017, 63, 122–130. [Google Scholar] [CrossRef]
  59. Han, X.; Yang, Y.; Yan, H.; Wang, X.; Qu, L.; Chen, Y. Rumen bacterial diversity of 80 to 110-day-Old goats using 16s rRNA sequencing. PLoS ONE 2015, 10, e0117811. [Google Scholar] [CrossRef]
  60. Pitta, D.W.; Pinchak, W.E.; Dowd, S.E.; Osterstock, J.; Gontcharova, V.; Youn, E.; Dorton, K.; Yoon, I.; Min, B.R.; Fulford, J.D.; et al. Rumen bacterial diversity dynamics associated with changing from bermudagrass hay to grazed winter wheat diets. Microb. Ecol. 2010, 59, 511–522. [Google Scholar] [CrossRef]
  61. Guo, X.; Xia, X.; Tang, R.; Wang, K. Real-time PCR quantification of the predominant bacterial divisions in the distal gut of Meishan and Landrace pigs. Anaerobe 2008, 14, 224–228. [Google Scholar] [CrossRef] [PubMed]
  62. Xue, D.; Chen, H.; Zhao, X.; Xu, S.; Hu, L.; Xu, T.; Jiang, L.; Zhan, W. Rumen prokaryotic communities of ruminants under different feeding paradigms on the Qinghai-Tibetan Plateau. Syst. Appl. Microbiol. 2017, 40, 227–236. [Google Scholar] [CrossRef] [PubMed]
  63. Lozupone, C.; Lladser, M.E.; Knights, D.; Stombaugh, J.; Knight, R. UniFrac: An effective distance metric for microbial community comparison. ISME J. 2011, 5, 169–172. [Google Scholar] [CrossRef] [PubMed]
  64. Wang, L.; Liu, K.; Wang, Z.; Bai, X.; Peng, Q.; Jin, L. Bacterial community diversity associated with different utilization efficiencies of nitrogen in the gastrointestinal tract of goats. Front. Microbiol. 2019, 10, 239. [Google Scholar] [CrossRef] [PubMed]
  65. Godoy-Vitorino, F.; Goldfarb, K.C.; Karaoz, U.; Leal, S.; Garcia-Amado, M.A.; Hugenholtz, P.; Tringe, S.G.; Brodie, E.L.; Dominguez-Bello, M.G. Comparative analyses of foregut and hindgut bacterial communities in hoatzins and cows. ISME J. 2012, 6, 531–541. [Google Scholar] [CrossRef] [PubMed]
  66. Ziemer, C.J. Newly cultured bacteria with broad diversity isolated from eight-week continuous culture enrichments of cow feces on complex polysaccharides. Appl. Environ. Microbiol. 2014, 80, 574–585. [Google Scholar] [CrossRef] [PubMed]
  67. Purushe, J.; Fouts, D.E.; Morrison, M.; White, B.A.; Mackie, R.I.; Coutinho, P.M.; Henrissat, B.; Nelson, K.E. Comparative Genome Analysis of Prevotella ruminicola and Prevotella bryantii: Insights into Their Environmental Niche. Microb. Ecol. 2010, 60, 721–729. [Google Scholar] [CrossRef] [PubMed]
  68. Stewart, R.D.; Auffret, M.D.; Warr, A.; Wiser, A.H.; Press, M.O.; Langford, K.W.; Liachko, I.; Snelling, T.J.; Dewhurst, R.J.; Walker, A.W.; et al. Assembly of 913 microbial genomes from metagenomic sequencing of the cow rumen. Nat. Commun. 2018, 9, 870. [Google Scholar] [CrossRef] [PubMed]
  69. Liu, J.; Zhang, M.; Xue, C.; Zhu, W.; Mao, S. Characterization and comparison of the temporal dynamics of ruminal bacterial microbiota colonizing rice straw and alfalfa hay within ruminants. J. Dairy Sci. 2016, 99, 9668–9681. [Google Scholar] [CrossRef] [PubMed]
  70. Shen, J.; Liu, Z.; Yu, Z.; Zhu, W. Monensin and nisin affect rumen fermentation and microbiota differently in vitro. Front. Microbiol. 2017, 8, 1111. [Google Scholar] [CrossRef]
  71. Hamlin, L.J.; Hungate, R.E. Culture and physiology of a starch-digesting bacterium (Bacteroides amylophilus n. sp.) from the bovine rumen. J. Bacteriol. 1956, 72, 548–554. [Google Scholar] [CrossRef] [PubMed]
  72. Wang, L.; Li, Y.; Zhang, Y.; Wang, L. The Effects of Different Concentrate-to-Forage Ratio Diets on Rumen Bacterial Microbiota and the Structures of Holstein Cows during the Feeding Cycle. Animals 2020, 10, 957. [Google Scholar] [CrossRef] [PubMed]
  73. Ramšak, A.; Peterka, M.; Tajima, K.; Martin, J.C.; Wood, J.; Johnston, M.E.A.; Aminov, R.I.; Flint, H.J.; Avguštin, G. Unravelling the genetic diversity of ruminal bacteria belonging to the CFB phylum. FEMS Microbiol. Ecol. 2000, 33, 69–79. [Google Scholar] [CrossRef] [PubMed]
  74. Osborne, J.M.; Dehority, B.A. Synergism in Degradation and Utilization of Intact Forage Cellulose, Hemicellulose, and Pectin by Three Pure Cultures of Ruminal Bacteria. Appl. Environ. Microbiol. 1989, 55, 2247–2250. [Google Scholar] [CrossRef]
  75. Gulino, L.M.; Ouwerkerk, D.; Kang, A.Y.H.; Maguire, A.J.; Kienzle, M.; Klieve, A.V. Shedding Light on the Microbial Community of the Macropod Foregut Using 454-Amplicon Pyrosequencing. PLoS ONE 2013, 8, e61463. [Google Scholar] [CrossRef]
  76. Wallace, R.J.; McKain, N.; Broderick, G.A.; Rode, L.M.; Walker, N.D.; Newbold, C.J.; Kopecny, J. Peptidases of the rumen bacterium, Prevotella ruminicola. Anaerobe 1997, 3, 35–42. [Google Scholar] [CrossRef]
  77. Shah, H.N.; Collins, M.D. Proposal to restrict the genus Bacteroides (Castellani and Chalmers) to Bacteroides fragilis and closely related species. Int. J. Syst. Bacteriol. 1989, 39, 85–87. [Google Scholar] [CrossRef]
  78. Windey, K.; de Preter, V.; Verbeke, K. Relevance of protein fermentation to gut health. Mol. Nutr. Food Res. 2012, 56, 184–196. [Google Scholar] [CrossRef]
  79. Wrzosek, L.; Miquel, S.; Noordine, M.L.; Bouet, S.; Chevalier-Curt, M.J.; Robert, V.; Philippe, C.; Bridonneau, C.; Cherbuy, C.; Robbe-Masselot, C.; et al. Bacteroides thetaiotaomicron and Faecalibacterium prausnitzii influence the production of mucus glycans and the development of goblet cells in the colonic epithelium of a gnotobiotic model rodent. BMC Biol. 2013, 11, 61. [Google Scholar] [CrossRef] [PubMed]
  80. Sokol, H.; Pigneur, B.; Watterlot, L.; Lakhdari, O.; Bermúdez-Humarán, L.G.; Gratadoux, J.J.; Blugeon, S.; Bridonneau, C.; Furet, J.P.; Corthier, G.; et al. Faecalibacterium prausnitzii is an anti-inflammatory commensal bacterium identified by gut microbiota analysis of Crohn disease patients. Proc. Natl. Acad. Sci. USA 2008, 105, 16731–16736. [Google Scholar] [CrossRef]
  81. Ramayo-Caldas, Y.; Mach, N.; Lepage, P.; Levenez, F.; Denis, C.; Lemonnier, G.; Leplat, J.J.; Billon, Y.; Berri, M.; Doré, J.; et al. Phylogenetic network analysis applied to pig gut microbiota identifies an ecosystem structure linked with growth traits. ISME J. 2016, 10, 2973–2977. [Google Scholar] [CrossRef] [PubMed]
Figure 1. (A) The rarefaction curves at 96.8% similarity level of the index of different samples. (B) Venn diagram showing operational taxonomic units shared between the two experimental groups, WG and DG.
Animals 14 02380 g001
Figure 2. (A) ACE and Chao1 indices of bacterial diversity. (B) Shannon and Simpson indices of bacterial diversity of WG and DG yak groups. Simpson indices did not show a significant difference between groups (p = 0.69). Chao1 and ACE indices were significantly lower in the DG group compared to the WG group, p < 0.001= **, p < 0.01= *.
Animals 14 02380 g002
Figure 3. Non-metric multidimensional scaling (NMDS) of bacterial communities at OTUs level; a dot represents each sample, and different colors represent different yak groups, WG and DG.
Animals 14 02380 g003
Figure 4. (A) Major bacterial phyla found in WG and DG yak groups. (B) Major bacterial families found in the WG and DG yak groups. (C) Major bacterial genera found in WG and DG yak groups, p < 0.0001= ***, p < 0.01= *.
Animals 14 02380 g004
Figure 5. Cladogram showing differential bacterial taxa (A), Linear Discriminant Analysis (LDA) Effect Size (LEfSe) indicating biomarker taxa (B) in domestic grazing yaks (DG) and wild grazing yaks (WG).
Animals 14 02380 g005
Figure 6. Co-occurrence network of significant bacterial genera. Potential mutualistic interactions of bacterial communities at genus level in (A) DG and (B) WG yak groups.
Animals 14 02380 g006
Table 1. The chemical composition of forages in domestic grazing yaks (DG) and wild grazing yaks (WG), natural grazing pasture.
ParametersForage in DGForage in WGSEMp-Value
Dry matter97.00%96.96%0.0470.652
Organic matter92.58%92.63%0.0350.716
Ash7.30%7.29%0.0090.345
Crude protein15.10%7.30%5.0250.001
Neutral detergent fiber53.78%57.68%2.7570.001
Acid detergent fiber27.8%30.81%2.1330.012
Ether extract1.37%1.5%0.0910.029
Total carbohydrates76.53%77.43%0.6360.095
Non-fiber carbohydrates22.76%22.1%0.4710.034
Hemicellulose26.13%26.33%0.1410.467
Table 2. The relative abundance of gut bacterial communities at the phylum level in the WG and DG groups.
TaxonomyDGWGSEMp-Value
Bacteroidetes0.91 b1.08 a0.1190.052
Firmicutes1.12 a0.89 b0.1620.024
Proteobacteria0.931.060.0880.505
Elusimicrobia1.07 a0.93 b0.0980.032
Fusobacteria1.18 a0.84 b0.2460.001
Kiritimatiellaeota1.08 a0.92 b0.1140.042
Lentisphaerae1.150.860.1980.0002
Spirochaetes0.811.220.2930.108
Fibrobacteres0.86 b1.15 a0.2020.059
Tenericutes0.931.070.0980.297
Verrucomicrobia1.090.910.1270.096
Melainabacteria1.060.940.0830.127
Values were log transformed. Means in a row with different small-letter superscripts differ significantly (p < 0.05); same-letter superscripts present no difference (p > 0.05).
Table 3. The relative abundance of gut bacterial communities at the family level in the WG and DG groups.
TaxonomyDGWGSEMp-Value
Ruminococcaceae1.22 a0.81 b0.2860.0001
Succinivibrionaceae0.891.110.1600.562
Prevotellaceae0.85 b1.16 a0.2190.0003
Lachnospiraceae0.821.210.2717.889
Rikenellaceae0.971.030.0420.372
Bacteroidaceae0.961.040.0560.161
Muribaculaceae0.84 b1.18 a0.2440.043
Values were log transformed. Means in a row with different small-letter superscripts differ significantly (p < 0.05); same-letter superscripts present no difference (p > 0.05).
Table 4. The relative abundance of gut bacterial communities at the genus level in the WG and DG groups.
TaxonomyDGWGSEMp-Value
Succinivibrio0.781.260.3400.060
Ruminobacter0.921.070.1030.742
Alloprevotella0.891.110.1600.068
Faecalibacterium0.901.100.1440.252
Bacteroides0.961.040.0560.161
Anaerovibrio0.891.120.1620.448
Alistipes1.020.970.0300.487
Mailhella1.07 a0.93 b0.0990.018
Tyzzerella1.030.960.0470.105
Values were log transformed. Means in a row with different small-letter superscripts differ significantly (p < 0.05); same-letter superscripts present no difference (p > 0.05).
Table 5. Topological features of co-occurrence network analysis among the DG and WG groups at the genera level.
S. NoNetwork AttributesDGWG
1Nodes4014
2Edges1469
3Average degree7.31.285714286
4Average path length2.4576923081.6875
5Network diameter43
6Clustering coefficient0.5777930090
7Density0.1871794870.098901099
8Heterogeneity0.720335430.364627846
9Centralization0.2230769230.054945055
10Positive correlation58.90%66.66%
11Negative correlation41.10%33.34%
Disclaimer/Publisher’s Note: The statements, opinions and data contained in all publications are solely those of the individual author(s) and contributor(s) and not of MDPI and/or the editor(s). MDPI and/or the editor(s) disclaim responsibility for any injury to people or property resulting from any ideas, methods, instructions or products referred to in the content.

