
Behavioural Responses of Beef Cattle to Hot Conditions

Abstract
:Simple Summary
Abstract
1. Introduction
2. Materials and Methods
2.1. Study Design
2.2. Animal Housing
2.3. Animal Management
2.4. Behavioural Observations
2.4.1. Visual Observations
2.4.2. Observations from Video Recordings
2.4.3. Post-Experiment Behavioural Observations
2.5. Climatic Data
2.6. Statistical Analyses
3. Results
3.1. Stepping, Standing, and Lying
3.2. Ears
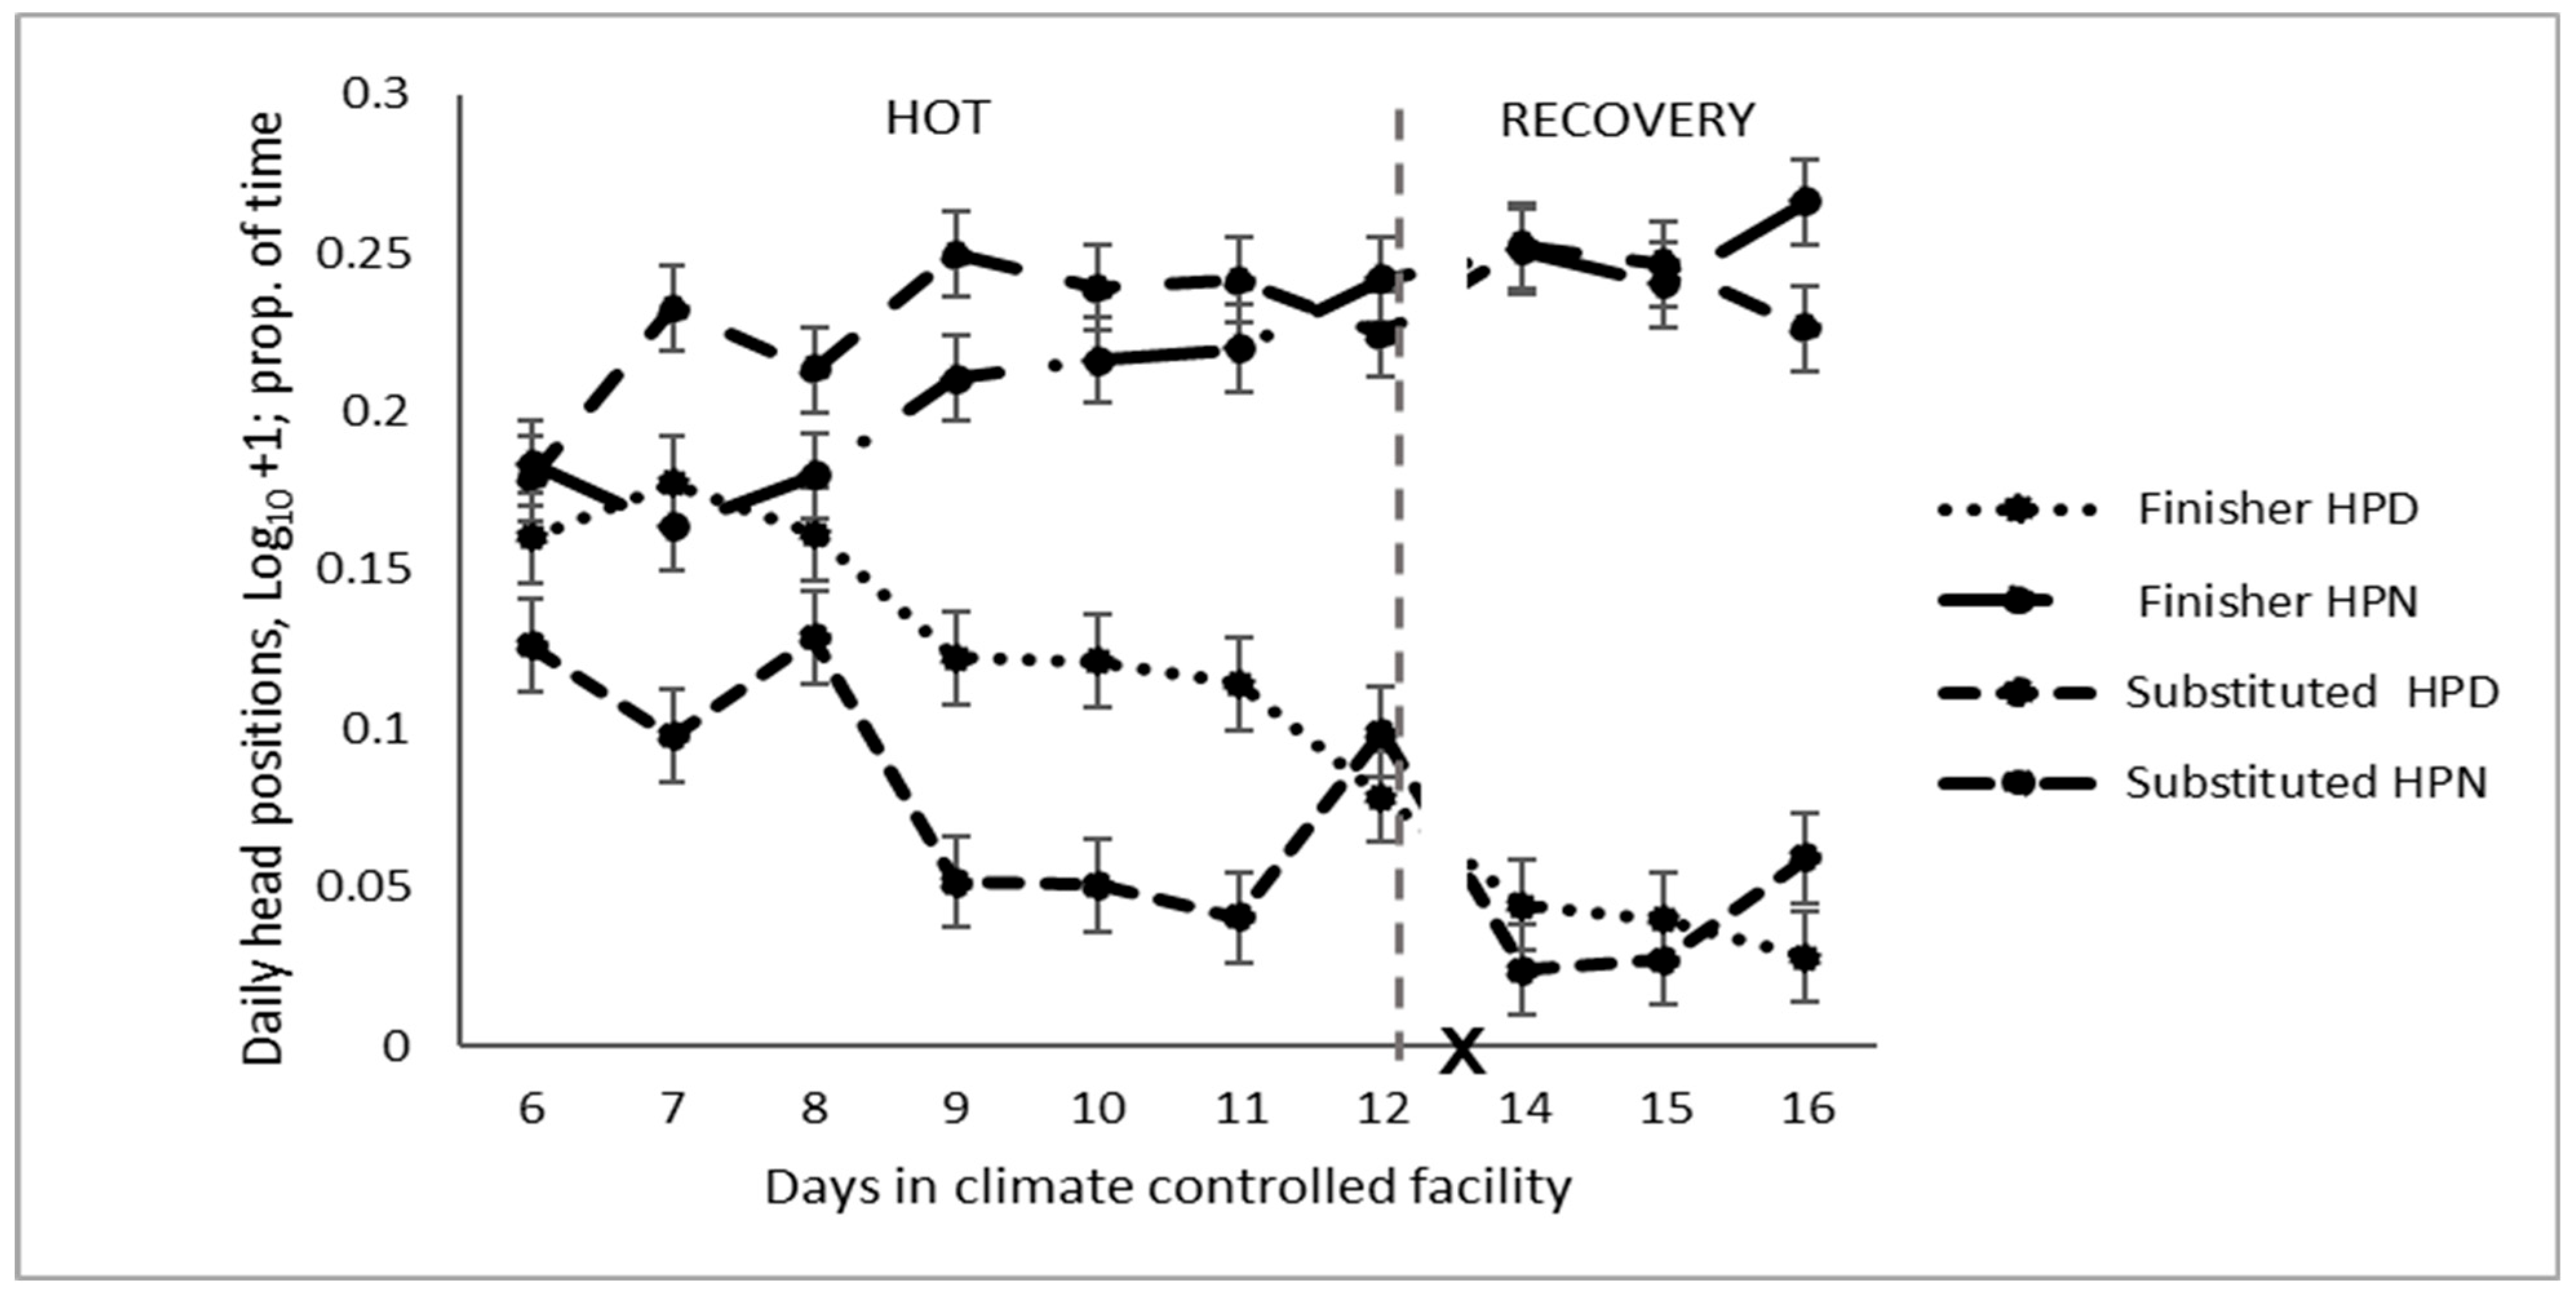
3.3. Head
3.4. Tail
3.5. Oral Behaviours
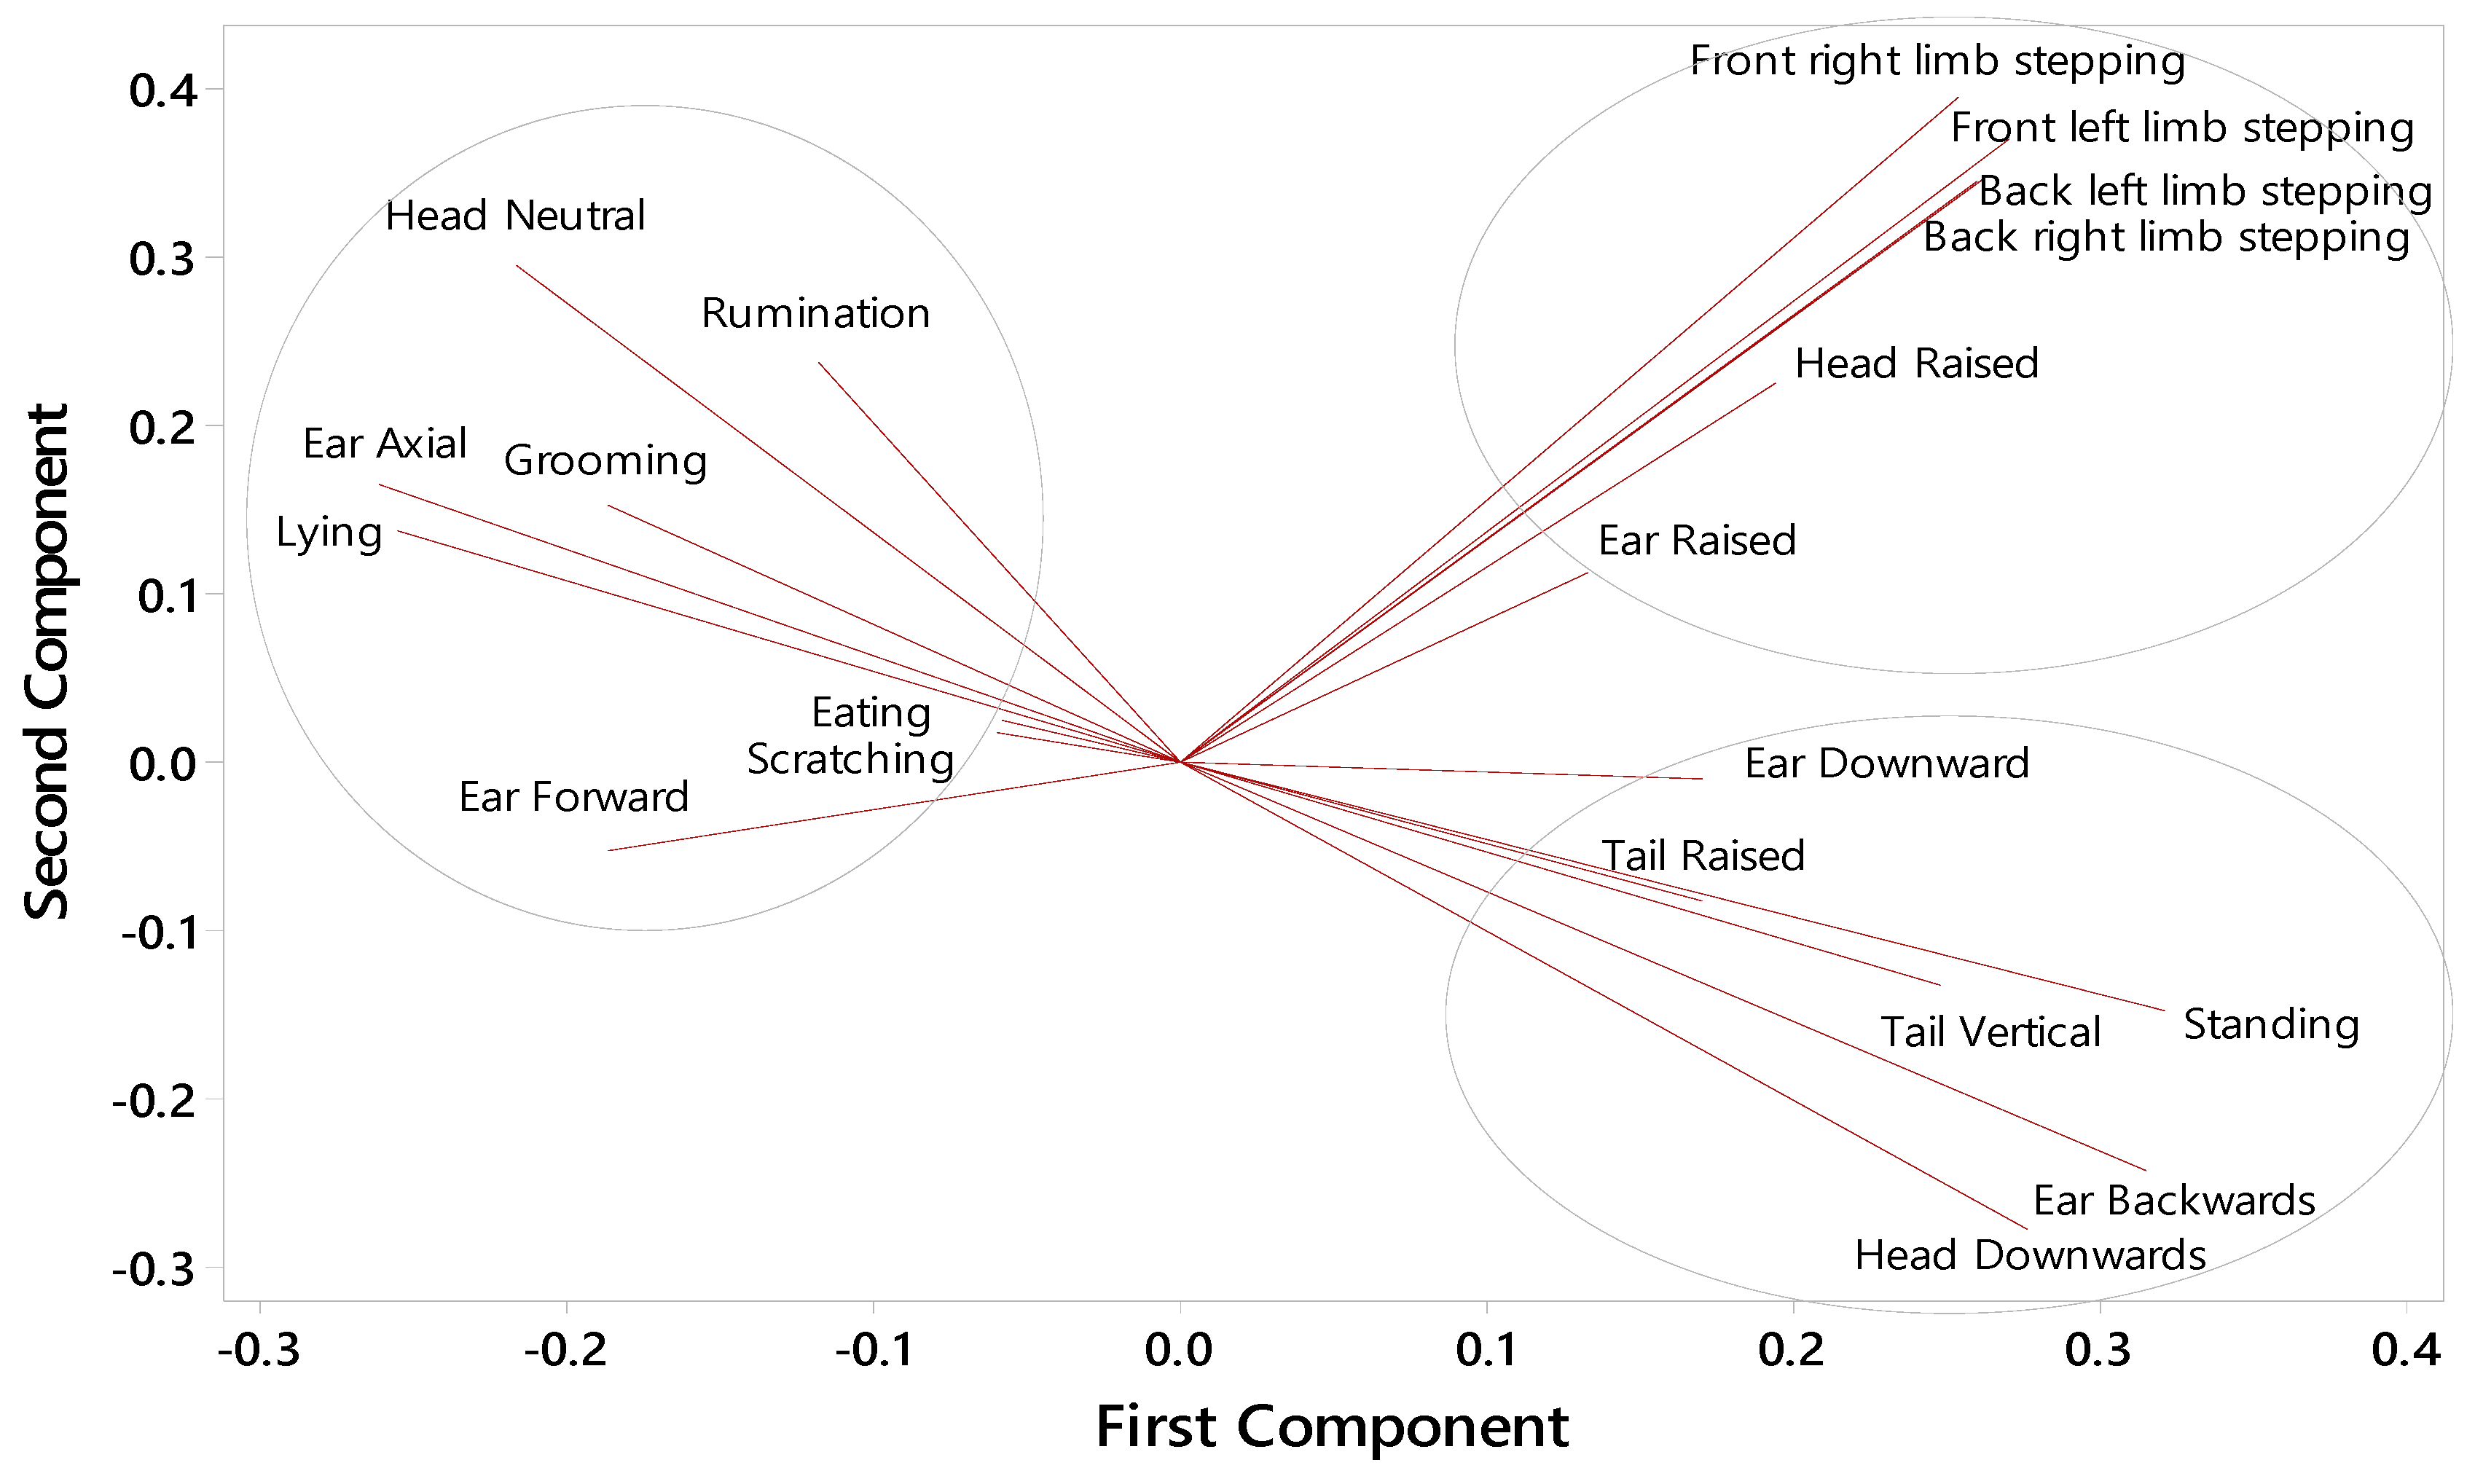
3.6. Behaviour Correlations
4. Discussion
4.1. Standing and Stepping
4.2. Ears
4.3. Head
4.4. Tail
4.5. Oral Behaviours
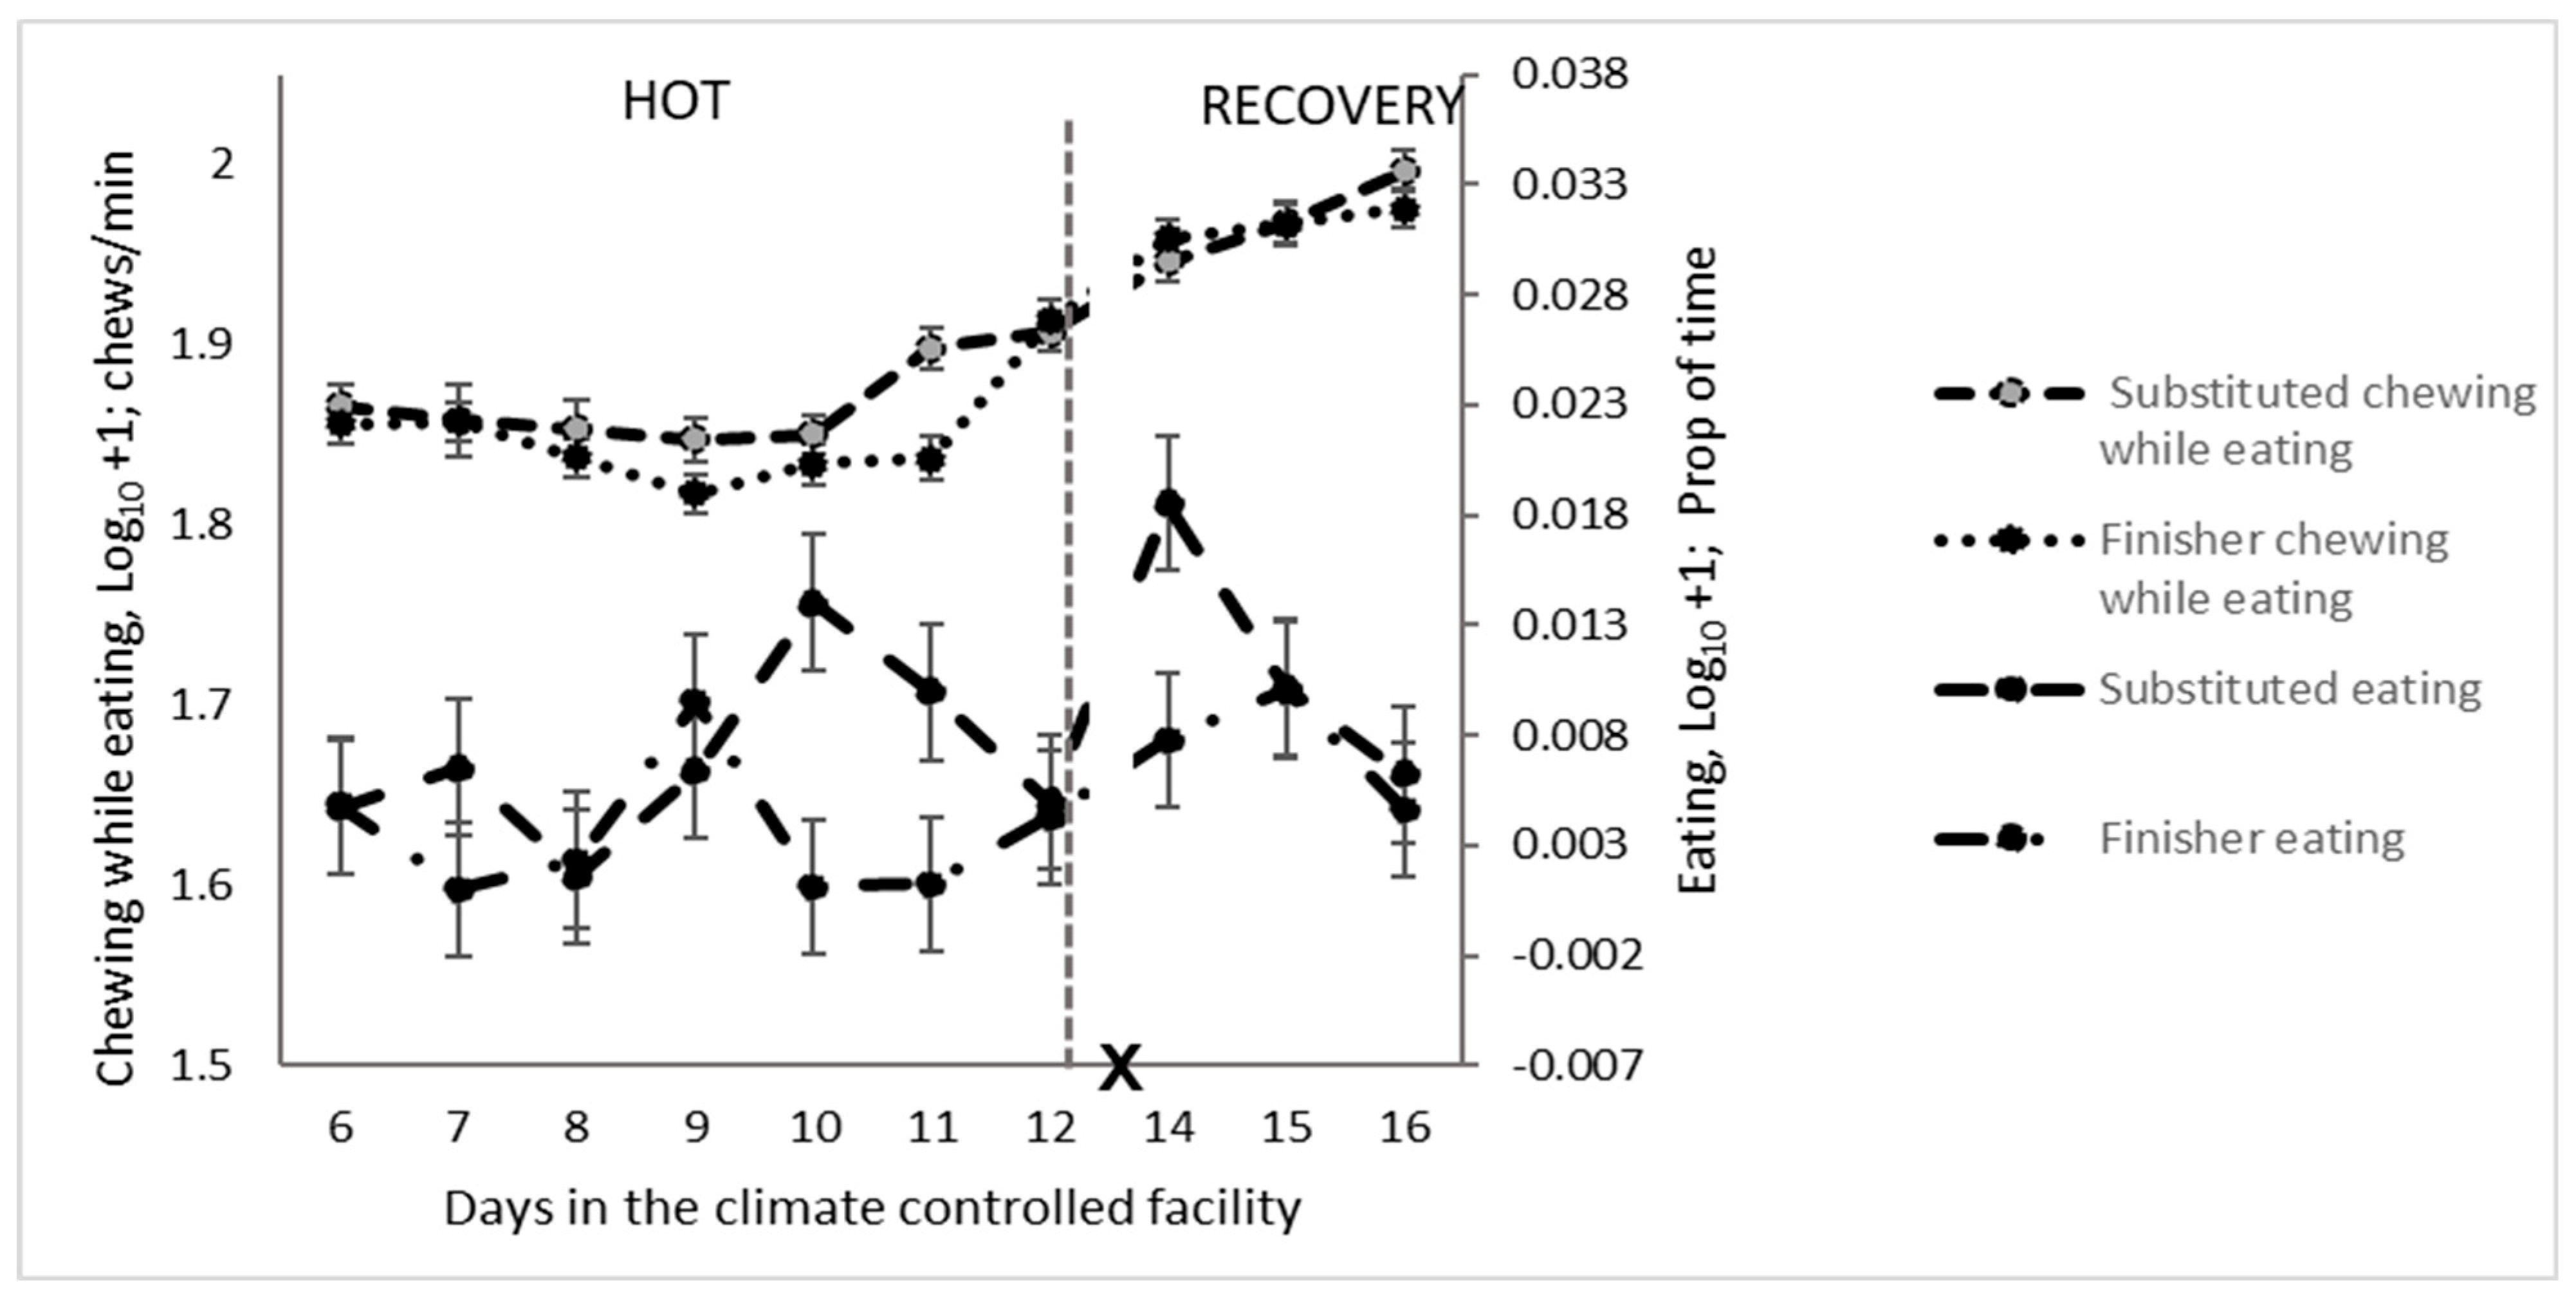
4.5.1. Nutritional Behaviours
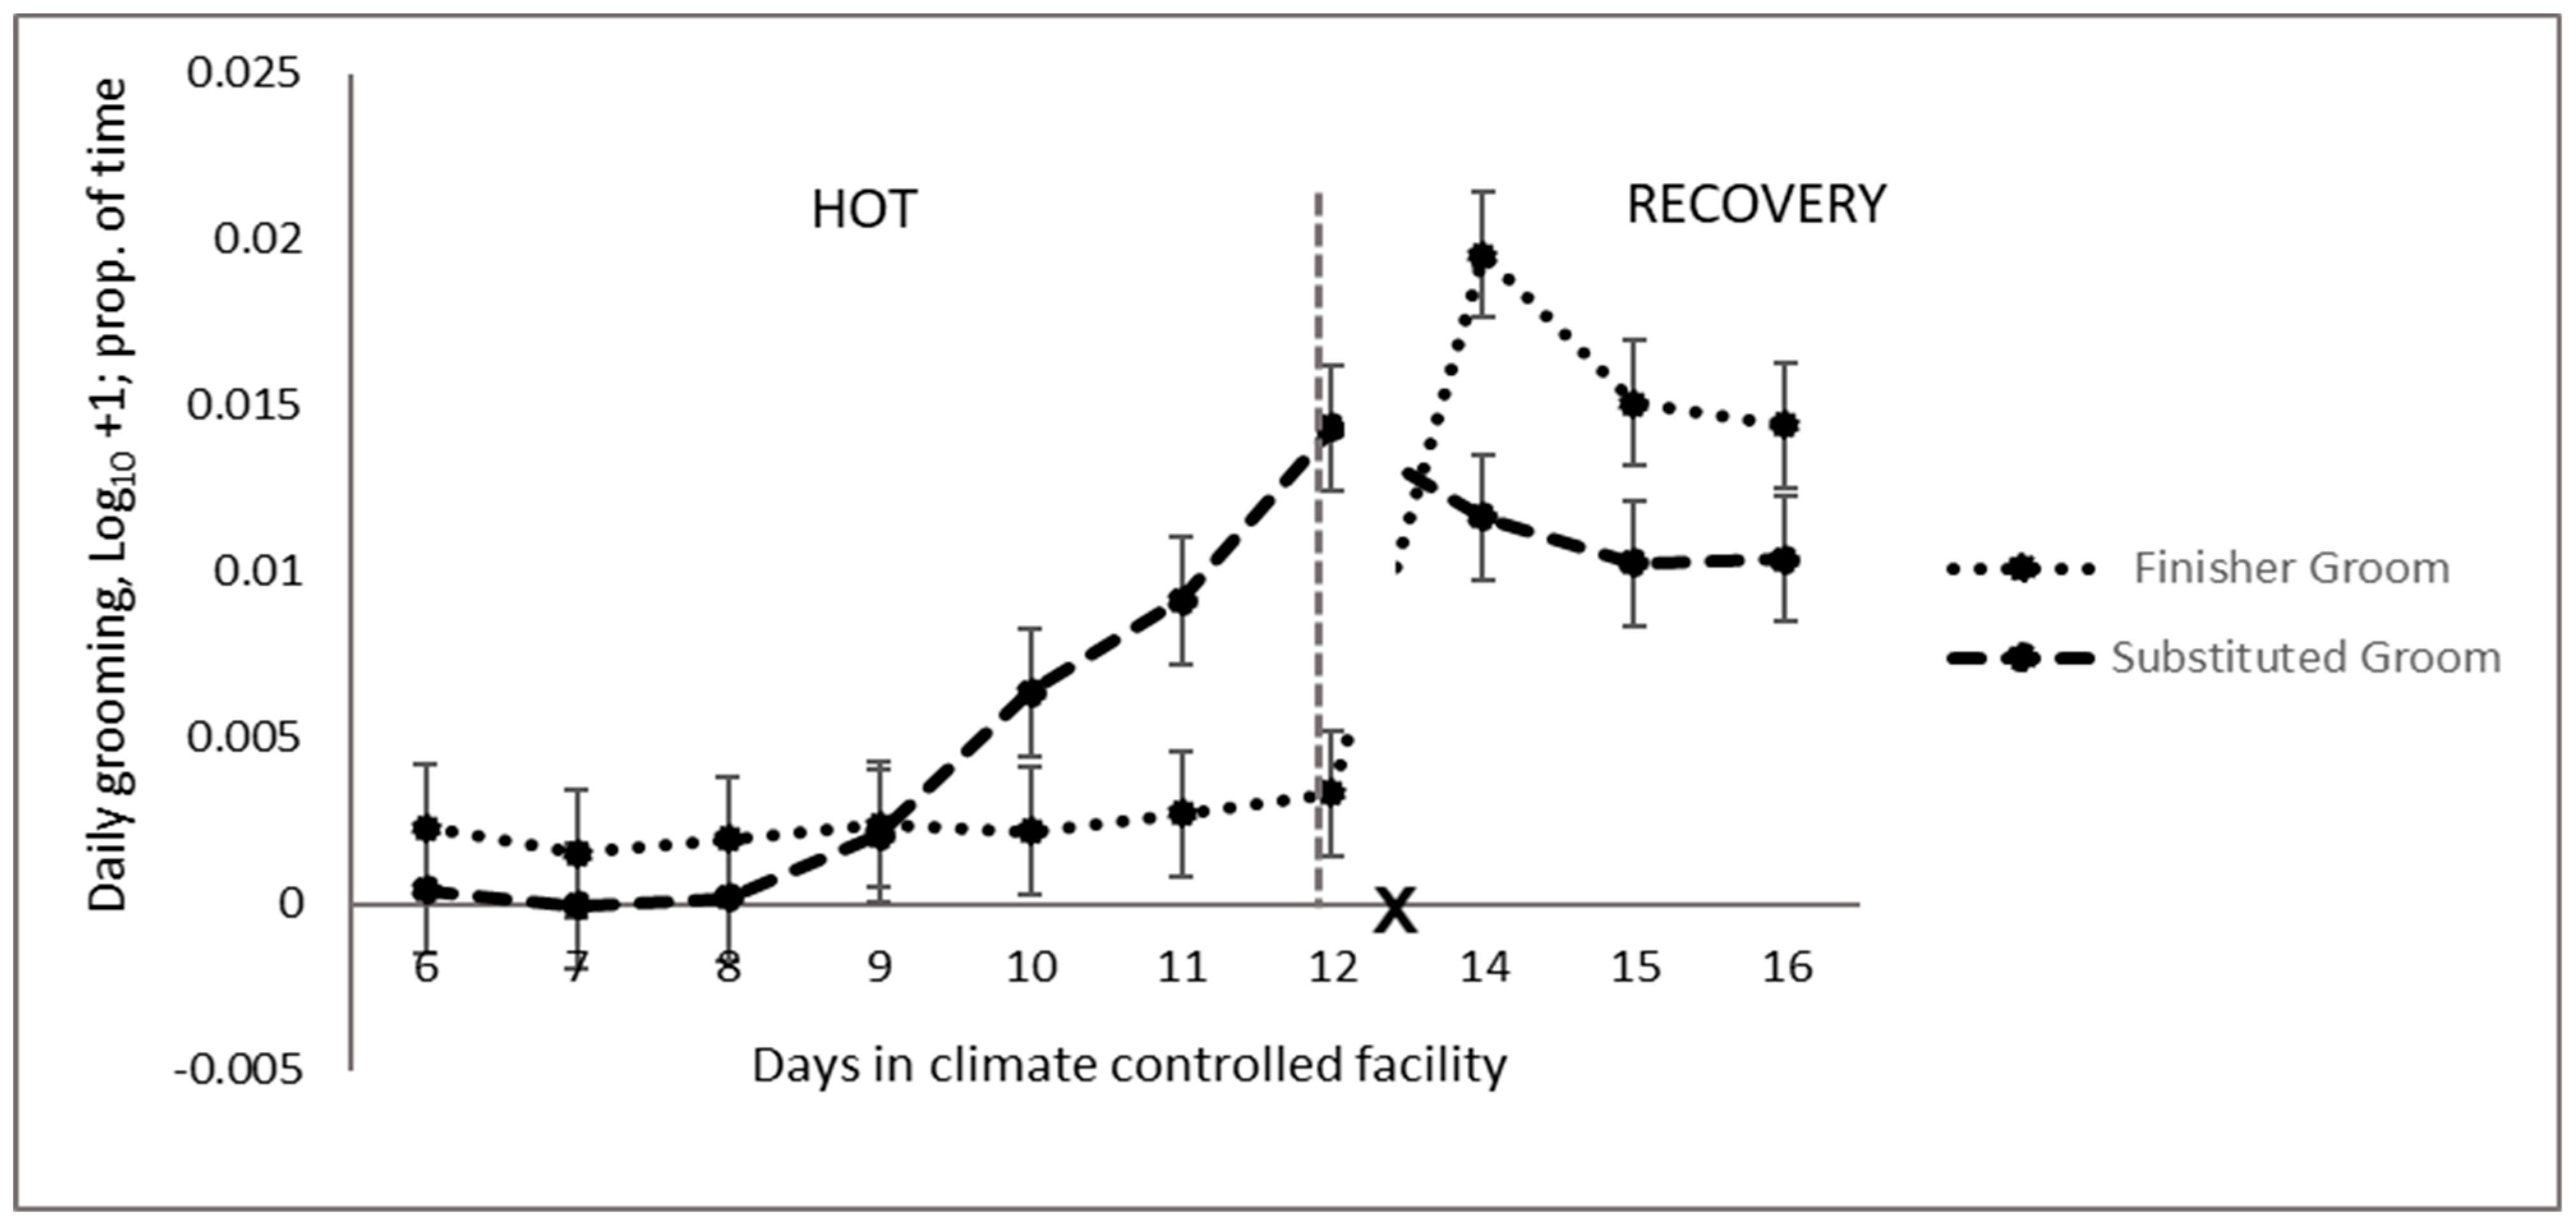
4.5.2. Grooming
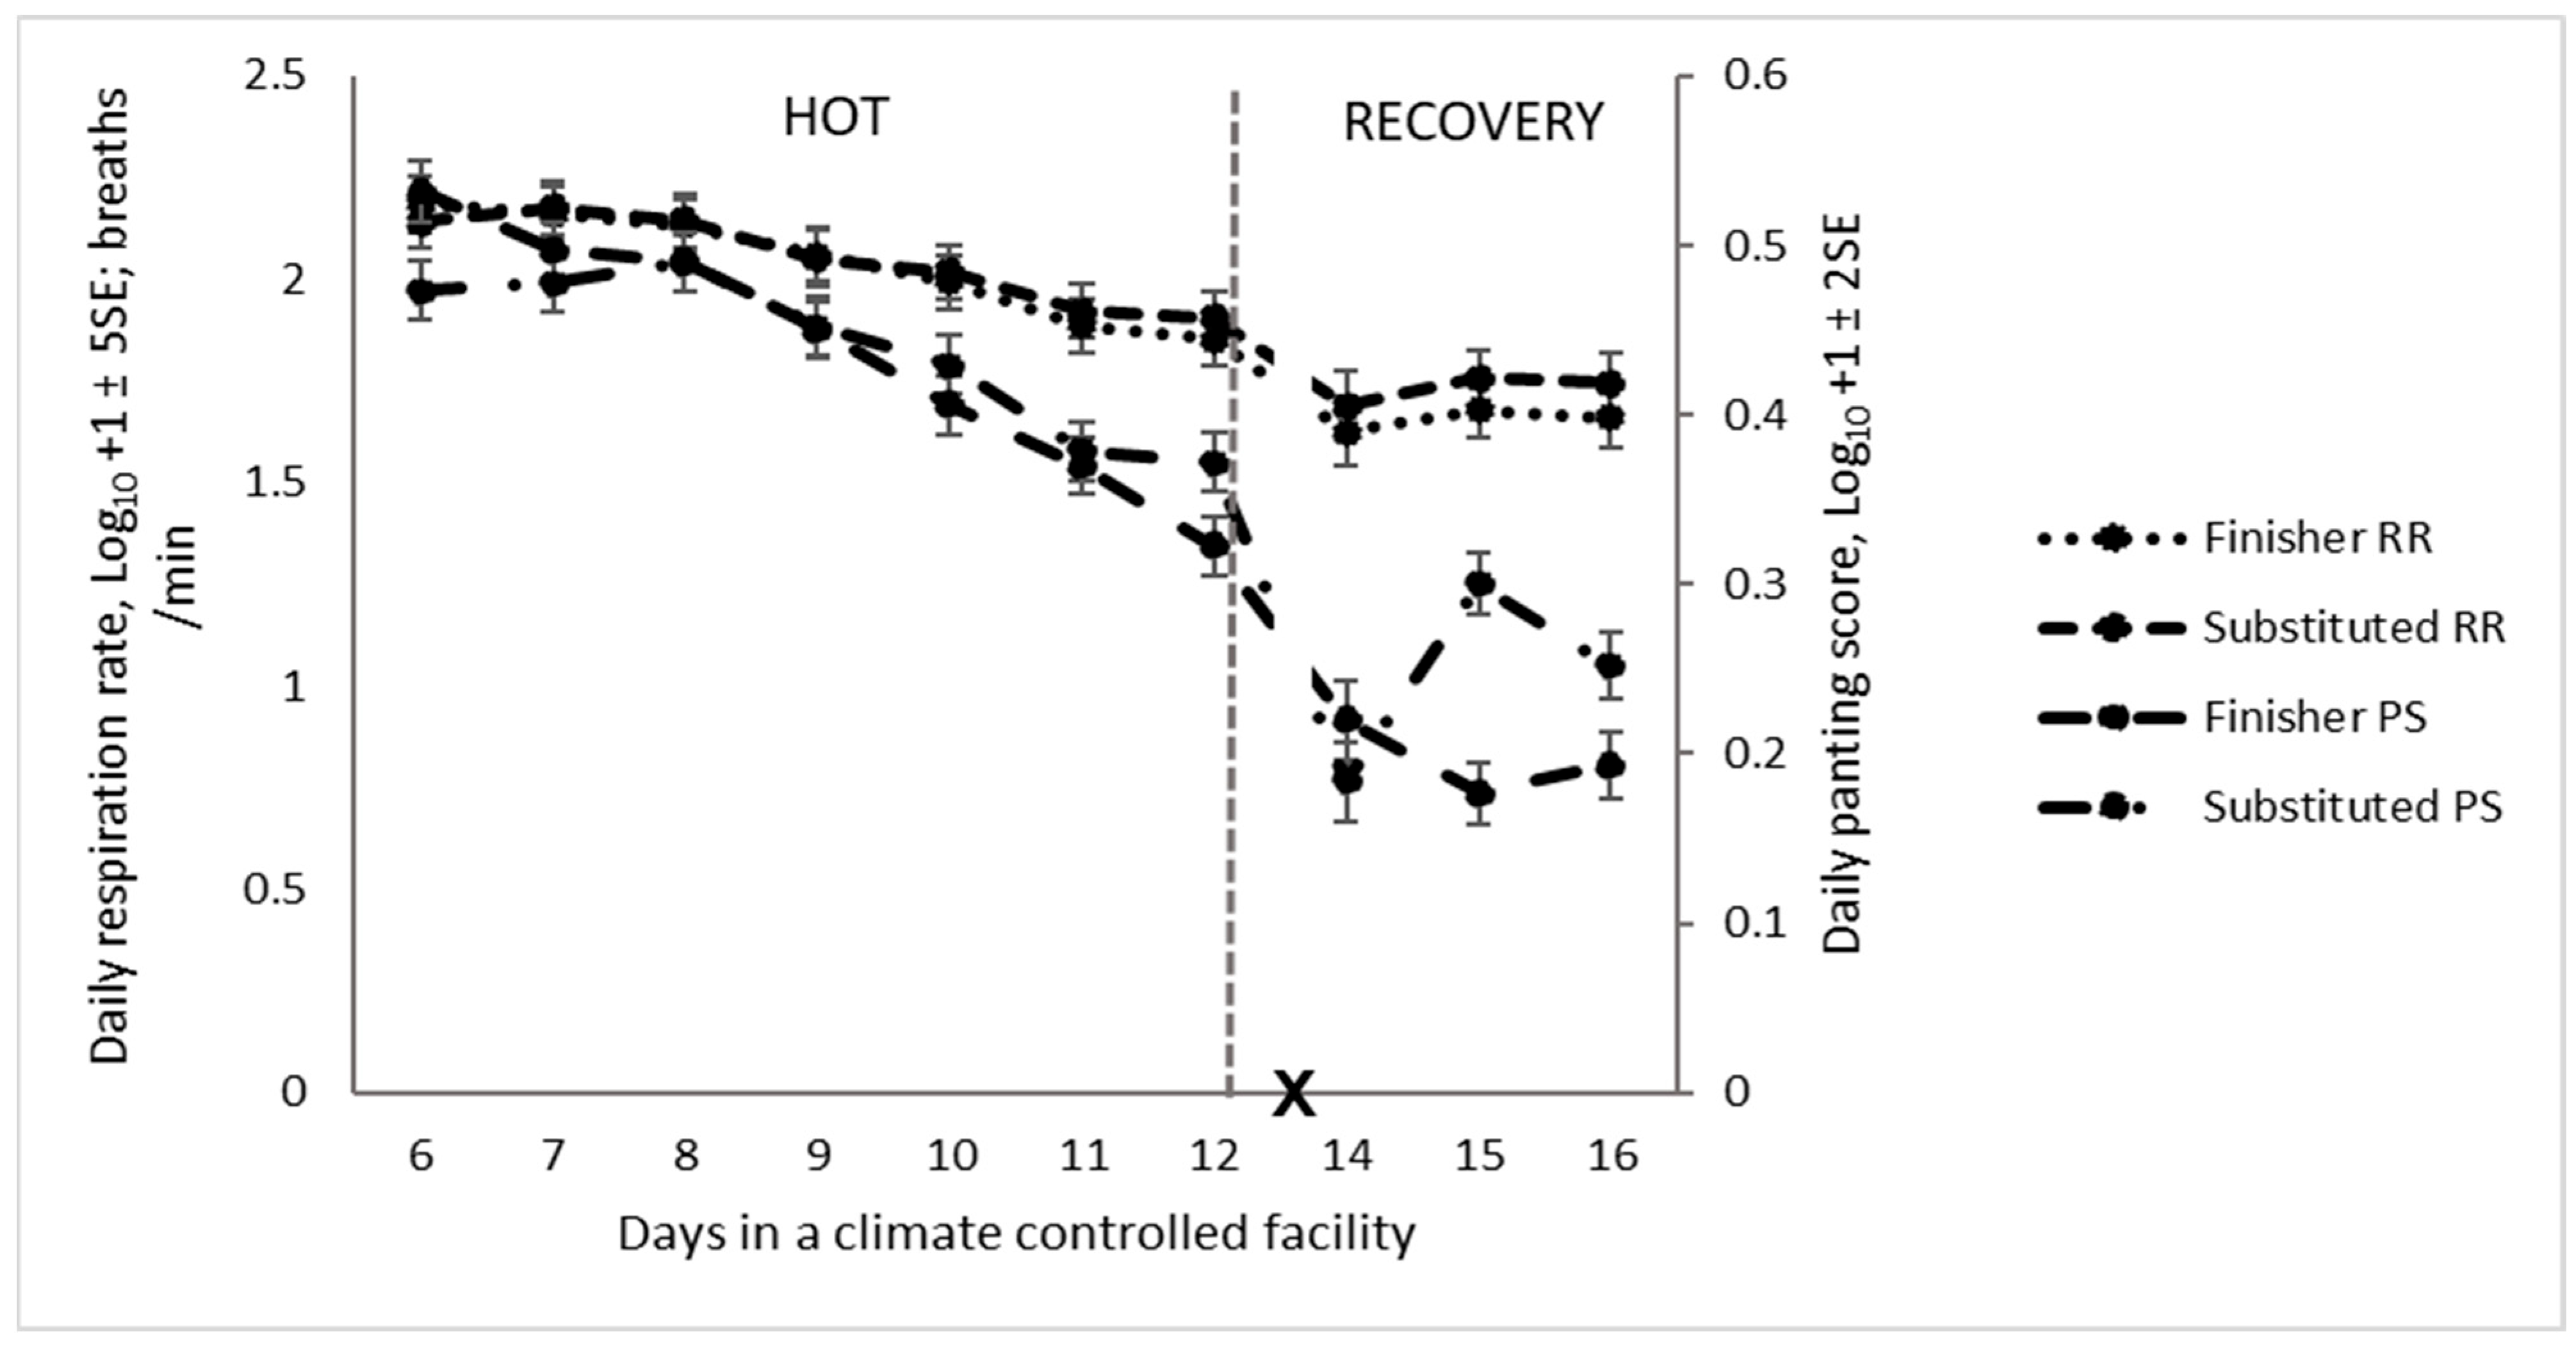
4.5.3. Respiration
5. Limitations
6. Conclusions
Author Contributions
Funding
Institutional Review Board Statement
Informed Consent Statement
Data Availability Statement
Acknowledgments
Conflicts of Interest
References
- Nienaber, J.A.; Hahn, G.L. Livestock production system management responses to thermal challenges. Int. J. Biometeorol. 2007, 52, 149–157. [Google Scholar] [CrossRef]
- Mader, T.L.; Davis, M.S.; Brown-Brandl, T. Environmental factors influencing heat stress in feedlot cattle. J. Anim. Sci. 2006, 84, 712–719. [Google Scholar] [CrossRef] [PubMed]
- Gaughan, J.; Mader, T.; Holt, S.; Sullivan, M.; Hahn, G. Assessing the heat tolerance of 17 beef cattle genotypes. Int. J. Biometeorol. 2010, 54, 617–627. [Google Scholar] [CrossRef]
- Idris, M.; Uddin, J.; Sullivan, M.; McNeill, D.M.; Phillips, C.J.C. Non-Invasive physiological indicators of heat stress in cattle. Animals 2021, 11, 71. [Google Scholar] [CrossRef] [PubMed]
- Gaughan, J.; Bonner, S.; Loxton, I.; Mader, T.; Lisle, A.; Lawrence, R. Effect of shade on body temperature and performance of feedlot steers. J. Anim. Sci. 2010, 88, 4056–4067. [Google Scholar] [CrossRef] [PubMed]
- Scharf, B.; Carroll, J.A.; Riley, D.G.; Chase, C.C., Jr.; Coleman, S.W.; Keisler, D.H.; Weaber, R.L.; Spiers, D.E. Evaluation of physiological and blood serum differences in heat-tolerant (Romosinuano) and heat-susceptible (Angus) Bos taurus cattle during controlled heat challenge. J. Anim. Sci. 2010, 88, 2321–2336. [Google Scholar] [CrossRef]
- Yadav, B.; Singh, G.; Wankar, A. Acclimatization dynamics to extreme heat stress in crossbred cattle. Biol. Rhythm. Res. 2019, 52, 524–534. [Google Scholar] [CrossRef]
- Sejian, V.; Indu, S.; Naqvi, S. Impact of short-term exposure to different environmental temperature on the blood biochemical and endocrine responses of Malpura ewes under semi-arid tropical environment. Indian J. Anim. Sci. 2013, 83, 1155–1160. [Google Scholar] [CrossRef]
- West, J.W. Effects of heat-stress on production in dairy cattle. J. Dairy Sci. 2003, 86, 2131–2144. [Google Scholar] [CrossRef]
- Young, B.A.; Hall, A.B. Heat load in cattle in the Australian environment. In Australian Beef; Coombs, B., Ed.; Morescope Pty Ltd.: Melbourne, Australia, 1993; pp. 143–148. [Google Scholar]
- Hahn, G.; Parkhurst, A.; Gaughan, J. Cattle respiration rate as a function of ambient temperature. Am. Soc. Agric. Eng. 1997, 121, NMC97. [Google Scholar]
- Al-Hosni, Y. Physiological and Rumen Microbial Responses of Angus Cattle (Bos taurus) Following Exposure to Heat Load. Ph.D. Thesis, The University of Queensland, Gatton Campus, Queensland, Australia, 2019. [Google Scholar]
- Brown-Brandl, T.; Eigenberg, R.; Nienaber, J.; Hahn, G.L. Dynamic response indicators of heat stress in shaded and non-shaded feedlot cattle, Part 1: Analyses of indicators. Biosyst. Eng. 2005, 90, 451–462. [Google Scholar] [CrossRef]
- Brown-Brandl, T.M.; Nienaber, J.A.; Eigenberg, R.A.; Mader, T.L.; Morrow, J.; Dailey, J. Comparison of heat tolerance of feedlot heifers of different breeds. Livest. Sci. 2006, 105, 19–26. [Google Scholar] [CrossRef]
- Blackshaw, J.K.; Blackshaw, A. Heat stress in cattle and the effect of shade on production and behaviour: A review. Anim. Prod. Sci. 1994, 34, 285–295. [Google Scholar] [CrossRef]
- Ratnakaran, A.P.; Sejian, V.; Sanjo Jose, V.; Vaswani, S.; Bagath, M. Behavioral responses to livestock adaptation to heat stress challenges. Asian J. Anim. Sci. 2017, 11, 1–13. [Google Scholar] [CrossRef]
- Hansen, P.J. Physiological and cellular adaptations of zebu cattle to thermal stress. Anim. Reprod. Sci. 2004, 82, 349–360. [Google Scholar] [CrossRef] [PubMed]
- Rousing, T.; Bonde, M.; Badsberg, J.H.; Sørensen, J.T. Stepping and kicking behaviour during milking in relation to response in human–animal interaction test and clinical health in loose housed dairy cows. Livest. Prod. Sci. 2004, 88, 1–8. [Google Scholar] [CrossRef]
- Goma, A.A.; Pearce, G.P.; Uddin, J.; Rimon, E.; Davies, H.; Phillips, C.J.C. A forced lateralisation test for dairy cows and its relation to their behaviour. Appl. Anim. Behav. Sci. 2018, 207, 8–19. [Google Scholar] [CrossRef]
- de Oliveira, D.; Keeling, L.J. Routine activities and emotion in the life of dairy cows: Integrating body language into an affective state framework. PLoS ONE 2018, 13, e0195674. [Google Scholar] [CrossRef]
- Idris, M.; Gay, C.C.; Woods, I.G.; Sullivan, M.; Gaughan, J.B.; Phillips, C.J.C. Automated quantification of the behaviour of beef cattle exposed to heat load conditions. Animals 2023, 13, 1125. [Google Scholar] [CrossRef]
- Idris, M. Behavioural and Physiological Responses of Beef Cattle to Hot Environmental Conditions. Ph.D. Thesis, The University of Queensland, Gatton Campus, Australia, 2020. [Google Scholar]
- Sullivan, M.L.; Wijfels, G.; George, A.; Al-Hosni, Y.A.; Olm, J.; Gaughan, J.B. Elliptical and linear relationships with rumen temperature support a homeorhetic trajectory for DMI during recovery of feedlot cattle exposed to moderate heat load. J. Anim. Sci. 2022, 100, skac127. [Google Scholar] [CrossRef]
- Altmann, J. Observational study of behavior: Sampling methods. Behaviour 1974, 49, 227–266. [Google Scholar] [CrossRef] [PubMed]
- Gaughan, J.B.; Mader, T.L.; Holt, S.M.; Lisle, A. A new heat load index for feedlot cattle. J. Anim. Sci. 2008, 86, 226–234. [Google Scholar] [CrossRef]
- Friard, O.; Gamba, M. Boris: A free, versatile open-source event-logging software for video/audio coding and live observations. Methods Ecol. Evol. 2016, 7, 1325–1330. [Google Scholar] [CrossRef]
- Thom, E.C. The discomfort index. Weatherwise 1959, 12, 57–61. [Google Scholar] [CrossRef]
- Benjamini, Y.; Hochberg, Y. Controlling the false discovery rate: A practical and powerful approach to multiple testing. J. R. Stat. Soc. B Stat. Methodol. 1995, 57, 289–300. [Google Scholar] [CrossRef]
- Robins, A.; Berthoux, G.; Santurtun, E.; Navarro, G.; Phillips, C.J. Sheep Quickstep while the Floor Rock and Rolls: Visuomotor Lateralization during Simulated Sea Travel. Animals 2019, 9, 700. [Google Scholar] [CrossRef]
- Hemsworth, P.H.; Rice, M.; Karlen, M.G.; Calleja, L.; Barnett, J.L.; Nash, J.; Coleman, G.J. Human–animal interactions at abattoirs: Relationships between handling and animal stress in sheep and cattle. Appl. Anim. Behav. Sci. 2011, 135, 24–33. [Google Scholar] [CrossRef]
- Boissy, A.; Aubert, A.; Désiré, L.; Greiveldinger, L.; Delval, E.; Veissier, I. Cognitive sciences to relate ear postures to emotions in sheep. Anim. Welf. 2011, 20, 47. [Google Scholar] [CrossRef]
- Gleerup, K.B.; Andersen, P.H.; Munksgaard, L.; Forkman, B. Pain evaluation in dairy cattle. Appl. Anim. Behav. Sci. 2015, 171, 25–32. [Google Scholar] [CrossRef]
- Shultz, T. Weather and shade effects on cow corral activities. J. Dairy Sci. 1984, 67, 868–873. [Google Scholar] [CrossRef]
- Gaughan, J.; Mader, T.; Holt, S. Cooling and feeding strategies to reduce heat load of grain-fed beef cattle in intensive housing. Livest. Sci. 2008, 113, 226–233. [Google Scholar] [CrossRef]
- Baldwin, R.; Smith, N.; Taylor, J.; Sharp, M. Manipulating metabolic parameters to improve growth rate and milk secretion. J. Anim. Sci. 1980, 51, 1416–1428. [Google Scholar] [CrossRef]
- West, J.W. Balancing diets for dairy cattle during heat stress conditions. In Florida Ruminant Nutrition Symposium Proceedings; University of Florida: Gainesville, FL, USA, 1997. [Google Scholar]
- Conte, G.; Ciampolini, R.; Cassandro, M.; Lasagna, E.; Calamari, L.; Bernabucci, U.; Abeni, F. Feeding and nutrition management of heat-stressed dairy ruminants. Ital. J. Anim. Sci. 2018, 17, 604–620. [Google Scholar] [CrossRef]
- Erdman, R.A. Dietary buffering requirements of the lactating dairy cow: A review. J. Dairy Sci. 1988, 71, 3246–3266. [Google Scholar] [CrossRef]
- Mishra, M.; Martz, F.; Stanley, R.; Johnson, H.; Campbell, J.; Hilderbrand, E. Effect of diet and ambient temperature-humidity on ruminal pH, oxidation reduction potential, ammonia and lactic acid in lactating cows. J. Anim. Sci. 1970, 30, 1023–1028. [Google Scholar] [CrossRef]
- Shearer, J. Rumen acidosis, heat stress and laminitis. In Proceedings of the 4th Annual Arizona Dairy Production Conference, Tempe, AZ, USA, 11 October 2005. [Google Scholar]
- Bandaranayaka, D.; Holmes, C. Changes in the composition of milk and rumen contents in cows exposed to a high ambient temperature with controlled feeding. Trop. Anim. Health Prod. 1976, 8, 38–46. [Google Scholar] [CrossRef] [PubMed]
- Niles, M.; Collier, R.; Croom, W. Effects of heat stress on rumen and plasma metabolites and plasma hormone concentrations of Holstein cows. J. Anim. Sci. 1980, 51 (Suppl. 1), 152. [Google Scholar]
- Oetzel, G.R. Subacute ruminal acidosis in dairy herds: Physiology, pathophysiology, milk fat responses, and nutritional management. In Proceedings of the 40th Annual Conference, American Association of Bovine Practitioners, Vancouver, BC, USA, 20–22 September 2007; Volume 17, pp. 89–119. [Google Scholar]
- Hernandez, J.; Benedito, J.L.; Abuelo, A.; Castillo, C. Ruminal acidosis in feedlot: From aetiology to prevention. Sci. World J. 2014, 2014, 702572. [Google Scholar] [CrossRef]
- Abdela, N. Sub-acute ruminal acidosis (SARA) and its consequence in dairy cattle: A review of past and recent research at global prospective. Achiev. Life Sci. 2016, 10, 187–196. [Google Scholar] [CrossRef]
- Navarro, G.; Santurtun, E.; Phillips, C.J. Effects of simulated sea motion on stepping behaviour in sheep. Appl. Anim. Behav. Sci. 2017, 188, 17–25. [Google Scholar]
- Santurtun, E.; Moreau, V.; Marchant-Forde, J.; Phillips, C. Physiological and behavioral responses of sheep to simulated sea transport motions. J. Anim. Sci. 2015, 93, 1250–1257. [Google Scholar] [CrossRef] [PubMed]
- Chapinal, N.; De Passille, A.; Weary, D.; Von Keyserlingk, M.; Rushen, J. Using gait score, walking speed, and lying behavior to detect hoof lesions in dairy cows. J. Dairy Sci. 2009, 92, 4365–4374. [Google Scholar] [CrossRef] [PubMed]
- Neveux, S.; Weary, D.; Rushen, J.; Von Keyserlingk, M.; De Passillé, A. Hoof discomfort changes how dairy cattle distribute their body weight. J. Dairy Sci. 2006, 89, 2503–2509. [Google Scholar] [CrossRef] [PubMed]
- Robins, A.; Phillips, C.J.C. Lateralised visual processing in domestic cattle herds responding to novel and familiar stimuli. Laterality 2010, 15, 514–534. [Google Scholar] [CrossRef] [PubMed]
- Phillips, C.J.C.; Oevermans, H.; Syrett, K.L.; Jespersen, A.Y.; Pearce, G.P. Lateralization of behavior in dairy cows in response to conspecifics and novel persons. J. Dairy Sci. 2015, 98, 2389–2400. [Google Scholar] [CrossRef]
- Rogers, L.J. Hand and paw preferences in relation to the lateralized brain. Philos. Trans. R. Soc. Lond. B Biol. Sci. 2008, 364, 943–954. [Google Scholar] [CrossRef]
- Rogers, L.J. Relevance of brain and behavioural lateralization to animal welfare. Appl. Anim. Behav. Sci. 2010, 127, 1–11. [Google Scholar] [CrossRef]
- Austin, N.; Rogers, L. Asymmetry of flight and escape turning responses in horses. Laterality 2007, 12, 464–474. [Google Scholar] [CrossRef]
- Phillips, C.J.C. Cattle Behaviour and Welfare; Blackwell’s Scientific: Oxford, UK, 2002; pp. 180–297. [Google Scholar]
- Broom, D.M.; Fraser, A.F. Domestic Animal Behaviour and Welfare, 4th ed.; CABI: Wallingford, CT, USA, 2007. [Google Scholar]
- Proctor, H.S.; Carder, G. Can ear postures reliably measure the positive emotional state of cows? Appl. Anim. Behav. Sci. 2014, 161, 20–27. [Google Scholar] [CrossRef]
- Smit, T.H. The use of a quadruped as an in vivo model for the study of the spine–biomechanical considerations. Eur. Spine J. 2002, 11, 137–144. [Google Scholar] [CrossRef]
- Reefmann, N.; Bütikofer Kaszàs, F.; Wechsler, B.; Gygax, L. Ear and tail postures as indicators of emotional valence in sheep. Appl. Anim. Behav. Sci. 2009, 118, 199–207. [Google Scholar] [CrossRef]
- Johnson, R.W. The concept of sickness behavior: A brief chronological account of four key discoveries. Vet. Immunol. Immunopathol. 2002, 87, 443–450. [Google Scholar] [CrossRef] [PubMed]
- Lees, A.M.; Sejian, V.; Wallage, A.L.; Steel, C.C.; Mader, T.L.; Lees, J.C.; Gaughan, J.B. The Impact of Heat Load on Cattle. Animals 2019, 9, 322. [Google Scholar] [CrossRef] [PubMed]
- Soriani, N.; Panella, G.; Calamari, L. Rumination time during the summer season and its relationships with metabolic conditions and milk production. J. Dairy Sci. 2013, 96, 5082–5094. [Google Scholar] [CrossRef]
- Karimi, M.; Ghorbani, G.; Kargar, S.; Drackley, J.K. Late-gestation heat stress abatement on performance and behavior of Holstein dairy cows. J. Dairy Sci. 2015, 98, 6865–6875. [Google Scholar] [CrossRef] [PubMed]
- Lu, C. Effects of heat stress on goat production. Small Rumin. Res. 1989, 2, 151–162. [Google Scholar] [CrossRef]
- Alam, M.; Hashem, M.; Rahman, M.; Hossain, M.; Haque, M.; Sobhan, Z.; Islam, M. Effect of heat stress on behavior, physiological and blood parameters of goat. Progress. Agric. 2011, 22, 37–45. [Google Scholar] [CrossRef]
- Mader, T.L.; Griffin, D. Management of cattle exposed to adverse environmental conditions. Vet. Clin. N. Am. Food Anim. 2015, 31, 247–258. [Google Scholar] [CrossRef]
- Mandel, R.; Whay, H.R.; Nicol, C.J.; Klement, E. The effect of food location, heat load, and intrusive medical procedures on brushing activity in dairy cows. J. Dairy Sci. 2013, 96, 6506–6513. [Google Scholar] [CrossRef]
- Borderas, T.F.; de Passillé, A.M.; Rushen, J. Behavior of dairy calves after a low dose of bacterial endotoxin. J. Anim. Sci. 2008, 86, 2920–2927. [Google Scholar] [CrossRef]
- Fogsgaard, K.K.; Røntved, C.M.; Sørensen, P.; Herskin, M.S. Sickness behavior in dairy cows during Escherichia coli mastitis. J. Dairy Sci. 2012, 95, 630–638. [Google Scholar] [CrossRef]
- Hart, B.L. Biological basis of the behavior of sick animals. Neurosci. Biobehav. Rev. 1988, 12, 123–137. [Google Scholar] [CrossRef]
- Gaughan, J.; Holt, S.; Hahn, G.; Mader, T.; Eigenberg, R. Respiration rate: Is it a good measure of heat stress in cattle? Asian-Australas. J. Anim. Sci. 2000, 13, 329–332. [Google Scholar]
- Gaughan, J.B. Respiration Rate and Rectal Temperature Responses of Feedlot Cattle in Dynamic, Thermally Challenging Environments. Ph.D. Thesis, The University of Queensland, Gatton Campus, Australia, 2002. [Google Scholar]
- Brown-Brandl, T.M.; Eigenberg, R.A.; Nienaber, J.A. Heat stress risk factors of feedlot heifers’. Livest. Sci. 2006, 105, 57–68. [Google Scholar] [CrossRef]
- Handcock, R.N.; Swain, D.L.; Bishop-Hurley, G.J.; Patison, K.P.; Wark, T.; Valencia, P.; Corke, P.; O’Neill, C.J. Monitoring animal behaviour and environmental interactions using wireless sensor networks, GPS collars and satellite remote sensing. Sensors 2009, 9, 3586–3603. [Google Scholar] [CrossRef] [PubMed]
- Umemura, K. Monitoring grazing bites and walking activity with pedometers. J. Dairy Sci. 2013, 96, 1090–1093. [Google Scholar] [CrossRef]
- Gonzalez, L.; Bishop-Hurley, G.; Henry, D.; Charmley, E. Wireless sensor networks to study, monitor and manage cattle in grazing systems. Anim. Prod. Sci. 2014, 54, 1687–1693. [Google Scholar] [CrossRef]


| Day | Treatment Phase | Min TA (°C) | Max TA (°C) | Mean TA (°C) | Min RH (%) | Max RH (%) | Mean RH (%) | Min THI | Max THI | Mean THI |
|---|---|---|---|---|---|---|---|---|---|---|
| 0 | ACC | 19.7 | 21.0 | 20.1 | 60.9 | 90.6 | 66.2 | 65.5 | 69.1 | 66.3 |
| 1 | ACC | 19.7 | 21.0 | 20.1 | 60.9 | 90.6 | 66.2 | 65.5 | 69.1 | 66.3 |
| 2 | ACC | 19.5 | 21.6 | 20.0 | 60.0 | 89.3 | 67.1 | 65.3 | 68.9 | 66.2 |
| 3 | TN | 19.5 | 20.8 | 19.9 | 61.3 | 90.1 | 67.9 | 65.3 | 68.8 | 66.1 |
| 4 | TN | 19.6 | 24.0 | 20.2 | 60.0 | 89.1 | 68.2 | 65.5 | 72.0 | 66.4 |
| 5 | TP1 | 19.9 | 40.5 | 33.2 | 42.9 | 88.4 | 66.1 | 66.3 | 92.6 | 84.9 |
| Finisher Dietary Cohort: Transition to 30 °C from 00:00 h on day 5 Substituted Dietary Cohort: Transition to 30 °C from 21:00 h on day 5 | ||||||||||
| 6 | HOT | 28.4 | 40.2 | 33.0 | 43.3 | 82.8 | 65.8 | 80.5 | 91.8 | 84.8 |
| 7 | HOT | 28.4 | 38.1 | 32.1 | 42.3 | 84.2 | 63.7 | 78.3 | 89.1 | 83.0 |
| 8 | HOT | 24.9 | 34.3 | 28.7 | 44.3 | 82.0 | 65.9 | 73.6 | 85.0 | 78.4 |
| 9 | HOT | 22.6 | 34.4 | 28.0 | 45.81 | 79.5 | 66.2 | 69.9 | 85.7 | 77.5 |
| 10 | HOT | 20.6 | 30.3 | 24.3 | 54.4 | 80.5 | 66.7 | 67.2 | 80.0 | 72.3 |
| 11 | HOT | 20.4 | 30.4 | 24.2 | 45.3 | 80.6 | 65.8 | 67.1 | 79.2 | 72.0 |
| 12 | HOT | 19.7 | 21.3 | 20.3 | 50.0 | 90.5 | 64.6 | 65.8 | 68.8 | 66.4 |
| 13 | TP2 | 19.7 | 20.7 | 20.1 | 56.4 | 91.3 | 65.5 | 65.6 | 68.6 | 66.2 |
| 14 | Recovery | 19.7 | 21.4 | 20.1 | 58.1 | 89.0 | 66.7 | 65.6 | 69.6 | 66.2 |
| 15 | Recovery | 19.6 | 20.5 | 19.9 | 58.4 | 90.3 | 66.4 | 65.6 | 68.2 | 66.0 |
| 16 | Recovery | 19.4 | 25.0 | 20.5 | 57.8 | 93.5 | 66.4 | 65.2 | 73.2 | 66.8 |
| 17 | Recovery | 19.3 | 23.7 | 21.1 | 58.1 | 69.0 | 61.9 | 64.9 | 71.1 | 67.5 |
| Item | Starter | Intermediate | Finisher | Substituted |
|---|---|---|---|---|
| Ingredients, % of diet | ||||
| Grain mix * | 62.1 | 74.5 | 86.8 | 78.7 |
| Whole cottonseed | 9.0 | 16.5 | 9.0 | 9.0 |
| Lucerne hay | 28.9 | 9.0 | 4.2 | 12.3 |
| Nutrient composition | ||||
| DM, g/kg fresh weight | 880 | 893 | 887 | 886 |
| ADF, g/kg DM | 263 | 257 | 119 | 177 |
| NDF, g/kg DM | 404 | 375 | 229 | 253 |
| NEg, MJ/kg DM | 29 | 29 | 30 | 30 |
| ME, MJ/kg DM | 116 | 119 | 132 | 131 |
| DE, MJ/kg DM | 143 | 147 | 163 | 162 |
| Crude fibre, g/kg DM | 218 | 197 | 87 | 124 |
| Nitrogen-free extract, g/kg DM | 503 | 548 | 678 | 685 |
| Fat, g/kg DM | 46 | 43 | 46 | 43 |
| Feed digestibility, g/kg DM | 768 | 791 | 861 | 868 |
| Digestible DM, g/kg DM | 676 | 707 | 763 | 769 |
| Digestible protein g/kg DM | 133 | 125 | 130 | 131 |
| Starch, g/kg DM | 229 | 218 | 432 | 432 |
| Item | Description |
|---|---|
| Respiration rate | Time taken for 10 breaths, determined by flank movement |
| Panting score | Animal visually scored for the extent of panting based on a score scale of 0 to 4.5 |
| Standing | Animal standing with limb positioned upright |
| Lying | Animal resting on the floor with their limb laterally or sternally recumbent |
| Eating | Animal consuming feed at the trough |
| Chews while eating | Chews counted for one minute at the time of morning feed |
| Rumination | Animal chewing a bolus or regurgitating bolus |
| Grooming | Animal licking any part of the body or striking one part with another part of the body |
| Scratching | Animal rubbing or striking any part of the body against the fixture of the pen |
| Ear positions | |
| Ear raised | Both ears held upright above the neck with the ear pinnae facing forward or to the side |
| Ear forward | Both ear pinnae directed forward in front of the focal animal and the ear held horizontally |
| Ear backward | Both ears being held backward on the focal animal’s head |
| Ear downward | Both ears being loosely hung downward, falling perpendicular to the head |
| Ear specific | Both ear pinnae (right and left) oriented in the opposite direction or perpendicular to the head rump axis, failing to satisfy raised, forward, backward, and downward ear positions |
| Head positions | |
| Head raised | The head held upright above the withers or the body’s topline |
| Head neutral | The head held horizontally at the level of the withers or the body’s topline |
| Head downward | The head held downward below the withers or the body’s topline |
| Stepping | |
| Front right (FR) limb | Animal raising a front right limb and replacing it forthwith on the surface of the pen |
| Front left (FL) limb | Animal raising a front left limb and replacing it forthwith on the surface of the pen |
| Back right (BR) limb | Animal raising a back right limb and replacing it forthwith on the surface of the pen |
| Back left (BL) limb | Animal raising a back left limb and replacing it forthwith on the surface of the pen |
| Tail positions | |
| Tail raised | Tail held in a fixed position, held at 45 degrees from the vertical position |
| Tail vertical | Tail hanging downward from the vertical line of the body and is vertical with no movements |
| Tail swishing | Swift movement of the tail in any direction around the hind quarters from its base in a side-to-side flicking manner |
| Tail tucked | Tail held tightly pressed in a fixed position against the rump, with the tip of the tail tucked behind the hind limb |
| Behaviour | Finisher Diet | Substituted Diet | SED | F-Value (1, 18 d.f. †) | p-Value | |||
|---|---|---|---|---|---|---|---|---|
| TN | HOT | TN | HOT | Period (P) | D × P | |||
| Stepping | ||||||||
| FR limb, Log10 + 1 counts/5 min | 0.69 | 0.79 | 0.70 | 0.79 | ||||
| (counts/5 min) | (3.90) | (5.17) | (4.01) | (5.17) | 0.0074 | 331.35 | ≤0.001 | 0.15 |
| FL limb, Log10 + 1 counts/5 min | 0.73 | 0.84 | 0.68 | 0.81 | ||||
| (counts/5 min) | (4.37) | (5.92) | (3.79) | (5.46) | 0.0103 | 276.25 | ≤0.001 | 0.51 |
| BR limb, Log10 + 1 counts/5 min | 0.81 | 1.03 | 0.71 | 0.97 | ||||
| (counts/5 min) | (5.46) | (9.72) | (4.13) | (8.33) | 0.023 | 229.66 | ≤0.001 | 0.24 |
| BL limb, Log10 + 1 counts/5 min | 0.84 | 1.06 | 0.71 | 0.99 | ||||
| (counts/5 min) | (5.92) | (10.48) | (4.13) | (8.77) | 0.025 | 200.85 | ≤0.001 | 0.17 |
| Total stepping, Log10 + 1 counts/5 min | 1.31 | 1.51 | 1.23 | 1.46 | ||||
| (counts/5 min) | (19.42) | (31.36) | (15.98) | (27.84) | 0.0198 | 233.90 | ≤0.001 | 0.37 |
| R/L limb, ratio of Log10 + 1 counts/5 min | 0.28 | 0.28 | 0.31 | 0.29 | ||||
| (ratio of counts/5 min) | (0.91) | (0.91) | (1.04) | (0.95) | 0.0158 | 6.73 | 0.02 | 0.064 |
| F/B limb, ratio of Log10 + 1 counts/5 min | 0.24 | 0.19 | 0.28 | 0.21 | ||||
| (ratio of counts/5 min) | (0.74) | (0.55) | (0.91) | (0.62) | 0.0112 | 57.88 | ≤0.001 | 0.24 |
| Standing/lying | ||||||||
| Standing, Log10 + 1 prop. time | 0.14 | 0.17 | 0.15 | 0.17 | ||||
| (prop. time) | (0.38) | (0.48) | (0.41) | (0.48) | 0.00202 | 254.50 | ≤0.001 | 0.075 |
| Lying, Log10 + 1 prop. time | 0.21 | 0.18 | 0.20 | 0.18 | ||||
| (prop. time) | (0.62) | (0.51) | (0.59) | (0.51) | 0.0012 | 836 | ≤0.001 | 0.71 |
| Ears, head, and tail | ||||||||
| Ear backward, Log10 + 1 prop. time | 0.088 c | 0.23 a | 0.0501 d | 0.17 b | ||||
| (prop. time) | (0.22) | (0.71) | (0.12) | (0.49) | 0.00242 | 6108.09 | ≤0.001 | ≤0.001 |
| Ear forward, Log10 + 1 prop. time | 0.11 | 0.0396 | 0.11 | 0.047 | ||||
| (prop. time) | (0.29) | (0.095) | (0.29) | (0.12) | 0.00488 | 386.44 | ≤0.001 | 0.24 |
| Ear axial, Log10 + 1 prop. time | 0.078 b | 0.0304 c | 0.11 a | 0.094 a | ||||
| (prop. time) | (0.19) | (0.073) | (0.276) | (0.24) | 0.00389 | 116.37 | ≤0.001 | ≤0.001 |
| Head downward, Log10 + 1 prop. time | 0.014 c | 0.13 a | 0.016 c | 0.099 b | ||||
| (prop. time) | (0.033) | (0.34) | (0.037) | (0.26) | 0.00716 | 387.1 | ≤0.001 | 0.01 |
| Head neutral, Log10 + 1 prop. time | 0.28 | 0.21 | 0.27 | 0.22 | ||||
| (prop. time) | (0.88) | (0.63) | (0.88) | (0.66) | 0.0049 | 272.19 | ≤0.001 | 0.096 |
| Tail vertical, Log10 + 1 prop. time | 0.27 c | 0.29 a | 0.27 c | 0.28 b | ||||
| (prop. time) | (0.86) | (0.96) | (0.85) | (0.92) | 0.00181 | 227.66 (1, 8) | ≤0.001 | 0.002 |
| Tail swishing, Log10 + 1 prop. time | 0.000157 | 0.000629 | 0.000846 | 0.000646 | ||||
| (prop. time) | (0.000362) | (0.00145) | (0.00195) | (0.00149) | 0.0000505 | 0.14 | 0.71 | 0.36 |
| Oral behaviours | ||||||||
| Groom, Log10 + 1 prop. time | 0.0081 | 0.0017 | 0.011 | 0.0055 | ||||
| (prop. time) | (0.019) | (0.00397) | (0.29) | (0.013) | 0.000335 | 629.29 | ≤0.001 | 0.14 |
| Scratch, Log10 + 1 prop. time | 0.0047 | 0.00085 | 0.0056 | 0.0018 | ||||
| (prop. time) | (0.011) | (0.0019) | (0.013) | (0.00404) | 0.000492 | 120.87 | ≤0.001 | 0.99 |
| Rumination, Log10 + 1 prop. time | 0.067 a | 0.016 c | 0.066 a | 0.026 b | ||||
| (prop. time) | (0.17) | (0.038) | (0.16) | (0.061) | 0.00181 | 1260.63 | ≤0.001 | 0.001 |
| Eating, Log10 + 1 prop. time | 0.015 | 0.0041 | 0.017 | 0.0067 | ||||
| (prop. time) | (0.034) | (0.0094) | (0.039) | (0.016) | 0.000894 | 318.49 | ≤0.001 | 0.55 |
| Chewing while eating, Log10 + 1 chews/minute | 0.067 a | 0.016 c | 0.066 a | 0.026 b | ||||
| (chews/minute) | (0.17) | (0.038) | (0.16) | (0.061) | 0.00181 | 1260.63 | ≤0.001 | 0.001 |
| Dry matter intake, Log10 + 1 kg/day | 1.05 | 0.79 | 1.08 | 0.83 | ||||
| (kg/day) | (10.22) | (5.17) | (11.02) | (5.76) | 0.0312 | 135.32 | ≤0.001 | 0.94 |
| Respiration rate, Log10 + 1 breaths/min | 1.77 | 2.06 | 1.80 | 2.07 | ||||
| (breaths/min) | (57.88) | (113.82) | (62.1) | (116.49) | 0.00716 | 2939.5 | ≤0.001 | 0.055 |
| Panting score (PS), Log10 + 1 PS score | 0.31 b | 0.44 a | 0.34 b | 0.44 a | ||||
| (PS score) | (1.04) | (1.75) | (1.19) | (1.75) | 0.00716 | 547.79 | ≤0.001 | 0.04 |
| Behaviour | Finisher Diet | Substituted Diet | SED | F-Value (d.f. †) | p-Value | |||||
|---|---|---|---|---|---|---|---|---|---|---|
| HOT | Recovery | HOT | Recovery | Period (P) | Diet (D) | D × P | D × d | |||
| Stepping | ||||||||||
| FR limb, Log10 + 1 counts/5 min | 0.81 | 0.71 | 0.70 | 0.52 | ||||||
| (counts/5 min) | (5.51) | (4.07) | (4.02) | (2.29) | 0.061 | 47.69 (1, 162) | ≤0.001 | 0.03 | 0.08 | ≤0.001 |
| FL limb, Log10 + 1 counts/5 min | 0.84 a | 0.71 a | 0.73 ab | 0.50 c | ||||||
| (counts/5 min) | (5.90) | (4.07) | (4.46) | (2.15) | 0.064 | 71.17 (1, 162) | ≤0.001 | 0.006 | 0.02 | ≤0.001 |
| BR limb, Log10 + 1 counts/5 min | 0.98 a | 0.86 b | 0.91 ab | 0.64 c | ||||||
| (counts/5 min) | (8.58) | (6.25) | (7.06) | (3.32) | 0.077 | 54.54 (1, 162) | ≤0.001 | 0.02 | 0.005 | ≤0.001 |
| BL limb, Log10 + 1 counts/5 min | 1.04 | 0.85 | 0.91 | 0.64 | ||||||
| (counts/5 min) | (9.91) | (6.03) | (7.10) | (3.39) | 0.073 | 82.07 (1, 162) | ≤0.001 | 0.01 | 0.142 | ≤0.001 |
| Total stepping, Log10 + 1 counts/5 min | 1.50 a | 1.33 b | 1.36 ab | 1.07 c | ||||||
| (counts/5 min) | (30.37) | (20.38) | (22.14) | (10.85) | 0.076 | 74.46 (1, 162) | ≤0.001 | 0.006 | 0.02 | ≤0.001 |
| R/L limb, ratio of Log10 + 1 counts/5 min | 0.28 | 0.31 | 0.30 | 0.32 | ||||||
| (ratio of counts/5 min) | (0.89) | (1.02) | (0.98) | (1.07) | 0.014 | 27.31 (1, 162) | ≤0.001 | 0.04 | 0.28 | ≤0.001 |
| F/B limb, ratio of Log10 + 1 counts/5 min | 0.20 | 0.22 | 0.23 | 0.25 | ||||||
| (ratio of counts/5 min) | (0.58) | (0.65) | (0.68) | (0.77) | 0.023 | 6.55 (1, 162) | 0.01 | 0.07 | 0.79 | 0.22 |
| Standing/lying | ||||||||||
| Standing, Log10 + 1 prop. time | 0.18 | 0.18 | 0.15 | 0.13 | ||||||
| (prop. time) | (0.52) | (0.51) | (0.42) | (0.36) | 0.014 | 4.27 (1, 162) | 0.04 | 0.01 | 0.14 | 0.07 |
| Lying, Log10 + 1 prop. time | 0.17 b | 0.16 b | 0.19 b | 0.21 a | ||||||
| (prop. time) | (0.47) | (0.46) | (0.54) | (0.61) | 0.014 | 2.96 (1, 162) | 0.09 | 0.03 | 0.01 | 0.03 |
| Ears, head, and tail | ||||||||||
| Ear backward, Log10 + 1 prop. time | 0.24 a | 0.064 c | 0.16 b | 0.066 c | ||||||
| (prop. time) | (0.72) | (0.160) | (0.45) | (0.164) | 0.0188 | 423 (1, 162) | ≤0.001 | ≤0.001 | ≤0.001 | ≤0.001 |
| Ear forward, Log10 + 1 prop. time | 0.038 b | 0.087 a | 0.047 b | 0.077 a | ||||||
| (prop. time) | (0.091) | (0.223) | (0.115) | (0.194) | 0.0112 | 104.71 (1, 162) | ≤0.001 | 0.94 | 0.01 | 0.03 |
| Ear axial, Log10 + 1 prop. time | 0.024 c | 0.13 a | 0.095 b | 0.12 a | ||||||
| (prop. time) | (0.057) | (0.34) | (0.245) | (0.32) | 0.0155 | 140 (1, 162) | ≤0.001 | 0.01 | ≤0.001 | ≤0.001 |
| Head downward, Log10 + 1 prop. time | 0.134 a | 0.037 c | 0.085 b | 0.037 c | ||||||
| (prop. time) | (0.360) | (0.090) | (0.22) | (0.088) | 0.0189 | 123 (1, 162) | ≤0.001 | 0.03 | ≤0.001 | 0.002 |
| Head neutral, Log10 + 1 prop. time | 0.20 c | 0.25 a | 0.23 b | 0.24 ab | ||||||
| (prop. time) | (0.59) | (0.79) | (0.68) | (0.74) | 0.018 | 29.43 (1, 162) | ≤0.001 | 0.54 | 0.006 | 0.01 |
| Tail vertical, Log10 + 1 prop. time | 0.296 | 0.270 | 0.278 | 0.251 | ||||||
| (prop. time) | (0.978) | (0.864) | (0.898) | (0.782) | 0.0124 | 38.70 (1, 162) | ≤0.001 | 0.008 | 0.86 | 0.30 |
| Tail swishing, Log10 + 1 prop. time | 0.00088 | 0.0071 | 0.00039 | 0.0034 | ||||||
| (prop. time) | (0.0020) | (0.017) | (0.00089) | (0.0078) | 0.00649 | 4.21 (1, 179) | 0.042 | 0.35 | 0.47 | 0.84 |
| Oral behaviours | ||||||||||
| Groom, Log10 + 1 prop. time | 0.0023 c | 0.016 a | 0.0046 c | 0.011 b | ||||||
| (prop. time) | (0.0053) | (0.038) | (0.011) | (0.026) | 0.00246 | 140.71 (1, 161) | ≤0.001 | 0.295 | ≤0.001 | 0.002 |
| Scratch, Log10 + 1 prop. time | 0.00093 c | 0.012 a | 0.0015 c | 0.0066 b | ||||||
| (prop. time) | (0.0021) | (0.028) | (0.0035) | (0.015) | 0.00197 | 132 (1, 157) | ≤0.001 | 0.038 | ≤0.001 | 0.90 |
| Rumination, Log10 + 1 prop. time | 0.012 d | 0.059 a | 0.029 c | 0.047 b | ||||||
| (prop. time) | (0.029) | (0.145) | (0.067) | (0.113) | 0.010 | 85.21 (1, 162) | ≤0.001 | 0.60 | ≤0.001 | 0.04 |
| Eating, Log10 + 1 prop. time | 0.0035 | 0.0075 | 0.0069 | 0.012 | ||||||
| (prop. time) | (0.0081) | (0.017) | (0.016) | (0.028) | 0.00411 | 9.57 (1, 162) | 0.002 | 0.06 | 0.80 | 0.05 |
| Chewing while eating, Log10 + 1 chews/minute | 1.85 | 1.97 | 1.87 | 1.97 | ||||||
| (chews/minute) | (70.21) | (91.70) | (73.32) | (92.28) | 0.0155 | 373.86 (1, 128) | ≤0.001 | 0.19 | 0.15 | 0.05 |
| Dry matter intake, Log10 + 1 kg/day | 0.76 | 0.95 | 0.80 | 0.98 | ||||||
| (kg/day) | (4.80) | (7.98) | (5.28) | (8.45) | 0.045 | 140.69 (1, 162) | ≤0.001 | 0.36 | 0.70 | 0.75 |
| Respiration rate, Log10 + 1 breaths/min | 2.04 a | 1.66 c | 2.05 a | 1.73 b | ||||||
| (breaths/min) | (108.27) | (44.19) | (111.61) | (52.70) | 0.0441 | 6923.51 (1, 3810.59) | ≤0.001 | 0.02 | ≤0.001 | ≤0.001 |
| Panting score (PS), Log10 + 1 PS score | 0.44 a | 0.20 c | 0.44 a | 0.25 b | 3882.21 | |||||
| (PS score) | (1.74) | (0.57) | (1.75) | (0.76) | 0.036 | (1, 3809.74) | ≤0.001 | 0.02 | ≤0.001 | ≤0.001 |
| Behaviour in the Hot Period–Prior TN Period | Differential Mean ± SE (Prop. of Time) for the 2 Periods | Feedlot Behaviour | Correlation Coefficient | p-Value |
|---|---|---|---|---|
| Head downward | 0.26 ± 0.02 | Head downward | 0.537 | 0.015 |
| Ear backward | 0.43 ± 0.02 | Head downward | 0.704 | 0.001 |
| 0.43 ± 0.02 | Ear forward | 0.694 | 0.001 | |
| 0.43 ± 0.02 | Ear axial | −0.699 | 0.001 | |
| Tail vertical | 0.084 ± 0.007 | Tail tucked | 0.530 | 0.016 |
| 0.084 ± 0.007 | Ear forward | 0.592 | 0.006 | |
| 0.084 ± 0.007 | Head downward | 0.689 | 0.001 | |
| Rumination | −0.12 ± 0.004 | Ear forward | −0.581 | 0.007 |
| −0.12 ± 0.004 | Tail tucked | −0.605 | 0.005 | |
| −0.12 ± 0.004 | Tail vertical | −0.554 | 0.011 | |
| Standing | 0.076 ± 0.005 | Scratching | 0.561 | 0.010 |
| 0.076 ± 0.005 | Head neutral | −0.537 | 0.015 |
Disclaimer/Publisher’s Note: The statements, opinions and data contained in all publications are solely those of the individual author(s) and contributor(s) and not of MDPI and/or the editor(s). MDPI and/or the editor(s) disclaim responsibility for any injury to people or property resulting from any ideas, methods, instructions or products referred to in the content. |
© 2024 by the authors. Licensee MDPI, Basel, Switzerland. This article is an open access article distributed under the terms and conditions of the Creative Commons Attribution (CC BY) license (https://creativecommons.org/licenses/by/4.0/).
Share and Cite
Idris, M.; Sullivan, M.; Gaughan, J.B.; Phillips, C.J.C. Behavioural Responses of Beef Cattle to Hot Conditions. Animals 2024, 14, 2444. https://doi.org/10.3390/ani14162444
Idris M, Sullivan M, Gaughan JB, Phillips CJC. Behavioural Responses of Beef Cattle to Hot Conditions. Animals. 2024; 14(16):2444. https://doi.org/10.3390/ani14162444
Chicago/Turabian StyleIdris, Musadiq, Megan Sullivan, John B. Gaughan, and Clive J. C. Phillips. 2024. "Behavioural Responses of Beef Cattle to Hot Conditions" Animals 14, no. 16: 2444. https://doi.org/10.3390/ani14162444