Article

Whole Mitochondrial Genome Sequencing and Phylogenetic Tree Construction for Procypris mera (Lin 1933)

by
Zhe Li
1,2,
Yaoquan Han
2,
Yusen Li
2,
Weijun Wu
2,
Jianjun Lei
2,
Dapeng Wang
2,
Yong Lin
2,* and
Xiaoqing Wang
1,*
1
College of Fisheries, Hunan Agricultural University, Changsha 410128, China
2
ASEAN Key Laboratory of Comprehensive Exploitation and Utilization of Aquatic Germplasm Resources, Ministry of Agriculture and Rural Affairs, Key Laboratory of Aquaculture Genetic and Breeding and Healthy Aquaculture of Guangxi, Guangxi Academy of Fishery Sciences, Nanning 530021, China
*
Authors to whom correspondence should be addressed.
Animals 2024, 14(18), 2672; https://doi.org/10.3390/ani14182672
Submission received: 31 July 2024 / Revised: 4 September 2024 / Accepted: 9 September 2024 / Published: 13 September 2024

Abstract

:

Simple Summary

As a fish under second-class protection in China, the structure and characteristics of the mitochondrial genome Procypris mera (Lin, 1933) have not been reported. We reported three mitochondrial genomes of P. mera from three sites and conducted a detailed analysis of their characteristics, which were employed to infer phylogenetic relationships. These findings revealed that the mitochondrial genomes of P. mera from the different sites exhibited considerable similarity. Furthermore, the phylogenetic tree constructed from amino acid sequences supported the original phylogenetic relationships of the subfamily Cyprininae in China, suggesting that the genus Puntioplites is sister to all other genera of the subfamily Cyprinidae of China; the genus Procypris forms a monophyletic group; and the genera Carassioides, Carassius, and Cyprinus form a monophyletic group.

Abstract

Procypris mera (Lin, 1933), also known as the Chinese ink carp, currently has a second-class protection status in China. Understanding the structure and characteristics of mitochondrial genes provides essential information for resource conservation and phylogenetic studies of P. mera. Here, we sequenced the mitochondrial genomes of three P. mera (WYL1-3) from three sites and performed phylogenetic analysis. The generated three genomes were 16,587 bp in length, comprising 13 protein-coding genes (PCGs), 22 tRNAs, two rRNAs, and two non-coding regions (control region (CR), D-loop, and light-stranded replication start OL), with a preference for codons ending in A or C. The mitochondrial genomes of WYL2 and WYL3 were identical, differing from that of WYL1 by only five single-nucleotide polymorphisms (SNPs). All mitochondrial PCGs had Ka/Ks ratios of less than one, suggesting purifying selection. Phylogenetic tree analysis based on amino acid sequences suggested that the genus Puntioplites is sister to all other genera of the subfamily Cyprinidae of China; the genus Procypris forms a monophyletic group; and the genera Carassioides, Carassius, and Cyprinus form a monophyletic group. This study contributes to our understanding of the phylogenetic relationships in subfamily Cyprininae in China and lays the foundation for resource conservation and management of P. mera.

1. Introduction

Procypris mera (Lin, 1933), also known as the Chinese ink carp, is an endemic species in China and belongs to the order Cypriniformes, family Cyprinidae, subfamily Cyprininae, and genus Procypris (S.Y. Lin, 1933) [1]. Historically, P. mera was distributed in the upper reaches of the Xijiang River, both in main streams and tributaries [1]. However, over the past two decades, its population has declined, with no resources in many waters, leading to its classification as an endangered species. It is listed as endangered in the Red Book of China’s Endangered Animals and as vulnerable on the IUCN Red List of Threatened Species [2]. Additionally, in 2021, P. mera was included in the second tier of China’s State Key Wildlife for Protection; this means that it is a very important protected animal, which is less numerous and is threatened with extinction in the wild. The Guangxi Academy of Fisheries Sciences has been working on the conservation of the P. mera resource since 2016. It has cumulatively stocked and released more than 600,000 individuals of P. mera. Limited studies have been conducted on its artificial propagation [3], embryonic development [4], and morphological traits [5]. Despite efforts to conserve this species, significant challenges remain. The unclear distribution pattern of P. mera is a major obstacle to the development of precise strategies for stock enhancement and effective conservation measures. In addition, there is a lack of valid reference data for the assessment of the genetic diversity of populations.
Mitochondrial DNA (mtDNA) is crucial for genetic studies, with the advantages of rapid evolution, maternal inheritance, small genome size for efficient sequencing and analysis, high copy number (4–6 per mitochondrion across tissues), evolutional stability with limited recombination, and low tissue-specific variation. mtDNA is well conserved and widely used to explore evolutionary origins, construct phylogenetic trees, and analyze population dynamics [6,7,8,9]. Mitochondrial genomes have been extensively used to investigate evolutionary origins, construct phylogenetic trees, develop environmental DNA-specific primers, and analyze population phylogeography [10,11,12].
Therefore, we aimed to sequence the mitochondrial genomes of three P. mera individuals from different sites to determine whether there are differences between populations and to construct a phylogenetic tree for the subfamily Cyprininae in China. The objective of this study was to provide basic data for the further development of environmental DNA-specific primers and analysis of genetic diversity in P. mera, and to lay the foundation for conserving and managing P. mera resources.

2. Materials and Methods

2.1. Sample Collection and DNA Extraction

Three individuals of P. mera were collected from three different locations, including Jinchengjiang District, Hechi City, Guangxi Zhuang Autonomous Region, China (WYL1); Zhenfeng County, Qianxi’nan Prefecture, Guizhou Province, China (WYL2); and Du’an Yao Autonomous County, Hechi City, Guangxi Zhuang Autonomous Region, China (WLY3) (Figure 1). Genomic DNA was isolated from the pectoral fin using the phenol-chloroform method, and the quality and integrity of DNA samples were measured using 0.8% agarose electrophoresis, Nanodrop spectrophotometer (Thermo Fisher Scientific, Waltham, MA, USA), and Qubit® 2.0 Flurometer (Life Technologies, Foster City, CA, USA).

2.2. Mitochondrial Genome Sequencing and Assembly

The obtained DNA samples were used to construct a double-ended sequencing library with an insert size of 350 bp, per the standard procedure for Illumina DNA library construction. The quality of the library was assessed using qPCR method and the Agilent 2100 Bioanalyzer (Agilent Technologies, Palo Alto, CA, USA). Qualified DNA libraries were sequenced on an Illumina Hiseq 4000 (Illumina, San Diego, CA, USA) high-throughput sequencing platform using a PE150 (Pair-End 150) sequencing strategy. The raw sequences were filtered to eliminate those containing sequencing junctions and those of low quality, ensuring high-quality clean reads for subsequent analysis. Mitochondrial genome sequences were assembled via splicing using the SPAdes v.3.5.0 software (https://github.com/ablab/spades, accessed on 20 July 2024) [13].

2.3. Mitochondrial Genome Annotation and Analyses

The mitochondrial genome was annotated using DOGMA (http://dogma.ccbb.utexas.edu/ (accessed on 10 May 2018)) [14] and ORF Finder (https://www.ncbi.nlm.nih.gov/orffinder/ (accessed on 15 May 2018)). The preliminary results of the annotation were compared with the reported coding proteins and rRNAs of the mitochondrial genomes of related species using BLASTn and BLASTp (https://blast.ncbi.nlm.nih.gov/Blast.cgi (accessed on 17 May 2018)) to verify the accuracy of the results and correct them where necessary [15]. tRNA annotation was conducted using tRNAscan-SE2.0 (http://lowelab.ucsc.edu/tRNAscan-SE/ (accessed on 20 May 2018)) [16] and ARWEN (Version 1.2, http://mbioserv2.mbioekol.lu.se/ARWEN/ (accessed on 25 April 2018)) [17] methods to eliminate tRNAs with implausible length and incomplete structure. We predicted the structure of tRNAs using the online website https://lowelab.ucsc.edu/tRNAscan-SE/ (accessed on 20 July 2024) [16] and mapped the tRNA structure using the online website cloud.genepioneer.com (accessed on 21 July 2024).
The relative synonymous codon usage (RSCU) was calculated according to the formula detailed in Sharp PM [18]. The mitochondrial genome skew values were calculated using the following formula: AT-skew = (A − T)/(A + T); GC-skew = (G − C)/(G + C). Comparative analyses of the genome-wide differences in the mitochondrial genomes were performed using MEGA11 [19].
The best-matching proteins were obtained using BLASTp (parameters -evalue 1 × 10⁻⁵ -max_target_seqs) [15]. The protein sequence comparison results were converted into CDS sequence comparison results using ParaAT (parameters -m mafft -f axt -g -k) [20], and the Ka/Ks values were calculated using KaKs_Calculator2.0 [21]. A Ka/Ks frequency distribu-tion plot was generated using the website https://www.omicshare.com/tools/ (accessed on 15 July 2024) [22].

2.4. Phlogenetic Analyses

To understand the evolutionary status of P. mera, we constructed phylogenetic trees of the subfamily Cyprininae in China. The mitochondrial genomes of 16 fish were obtained from the National Center for Biotechnology Information (NCBI) (Table 1). A phylogenetic tree of these mtDNA sequences was constructed using codon and amino acid sequences based on maximum likelihood (ML) and Bayesian methods, respectively. The ML tree was constructed using the IQTree2 for codon and amino acid sequences of 20 mitochondrial genomes, respectively [23]. The sequences were converted to a phylogenetic format following a comparison based on MAFFT software (Version 7.526, --localpair --maxiterate 1000) [24], and the optimal model was selected using IQTree2 based on the AIC value. The optimal substitution model for amino acid sequences was identified as (mtVer + F + R2), whereas the optimal substitution model for codons was identified as (GTR + F + G4). Afterward, the phylogenetic trees for amino acids and codons were constructed according to the optimal model with a bootstrap value of 1000. To determine the optimal topology, a Bayesian tree was constructed using Phylosuite software (Version 1.2.3) [25], beginning with a random tree. The Markov chain was then run for 1,000,000 generations with samples taken at 100-generation intervals. The initial 25% of the samples were excluded, owing to their advanced age, following confirmation that the mean standard deviation of the split frequencies was less than 0.01. A genome covariance map of 20 mitochondrial genomes was constructed using the Mauve software (https://darlinglab.org/mauve/download.html, accessed on 15 July 2024) [26].

3. Results

3.1. Mitochondrial Genome Analyses

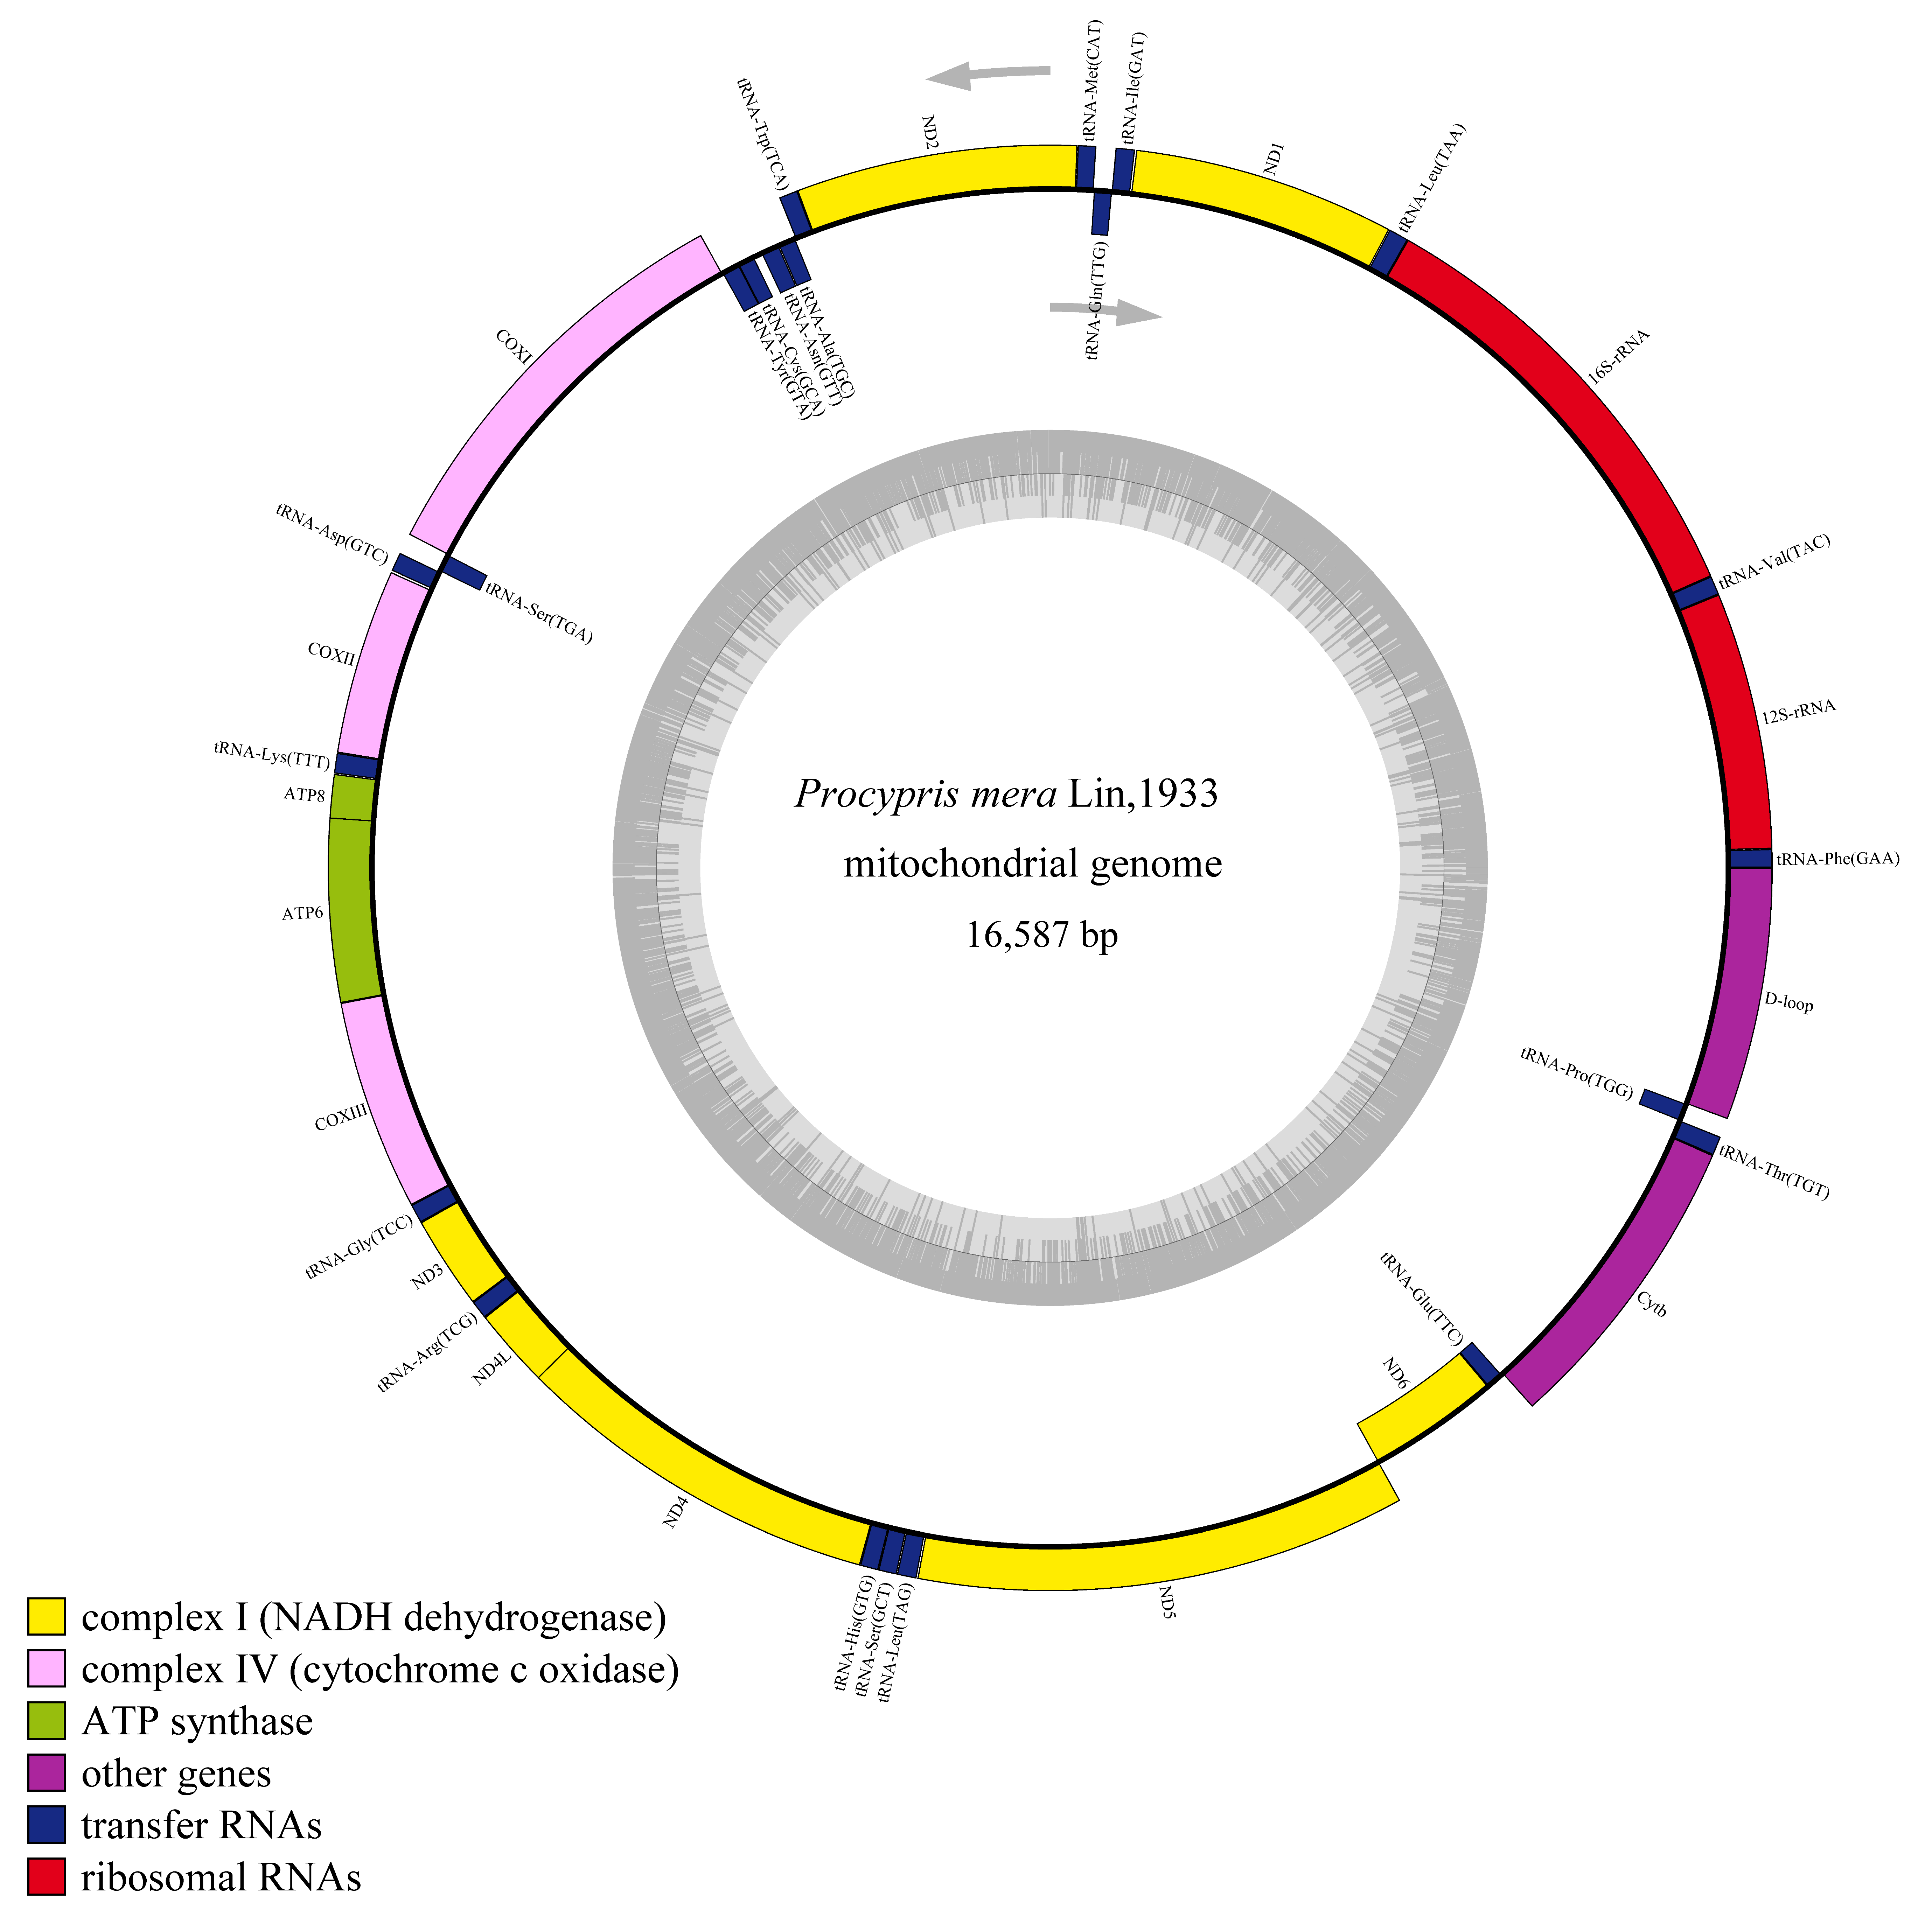
The mitochondrial genome sequencing data for the three P. mera individuals are shown in Table 2. The total length of each P. mera mitochondrial genome was 16,587 bp, with a GC content of 43.1%, and the distribution of its bases is shown in Table 3. The three mitochondrial genome structures were consistent, consisting of 37 typical animal mitochondrial genes, including 22 tRNA genes, 13 PCG genes, 2 rRNA genes, and 2 non-coding regions (D-loop and OL), which are similar to those of other vertebrates. Among the mitochondrial genes, nine genes (tRNA-Gln, tRNA-Ala, tRNA-Asn, tRNA-Cys, tRNA-Tyr, tRNA-Ser, ND6, tRNA-Glu, and tRNA-Pro) are encoded by the light (L) strand, whereas the remaining genes are encoded by the heavy (H) strand (Table 4).
Differential analysis of the three mitochondrial genomes revealed that the mitochondrial genomes of WYL2 and WYL3 were identical, whereas WYL1 exhibited five single-nucleotide polymorphisms (SNPs) that distinguished it from the other two (Table 5). One of the five SNPs was identified in the 16S rRNA gene, whereas the remaining four were located in the coding genes COX2, ATP6, ND5, and CYTB. The SNP in ND5 resulted in an amino acid change (Thr to Ala), whereas the other three SNPs were synonymous (Table 5). The mtDNAs of WYL1 and WYL2 were used for subsequent analyses. The mitochondrial structures of WYL1 are shown in Figure 2.

3.2. Protein Coding Gene Analyses

The total length of the 13 PCGs in the two mitochondrial genomes was 11,403 bp, with AT and GC skew values of 0.0490 and 0.2848, respectively. Except for COX1, all the PCGs used the ATG start codon. Among the PCGs, seven utilized the complete stop codon TAA, whereas six used incomplete stop codons (TA or T) (Table 4). Furthermore, we identified four overlapping regions among certain PCGs (ATPase6-COX3, ATPase8-ATPase6, ND4-ND4L, and ND5-ND6). These overlapping regions spanned a length of 1–7 bp, with the largest region occurring between ATP8-ATP6 and ND4-ND4L.
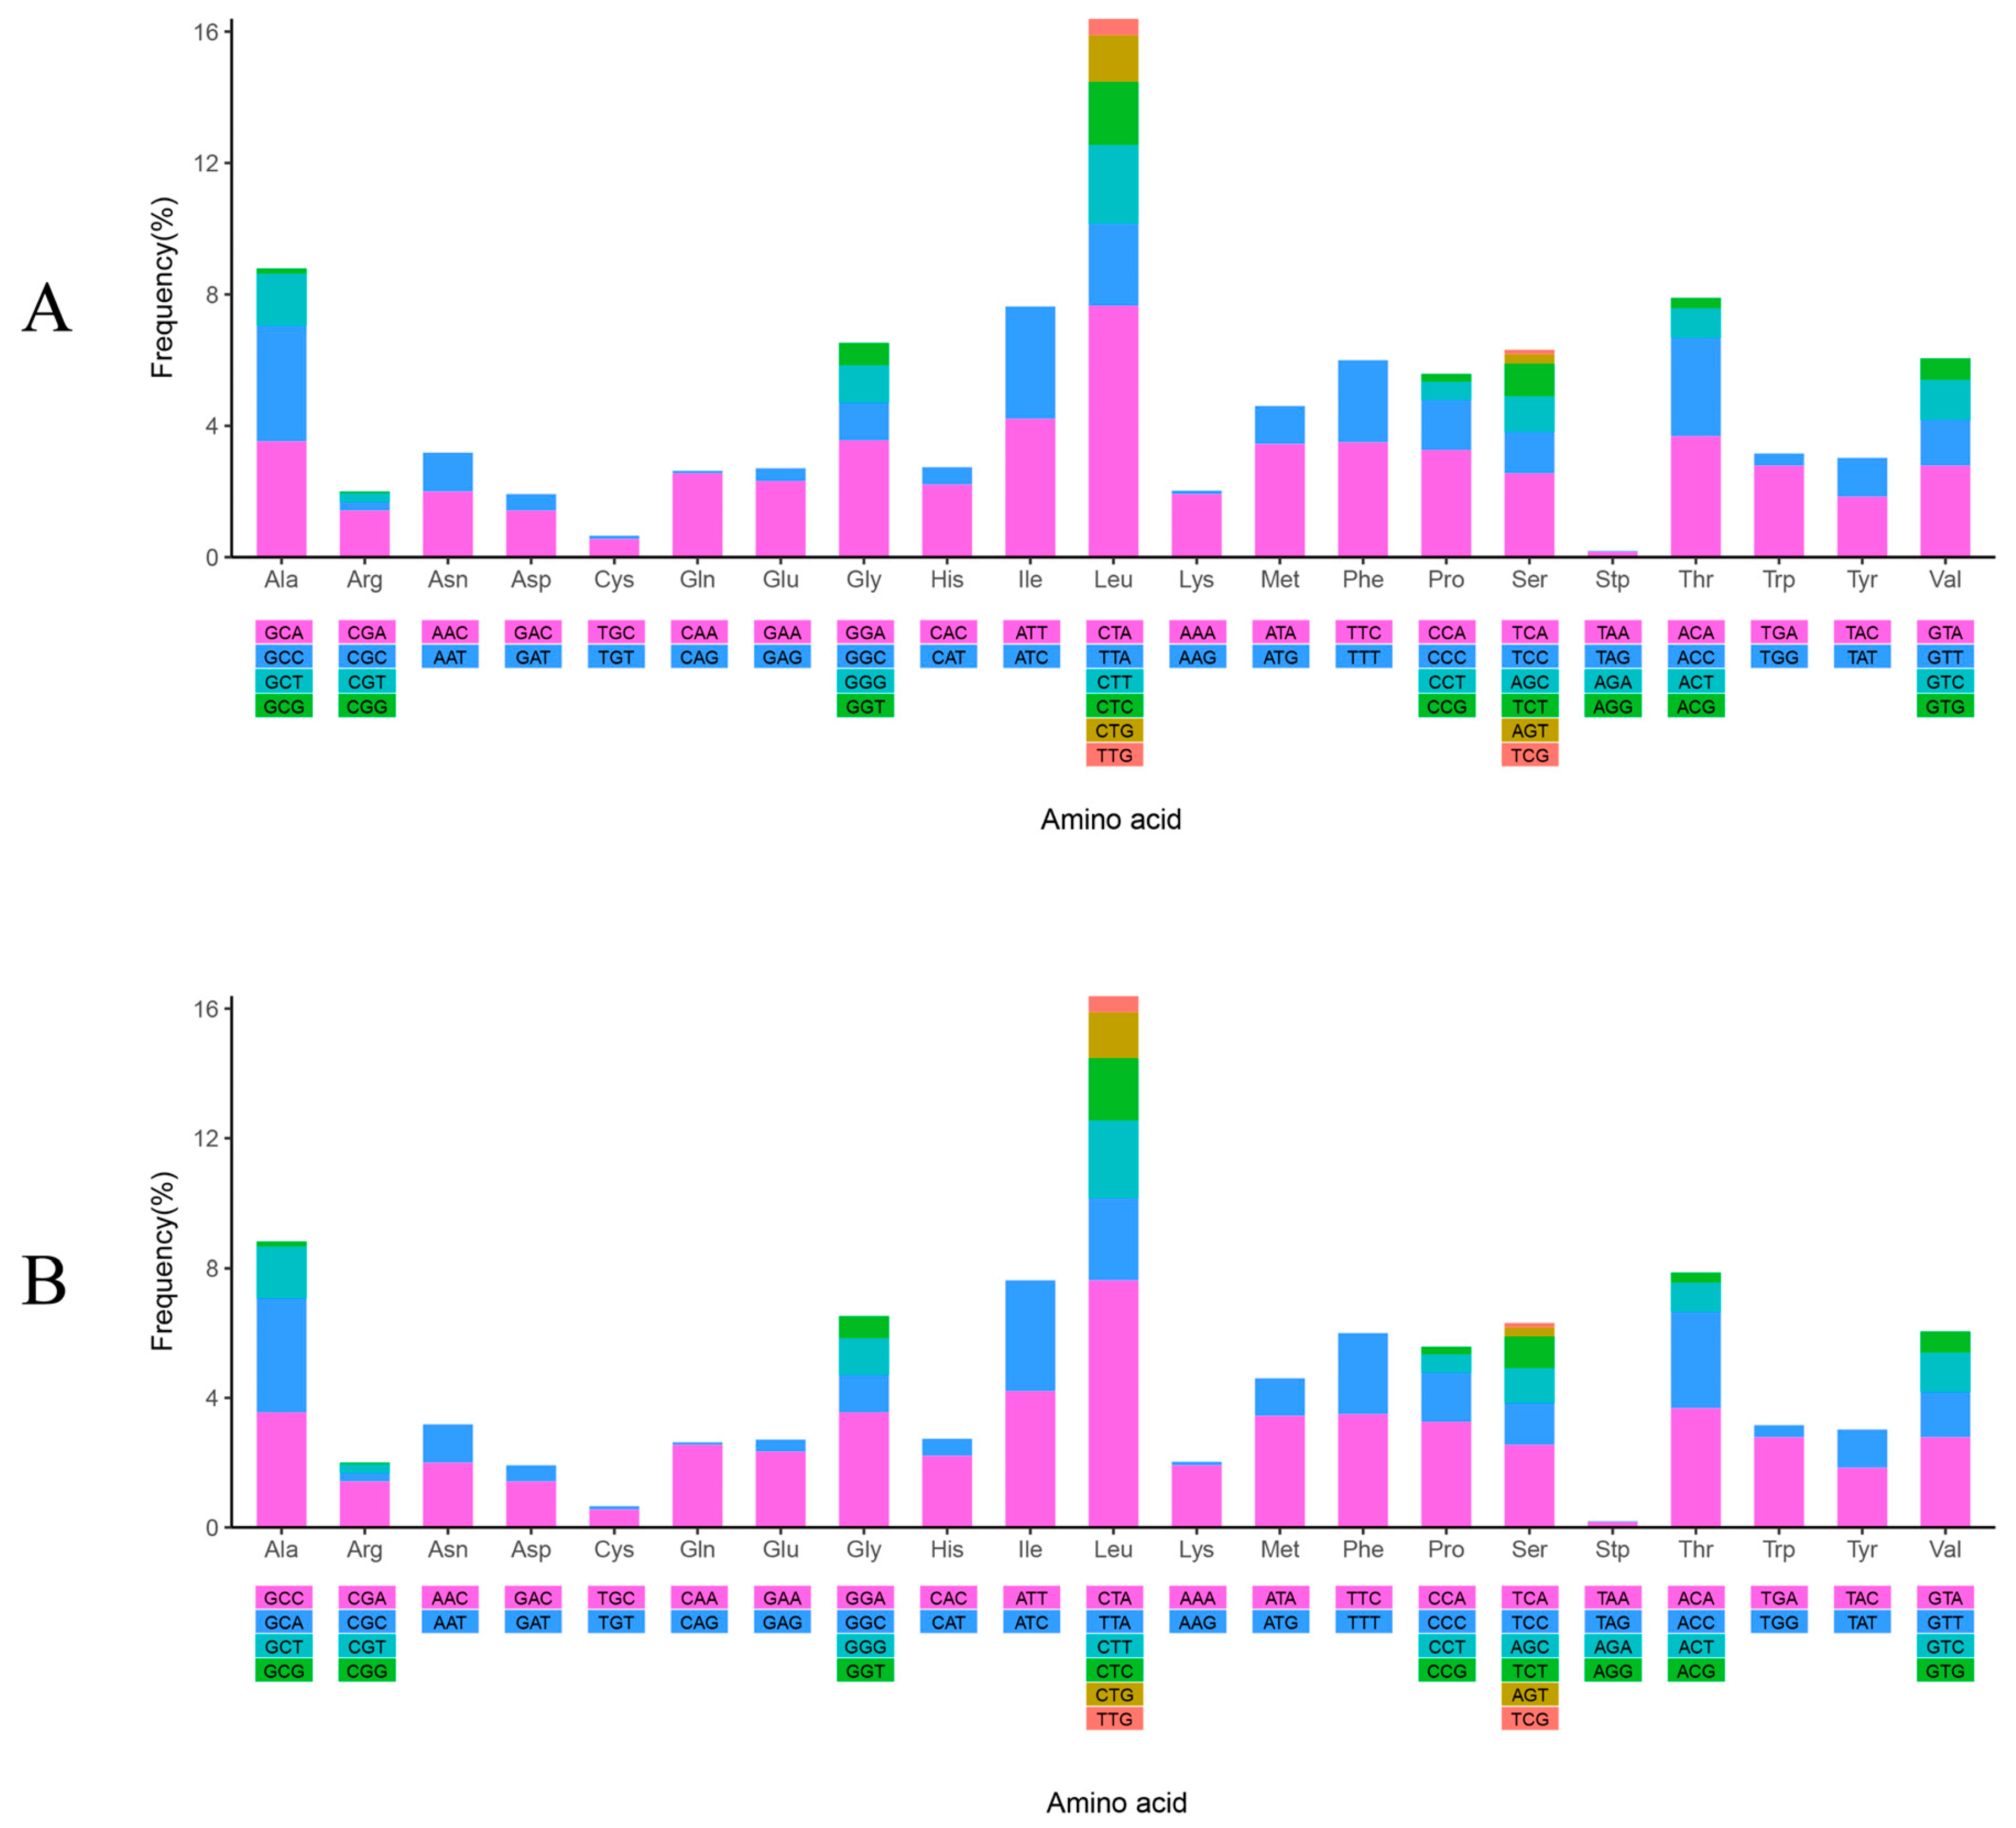
The frequencies and values of RSCU in the two mitochondrial genomes were partially different under the influence of the five SNPs (Figure 3 and Figure S1). Among the codons, CTA was the most frequently utilized, occurring 291 and 290 times in WYL1 and WYL2, respectively. In contrast, TAG was the least frequently utilized, occurring only once in both mtDNAs. In both mtDNAs, there were 26 codons with RSCU values exceeding 1, and 14 codons terminated in A, 11 in C, and 1 in T, indicating a codon preference for those that ended in A and C.

3.3. Ribosomal RNA, Transfer RNA Genes, and Non-Coding Regions Analyses

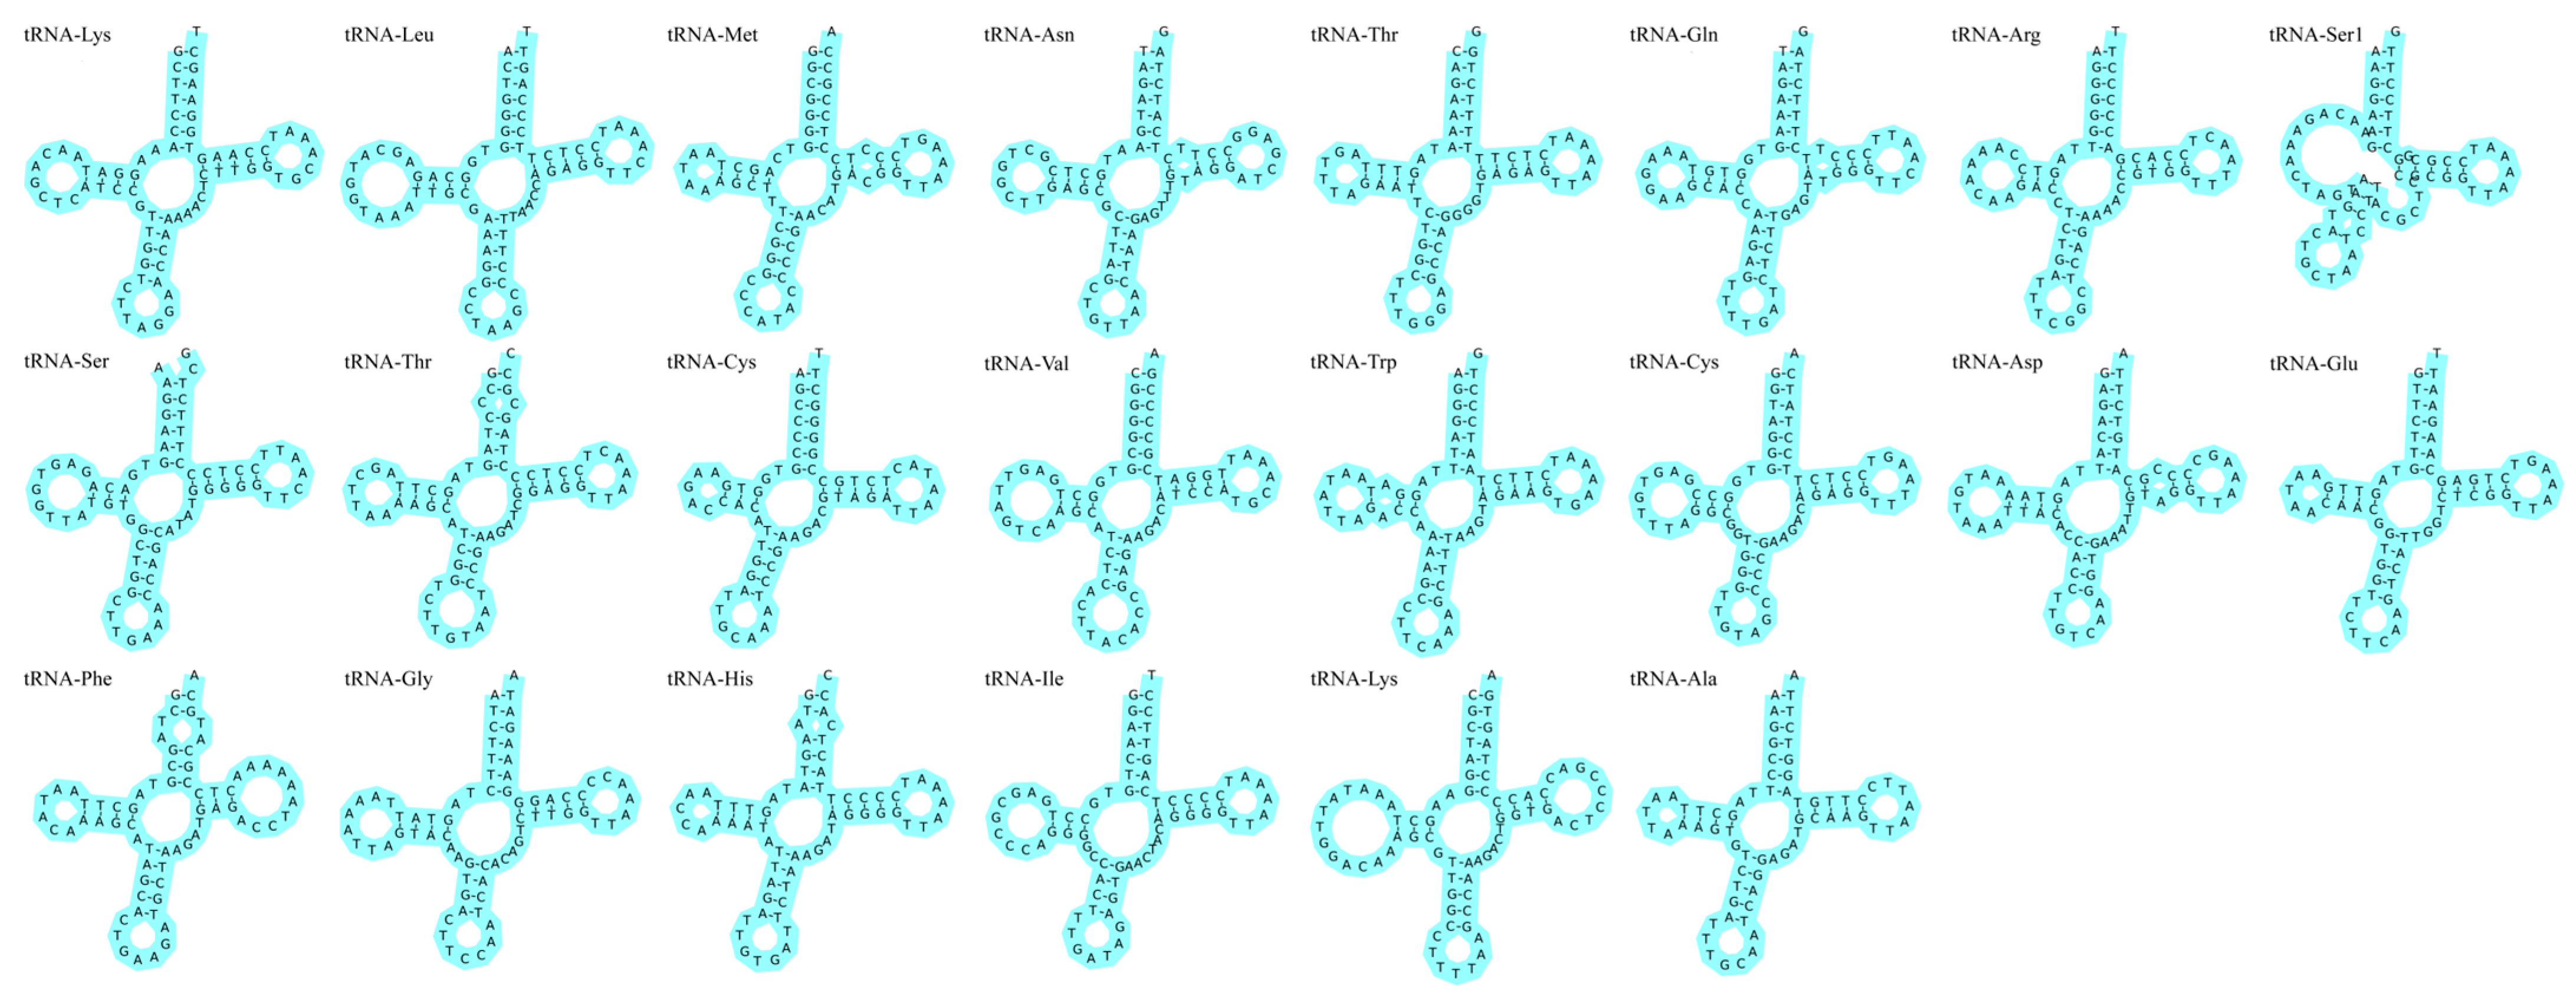
The total length of rRNAs in the two mtDNA samples was 2638 bp. The AT skew value for WYL1 was 0.2895, and the GC skew value was −0.1005. However, the AT skew value for WYL2 was 0.2890, and the GC skew value was −0.0996. There were 22 tRNAs in the mtDNA of P. mera, with a total length of 1563 bp in both mtDNA. Three overlapping regions were identified between the tRNAs (tRNA-Cys-tRNA-Tyr, tRNA-lle-tRNA-Gln, and tRNA-Thr-tRNA-Pro). These overlapping regions had a length of 1–2 bp, with the largest region occurring between tRNA-lle-tRNA-Gln. Each tRNA had a length of 67–76 bp, and the secondary structure of all the tRNAs, except for tRNA-Ser1 on the L strand, was of the standard cloverleaf type (Figure 4).
Two common non-coding regions (OL and CR) were identified in the P. mera mitogenome. The OL region was 34 bp in length and located between tRNA-Asn and tRNA-Cys. The CR region was located between tRNA-Pro and tRNA-Phe, which is the longest non-coding region in the entire mitochondrial genome, with a length of 938 bp.

3.4. Ka/Ks Ratios Analyses

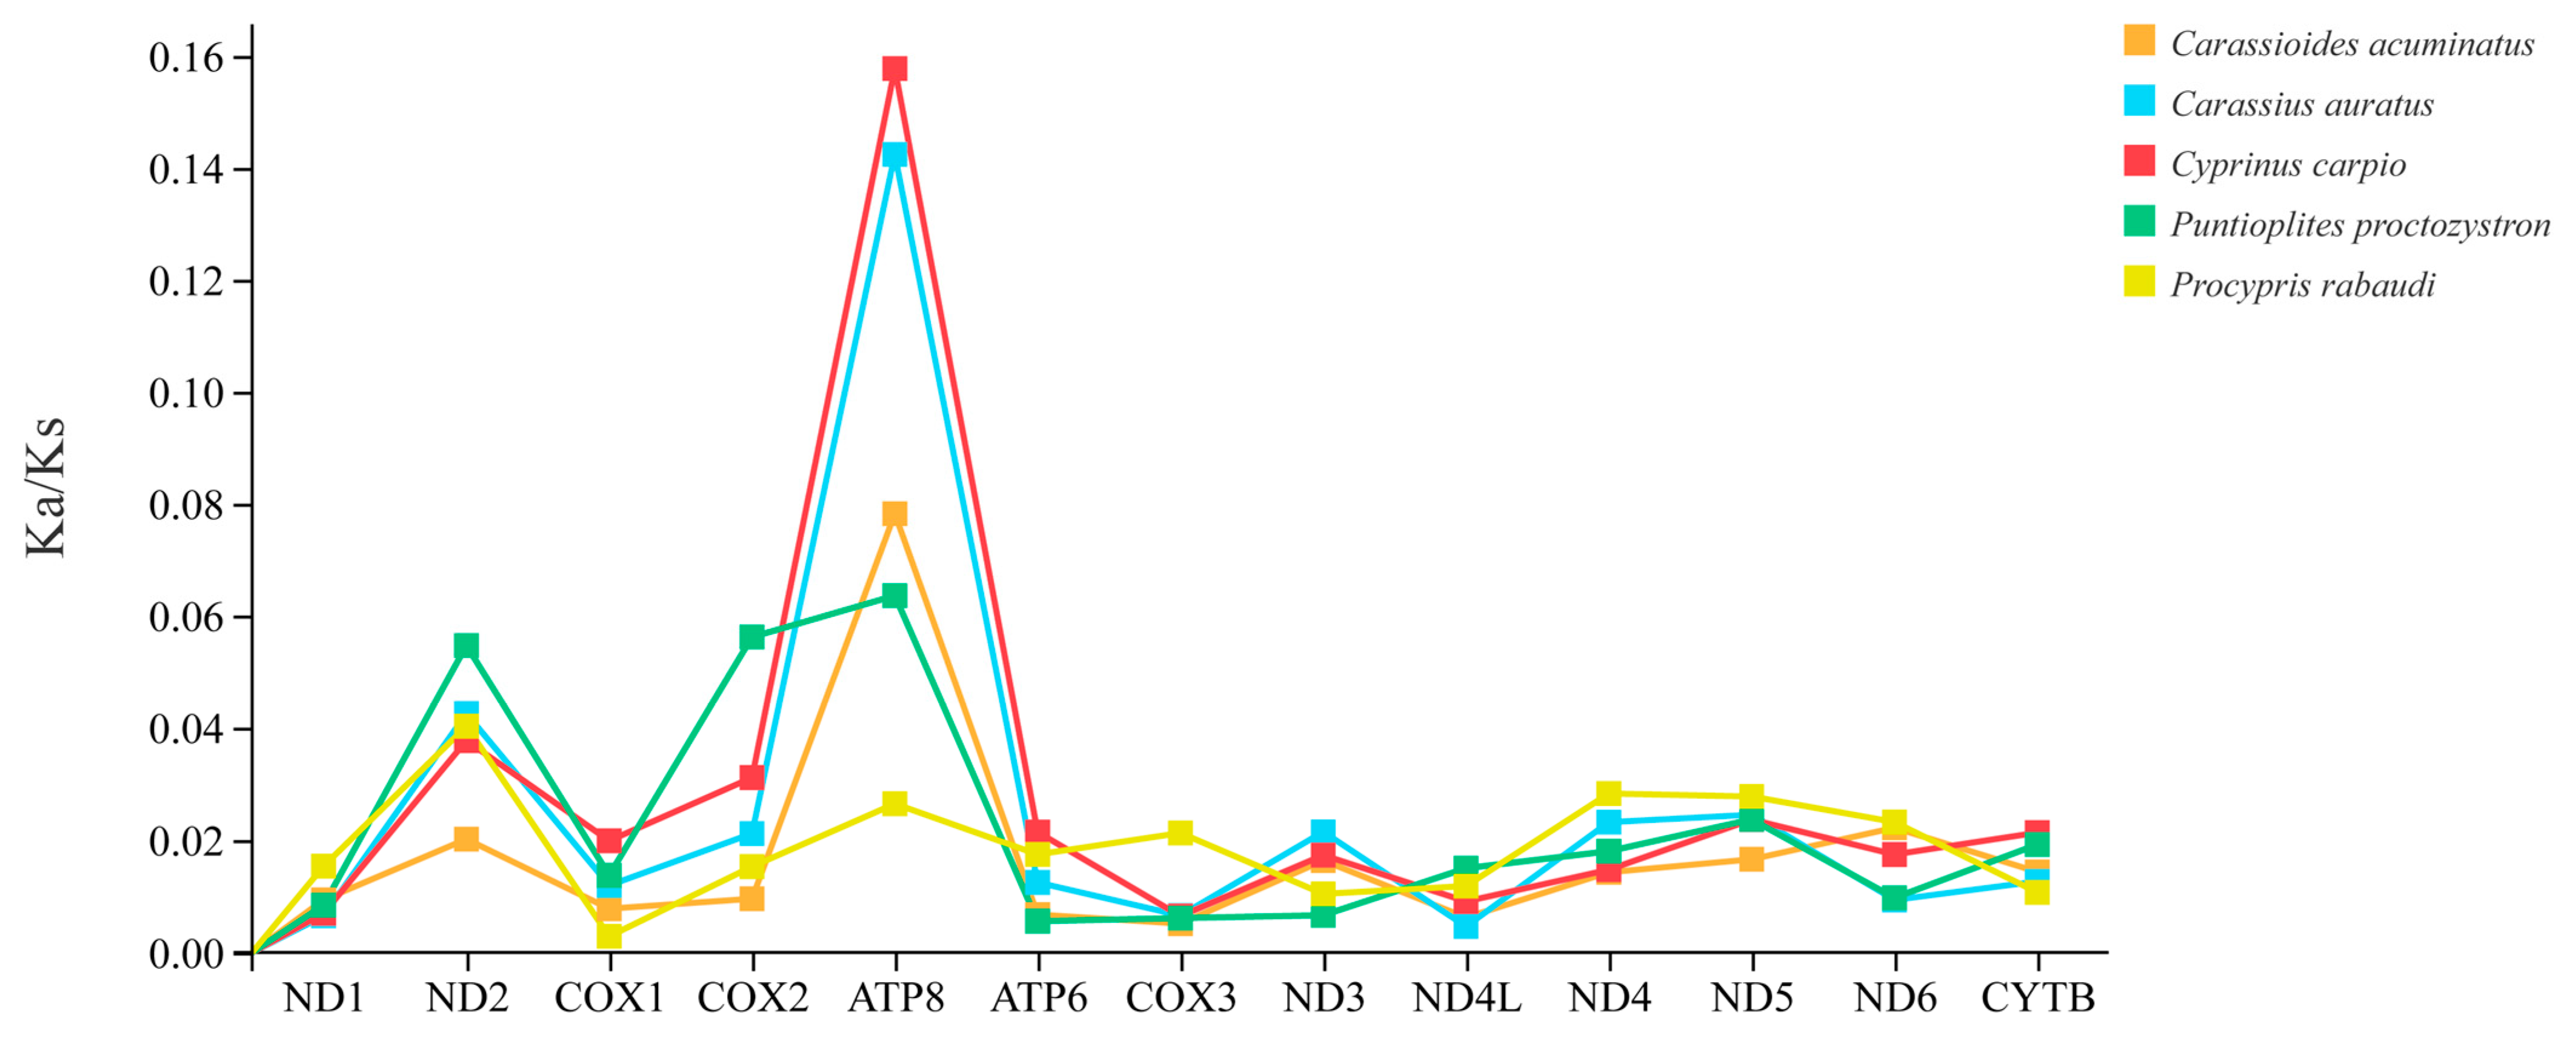
The WYL1 mtDNA was used to calculate non-synonymous substitution rates (Ka) and synonymous substitution rates (Ks) to assess the selection pressure exerted on the P. mera PCGs during evolutionary history. It was shown that the Ka/Ks ratios in all the PCGs ranged from 0.0029 to 0.3411, and the Ka/Ks ratios of each PCG were similar. However, the largest range of variation in Ka/Ks ratios was observed for ATP8, with a range of 0.0265 to 0.3411 (Figure 5). Furthermore, the Ka/Ks ratios of all PCGs were less than one, indicating that purifying selection played a leading role in the evolution of these PCGs.

3.5. Phylogenetic Relationships

An analysis of 20 mitochondrial genome sequences from 16 species revealed inconsistencies between phylogenetic trees constructed using codon and amino acid sequences with IQtree2. Specifically, the trees displayed distinct topologies. The amino acid-based phylogenetic tree indicated that the genus Puntioplites is sister to all other genera of subfamily Cyprinidae of China. The genus Procypris formed a monophyletic group, and the genera Carassioides, Carassius, and Cyprinus formed a monophyletic group (Figure 6). Furthermore, the codon-based phylogenetic tree indicated that the genera Carassioides and Carassius were monophyletic, as were the genera Puntioplites, Procypris, and Cyprinus a monophyletic group (Figure S2). Validation of the phylogenetic tree using a BI tree resulted in convergence with mean standard deviations of 0.001475 for codon-based and 0.001488 for amino-acid-based sequences, indicating the high reliability of the constructed trees. Results obtained from the BI tree were consistent with the aforementioned findings (Figures S3 and S4). Additionally, a collinearity analysis of the 20 mitochondrial genomes revealed a high degree of conservation in the mitochondrial genomes of fish in the subfamily Cyprininae in China. However, some sequence rearrangements were observed in Carassius catassius, Carassius cuvieri, Carassius gibelio, and Cyprinus carpio (Figure S5).

4. Discussion

4.1. Mitochondrial Differences between Individuals

In this study, we sequenced the mitochondrial genomes of three individuals sourced from three sites, finding that the genomes exhibited remarkable similarity, with the mitochondrial genomes of P. meraWYL2 and P. meraWYL3 being identical. On the one hand, the striking similarity observed in the mitochondrial genomes can be attributed to the fact that these three individuals likely descended from the same ancestral lineage, consistent with the findings from the mitochondrial genome sequencing of Salvethymus svetovidovi [27], a species exclusively and consistently inhabiting Lake El’gygytgyn. On the other hand, the observed low polymorphism could be attributed to the significant population changes that P. mera has undergone in recent decades, potentially due to genetic bottleneck effects [28]. However, it is important to note that only one individual from each site was included in this study, which may limit the accuracy of the results. To fully assess the genetic diversity of P. mera, additional samples should be collected from each site in the future, and multiple genetic markers should be used for a more robust analysis.

4.2. Phylogenetic Relationships of Subfamily Cyprininae

In China, the subfamily Cyprininae includes five genera of fish: Cyprinus, Procypris, Puntioplites, Carassioides, and Carassius [29]. The subfamily Cyprininae is a monophyletic group Barbelidae [29,30]. To clarify the phylogenetic relationships of the subfamily Cyprininae, researchers have compared the traits of the subfamily Cyprininae with those of the subfamily Barbelidae. Chen et al. [30] divided the genera of the subfamily Cyprininae into three groups based on pharyngeal tooth morphology. Spatulate teeth were found in the genera Puntioplites and Procypris, molar teeth were observed in the genera Cyprinus and Scaphognathops, and shovel teeth were found in the genera Carassioides and Carassius [30]. The genus Puntioplites reportedly has spatulate teeth that are generally similar to those of the subfamily Barbelidae, and they are of more primitive types [30]. Zhou [31] conducted a comparative analysis of 25 traits exhibited by fish in the subfamily Cyprininae and those observed in fish in the subfamily Barbus. They concluded that the genus Procypris was more closely related to Cyprinus, whereas Puntioplites represented an early divergent member of the subfamily Cyprininae and was more distantly related to the other four genera within the subfamily [31].
Classification methods based on morphological traits have significantly contributed to the advancement of our understanding of the phylogeny of the subfamily Cyprininae in China, despite the lack of developments in molecular biology at the time. However, it is important to note that morphological variations are not always consistent with molecular evidence [32]. Additionally, the compilation of these traits is often subjective, reflecting the level of attention paid to morphology and taxonomy and the intensity of taxon sampling [32]. Hence, studies on the phylogeny of the subfamily Cyprininae based on molecular evidence will help to reorganize the developmental relationships of the subfamily. The phylogenetic tree constructed by Yue, based on mitochondrial D-loop sequences, indicated that the genus Procypris is a sister group to the genera Carassioides, Carassius, and Cyprinus [33]. Nevertheless, the absence of molecular evidence for the genus Puntioplites precluded a systematic analysis of the phylogenetic tree of the subfamily Cyprininae [33].
In the present study, we sequenced the mitochondrial genome of P. mera and constructed a phylogenetic tree that included 15 fish of the subfamily Cyprininae in China. The phylogenetic trees constructed based on codon sequences using both ML and Bayesian methods indicated that the genera Carassius and Carassioides represent a monophyletic group, whereas the genera Puntioplites, Procypris, and Cyprinus constitute another monophyletic group, which is not consistent with analyses based on morphology [29,30]. Additionally, the amino-acid-based phylogenetic tree indicated that the genus Puntioplites is sister to all other genera of the subfamily Cyprinidae of China, and that the genera Procypris, Carassioides, Carassius, and Cyprinus formed a monophyletic group. This finding is consistent with numerous conclusions based on molecular evidence and morphological studies [29,30,33,34,35,36].

5. Conclusions

Herein, we sequenced three mitochondrial genomes of P. mera, analyzed their structural features, and constructed a phylogenetic tree of the subfamily Cyprininae in China based on newly published mitochondrial genomes. Our findings revealed that the three mitochondrial genomes of P. mera exhibited identical lengths, with minor variations in SPNs. Structural analysis highlighted conserved features across the genomes, such as ATG start codons in most PCGs and the standard cloverleaf structure of tRNA genes, except for the absence of a DHU stem in trnS1. Additionally, purifying selection was identified as a key evolutionary force shaping the evolution of these PCGs. A phylogenetic tree for the subfamily Cyprininae in China was constructed using codon and amino acid sequences based on ML and Bayesian methods. The results of the phylogenetic tree constructed based on amino acid sequences were similar to those of most previous studies, suggesting that the genus Puntioplites is sister to all other genera of subfamily Cyprinidae of China; the genus Procypris forms a monophyletic group; and the genera Carassioides, Carassius, and Cyprinus form a monophyletic group. However, an accurate phylogenetic tree for fish of the subfamily Cyprininae still requires whole-genome refinement. In summary, this research significantly advances our understanding of the phylogenetic intricacies within the subfamily Cyprininae in China, thereby establishing a solid foundation for the development of future conservation and management strategies for P. mera.

Supplementary Materials

The following Supporting Information can be downloaded at: https://www.mdpi.com/article/10.3390/ani14182672/s1, Figure S1. The value of relative synonymous codon usage (RSCU) in the mitogenome of P. mera WYL1 (A) and P. mera WYL2 (B). Figure S2. ML tree on the nodes constructed by using the codon sequences of the 13 PCGs with bootstrap values. Figure S3. BI tree on the nodes constructed by using the amino acid sequences of the 13 PCGs with support values. Figure S4. BI tree on the nodes constructed by using the codon sequences of the 13 PCGs with support values. Figure S5. The collinearity map of whole mtDNA. Each mitochondrial genome is partitioned into two segments. The upper segment encompasses the collinearity of homologous regions, where identical blocks of color (homology blocks) signify homologous regions. The lower segment constitutes a map of the gene structure, with white rectangles denoting CDS, red rectangles representing rRNAs, and green rectangles indicating tRNAs.

Author Contributions

Conceptualization, Y.H., Y.L. (Yong Lin), X.W. and Z.L.; formal analysis, Z.L.; investigation, Y.L. (Yusen Li) and Y.H.; resources, W.W., J.L. and D.W.; data curation, Z.L.; writing—original draft preparation, Z.L.; writing—review and editing, Z.L., Y.L. (Yong Lin) and X.W. All authors have read and agreed to the published version of the manuscript.

Funding

This research was funded by Public Subjects of the Key Laboratory of Guangxi Academy of Fishery Sciences (GXKEYLA-JY202404), Guangxi Zhuang Autonomous Region Agricultural Science and Technology Innovation Project (Z202288), Project of Financial Funds of Ministry of Agriculture and Rural Affairs: Investigation of Fishery Resources and Habitat in the Pearl River Basin (ZJZX-04), Self-determined Project of Key Laboratory of Aquaculture genetic and breeding and Healthy Aquaculture of Guangxi (2023-A-04-01).

Institutional Review Board Statement

All experiments were performed in compliance with the animal management regulations of the Animal Welfare and Ethical Committee of Guangxi Academy of Fisheries Science (Nanning, RP China) (GACUC number 201703021). All handling of animals in the present study was as according to standard animal care and use practices.

Informed Consent Statement

Not applicable.

Data Availability Statement

All three mitochondrial genomes of Procypris mera measured in this study have been uploaded to NCBI (MN229744, MN229745, MN229746).

Acknowledgments

We thank Luohao Xu of Southwest University, Chongqing, China, for providing the analysis platform.

Conflicts of Interest

The authors declare no conflicts of interest.

References

  1. Guangxi Institute of Fishery Sciences; Z—Institute of Biophysics of Chinese Academy of Sciences. Freshwater Fishes of Guangxi, China; Guangxi People’s Press: Nanning, China, 1981. [Google Scholar]
  2. Yue, P.; Chen, Y. China Red Data Book of Endangered Animals Pisces; Science Press: Beijing, China, 1988. [Google Scholar]
  3. Han, Y.; He, A.; Lan, J.; Wu, W.; Li, Y. Phenotypic Traits and Fecundity Characteristics of Procypris mera. Jiangsu Agric. Sci. 2018, 46, 134–137. [Google Scholar]
  4. Han, Y.; He, A.; Lan, J.; Wu, W.; Li, Y.; Wang, D.; Lei, J.; Shi, J. Embryonic Development of Chinese Ink Carp. Fish. Sci. 2018, 37, 368–373. [Google Scholar]
  5. Lei, J.; Li, Y.; Li, Z.; Wang, D.; Shi, J.; Han, Y.; He, A.; Huang, B.; Wu, W. Relationship between Morphological Traits and Body Mass of Procypris mera. Chin. J. Fish. 2024, 37, 33–38. [Google Scholar]
  6. Grewe, P.; Hebert, P. Mitochondrial DNA Diversity among Broodstocks of the Lake Trout, Salvelinus Namaycush. Can. J. Fish. Aquat. Sci. 2011, 45, 2114–2122. [Google Scholar] [CrossRef]
  7. Vaughn, K.C.; Debonte, L.R.; Wilson, K.G.; Schaffer, G.W. Organelle Alteration as a Mechanism for Maternal Inheritance. Science 1980, 208, 196–198. [Google Scholar] [CrossRef]
  8. Meland, S.; Johansen, S.; Johansen, T.; Haugli, K.; Haugli, F. Rapid Disappearance of One Parental Mitochondrial Genotype after Isogamous Mating in the Myxomycete Physarum polycephalum. Curr. Genet. 1991, 19, 55–59. [Google Scholar] [CrossRef]
  9. Cantatore, P.; Saccone, C. Organization, Structure, and Evolution of Mammalian Mitochondrial Genes. In International Review of Cytology; Bourne, G.H., Jeon, K.W., Friedlander, M., Eds.; Academic Press: Cambridge, MA, USA, 1987; Volume 108, pp. 149–208. [Google Scholar]
  10. Zhang, K.; Liu, Y.; Yin, X.; Yuan, P.; Cao, P. Characterization of the Complete Mitochondrial Genome of Chinese Konosirus punctatus (Clupeiformes, Clupeidae) and Phylogenetic Studies of Clupeiformes. Mitochondrial DNA Part B 2020, 5, 3389–3391. [Google Scholar] [CrossRef]
  11. Chen, L.; Zhang, X.; Liu, H. Phylogenetic Relationships of the Pseudogobionini Group (Teleostei: Cyprinidae) with Selection Pressure Analyses to Genes of Mitochondrial Genome. Fishes 2023, 8, 201. [Google Scholar] [CrossRef]
  12. Ficetola, G.F.; Miaud, C.; Pompanon, F.; Taberlet, P. Species Detection Using Environmental DNA from Water Samples. Biol. Lett. 2008, 4, 423–425. [Google Scholar] [CrossRef]
  13. Bankevich, A.; Nurk, S.; Antipov, D.; Gurevich, A.A.; Dvorkin, M.; Kulikov, A.S.; Lesin, V.M.; Nikolenko, S.I.; Pham, S.; Prjibelski, A.D.; et al. SPAdes: A New Genome Assembly Algorithm and Its Applications to Single-Cell Sequencing. J. Comput. Biol. 2012, 19, 455–477. [Google Scholar] [CrossRef]
  14. Wyman, S.K.; Jansen, R.K.; Boore, J.L. Automatic Annotation of Organellar Genomes with DOGMA. Bioinformatics 2004, 20, 3252–3255. [Google Scholar] [CrossRef] [PubMed]
  15. Altschul, S.F.; Gish, W.; Miller, W.; Myers, E.W.; Lipman, D.J. Basic Local Alignment Search Tool. J. Mol. Biol. 1990, 215, 403–410. [Google Scholar] [CrossRef] [PubMed]
  16. Lowe, T.M.; Chan, P.P. tRNAscan-SE On-Line: Integrating Search and Context for Analysis of Transfer RNA Genes. Nucleic Acids Res. 2016, 44, W54–W57. [Google Scholar] [CrossRef] [PubMed]
  17. Laslett, D.; Canbäck, B. ARWEN: A Program to Detect tRNA Genes in Metazoan Mitochondrial Nucleotide Sequences. Bioinformatics 2008, 24, 172–175. [Google Scholar] [CrossRef] [PubMed]
  18. Sharp, P.; Li, W.-H. The Codon Adaptation Index—A Measure of Directional Synonymous Codon Usage Bias, and Its Potential Applications. Nucleic Acids Res. 1987, 15, 1281–1295. [Google Scholar] [CrossRef]
  19. Tamura, K.; Stecher, G.; Kumar, S. MEGA11: Molecular Evolutionary Genetics Analysis Version 11. Mol. Biol. Evol. 2021, 38, 3022–3027. [Google Scholar] [CrossRef]
  20. Zhang, Z.; Xiao, J.; Wu, J.; Zhang, H.; Liu, G.; Wang, X.; Dai, L. ParaAT: A Parallel Tool for Constructing Multiple Protein-Coding DNA Alignments. Biochem. Biophys. Res. Commun. 2012, 419, 779–781. [Google Scholar] [CrossRef]
  21. Wang, D.; Zhang, Y.; Zhang, Z.; Zhu, J.; Yu, J. KaKs_Calculator 2.0: A Toolkit Incorporating Gamma-Series Methods and Sliding Window Strategies. Genom. Proteom. Bioinform. 2010, 8, 77–80. [Google Scholar] [CrossRef]
  22. Mu, H.; Chen, J.; Huang, W.; Huang, G.; Deng, M.; Hong, S.; Ai, P.; Gao, C.; Zhou, H. OmicShare Tools: A Zero-Code Interactive Online Platform for Biological Data Analysis and Visualization. iMeta 2024, e228. [Google Scholar] [CrossRef]
  23. Minh, B.Q.; Schmidt, H.A.; Chernomor, O.; Schrempf, D.; Woodhams, M.D.; von Haeseler, A.; Lanfear, R. IQ-TREE 2: New Models and Efficient Methods for Phylogenetic Inference in the Genomic Era. Mol. Biol. Evol. 2020, 37, 1530–1534. [Google Scholar] [CrossRef]
  24. Katoh, K.; Misawa, K.; Kuma, K.; Miyata, T. MAFFT: A Novel Method for Rapid Multiple Sequence Alignment Based on Fast Fourier Transform. Nucleic Acids Res. 2002, 30, 3059–3066. [Google Scholar] [CrossRef] [PubMed]
  25. Xiang, C.-Y.; Gao, F.; Jakovlić, I.; Lei, H.-P.; Hu, Y.; Zhang, H.; Zou, H.; Wang, G.-T.; Zhang, D. Using phyloSuite for Molecular Phylogeny and Tree-Based Analyses. Imeta 2023, 2, e87. [Google Scholar] [CrossRef]
  26. Darling, A.C.E.; Mau, B.; Blattner, F.R.; Perna, N.T. Mauve: Multiple Alignment of Conserved Genomic Sequence with Rearrangements. Genome Res. 2004, 14, 1394–1403. [Google Scholar] [CrossRef] [PubMed]
  27. Oleinik, A.G.; Skurikhina, L.A.; Kukhlevsky, A.D.; Semenchenko, A.A. First Report of Three Complete Mitochondrial Genomes of the Long-Finned Charr Salvethymus svetovidovi Chereshnev et Skopetz, 1990 (Salmoniformes: Salmonidae) with Phylogenetic Consideration. Mitochondrial DNA B Resour. 2019, 4, 2464–2466. [Google Scholar] [CrossRef]
  28. Wahlund, S. Composition of Populations from the Perspective of the Theory of Heredity. Hereditas 1928, 11, 65–105. [Google Scholar] [CrossRef]
  29. Wang, Y. On the Classification, Distribution, Origin and Evolution of the Fishes Referred to the Subfamily Cyprininae of China, with Description of a New Species. ACTA Hydrobiol. Sin. 1979, 3, 419–438. [Google Scholar] [CrossRef]
  30. Chen, X.; Yue, P.; Lin, R. Major Groups within the Family Cyprinidae and Their Phylogenetic Relationships. Zool. Syst. 1984, 9, 424–440. [Google Scholar]
  31. Zhou, W. Phylogeny of the Subfamily Cyprinidae. ACTA Zootaxonomica Sin. 1989, 14, 247–256. [Google Scholar]
  32. van den Ende, C.; Puttick, M.N.; Urrutia, A.O.; Wills, M.A. Why Should We Compare Morphological and Molecular Disparity? Methods Ecol. Evol. 2023, 14, 2390–2410. [Google Scholar] [CrossRef]
  33. Yue, Z. The Monophyly of the Family Cyprinidae, the Barb Lineage, and the Subfamily Cyprinae and Their Relationships with Other Subfamilies Based on the D-Ring Region. Master’s Thesis, Yunnan University, Kunming, China, 2008. [Google Scholar]
  34. Luca, C.; Dudu, A.A.; Luca, A.; Dinischiotu, A.; Costache, M. Phylogenetic Relationships of Cyprinidae (Teleostei: Cypriniformes) Inferred from the Cox1 Gene Sequences; Studia Universitatis Vasile Goldis, Seria Stiintele Vietii (Life Sciences Series); Vasile Goldis University Press: Arad, Romania, 2008; Volume 18, pp. 175–180. [Google Scholar]
  35. Li, Q.; Li, W.; Han, C. Sequencing and Analysis of Complete Mitogenome of Cyprinus multitaeniate. J. Anhui Agric. Sci. 2024, 52, 108–111,120. [Google Scholar]
  36. Meng, Y.; Song, Y.; Xie, Q.; Cai, X.; Zhang, Q.; Dong, Y.; Li, F.; Xie, S.; Shen, Z. Mitochondrial Genome Sequencing and Structural Characteristic Analysis of Cyprinus acutidorsalis from Wanquan Estuary, Hainan. Mar. Sci. 2023, 47, 66–78. [Google Scholar]
Figure 1. The sampling locations of P. mera.
Animals 14 02672 g001
Figure 2. Mitochondrial genome map of the P. mera.
Animals 14 02672 g002
Figure 3. The frequency of relative synonymous codon usage (RSCU) in the mitogenome of P. meraWYL1 (A) and P. meraWYL2 (B).
Animals 14 02672 g003
Figure 4. Putative secondary structure of P. mera tRNA.
Animals 14 02672 g004
Figure 5. The ratios of Ka/Ks of 13 PCGs of the P. mera WYL1.
Animals 14 02672 g005
Figure 6. ML tree on the nodes constructed by using the amino acid sequences of the 13 PCGs with bootstrap values.
Animals 14 02672 g006
Table 1. Taxonomic information and GenBank accession number of all species used in the phylogenetic analysis.
GenusSpeciesGenBank Accession NumberLength (bp)
Carassioides (Ōshima, 1926)Carassioides acuminatus (J. Richardson, 1846)KX602324.116,579
Carassius
(Nilsson, 1832)
Carassius auratus (Linnaeus, 1758)EF483931.116,581
Carassius carassius (Linnaeus, 1758)AY714387.116,580
Carassius cuvieri (Temminck and Schlegel, 1846)NC_010768.116,581
Carassius gibelio (Bloch, 1782)GU138989.116,582
Carassius langsforfi (Temminck and Schlegel, 1846)NC_002079.116,578
Cyprinus
(Linnaeus, 1758)
Cyprinus megalophthalmus (Wu et al., 1963)KR869143.116,580
Cyprinus carpio (Linnaeus, 1758)NC_001606.116,575
Cyprinus multitaeniata (Pellegrin and Chevey, 1936)KR869145.116,580
Cyprinus pellegrini (Tchang, 1933)MN718675.116,583
Cyprinus rubrofuscus (Lacepede, 1803)MW969691.116,582
Cyprinus acutidorsalis (Chen and Hwang, 1977)KR869144.116,580
ProcyprisProcypris mera2019 (Lin, 1933)MN841761.116,579
Procypris mera2012 (Lin, 1933)JX316027.116,586
Procypris meraWLY1 (Lin, 1933)MN22974416,587
Procypris meraWLY2 (Lin, 1933)MN22974516,587
Procypris meraWLY3 (Lin, 1933)MN22974616,587
Procypris rabaudi (Tchang, 1930)EU082030.116,595
Puntioplites
(H. M. Smith, 1929)
Puntioplites proctozystron (Bleeker, 1865)AP011247.116,584
Misgurnus
(Lacépède, 1803)
Misgurnus anguillicaudatus (Cantor, 1842)MF579257.116,647
Note: The designation “Procypris mera2019” and “Procypris mera2012” indicate that the genome was submitted to the NCBI in 2019 and 2012, respectively.
Table 2. Mitochondrial genome sequencing data of three P. mera.
Length (bp)ReadsBase (G)Q20Q30GC (%)
WYL11504,596,2141.3896.4791.9538.16
WYL21504,288,5441.2996.2091.4538.16
WYL31503,490,3191.0596.2391.4738.41
Table 3. The characterisation of the mitochondrial genome three P. mera.
A (bp)T (bp)G (bp)C (bp)Length (bp)GC (%)GC-skew (%)AT-skew (%)
WYL1530441332633451716,58743.1−0.26350.1241
WYL2530341332634451716,58743.1−0.26330.124
WYL3530341332634451716,58743.1−0.26330.124
Table 4. Mitochondrial genome content and structure of P. mera.
Gene
/Element
LocationLength
(bp)
StrandInitiation CodonTermination CodonIntergenic
Nucleotide (bp)
Gene
/Element
LocationLength
(bp)
StrandInitiation CodonTermination CodonIntergenic
Nucleotide (bp)
tRNA-Phe1–6969H 0tRNA-Lys7872–794776H 1
12S-rRNA70–1024955H 0ATP87949–8113165HATGTAG−7
tRNA-Val1025–109672H 0ATP68107–8790684HATGTAA−1
16S-rRNA1097–27791683H 0COXIII8790–9574785HATGTA0
tRNA-Leu2780–285576H 1tRNA-Gly9575–964672H 0
ND12857–3831975HATGTAA4ND39647–9995349HATGT0
tRNA-Ile3836–390772H −2tRNA-Arg9996–10,06570H 0
tRNA-Gln3906–397671L 1ND4L10,066–10,362297HATGTAA−7
tRNA-Met3978–404669H 0ND410,356–11,7361381HATGT0
ND24047–50911045HATGT0tRNA-His11,737–11,80569H 0
tRNA-Trp5092–516271H 2tRNA-Ser11,806–11,87469H 1
tRNA-Ala5165–523369L 1tRNA-Leu11,876–11,94873H 3
tRNA-Asn5235–530773L 33ND511,952–13,7751824HATGTAA−4
tRNA-Cys5341–540767L −1ND613,772–14,293522LATGTAA0
tRNA-Tyr5407–547771L 1tRNA-Glu14,294–14,36269L 5
COXI5479–70291551HGTGTAA0Cytb14,368–15,5081141HATGT0
tRNA-Ser7030–710071L 3tRNA-Thr15,509–15,58072H −1
tRNA-Asp7104–717572H 5tRNA-Pro15,580–15,64970L 0
COXII7181–7871691HATGT0D-loop15,650–16,587938H 0
Table 5. The annotation data of SNPs.
PositionWYL2WYL1Gene TypeGeneCodonAmino AcidMutation Type
1296AGrRNA16S-rRNA SNP
7354CTCDSCOX2TCC > TCTSer > SerSNP
8502AGCDSATP6GAA > GAGGlu > GluSNP
12,774GACDSND5GCC > ACCAla > ThrSNP
14,503TCCDSCYTBTTA > CTALeu > LeuSNP
Disclaimer/Publisher’s Note: The statements, opinions and data contained in all publications are solely those of the individual author(s) and contributor(s) and not of MDPI and/or the editor(s). MDPI and/or the editor(s) disclaim responsibility for any injury to people or property resulting from any ideas, methods, instructions or products referred to in the content.