Article

Stress-Induced Immunosuppression Inhibits Regional Immune Responses in Chicken Adipose Tissue Partially through Suppressing T Cells by Up-Regulating Steroid Metabolism

College of Life Science and Technology, Harbin Normal University, Harbin 150025, China
*
Author to whom correspondence should be addressed.
These authors contributed equally to this work.
Animals 2024, 14(2), 225; https://doi.org/10.3390/ani14020225
Submission received: 21 November 2023 / Revised: 31 December 2023 / Accepted: 8 January 2024 / Published: 10 January 2024
(This article belongs to the Section Veterinary Clinical Studies)

Abstract

:

Simple Summary

Adipose tissue (AT) plays an important role in maintaining lipid homeostasis and regulating immune function in mammals. However, the regulatory functions and mechanisms of avian AT in immune response have not been reported. In this study, we found that chicken AT actively responded to stress-induced immunosuppression (SIIS), and adipose triglyceride lipase (ATGL), carnitine palmitoyltransferase 1A (CPT1A), and 3-hydroxy-3-methylglutaryl-CoA reductase (HMGCR) all constitute the key genes involved in the processes of SIIS inhibiting the immune response to the Newcastle disease virus vaccine. Moreover, SIIS significantly inhibited the different phases of the primary and secondary immune response in AT through the upregulation of steroid anabolism. Interestingly, AT could inhibit or promote immune responses through the upregulation or downregulation of steroid metabolism, respectively. The miR-29a/c-3p-HMGCR network is a potential regulation mechanism of AT participating in immune response and circulating miR-29a/c-3p is a potential molecular marker. This study can provide references for further investigating the immune functions of AT.

Abstract

Lipid metabolism plays an important role in maintaining lipid homeostasis and regulating immune functions. However, the regulations and mechanisms of lipid metabolism on the regional immune function of avian adipose tissue (AT) have not been reported. In this study, qRT-PCR was used to investigate the changes and relationships of different lipid metabolism pathways in chicken AT during stress-induced immunosuppression (SIIS) inhibiting immune response to Newcastle disease virus vaccine, then the miRNA regulation patterns of 3-hydroxy-3-methylglutaryl-CoA reductase (HMGCR) gene and its potential applications were further identified. The results showed that AT actively responded to SIIS, and ATGL, CPT1A and HMGCR were all the key genes involved in the processes of SIIS inhibiting the immune responses. SIIS significantly inhibited the natural and specific immune phases of the primary immune response and the initiation phase of the secondary immune response in AT by suppressing T cells by up-regulating steroid anabolism. Moreover, steroid metabolism could play dual roles in regulating the regional immune functions of AT. The miR-29a/c-3p-HMGCR network was a potential regulation mechanism of steroid metabolism in AT, and serum circulating miR-29a/c-3p had the potential as molecular markers. The study can provide valuable references for an in-depth investigation of the regional immune functions regulated by lipid metabolism in AT.

1. Introduction

Adipose tissue (AT) is the intersection linking immunity and metabolism [1,2], as immune-related cells in AT play key roles in regulating the body’s immune homeostasis and immune protection [3,4], and change in lipid metabolism of AT is an important pathway affecting immune functions [5,6]. In addition, lymphocytes in AT mainly utilize fatty acids to maintain their biological functions [7,8,9,10]; for example, resident memory T (TRM) cells increase the uptake of extracellular free fatty acids (FFAs) by up-regulating the expressions of fatty acid binding protein 4 (FABP4) and fatty acid binding protein 5 (FABP5) to maintain their lifespans and functions [11]. Recently, it has been shown that the change in lipid metabolism of the tumor microenvironment (TME) is an important mode affecting the functions and activities of infiltrating lymphocytes, which has become a research hotspot in the field of tumor prevention and treatment [12,13]. It is worth mentioning that the low efficiency of capillary circulation in white adipose tissue (WAT) [14], which can cause the paracrine effect of adipose tissue cells to form a certain regional microenvironment state, so changes in lipid metabolisms of AT can inevitably affect the regional immune functions and states of WAT. However, the effects of lipid metabolism on regional immune functions in avian AT have not been reported.
AT is widely distributed in the body and links different tissues and organs [15]. Studying the regulations and mechanisms of changes in lipid metabolism on the regional immune functions of AT is of positive research value in many aspects, such as the relationships between regional immunity of AT and systemic immunity, improvement of the body’s immune function, and potential development and application of AT. Chickens are in the middle position of evolution and are important model animals for studying immune functions [16]. In this study, Hy-line Gray chickens were selected as model animals, and SIIS and immune response of chickens were induced by dexamethasone (Dex) and Newcastle disease virus (NDV) attenuated vaccine, respectively. Then, we monitored the dynamic changes of different lipid metabolic pathways in WAT at different candidate time points during SIIS, inhibiting the primary and secondary immune responses to the NDV vaccine. Finally, we further analyzed the regulatory patterns between HMGCR (a key enzyme gene of cholesterol metabolism) and miR-29a/c-3p and identified the potential applications of the candidate miRNAs as circulating biomarkers. This study can provide valuable references for an in-depth investigation of the immunomodulatory functions of lipid metabolism in AT.

2. Materials and Methods

2.1. Ethics Statement

All animal experiments were carried out under the guidelines approved by the Institutional Animal Care and Use Committee (IACUC). The proposed study protocols were approved by the Laboratory Animal Care Committee of Harbin Normal University (No. HNUARIA2021001).

2.2. Experimental Grouping and Sample Collection

The experiment was based on the previous animal treatments in our lab [17]. Three hundred and sixty healthy unvaccinated 1-day-old Hy-line Gray chickens from Harbin Xiangfang hatchery were randomly divided into four groups: control group, Dex group (dexamethasone treatment group), ND group (NDV attenuated vaccine immunization group) and Dex + ND group (dexamethasone and NDV vaccine dual-factor treatment group), with 3 replicates per group and 30 chickens per replicate, and reared in isolation (The room temperature of 1–7-day-old chickens was 35 °C, the room temperature of 7–42 day-old chickens was 27 °C, and the humidity was 50–70%) and fed ad libitum (feed formulation: vitamins (VA, Vb3, VE, VK, VB6, VB12), fishmeal, corn, high-quality soybean meal, acid preparations, calcium propionate, calcium hydrogen phosphate, rock flour, copper sulfate, ferrous sulfate, manganese sulfate, zinc oxide, salt, lysine, methionine, sodium selenite, etc.). Chickens from the Dex group and the Dex + ND group were treated with dexamethasone (Dex) (1.5 mg/kg, purchased from China Huaxu Veterinary Pharmaceuticals Ltd.) for three days during 5–7 days of age and 19–21 days of age, respectively. Chickens from ND group and Dex + ND group were vaccinated with 0.05 mL NDV LaSota strain (the viral content was not less than 106.0EID50 per feather portion) (Harbin Veterinary Research Institute, Harbin, China) by eye-drop at 7 days old and boosted at 21 days old, respectively, while chickens from the control group and the Dex group were treated with vaccine diluted salt solution (Harbin Veterinary Research Institute, Harbin, China). For the convenience of comparison, the sampling time points of the four treatment groups were the same, and they all adopted the same labeling method (days post-immunization (dpi)). At 2, 5, 7, 14 and 21 days post the primary and secondary immunization, three chickens were randomly selected from each replicate of each group, and thymus, bursa, spleen, abdominal adipose tissue (AAT) and serum were collected and stored at −80 °C.

2.3. Detection of Antibody Titer and Analysis of Organ Coefficient

Antibody levels and organ coefficients were detected according to the methods of previous studies [17,18]. Serum NDV antibody titers were detected by hemagglutination (HA) and hemagglutination inhibition (HI) assays using standard antigens of the NDV LaSota strain (Harbin Veterinary Medical Research Institute, Harbin, China) and expressed as the reciprocal of log2 values [17,18,19]. The body weight, thymus, bursa and spleen from the nine randomly selected chickens at each time point were used to analyze the body weight coefficients and organ coefficients, respectively.

2.4. Reverse Transcription and Quantitative Real-Time Fluorescence PCR (qRT-PCR)

Total RNA was extracted from AT and serum and quantified (300 ng/μL RNA of each sample), respectively. Reverse transcription was performed using the FSQ-301 kit (TOYOBO, Shanghai, China) according to the manufacturer’s instructions. QRT-PCR system for mRNAs was 10 μL, containing 0.6 μL cDNA, 0.3 μL of each primer, 5 μL 2 × SYBR Green I (TOYOBO, Shanghai, China), 0.2 μL 50 × ROX (TOYOBO, Shanghai, China), 3.6 μL RNA-free water. QRT-PCR system for miRNA was 10 μL, including 0.8 μL cDNA, 0.3 μL of each primer, 5 μL 2 × SYBR Green I (TOYOBO, Shanghai, China) 0.2 μL 50 × ROX (TOYOBO, Shanghai, China), 3.4 μL RNA-free water. QRT-PCR procedures of the mRNAs and miRNAs were: 95 °C for 1 min, followed by 45 cycles, 95 °C for 15 s, 60 °C for 30 s, 72 °C for 30 s, and 72 °C final extension for 30 s. The β-actin gene and U6 were selected as the internal references mRNAs and miRNAs, respectively. All primer sequences are provided in Table 1.

2.5. Statistical Analysis

The 2−ΔΔCt method was used to calculate the relative expression activities of target genes and miRNAs [20]. All data were presented as meaning ± SD from at least 3 sets of independent experiments. Data between different treatment groups were analyzed using an independent t-test, and data within the same treatment group were analyzed using ANOVA. Independent t-tests and ANOVA were performed using SPSS 20.0 software (https://www.ibm.com/products/spss-statistics, accessed on 15 June 2023) and GraphPad Prism _v8.2.1 software (https://www.graphpad.com/scientific-software/prism/, accessed on 17 June 2023) was used to plot, p < 0.05 indicated statistical significance.

3. Results

3.1. Analysis of Organ Coefficients and Serum Antibodies

HA-HI analysis showed that the NDV antibody levels in the ND group showed a gradual increase in the primary immunity (7–21 dpi1) and peaked at 21 dpi1; in the secondary immunity (2–21 dpi2), the NDV antibody levels showed a continuous increase, and the peak level was significantly higher than that of the primary immunity. In comparison between the ND group and Dex + ND group, the changing trend of NDV antibody of the Dex + ND group was similar to that of the ND group, but the antibody levels were significantly lower than those of the ND group, and there were significant differences at several time points (14 dpi1, 21 dpi1, 7 dpi2 and 14 dpi2) (p < 0.05) (Figure 1A). In addition, comparing the body weight coefficients and three organ coefficients, including thymus, bursa and spleen, between the ND group and Dex + ND group, the body weight coefficients and all the organ coefficients of the Dex + ND group were significantly lower than those of ND group (p < 0.05) (Figure 1B–E). These results showed that the primary and secondary immune response chickens and stress-induced immunosuppressed chickens were successfully established, respectively [17].

3.2. Expression Characteristics of Adipose Tissue ATGL, CPT1A and HMGCR Genes in the State of SIIS

To explore whether the lipid metabolism of chicken AT positively responds to the process of SIIS, we analyzed the expression characteristics of adipose tissue ATGL, CPT1A and HMGCR genes in the Dex group. For ease of comparison, we artificially classified the expression activities of all the candidate targets in this study into three levels: over 2 for high expression, less than 1 for low expression, and medium expression between 1 and 2. QRT-PCR results showed that ATGL gene expression activities changed significantly among different time points (p < 0.05) (Figure 2A). During the process of the primary SIIS, ATGL genes were all highly expressed except for the moderate expression on 2 dpi1; in the process of the secondary SIIS, ATGL was highly expressed on 5 dpi2, 14 dpi2 and 21 dpi2, and lowly expressed on 2 dpi2 and 7 dpi2. In addition, CPT1A gene expression activities changed significantly among different time points (p < 0.05) (Figure 2B). During the primary SIIS, CPT1A gene was highly expressed on 5 dpi1, 7 dpi1 and 14 dpi1, moderately expressed on 21 dpi1, and lowly expressed on 2 dpi1; in the process of secondary SIIS, CPT1A gene was highly expressed on 2 dpi2, 5 dpi2, 7 dpi2 and 21 dpi2, and moderately expressed on 14 dpi2. Additionally, HMGCR gene expression activities changed dramatically during the primary and secondary SIIS (p < 0.05) (Figure 2C). For example, HMGCR was highly expressed on 2 dpi1, 7 dpi1 and 14 dpi1, moderately expressed on 5 dpi1 and lowly expressed on 21 dpi1 during the primary SIIS; and HMGCR was highly expressed on 2 dpi2, 14 dpi2 and 21 dpi2 and lowly expressed on 5 dpi2 and 7 dpi2 during the secondary SIIS.
Overall, during the primary SIIS, ATGL, CPT1A and HMGCR genes were all up-regulated as their common features (except for CPT1A on 2 dpi1 and HMGCR on 21 dpi1), but the change trends of ATGL and CPT1A were similar, which were certainly different from that of HMGCR; during the secondary SIIS, ATGL, CPT1A and HMGCR genes were all up-regulated as their common features (except for ATGL on 2 and 7 dpi2 and HMGCR on 5 and 7 dpi2), and there were similarities between CPT1A and HMGCR in terms of change trends, while there were some differences between them and ATGL.

3.3. Expression Characteristics of Adipose Tissue ATGL, CPT1A and HMGCR Genes in the Processes of SIIS Inhibiting Immune Responses

QRT-PCR results showed that, during the primary immune response, the ATGL gene was highly expressed on 7 dpi1 and 14 dpi1, moderately expressed on 5 dpi1, and lowly expressed on 2 dpi1 and 21 dpi1; during the secondary immune response, the ATGL gene was highly expressed on 2 dpi2, moderately expressed on 21 dpi2, and lowly expressed on 5 dpi2, 7 dpi2 and 14 dpi2 (Figure 3A). Significant changes in CPT1A gene expression activities were also found (Figure 3B), for example, during the primary immune response of ND group, CPT1A was highly expressed on 14 dpi1, moderately expressed on 5 dpi1, and lowly expressed on 2 dpi1, 7 dpi1 and 21 dpi1; during the secondary immune response, CPT1A was all lowly expressed except for 2 dpi2 with moderate expression. According to the comparisons between the ND group and Dex + ND group, the expression activities of the CPT1A gene showed significant differences at multiple time points, such as 2 dpi1, 7 dpi1, 21 dpi1, 2 dpi2, 5 dpi2, 14 dpi2 and 21 dpi2. QRT-PCR results showed that, in the ND group, HMGCR was moderately expressed on 7 and 14 dpi1 and lowly expressed on 2, 5 and 21 dpi1 during the primary immune response; during the secondary immune response, HMGCR was highly expressed on 14 and 21 dpi2, while lowly expressed on 2, 5 and 7 dpi2. Compared to the ND group, HMGCR was significantly up-regulated at multiple candidate time points, such as 2 dpi1, 7 dpi1, 14 dpi1, 2 dpi2 and 5 dpi2 in the Dex + ND group (p < 0.01), but significantly down-regulated at the other time points (p < 0.01). Moreover, the differences were highly significant between the two groups at all the candidate time points (except 5 dpi1) (p < 0.01).
Overall, in the primary immune response, CPT1A and HMGCR genes were mainly down-regulated, and ATGL was mainly up-regulated in the ND group, while ATGL, CPT1A and HMGCR genes were mainly up-regulated as their common features in the Dex + ND group. In the secondary immune response, ATGL, CPT1A and HMGCR genes were mainly down-regulated in the ND group, while they were mainly up-regulated in the Dex + ND group as their common features. So, the common feature between the ND group and Dex + ND group was mainly characterized by the significant differences (p < 0.01) at the most candidate time points during the primary and secondary immune responses.

3.4. Identification of Adipose Tissue T Cells Involving in the Processes of SIIS Inhibiting Immune Responses

To further investigate how SIIS inhibits the regional immune responses of AT, we selected and analyzed the expression activity of the TCRα gene between the ND group and the Dex + ND group. QRT-PCR results showed that TCRα gene expression activities were significantly changed (p < 0.05) (Figure 4). In the ND group, during the primary immune response, TCRα was highly expressed on 14 dpi1, moderately expressed on 7 dpi1 and 21 dpi1, and lowly expressed at the other time points; during the secondary immune response, TCRα was highly expressed on 2 dpi2, 5 dpi2, 7 dpi2 and 21 dpi2, and moderately expressed on 14 dpi2. In comparison between the ND group and Dex + ND group, TCRα gene expression activities were significantly different (p < 0.05) at the most candidate time points in the processes of the primary and secondary immune responses. Moreover, the expression activities of the TCRα gene in the Dex + ND group were all lower than those in the ND group.

3.5. Identification of Game Relationship between miR-29a/c-3p and HMGCR Gene in Adipose Tissue during SIIS Inhibiting Immune Responses

HMGCR is a key enzyme gene involved in the steroid metabolic pathway, and steroid lipids play key roles in the regulation of immune functions. Therefore, we further analyzed the expression characteristics of adipose tissues miR-29a/c-3p between the ND group and Dex + ND group in order to explore the regulation pattern of adipose tissue HMGCR gene in vivo. It is shown that both miR-29a-3p and miR-29c-3p can target the HMGCR gene [21], and they have highly homologous sequences [21,22], and the stem-loop primers cannot distinguish them. Therefore, the stem-loop qRT-PCR can reflect their common quantification results of miR-29a-3p and miR-29c-3p. The results showed that there were highly significant differences in the expression activities of adipose tissue miR-29a/c-3p between the ND group and Dex + ND group at the candidate time points (p < 0.05) (Figure 5). In the ND group, miR-29a/c-3p were highly expressed on 7 dpi1, moderately expressed on 5 dpi1 and 21 dpi1, and lowly expressed on 2 dpi1 and 14 dpi1 during the primary immune response; in the process of secondary immune response, miR-29a/c-3p were highly expressed on 21 dpi2, moderately expressed on 5 dpi2 and 14 dpi2, and lowly expressed on 2 dpi2 and 7 dpi2. In Dex + ND group, miR-29a/c-3p were highly expressed on 21 dpi1 and lowly expressed on 2 dpi1, 5 dpi1, 7 dpi1 and 14 dpi1 during the primary immune response; during the secondary immune response, and miR-29a/c-3p were only highly expressed on 14 dpi2, and lowly expressed at other time points. Interestingly, the differences in expression activities of adipose tissue miR-29a/c-3p were highly significant at all the candidate time points between the ND group and the Dex + ND group (p < 0.01).
To identify the molecular mechanisms underlying the regulation of adipose tissue HMGCR gene expression, we compared and analyzed the game relationships of expression activities between miR-29a/c-3p and the HMGCR gene in AT. The results showed that miR-29a/c-3p and HMGCR genes had significant game relationships between them at multiple candidate time points. For example, in ND group, miR-29a/c-3p and HMGCR gene expression activities were gamely regulated (miR-29a/c-3p up-regulated expression and HMGCR down-regulated expression, or miR-29a/c-3p down-regulated expression and HMGCR up-regulated expression) on 5 dpi1, 14 dpi1 and 5 dpi2 (Figure 6A); in Dex + ND group, miR-29a/c-3p and HMGCR gene expression activities were gamely regulated at the most candidate time points (except for 5 dpi1 and 7 dpi2) (Figure 6B).

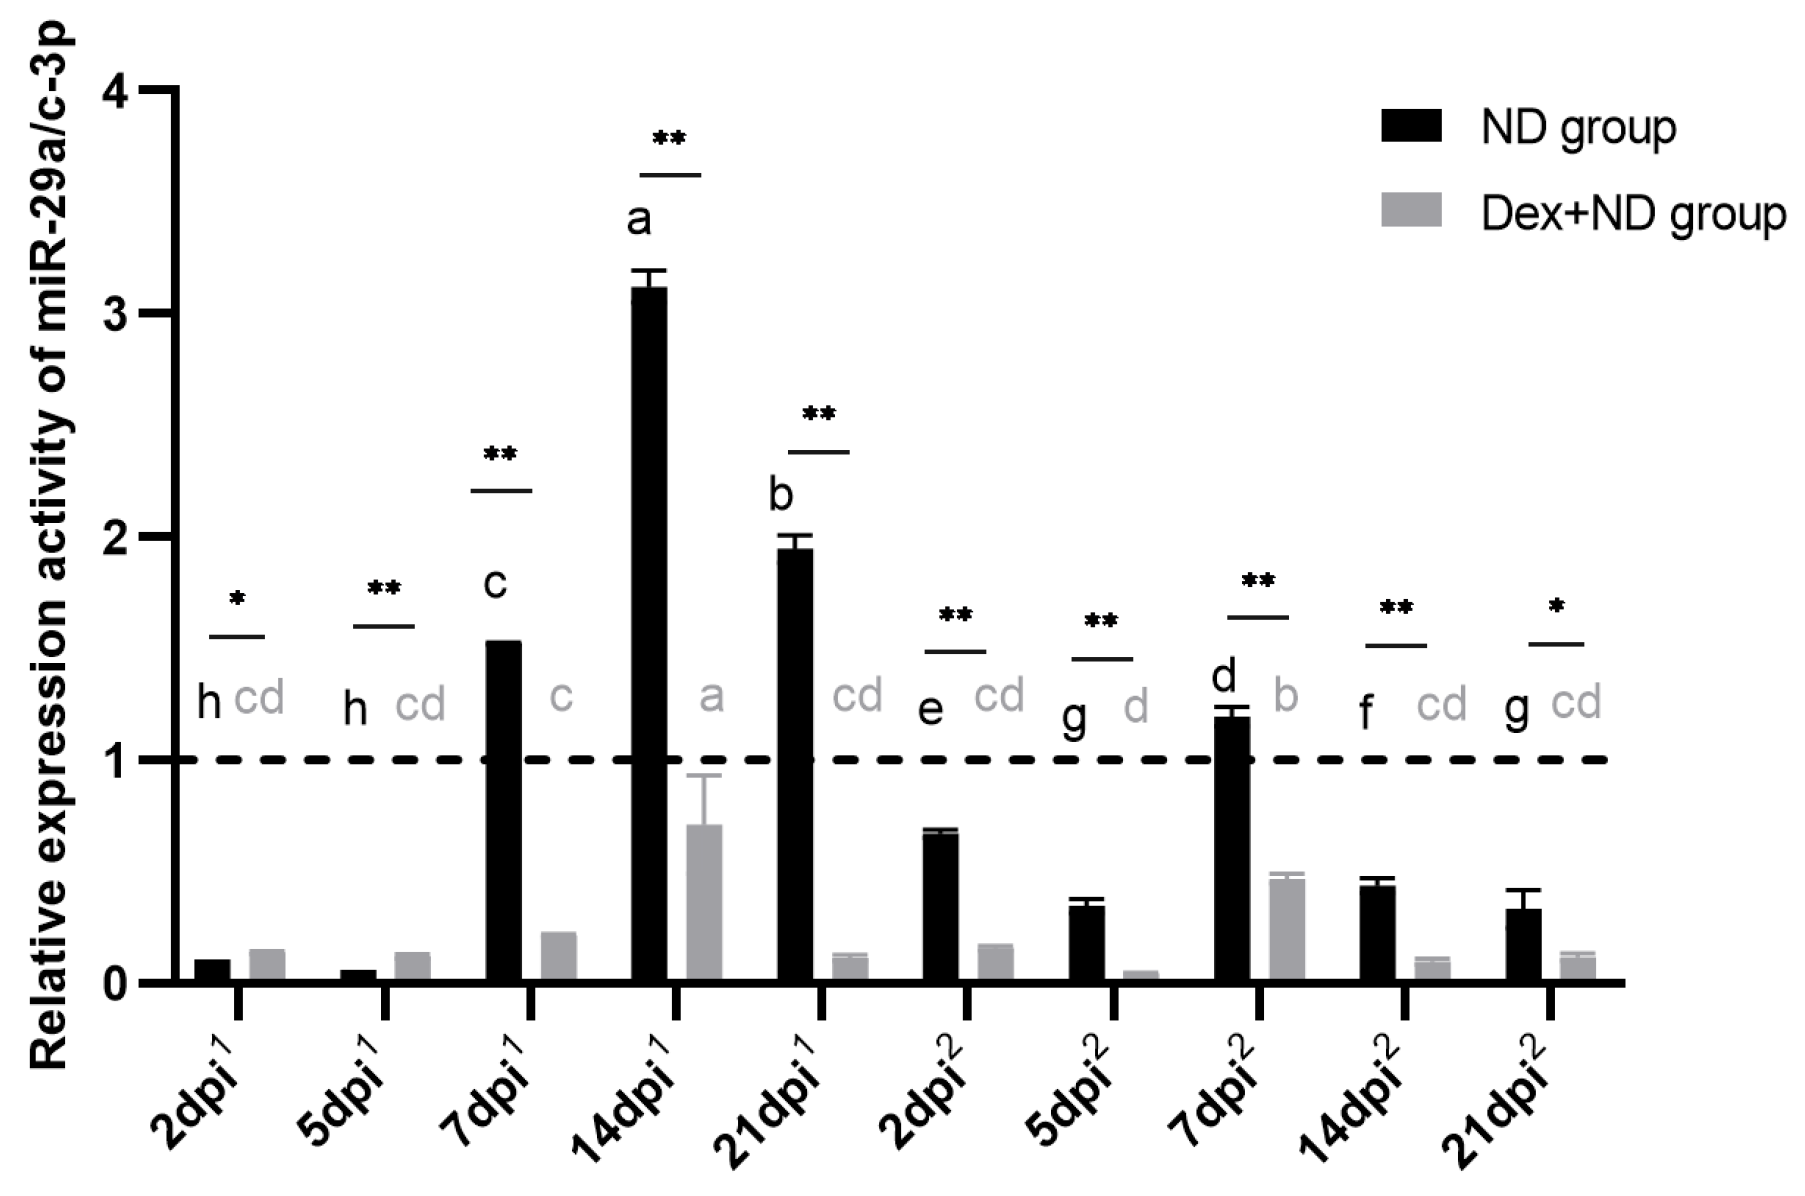
3.6. Identification of Serum Circulating miR-29a/c-3p as Molecular Markers

To investigate the potential application of serum circulating miR-29a/c-3p in SIIS-inhibiting immune responses further, we analyzed the expression levels of serum circulating miR-29a/c-3p in the ND group and Dex + ND group. QRT-PCR results showed that, in the ND group, serum circulating miR-29a/c-3p were up-regulated on 7 dpi1, 14 dpi1 and 21 dpi1 and down-regulated at the other time points during the primary immune response; in the process of secondary immune response, serum circulating miR-29a/c-3p were up-regulated on 7 dpi2 and down-regulated at the other time points. Compared to the ND group, serum circulating miR-29a/c-3p were all down-regulated in the Dex + ND group during both immune responses, and there were significant differences at all the candidate time points between the ND group and Dex + ND group (p < 0.05), especially on 7 dpi1, 14 dpi1, 21 dpi1 and 7 dpi2 (Figure 7).

4. Discussion

In recent years, the immunomodulatory function of AT has become a hot topic of research [1,2]. However, studies on the regulation of regional immune function in avian AT by lipid metabolism have not been reported. Previous studies in our lab have shown that there are regional immune responses to the NDV vaccine in chicken AT, and lipid metabolisms of AT actively respond to the NDV secondary immune response through down-regulation [17]. However, the mechanisms of lipid metabolisms involved in the regulation of regional immune function of AT are still unclear. In this study, in order to explore the patterns and mechanisms of lipid metabolism pathways involved in the regional immune responses of AT, we produced chicken models with SIIS inhibiting immune response and analyzed the changes and functions of different lipid metabolism pathways of AT in the processes of SIIS inhibiting immune responses to NDV vaccine.
Dexamethasone treatment is a classical method to simulate SIIS in animals [23,24,25]. In this study, we utilized Dex to simulate stress-induced immunosuppressed chickens and found that the body weight, spleen, bursa, and thymus of the Dex + ND group chickens were significantly lower than those of the ND group at all candidate time points. Moreover, the NDV antibody levels in the Dex + ND group were lower than those in the ND group. These results fully showed that Dex effectively suppressed the primary and secondary immune responses to the NDV vaccine in chickens, and the Dex-induced immunosuppressed chicken models were prepared successfully. In the state of SIIS, we found that ATGL expression activities were up-regulated at the most candidate time points, indicating that SIIS promoted adipose tissue triglyceride catabolism, which in turn produced large amounts of fatty acids as raw materials and material basis for further metabolism [26]. To investigate the further pathways of fatty acid metabolism, we analyzed the expression characteristics of CPT1A and HMGCR genes in the state of SIIS. CPT1A is a key enzyme gene in the fatty acid oxidative catabolic pathway, and its mRNA and protein levels are positively correlated [27]. Exploring the transcriptional activities of CPT1A can help understand the changes in fatty acid oxidative metabolism under the condition of SIIS. We chose HMGCR as the target gene to explore the changes in sterol metabolism of AT because the HMGCR is the most important key enzyme gene in the cholesterol synthesis pathway, and its mRNA is positively correlated with protein level [21,28], so analyzing the transcriptional activities of HMGCR gene can reflect the states of sterol anabolisms in the process of SIIS [29]. Intriguingly, we found that the expression activities of adipose tissue CPT1A gene showed fluctuating up-regulation during the primary SIIS, indicating that the primary process of SIIS was mainly characterized by increased oxidative catabolism of fatty acids in AT. During the secondary SIIS, adipose tissue CPT1A gene expression activities were up-regulated at all the candidate time points, indicating that fatty acid oxidative metabolism was still the main biological event. In addition, both primary and secondary SIIS in the Dex group all caused significantly fluctuating changes in steroid metabolisms of AT, suggesting that adipose tissue steroid metabolism was closely associated with SIIS. For example, adipose tissue HMGCR gene expression activities were up-regulated at most candidate time points, suggesting that dexamethasone could induce synthesis of sterol lipids of AT to achieve SIIS, which was similar to the up-regulation of HMGCR gene expression in the liver followed stress, thus induced hypercholesterolemia [30,31,32].
Since SIIS can significantly change the activities of different lipid metabolisms in AT, we considered that the changed lipid metabolisms would inevitably significantly affect the regional immune responses of AT because of the low circulating efficiency in WAT; thus, the paracrine secretion of AT could form certain regional microenvironment state [14]. ATGL, as a triglyceride hydrolase, has speed-limiting properties in fat mobilization, and ATGL mRNA level is positively correlated with its protein level [33]. In our study, during the primary immune response, the expression activities of ATGL in the Dex + ND group were significantly higher than those in the ND group except for 5 dpi1, suggesting that SIIS could participate in the regional immune response of AT by up-regulating triglyceride catabolism. The expression activities of CPT1A in the Dex + ND group were lower than those in the ND group (2–5 dpi1) and higher than those in the ND group (7–21 dpi1), indicating that SIIS regulated the primary immune response of AT by down-regulation followed by up-regulation of fatty acid oxidative metabolism. Compared with the ND group, the Dex + NDV group showed increased fat hydrolysis during the primary immune response, which produced a large number of fatty acids, thus inducing subsequent up-regulation of fatty acid oxidative catabolism. During the secondary immune response, the expression activities of ATGL gene in the Dex + ND group were higher than those in ND group except for 2 dpi2, and the CPT1A gene expression activities were also higher than those in ND group at all the candidate time points, but fatty acid catabolism was generally down-regulated in ND group, suggesting that SIIS inhibited the secondary immune response of AT through up-regulating fatty acid oxidative catabolism.
The up-regulating β-oxidative catabolism of fatty acids in mitochondria produced large amounts of acetyl coenzyme A (Acetyl-CoA) [34]. However, the further metabolic pathway of these Acetyl-CoAs would not all enter the tricarboxylic acid (TCA) cycle to produce ATP because both immune responses of the ND group were characterized by the down-regulation of fatty acid oxidative catabolism. So, we considered that most of these Acetyl-CoAs would enter the steroid anabolic pathway in AT, which in turn produced large amounts of cholesterol and its derivatives. Of note, cholesterol can promote T cell activation and proliferation by regulating cell membrane lipid raft formation and signal transduction [35], and up-regulation of endogenous cholesterol biosynthesis and uptake may be beneficial for T cell function [36]. However, cholesterol can lock the TCR-CD3ζ of T cells in an inactive conformation, thereby inhibiting T lymphocyte activation and proliferation [37], and too much or too little exogenous cholesterol may lead to T cell dysfunction [38]. Therefore, the regulation of lymphocytes by cholesterol and its derivatives is determined by the tissue microenvironment [12,39,40]. In our study, we considered that the expression up-regulation of steroid lipids in AT mainly exerted an inhibitory effect on the regional immune response. The possible reasons were as follows: firstly, AT had a relative regional microenvironment state due to its relatively slow microcirculation [14,41]; secondly, increased mobilization of triacylglycerol in AT (ATGL up-regulation) resulted in the production of a large amount of glycerol and fatty acids [42,43], which could be secreted to the outside of adipocytes, thus affecting the microenvironment of AT; thirdly, increased oxidative catabolism of fatty acids (up-regulation of CPT1A) led to massive production of Acetyl-CoAs [44], and some acetyl-CoA entered TCA cycle to generate ATP, but most of them would be used as raw materials to further generate cholesterol, including sterol lipids [45], which could also be transported into the interstitial space of AT and further influenced the adipose tissue microenvironment; fourthly, increased steroid lipids could inhibit functions and activities of T lymphocytes [12]; fifthly, increased lipids accumulation in the adipose tissue microenvironment could lead to metabolic crosstalk among surrounding lymphocytes [46] and lymphocytes absorbed excessive free lipids, which in turn affected immune cells functions [12,13]; sixthly, the massive release of lipids from AT would caused microcirculation disorders and obstruction of oxygen transportation in AT [47,48], resulting in TCA cycle metabolic disorders in AT lymphocytes, inhibiting ATP production and thereby affecting lymphocytes activities; seventhly, given that increased lipid concentrations in TME suppressed lymphocytes activities [12,13,49,50], we believed that the biological effect of increased lipid concentrations in AT, represented by steroid lipids, was to suppress the regional immune response of AT. Admittedly, these were our scientific speculations based on existing knowledge, but the specific mechanisms need to be further studied in the future.
Based on the above analyses, we further explored whether steroid metabolic activities changed positively in the processes of SIIS inhibiting the regional immune responses of AT. Interestingly, we found that adipose tissue HMGCR gene expression activities were dramatically different between the ND group and Dex + ND group at the most candidate time points, suggesting that SIIS could inhibit the regional immune responses of AT by regulating steroid metabolic pathways. For example, during the primary and secondary immune responses, the HMGCR gene was significantly up-regulated at several time points (2 dpi1, 7 dpi1, 14 dpi1, 2 dpi2 and 5 dpi2) in the Dex + ND group compared to the ND group. Generally, 2 dpi1 was the natural immune response phase, 7–14 dpi1 corresponded to the acquired immune response phase of primary immunity, and 2–5 dpi2 was the rapid response phase of secondary immunity [51], so the up-regulated HMGCR gene suggested that SIIS inhibited these key processes of the primary and secondary immune responses by up-regulating steroid anabolism in AT. It was worth noting that 2–5 dpi2 was a critical period for the rapid activating and proliferating of TRM cells in AT [52], and our analyses of TCRα expression activities in the ND group also revealed the similar significant up-regulation of T cells during 2–7 dpi2, implying the presences of TRM cells in chicken AT and their rapid activation and proliferation. Of note, steroid anabolism was significantly up-regulated in the Dex + ND group, suggesting that SIIS could dramatically inhibit the activation and proliferation of TRM cells through up-regulating steroid metabolic pathways. By comparison, the steroid anabolisms in the ND group were down-regulated during 2–5 dpi2, resulting in the reduction of lipids concentration (represented by the decrease in sterol lipid synthesis) in the adipose tissue microenvironment, which in turn better responded to and facilitated the regional secondary immune response of AT. The results were consistent with our lab’s previous findings [17]. Interestingly, we found that the activities of steroid anabolism in the ND group were higher than those in the Dex + ND group during the late stages of the primary (21 dpi1) and secondary immune responses (7–21 dpi2), and the increased steroid lipids inhibited immune activity [12], which might avoid immune damage caused by strong immune response, suggesting that immune responses also could modulate the intensity of regional immune response through changing steroid metabolic pathway in AT.
To further prove the effects of changed lipid metabolism on the regional immune response of AT, we selected and analyzed the expression activities of the T lymphocyte marker TCRα gene. Studies show that most T cells express TCRα on their surface, and the mRNA level of TCRα is positively correlated with its protein level [53,54,55], and analyzing the expression activities of the TCRα gene can reflect the changes in the number of T lymphocytes in AT. We found that the TCRα gene expression activities in the Dex + ND group at the most candidate time points were significantly lower than those in the ND group during the primary and secondary immune responses, which fully demonstrated that SIIS could significantly inhibit the numbers and functions of adipose tissue T lymphocytes through up-regulating steroid anabolism. The results also indirectly indicated that a large number of T cells participated in the regional immune response of chicken AT. Of note, in the ND group, the expression activities of the TCRα gene in the secondary immunity were higher than those in the primary immunity, which possibly was related to the TRM cells, further indicating the existence of TRM cells in chicken AT. In short, we found that SIIS could inhibit the different phases of primary and secondary regional immune responses of AT through up-regulating steroid anabolism. In addition, AT could suppress the intensity of immune response through up-regulating steroid anabolism during the completion stages of immune responses in the ND group. So, the steroid metabolic pathway played “dual roles” in regulating regional immune functions of AT (up-regulation suppressed immunity and down-regulation promoted immunity).
As a key enzyme of the steroid anabolic pathway, HMGCR was a key factor involved in the regulation of the regional immune function of AT [29,56,57], so exploring the molecular mechanism of HMGCR expression regulation had an important research necessity to gain insight into the immune functional properties of AT. We found that miR-29a/c-3p were significantly differentially expressed among different treatment groups, indicating that miR-29a/c-3p were key factors involved in the regulation of cholesterol metabolism of AT. Furthermore, we found significant game relationships between miR-29a/c-3p and the HMGCR gene at multiple candidate time points in different treatment groups, suggesting that the miR-29a/c-3-HMGCR regulatory network was a potential mechanism of cholesterol metabolism in AT. Interestingly, miR-29a/c-3p in the Dex + ND group had significant game relationships with HMGCR at more candidate time points compared to the ND group, implying that the miR-29a/c-3-HMGCR regulatory network was more sensitive to SIIS, and was possibly a key mechanism by which SIIS inhibited regional immune responses of AT. Of course, there were many miRNAs involved in HMGCR regulation, so the specific mechanisms need to be further investigated.
To further identify the potential of circulating miR-29a/c-3p as molecular markers in SIIS affecting immune responses, we found that serum circulating miR-29a/c-3p expression levels were significantly down-regulated in the Dex + ND group at the most candidate time points compared to ND group, suggesting that SIIS might inhibit immune responses by down-regulating circulating miR-29a/c-3p expression levels and also implying the potential value of serum circulating miR-29a/c-3p as molecular markers in the process of detecting the effect of SIIS on immune responses.

5. Conclusions

We first found that SIIS can inhibit the regional immune response of chicken adipose tissue by regulating lipid metabolic pathways. Moreover, the steroid metabolic pathway can affect the numbers of T cells in adipose tissue and play dual roles in the regulation of immune functions in adipose tissue, i.e., up-regulation suppressing immunity and down-regulation promoting immunity. In addition, we discovered a potential mechanism for regulating cholesterol metabolism (miR-29a/c-3p-HMGCR network) in adipose tissue and evaluated the potential application value of circulating miR-29a/c-3p. This study can provide a directional reference for further investigating immune regulatory functions of lipid metabolism in adipose tissue.

Author Contributions

Conceptualization, C.M.; methodology, C.M., W.Z. and X.X.; validation, W.Z., X.X., R.Z., Y.T., X.M., X.W. and Y.J.; formal analysis, W.Z. and X.X.; investigation, W.Z. and X.X.; writing—original draft preparation, W.Z. and X.X.; writing—review and editing, C.M.; visualization, W.Z. and X.X.; supervision, C.M.; funding acquisition, C.M. All authors have read and agreed to the published version of the manuscript.

Funding

This work was funded by the Natural Science Foundation of Heilongjiang Province grant no. LH2019C073.

Institutional Review Board Statement

All animal experiments were carried out under the guidelines approved by the In-stitutional Animal Care and Use Committee (IACUC). The proposed study protocols were approved by the Laboratory Animal Care Committee of Harbin Normal Univer-sity (No. HNUARIA2021001, approved on 15 June 2021).

Informed Consent Statement

Not applicable.

Data Availability Statement

The datasets are available from the corresponding author on reasonable request.

Conflicts of Interest

The authors declare no conflicts of interest.

Abbreviations

ATGLadipose triglyceride lipase
CPT1Acarnitine palmitoyltransferase 1A
HMGCR3-hydroxy-3-methylglutaryl-CoA reductase
qRT-PCRquantitative real-time fluorescence PCR
Dexdexamethasone
WATwhite adipose tissue
TMEtumor microenvironment
FFAsfree fatty acids
FABPfatty acid binding protein
ATAdipose tissue
TRMresident memory T cell
SIISstress-induced immunosuppression
TCRαT-cell receptor α
Acetyl-CoAacetyl coenzyme A
TCAtricarboxylic acid

References

  1. Kohlgruber, A.C.; Lamarche, N.M.; Lynch, L. Adipose tissue at the nexus of systemic and cellular immunometabolism. Semin. Immunol. 2016, 28, 431. [Google Scholar] [CrossRef]
  2. Wang, Q.; Wu, H. T Cells in Adipose Tissue: Critical Players in Immunometabolism. Front. Immunol. 2018, 9, 2509. [Google Scholar] [CrossRef] [PubMed]
  3. Moro, K.; Yamada, T.; Tanabe, M.; Takeuchi, T.; Ikawa, T.; Kawamoto, H.; Furusawa, J.; Ohtani, M.; Fujii, H.; Koyasu, S. Innate production of T(H)2 cytokines by adipose tissue-associated c-Kit(+)Sca-1(+) lymphoid cells. Nature 2010, 463, 540–544. [Google Scholar] [CrossRef] [PubMed]
  4. Röszer, T. Adipose Tissue Immunometabolism and Apoptotic Cell Clearance. Cells 2021, 10, 2288. [Google Scholar] [CrossRef] [PubMed]
  5. Kim, Y.C.; Kim, K.K.; Shevach, E.M. Simvastatin induces Foxp3+ T regulatory cells by modulation of transforming growth factor-beta signal transduction. Immunology 2010, 130, 484–493. [Google Scholar] [CrossRef] [PubMed]
  6. Lim, S.A.; Su, W.; Chapman, N.M.; Chi, H. Lipid metabolism in T cell signaling and function. Nat. Chem. Biol. 2022, 18, 470–481. [Google Scholar] [CrossRef] [PubMed]
  7. Pond, C.M.; Mattacks, C.A. The source of fatty acids incorporated into proliferating lymphoid cells in immune-stimulated lymph nodes. Br. J. Nutr. 2003, 89, 375–383. [Google Scholar] [CrossRef]
  8. Caro-Maldonado, A.; Gerriets, V.A.; Rathmell, J.C. Matched and mismatched metabolic fuels in lymphocyte function. Semin. Immunol. 2012, 24, 405–413. [Google Scholar] [CrossRef]
  9. MacIver, N.J.; Michalek, R.D.; Rathmell, J.C. Metabolic regulation of T lymphocytes. Annu. Rev. Immunol. 2013, 31, 259–283. [Google Scholar] [CrossRef]
  10. O’Sullivan, D.; van der Windt, G.J.; Huang, S.C.; Curtis, J.D.; Chang, C.H.; Buck, M.D.; Qiu, J.; Smith, A.M.; Lam, W.Y.; DiPlato, L.M.; et al. Memory CD8(+) T cells use cell-intrinsic lipolysis to support the metabolic programming necessary for development. Immunity 2014, 41, 75–88. [Google Scholar] [CrossRef]
  11. Pan, Y.; Tian, T.; Park, C.O.; Lofftus, S.Y.; Mei, S.; Liu, X.; Luo, C.; O’Malley, J.T.; Gehad, A.; Teague, J.E.; et al. Survival of tissue-resident memory T cells requires exogenous lipid uptake and metabolism. Nature 2017, 543, 252–256. [Google Scholar] [CrossRef]
  12. Ma, X.; Bi, E.; Lu, Y.; Su, P.; Huang, C.; Liu, L.; Wang, Q.; Yang, M.; Kalady, M.F.; Qian, J.; et al. Cholesterol Induces CD8(+) T Cell Exhaustion in the Tumor Microenvironment. Cell Metab. 2019, 30, 143–156.e145. [Google Scholar] [CrossRef] [PubMed]
  13. Manzo, T.; Prentice, B.M.; Anderson, K.G.; Raman, A.; Schalck, A.; Codreanu, G.S.; Nava Lauson, C.B.; Tiberti, S.; Raimondi, A.; Jones, M.A.; et al. Accumulation of long-chain fatty acids in the tumor microenvironment drives dysfunction in intrapancreatic CD8+ T cells. J. Exp. Med. 2020, 217, e20191920. [Google Scholar] [CrossRef]
  14. Rosell, S.; Belfrage, E. Blood circulation in adipose tissue. Physiol. Rev. 1979, 59, 1078–1104. [Google Scholar] [CrossRef] [PubMed]
  15. Galic, S.; Oakhill, J.S.; Steinberg, G.R. Adipose tissue as an endocrine organ. Mol. Cell Endocrinol. 2010, 316, 129–139. [Google Scholar] [CrossRef] [PubMed]
  16. Beacon, T.H.; Davie, J.R. The chicken model organism for epigenomic research. Genome 2021, 64, 476–489. [Google Scholar] [CrossRef] [PubMed]
  17. Tian, Y.; Han, J.; Wen, J.; Wu, Y.; Zhang, R.; Xu, X.; Zhang, W.; Ma, X.; Jiang, Y.; Wang, X.; et al. Regional immunity of chicken adipose tissue responds to secondary immunity induced by Newcastle disease vaccine via promoting immune activation and weakening lipid metabolism. Poult. Sci. 2023, 102, 102646. [Google Scholar] [CrossRef]
  18. Arafat, N.; Eladl, A.H.; Marghani, B.H.; Saif, M.A.; El-Shafei, R.A. Enhanced infection of avian influenza virus H9N2 with infectious laryngeotracheitis vaccination in chickens. Vet. Microbiol. 2018, 219, 8–16. [Google Scholar] [CrossRef] [PubMed]
  19. Kaufmann, L.; Syedbasha, M.; Vogt, D.; Hollenstein, Y.; Hartmann, J.; Linnik, J.E.; Egli, A. An Optimized Hemagglutination Inhibition (HI) Assay to Quantify Influenza-specific Antibody Titers. J. Vis. Exp. 2017, 130, e55833. [Google Scholar] [CrossRef]
  20. Guénin, S.; Mauriat, M.; Pelloux, J.; Van Wuytswinkel, O.; Bellini, C.; Gutierrez, L. Normalization of qRT-PCR data: The necessity of adopting a systematic, experimental conditions-specific, validation of references. J. Exp. Bot. 2009, 60, 487–493. [Google Scholar] [CrossRef]
  21. Liu, M.X.; Gao, M.; Li, C.Z.; Yu, C.Z.; Yan, H.; Peng, C.; Li, Y.; Li, C.G.; Ma, Z.L.; Zhao, Y.; et al. Dicer1/miR-29/HMGCR axis contributes to hepatic free cholesterol accumulation in mouse non-alcoholic steatohepatitis. Acta Pharmacol. Sin. 2017, 38, 660–671. [Google Scholar] [CrossRef] [PubMed]
  22. Kato, M.; Kurozumi, A.; Goto, Y.; Matsushita, R.; Okato, A.; Nishikawa, R.; Fukumoto, I.; Koshizuka, K.; Ichikawa, T.; Seki, N. Regulation of metastasis-promoting LOXL2 gene expression by antitumor microRNAs in prostate cancer. J. Hum. Genet. 2017, 62, 123–132. [Google Scholar] [CrossRef]
  23. Diehl, R.; Ferrara, F.; Müller, C.; Dreyer, A.Y.; McLeod, D.D.; Fricke, S.; Boltze, J. Immunosuppression for in vivo research: State-of-the-art protocols and experimental approaches. Cell. Mol. Immunol. 2017, 14, 146–179. [Google Scholar] [CrossRef] [PubMed]
  24. Jeklova, E.; Leva, L.; Jaglic, Z.; Faldyna, M. Dexamethasone-induced immunosuppression: A rabbit model. Vet. Immunol. Immunopathol. 2008, 122, 231–240. [Google Scholar] [CrossRef]
  25. Giles, A.J.; Hutchinson, M.N.D.; Sonnemann, H.M.; Jung, J.; Fecci, P.E.; Ratnam, N.M.; Zhang, W.; Song, H.; Bailey, R.; Davis, D.; et al. Dexamethasone-induced immunosuppression: Mechanisms and implications for immunotherapy. J. Immunother. Cancer 2018, 6, 51. [Google Scholar] [CrossRef] [PubMed]
  26. Cerk, I.K.; Wechselberger, L.; Oberer, M. Adipose Triglyceride Lipase Regulation: An Overview. Curr. Protein Pept. Sci. 2018, 19, 221–233. [Google Scholar] [CrossRef] [PubMed]
  27. Rafiei, H.; Omidian, K.; Bandy, B. Dietary Polyphenols Protect Against Oleic Acid-Induced Steatosis in an in Vitro Model of NAFLD by Modulating Lipid Metabolism and Improving Mitochondrial Function. Nutrients 2019, 11, 541. [Google Scholar] [CrossRef]
  28. Wang, Y.Z.; Yang, L.; Li, C.F. Protective effect of atorvastatin meditated by HMGCR gene on diabetic rats with atherosclerosis: An in vivo and in vitro study. Biomed. Pharmacother. 2018, 104, 240–251. [Google Scholar] [CrossRef]
  29. Lu, X.Y.; Shi, X.J.; Hu, A.; Wang, J.Q.; Ding, Y.; Jiang, W.; Sun, M.; Zhao, X.; Luo, J.; Qi, W.; et al. Feeding induces cholesterol biosynthesis via the mTORC1-USP20-HMGCR axis. Nature 2020, 588, 479–484. [Google Scholar] [CrossRef]
  30. Li, X.; Hu, W.; Li, L.; Chen, Z.; Jiang, T.; Zhang, D.; Liu, K.; Wang, H. MiR-133a-3p/Sirt1 epigenetic programming mediates hypercholesterolemia susceptibility in female offspring induced by prenatal dexamethasone exposure. Biochem. Pharmacol. 2022, 206, 115306. [Google Scholar] [CrossRef]
  31. Ormsby, T.J.R.; Owens, S.E.; Turner, M.L.; Cronin, J.G.; Bromfield, J.J.; Sheldon, I.M. Glucocorticoids increase tissue cell protection against pore-forming toxins from pathogenic bacteria. Commun. Biol. 2023, 6, 186. [Google Scholar] [CrossRef]
  32. Mustafa, S.S. Steroid-induced secondary immune deficiency. Ann. Allergy Asthma Immunol. 2023, 130, 713–717. [Google Scholar] [CrossRef]
  33. Xu, C.; He, J.; Jiang, H.; Zu, L.; Zhai, W.; Pu, S.; Xu, G. Direct effect of glucocorticoids on lipolysis in adipocytes. Mol. Endocrinol. 2009, 23, 1161–1170. [Google Scholar] [CrossRef]
  34. Kallscheuer, N.; Polen, T.; Bott, M.; Marienhagen, J. Reversal of β-oxidative pathways for the microbial production of chemicals and polymer building blocks. Metab. Eng. 2017, 42, 33–42. [Google Scholar] [CrossRef] [PubMed]
  35. Simons, K.; Ikonen, E. Functional rafts in cell membranes. Nature 1997, 387, 569–572. [Google Scholar] [CrossRef] [PubMed]
  36. Kidani, Y.; Elsaesser, H.; Hock, M.B.; Vergnes, L.; Williams, K.J.; Argus, J.P.; Marbois, B.N.; Komisopoulou, E.; Wilson, E.B.; Osborne, T.F.; et al. Sterol regulatory element-binding proteins are essential for the metabolic programming of effector T cells and adaptive immunity. Nat. Immunol. 2013, 14, 489–499. [Google Scholar] [CrossRef] [PubMed]
  37. Chen, Y.; Zhu, Y.; Li, X.; Gao, W.; Zhen, Z.; Dong, D.; Huang, B.; Ma, Z.; Zhang, A.; Song, X.; et al. Cholesterol inhibits TCR signaling by directly restricting TCR-CD3 core tunnel motility. Mol. Cell 2022, 82, 1278–1287.e5. [Google Scholar] [CrossRef]
  38. Bensinger, S.J.; Bradley, M.N.; Joseph, S.B.; Zelcer, N.; Janssen, E.M.; Hausner, M.A.; Shih, R.; Parks, J.S.; Edwards, P.A.; Jamieson, B.D.; et al. LXR signaling couples sterol metabolism to proliferation in the acquired immune response. Cell 2008, 134, 97–111. [Google Scholar] [CrossRef]
  39. Aguilar-Ballester, M.; Herrero-Cervera, A.; Vinué, Á.; Martínez-Hervás, S.; González-Navarro, H. Impact of Cholesterol Metabolism in Immune Cell Function and Atherosclerosis. Nutrients 2020, 12, 2021. [Google Scholar] [CrossRef] [PubMed]
  40. Huang, B.; Song, B.L.; Xu, C. Cholesterol metabolism in cancer: Mechanisms and therapeutic opportunities. Nat. Metab. 2020, 2, 132–141. [Google Scholar] [CrossRef]
  41. Dai, J.; Wang, H.; Liao, Y.; Tan, L.; Sun, Y.; Song, C.; Liu, W.; Ding, C.; Luo, T.; Qiu, X. Non-Targeted Metabolomic Analysis of Chicken Kidneys in Response to Coronavirus IBV Infection Under Stress Induced by Dexamethasone. Front. Cell Infect. Microbiol. 2022, 12, 945865. [Google Scholar] [CrossRef]
  42. Haemmerle, G.; Lass, A.; Zimmermann, R.; Gorkiewicz, G.; Meyer, C.; Rozman, J.; Heldmaier, G.; Maier, R.; Theussl, C.; Eder, S.; et al. Defective lipolysis and altered energy metabolism in mice lacking adipose triglyceride lipase. Science 2006, 312, 734–737. [Google Scholar] [CrossRef]
  43. Zimmermann, R.; Strauss, J.G.; Haemmerle, G.; Schoiswohl, G.; Birner-Gruenberger, R.; Riederer, M.; Lass, A.; Neuberger, G.; Eisenhaber, F.; Hermetter, A.; et al. Fat mobilization in adipose tissue is promoted by adipose triglyceride lipase. Science 2004, 306, 1383–1386. [Google Scholar] [CrossRef]
  44. Schulz, H. Beta oxidation of fatty acids. Biochim. Biophys. Acta 1991, 1081, 109–120. [Google Scholar] [CrossRef] [PubMed]
  45. Cerqueira, N.M.; Oliveira, E.F.; Gesto, D.S.; Santos-Martins, D.; Moreira, C.; Moorthy, H.N.; Ramos, M.J.; Fernandes, P.A. Cholesterol Biosynthesis: A Mechanistic Overview. Biochemistry 2016, 55, 5483–5506. [Google Scholar] [CrossRef]
  46. Zhang, Q.; Lou, Y.; Bai, X.L.; Liang, T.B. Immunometabolism: A novel perspective of liver cancer microenvironment and its influence on tumor progression. World J. Gastroenterol. 2018, 24, 3500–3512. [Google Scholar] [CrossRef] [PubMed]
  47. Lecoutre, S.; Lambert, M.; Drygalski, K.; Dugail, I.; Maqdasy, S.; Hautefeuille, M.; Clément, K. Importance of the Microenvironment and Mechanosensing in Adipose Tissue Biology. Cells 2022, 11, 2310. [Google Scholar] [CrossRef] [PubMed]
  48. Iwamoto, H.; Abe, M.; Yang, Y.; Cui, D.; Seki, T.; Nakamura, M.; Hosaka, K.; Lim, S.; Wu, J.; He, X.; et al. Cancer Lipid Metabolism Confers Antiangiogenic Drug Resistance. Cell Metab. 2018, 28, 104–117.e105. [Google Scholar] [CrossRef]
  49. Xu, S.; Chaudhary, O.; Rodríguez-Morales, P.; Sun, X.; Chen, D.; Zappasodi, R.; Xu, Z.; Pinto, A.F.M.; Williams, A.; Schulze, I.; et al. Uptake of oxidized lipids by the scavenger receptor CD36 promotes lipid peroxidation and dysfunction in CD8(+) T cells in tumors. Immunity 2021, 54, 1561–1577.e1567. [Google Scholar] [CrossRef]
  50. Yang, Z.; Huo, Y.; Zhou, S.; Guo, J.; Ma, X.; Li, T.; Fan, C.; Wang, L. Cancer cell-intrinsic XBP1 drives immunosuppressive reprogramming of intratumoral myeloid cells by promoting cholesterol production. Cell Metab. 2022, 34, 2018–2035.e2018. [Google Scholar] [CrossRef]
  51. Reboldi, A.; Dang, E. Cholesterol metabolism in innate and adaptive response. F1000Research 2018, 7, 1647. [Google Scholar] [CrossRef] [PubMed]
  52. Misumi, I.; Starmer, J.; Uchimura, T.; Beck, M.A.; Magnuson, T.; Whitmire, J.K. Obesity Expands a Distinct Population of T Cells in Adipose Tissue and Increases Vulnerability to Infection. Cell Rep. 2019, 27, 514–524.e515. [Google Scholar] [CrossRef] [PubMed]
  53. Markegard, E.; Trager, E.; Yang, C.W.; Zhang, W.; Weiss, A.; Roose, J.P. Basal LAT-diacylglycerol-RasGRP1 signals in T cells maintain TCRα gene expression. PLoS ONE 2011, 6, e25540. [Google Scholar] [CrossRef] [PubMed]
  54. Girardi, M. Immunosurveillance and immunoregulation by gammadelta T cells. J. Investig. Dermatol. 2006, 126, 25–31. [Google Scholar] [CrossRef] [PubMed]
  55. He, M.; Roussak, K.; Ma, F.; Borcherding, N.; Garin, V.; White, M.; Schutt, C.; Jensen, T.I.; Zhao, Y.; Iberg, C.A.; et al. CD5 expression by dendritic cells directs T cell immunity and sustains immunotherapy responses. Science 2023, 379, eabg2752. [Google Scholar] [CrossRef]
  56. Pokhrel, R.H.; Acharya, S.; Ahn, J.H.; Gu, Y.; Pandit, M.; Kim, J.O.; Park, Y.Y.; Kang, B.; Ko, H.J.; Chang, J.H. AMPK promotes antitumor immunity by downregulating PD-1 in regulatory T cells via the HMGCR/p38 signaling pathway. Mol. Cancer 2021, 20, 133. [Google Scholar] [CrossRef]
  57. Agbo, J.; Akinyemi, A.R.; Li, D.; Zhang, Q.; Li, X.; Li, W.; Zhang, J.; Liu, Q. RNA-binding protein hnRNPR reduces neuronal cholesterol levels by binding to and suppressing HMGCR. J. Integr. Neurosci. 2021, 20, 265–276. [Google Scholar] [CrossRef]
Figure 1. Identifications of immune response and Dex-induced immunosuppressed chicken models. (A) NDV antibody levels in different treatment groups; (B) body weight coefficients of the ND group and Dex + ND group; (CE) organ coefficients of spleen, bursa and thymus of ND group and Dex + ND group, respectively. The horizontal coordinate dpi1 represented the days post-primary immunization, and dpi2 represented the days post-secondary immunization. * represented a significant difference between the ND group and Dex + ND group at the same time point (p < 0.05), ** represented a highly significant difference between the ND group and Dex + ND group at the same time point (p < 0.01).
Animals 14 00225 g001
Figure 2. Relative expression activities of adipose tissue ATGL, CPT1A and HMGCR genes in Dex group. (A) The expression activity of the ATGL gene in the Dex group; (B) The expression activity of the CPT1A gene in the Dex group; (C) The expression activity of the HMGCR gene in the Dex group. The horizontal coordinate dpi1 represented the days post-primary immunization, and dpi2 represented the days post-secondary immunization. The horizontal dashed line corresponded to the relative expression activity of 1. Different letters above the bars indicated significant differences between different time points (p < 0.05), and the same letters indicated non-significant differences (p > 0.05).
Animals 14 00225 g002
Figure 3. Relative expression activities of adipose tissue ATGL, CPT1A and HMGCR genes in the ND group and Dex + ND group. (A) Expression activity of ATGL gene in the ND group and Dex + ND group; (B) Expression activity of the CPT1A gene in the ND group and Dex + ND group; (C) Expression activity of the HMGCR gene in the ND group and Dex + ND group. The horizontal dashed line corresponded to a relative expression activity of 1. The horizontal coordinate dpi1 represented the days post the primary immunization, and dpi2 represented the days post the primary immunization. Different letters on the bars in the same group indicated significant differences among different time points (p < 0.05). * represented a significant difference between the ND group and Dex + ND group at the same time point (p < 0.05), ** represented a highly significant difference between the ND group and Dex + ND group at the same time point (p < 0.01).
Animals 14 00225 g003
Figure 4. Relative expression activity of adipose tissue TCRα gene in ND group and Dex + ND group. The horizontal dashed line corresponded to a relative expression activity of 1. The horizontal coordinate dpi1 represented the days post the primary immunization, and dpi2 represented the days post the secondary immunization. Different letters on the bars in the same group indicated significant differences between different time points (p < 0.05). * represented a significant difference between the ND group and Dex + ND group at the same time point (p < 0.05), ** represented a highly significant difference between the ND group and Dex + ND group at the same time point (p < 0.01).
Animals 14 00225 g004
Figure 5. Relative expression activity of adipose tissue miR-29a/c-3p in ND group and Dex + ND group. The horizontal dashed line corresponded to a relative expression activity of 1. The horizontal coordinate dpi1 represented the days post the primary immunization, and dpi2 represented the days post the secondary immunization. Different letters on the bars in the same group indicated significant differences between the same time points (p < 0.05). ** represented a highly significant difference between the ND group and Dex + ND group at the same time point (p < 0.01).
Animals 14 00225 g005
Figure 6. Game relationships between miR-29a/c-3p and HMGCR gene in adipose tissue. (A) Game relationships between miR-29a/c-3p and HMGCR gene in ND group. (B) Game relationships between miR-29a/c-3p and HMGCR gene in Dex + ND group. The horizontal dashed line corresponded to a relative expression activity of 1. The horizontal coordinate dpi1 represented the days post the primary immunization, and dpi2 represented the days post the secondary immunization. Circles indicated time points with game relationships between miR-29a/c-3p and the HMGCR gene.
Animals 14 00225 g006
Figure 7. Expression levels of circulating miR-29a/c-3p in ND group and Dex + ND group. The horizontal dashed line corresponded to a relative expression activity of 1. The horizontal coordinate dpi1 represented the day after the primary immunization, and dpi2 represented the day after the secondary immunization. Different letters on the bars in the same treatment group indicated significant differences among different time points (p < 0.05). * represented significant differences between the ND group and Dex + ND group at the same time point (p < 0.05), and ** represented highly significant differences between the ND group and Dex + ND group at the same time point (p < 0.01).
Animals 14 00225 g007
Table 1. Primers used in this study.
Primer NameSequence (5’–3’)
β-actin forwardTATGTGCAAGGCCGGTTTC
β-actin reverseTTCAGGGTCAGGATACCTCTTT
ATGL forwardCTGATACCTCCAACTTTGCGTG
ATGL reverseGTAGAGGTTGCGAAGGTTGAAT
CPT1A forwardAGTCCGGCCACTTATGAATGAT
CPT1A reverseATTATTGGTCCACGCCCTC
TCRá forwardTTTGGAAATGTGCCTTATCACGG
TCRá reverseTCATGTTTGTTCTCGGATGTTGC
HMGCR forwardCTCAGGAGCGAGGAGTGTCTAT
HMGCR reverseGTATAGTGGTCCTGCTACGCCT
miR-29a/c-3p RTCTCAACTGGTGTCGTGGAGTCGGCAATTCAGTTGAGAACCGATT
U6 RTAACGCTTCACGAATTTGCGT
miR-29a/c-3p forwardACACTCCAGCTGGGTAGCACCATTTGAAA
miR-29a/c-3p reverseTGGTGTCGTGGAGTCG
U6 forwardCTCGCTTCGGCAGCACA
U6 reverseAACGCTTCACGAATTTGCGT
Disclaimer/Publisher’s Note: The statements, opinions and data contained in all publications are solely those of the individual author(s) and contributor(s) and not of MDPI and/or the editor(s). MDPI and/or the editor(s) disclaim responsibility for any injury to people or property resulting from any ideas, methods, instructions or products referred to in the content.

