Article

Multiple Tissues Transcriptome of Zig-Zag Eel (Mastacembelus armatus) with Different Growth Rates

School of Life Sciences, Guangzhou University, Guangzhou 510006, China
*
Authors to whom correspondence should be addressed.
Animals 2024, 14(2), 248; https://doi.org/10.3390/ani14020248
Submission received: 29 November 2023 / Revised: 6 January 2024 / Accepted: 10 January 2024 / Published: 12 January 2024
(This article belongs to the Section Animal Genetics and Genomics)

Abstract

:

Simple Summary

In this study, transcriptome sequencing was first performed on the brain, liver, and muscle tissues of 3-month-old M. armatus individuals with different growth rates. A number of growth-related genes and biological pathways that related to skeletal muscle tissue development and insulin-like growth factor binding were screened. Our results suggest that IGFBP-1A, IGFBP-1B, GH, and GHR play an important role in the early developmental stage of M. armatus. These results contribute to providing a reference for further studies on the molecular mechanism of growth and development in teleost fish.

Abstract

In order to explore the main regulatory genes and related pathways of growth traits, transcriptome sequencing was first performed on the brain, liver, and muscle tissues of 3-month-old M. armatus with different growth rates. By comparative transcriptome analysis of fast-growing and slow-growing groups of M. armatus, a total of 2887 DEGs were screened, of which 59 up-regulated genes and 105 down-regulated genes were detected in the brain, 146 up-regulated genes and 202 down-regulated genes were detected in the liver, and 529 up-regulated genes and 1846 down-regulated genes were detected in muscle, including insulin-like growth factor binding protein 1a (IGFBP1A), insulin-like growth factor binding protein 1b (IGFBP1B), myosin, light chain 1 (MYL1), and myoglobin (MB). Through Gene Ontology (GO) and the Kyoto Encyclopedia of Genes and Genomes (KEGG) enrichment analysis, we identified a total of 288 significantly enriched GO entries and 68 significantly enriched KEGG pathways related to growth, such as skeletal muscle tissue development, insulin-like growth factor binding, and the mitotic cell cycle. These key genes and signaling pathways may play a key role in regulating the growth of M. armatus. Digging into the regulatory mechanisms of these key genes will provide a theoretical basis for further exploration of the molecular mechanisms related to the growth and development of M. armatus, and help to breed new varieties of M. armatus with rapid growth.

1. Introduction

Fish growth refers to the physiological process in which the nutrients in the food are digested and absorbed into their own substances and continuously accumulated in the individual, which is mainly affected by factors such as genes, the environment, and nutrition. In the same fish population, some individuals grow faster than others. Studies have shown that some individuals in the same Atlantic sturgeon (Acipenser oxyrinchus) population have great differences in growth performance, especially in body length and weight [1]. In the same growing environment, the growth rate of different individuals in the same fish population [2] or different groups in the same fish population [3] will have obvious differences, which is the result of the genetic performance of individual fish and their long-term adaptation to the growing environment. In the same fish population, the growth rate is mainly regulated by the expression of related genes, the endocrine system, and other factors [4]. The growth rate of the same kind of fish is mainly regulated by external factors such as nutrition, breeding density, and temperature [5]. In the artificial farming process, the faster the growth rate of fish, the shorter the time required to reach the market specifications, which can greatly reduce the cost of time, labor, and so on, and further improve the economic benefits of artificial fish farming. Therefore, growth traits are often regarded as one of the most important economic traits to measure fish in artificial culture. With the continuous development of the aquaculture industry, people pay more and more attention to growth traits of fish, and related studies on growth traits are increasing.
Transcriptome RNA sequencing (RNA-Seq) technology is mainly used to study gene function or gene structure at the transcriptional level, reveal the biological process of gene expression in a specific growth stage or under a specific growth environment, and analyze the differentially expressed genes (DEGs) of individuals. The development of transcriptome sequencing technology has laid a technical foundation for studying the differential expression of genes in specific tissues and cells in a certain growth environment or growth stage [6]. At present, transcriptome analysis has been widely applied to the growth regulation of species. Sun et al. [3] revealed the relevant mechanisms of fish growth regulation by comparing the transcriptome between the offspring and parents of hybrid grouper, providing a reference for a deeper understanding of the molecular mechanism and regulatory pathway of the growth advantage of hybrid offspring. Similar studies have also been applied to several fish such as black porgy (Acanthopagrus schlegelii) [2], black carp (Mylopharyngodon piceus) [7], and bighead carp (Hypophthalmichthys nobilis) [8]. In order to reveal the main regulatory genes and pathways associated with the growth traits of black porgy, Lin et al. [2] conducted transcriptome sequencing analysis on the mixed samples of the brain, liver, and muscle tissue of 4-month-old black porgy with different growth rates, and concluded that the genes myosin heavy chain 4 (MYH4), insulin-like growth factor 1 (IGF-1), insulin-like growth factor 2 (IGF-2), myosin light chain 3-like (Myl3), myosin 6-like (MYH6), and myoglobin (MB) may have a negative impact on the growth of black porgy. At the same time, the important roles of the PPAR signaling pathway and GH-GHR-IGFs neuroendocrine pathway in the regulation of growth and development of black porgy were also revealed. Zhang et al. [7] conducted transcriptome analysis on muscle and liver tissues of the same batch of black carp with different growth rates, and found that epidermal growth factor (EGF) and vascular endothelial growth factor (VEGF) were significantly up-regulated in muscle, suggesting that these genes might be related to the growth rate of black carp. Fu et al. [8] used the RNA-Seq technology to further explore the regulatory role of the hypothalamus–pituitary–liver axis in the growth of bighead carp. They successfully identified three DEGs that were within the growth-related QTL related to the function of growth traits, and 164 lncRNAs specifically expressed in the liver and 749 lncRNAs specifically expressed in the hypothalamic–pituitary gland, which provided a large amount of basic data for revealing the genes associated with fish growth and their molecular mechanisms.
Zig-zag eel (M. armatus) belongs to the order Symbranchiformes, family Mastacembelidae, and genus Mastacembelus. The meat of M. armatus is tender and delicious with high protein content and unsaturated fatty acids, which makes it have very high research and development prospects [9]. However, up to now, there are few reports on the growth of M. armatus. Only Zhong et al. [10,11] cloned and expressed the growth hormone gene and myostatin (MSTN) gene of M. armatus. Thus, there is a serious lack of analytical studies on the growth and development of M. armatus. This study mainly focuses on M. armatus with different growth rates, and first analyzes the molecular genetic mechanism of growth and development in M. armatus with the help of RNA-Seq technology. The results will provide theoretical support for the genetic improvement of growth traits and molecular breeding of M. armatus.

2. Materials and Methods

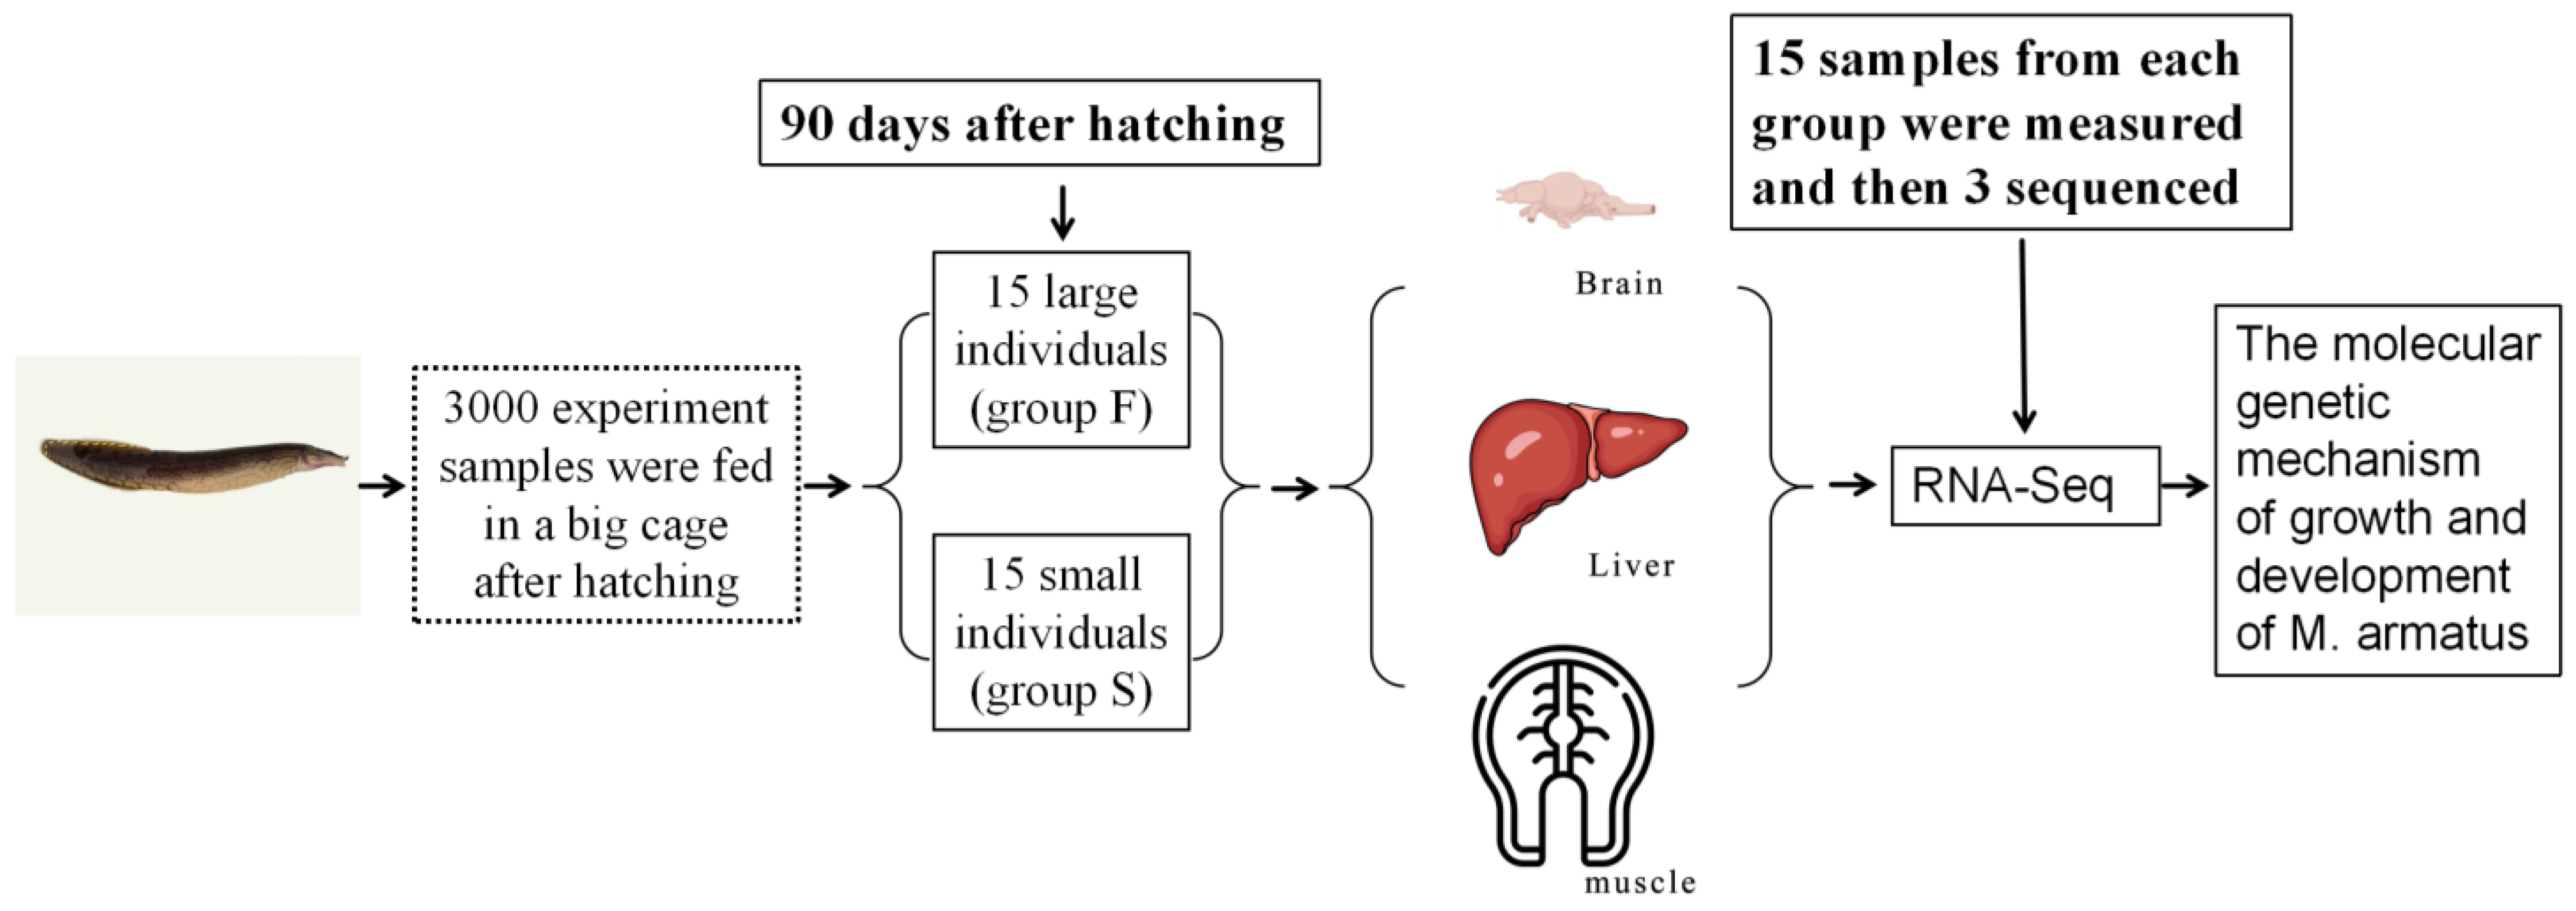
2.1. Fish Maintenance and Specification Measurement

The M. armatus used in this study were from the same batch. The breeding experiment (July–October 2022) was carried out in Guangdong Lianyi Aquatic Science and Technology Development Co., Ltd. in Kaiping, China. The same batch of M. armatus were fed twice a day (8:00, 16:00) in a cage with the length, width, and height of 5 m, 2 m, and 3 m, and the feeding amount was 3% of the body weight. The average water temperature during the breeding period was 30 °C, the highest water temperature was 33.5 °C, and the lowest water temperature was 28 °C. All other conditions were controlled within the suitable range for the breeding of M. armatus. A total of 15 large individuals (group F) and 15 small individuals (group S) were selected from the whole population of M. armatus at 90 days after hatching (dah). We also sampled and measured their body length and weight respectively, and 3 individuals with the largest body weight and 3 individuals with the smallest body weight were selected as the study objects for transcriptome analysis. After being anesthetized with MS-222, the brain, liver, and muscle tissues were collected, frozen with liquid nitrogen, and stored in a −80 °C refrigerator for later use (Figure 1). All animal handling procedures and experimental protocols were approved by the Experimental Animal Ethics Committee of the Guangzhou University of China (No. URBBB220506).

2.2. RNA Extraction, Library Construction, and Transcriptome Sequencing RNA

Firstly, the total RNA of different tissue samples was extracted by Total RNA Extraction Reagent (Vazyme, Nanjing, China), and the extracted RNA was detected with a NanoDrop 2000 spectrophotometer (Thermo Fisher Scientific, Waltham, MA, America) and 1.5% TAE agarose gel electrophoresis. After the RNA samples were qualified, eukaryotic mRNA was enriched with magnetic beads with Oligo (dT). Subsequently, mRNA was broken into short fragments in fragmentation buffer. A cDNA strand was synthesized with six-base random hexamers based on an mRNA template. Then the buffer, dNTPS, DNA polymerase l, and RNase H were added to synthesize the double-stranded cDNA and the double-stranded cDNA was purified by AMPure XP beads. The purified double-stranded cDNA was first end-repaired, A-tailed, and connected to sequencing joints and then fragment size selection was carried out with AMPure XP beads. Finally, PCR was performed and the PCR products were purified by AMPure XP beads to obtain the final library. The libraries that passed the quality inspection were sequenced by the Illumina Hiseq 2500 high-throughput sequencing platform for PE150 sequencing.

2.3. Filtering of Clean Reads and Alignment Clean Reads

After obtaining the sequencing data of the sample, we used fastp (v.0.19.7, https://github.com/OpenGene/fastp) (accessed on 8 March 2023) [12] to further filter the original sequencing readings to remove low-quality data and ensure the confidence of the subsequent analysis results. Bowtie2 (v.2.33, https://github.com/BenLangmead/bowtie2) (accessed on 8 March 2023) [13] software was used to compare the sequencing data after quality control with the ribosome sequences in NCBI and Rfam, remove the matched sequences, and obtain the filtered data for subsequent analysis. Then HISAT2 (v.2.1.0, https://github.com/infphilo/hisat2) (accessed on 8 March 2023) [14] was used to compare the data after ribosome removal with the reference whole genome [15] to obtain the result file in BAM (Binary Alignment/Map) format. Finally, BAM file and GTF (Gene transfer format) annotation information were used to judge the quality of this sequencing.

2.4. DEGs and Enrichment Analysis

We used DESeq2 (v.1.28.1, https://www.bioconductor.org/packages/release/bioc/html/DESeq2.html) (accessed on 8 March 2023) [16] for gene differential expression analysis among samples, FPKM (Fragments Per Kilobase Per Million) was used to calculate gene expression levels, and DEGs were screened according to FDR (false discovery rate) ≤ 0.05 and /log2FC/ ≥ 1. After obtaining DEGs, the GO database was used to classify annotated genes and gene products in cell components, biological processes, and molecular functions, and reveal the functions of a specific group of genes with similar expression patterns. With DEGs as foreground genes and all expressed genes as background genes, clusterProfiler (v.3.4.4, http://www.bioconductor.org/packages/release/bioc/html/clusterprofiler.html) (accessed on 8 March 2023) [17,18] software was used for functional enrichment analysis of GO and KEGG. The next step was to transfer the analysis results to the cloud platform of Guangzhou Gidio Biotechnology Co., Ltd. in Guangzhou, China (https://www.omicshare.com/tools/) (accessed on 8 August 2023) in order to generate a circular chart.

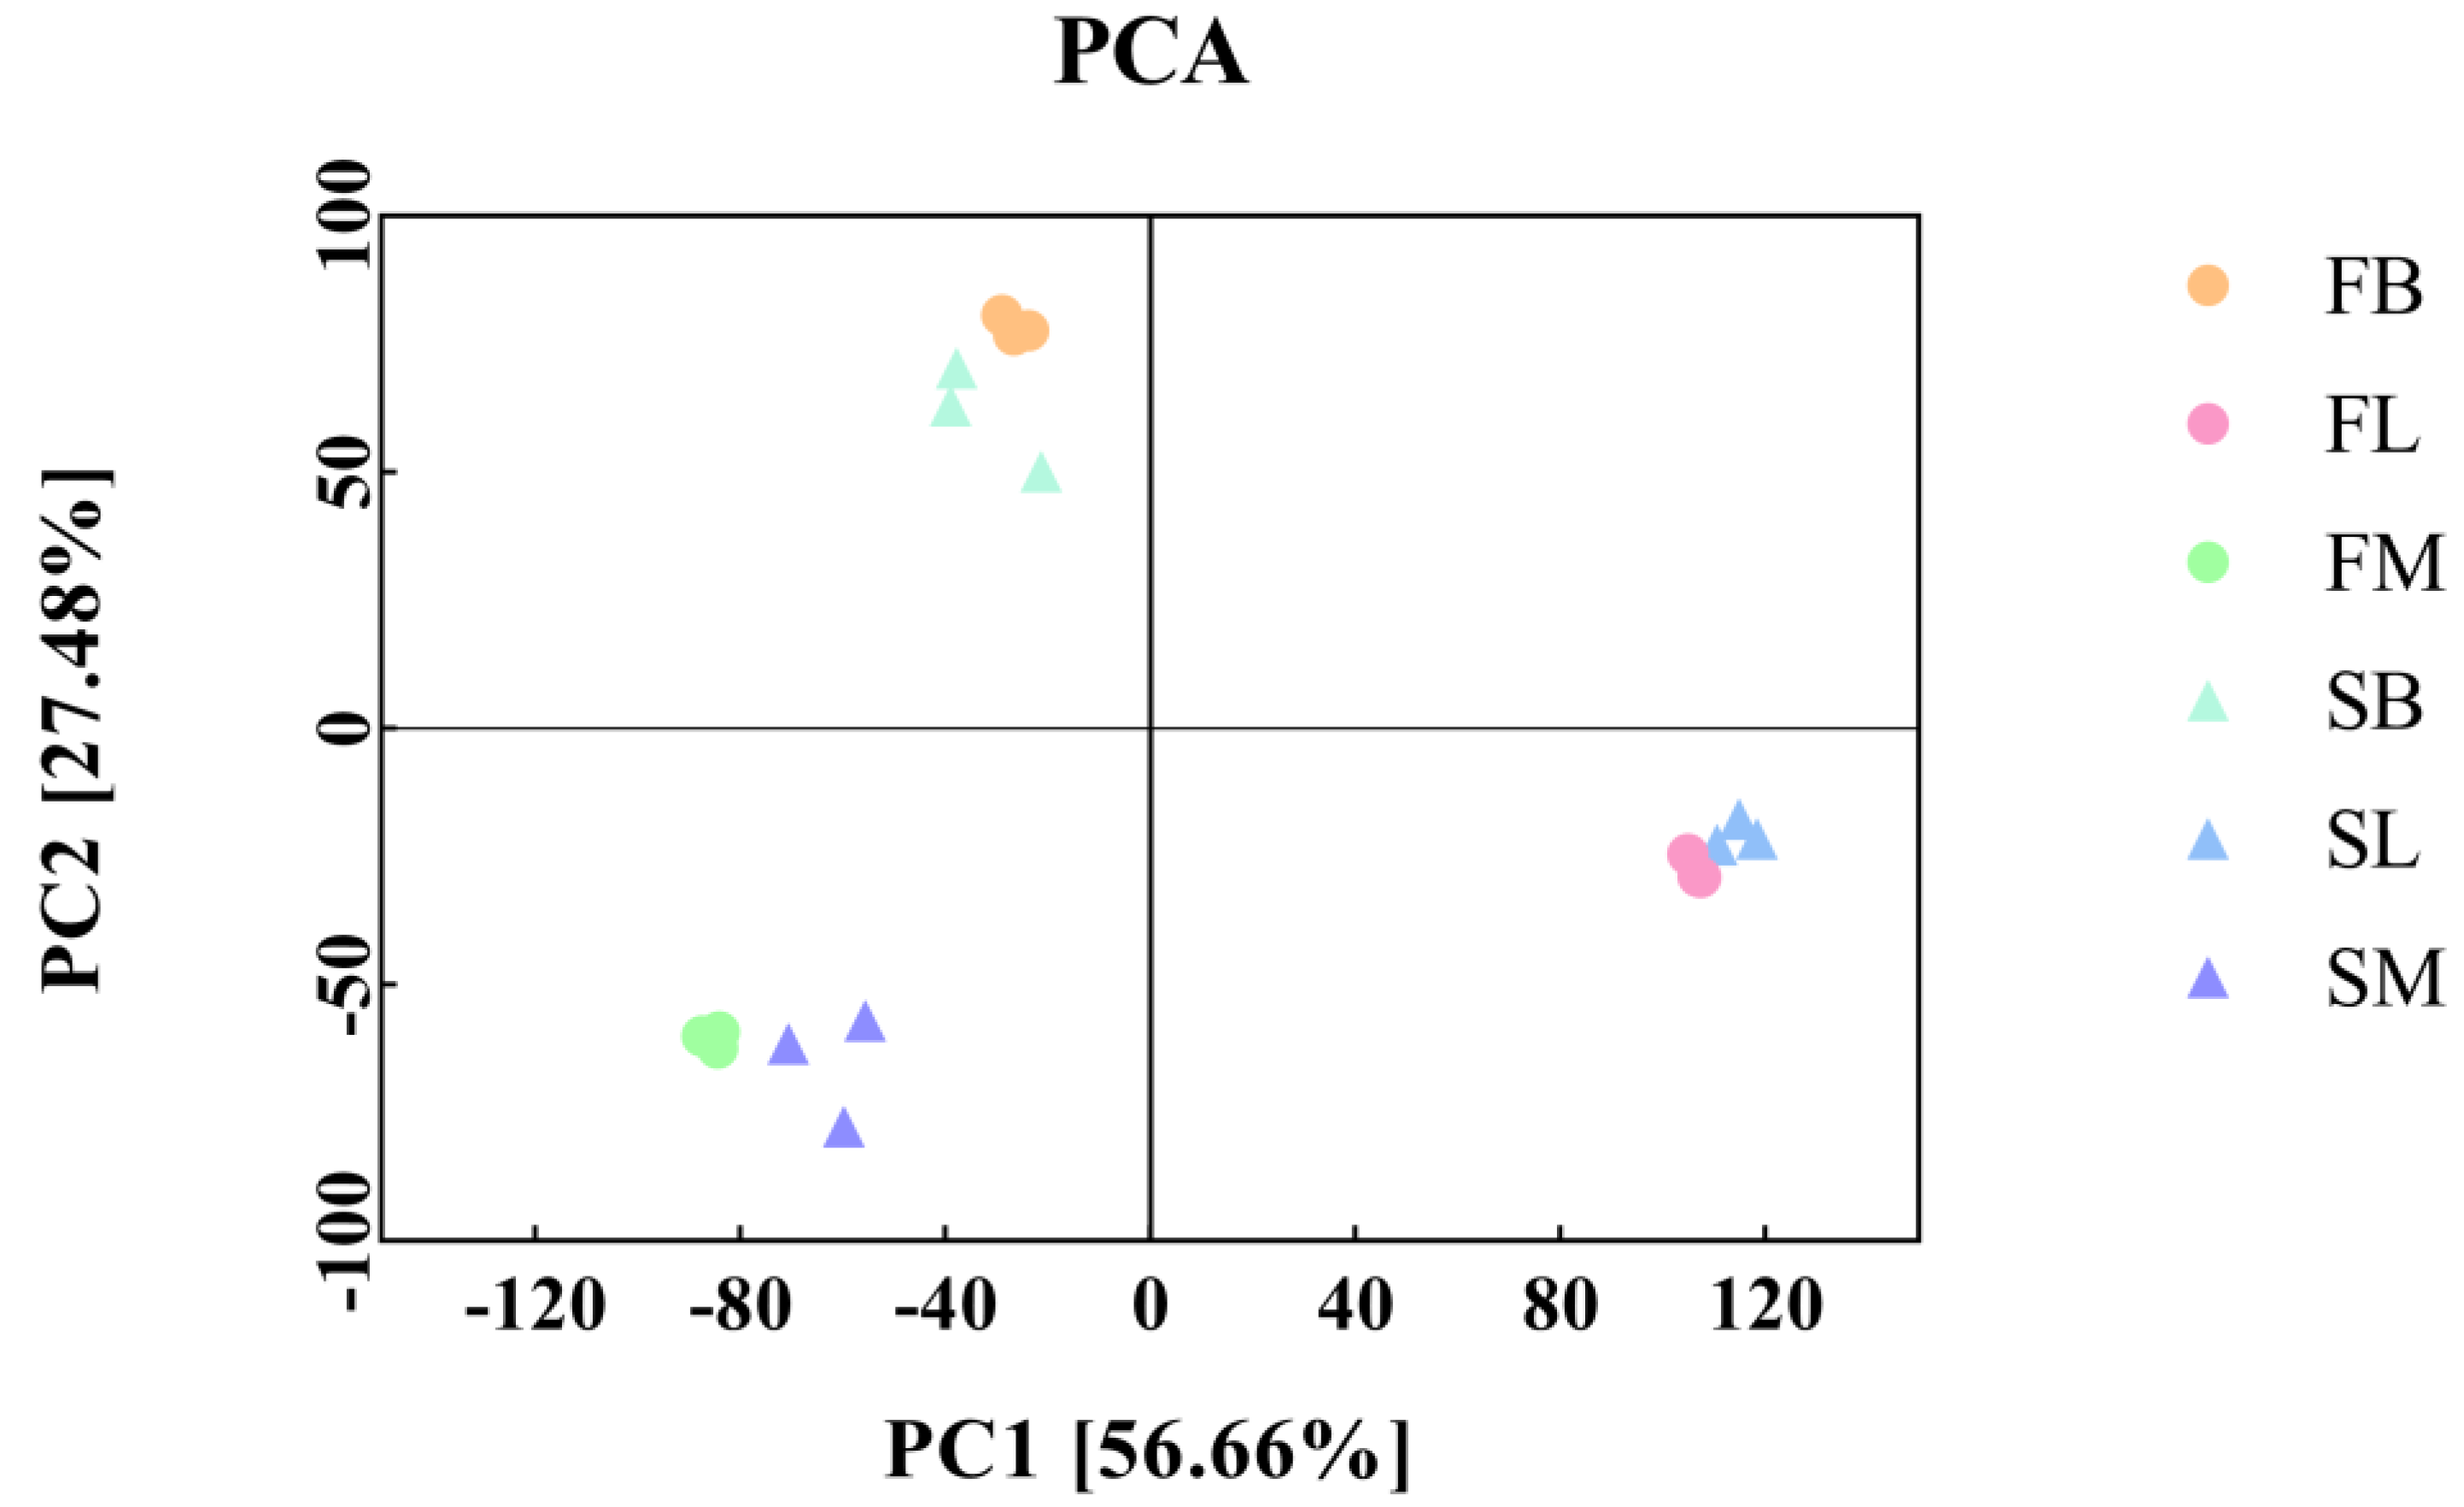
2.5. Principal Component Analysis

Principal component analysis (PCA) in RNA-Seq was mainly used to analyze the relationship between samples. On the premise of ensuring that the information contained in the original data is retained as much as possible, the expression levels of thousands of genes contained in different tissue samples were reduced to a number of principal components for comparative analysis between samples. It reveals the structural relationship hidden behind the original data [19]. According to the values of each sample in the first principal component (PC1) and the second principal component (PC2), a two-dimensional coordinate plot was made. If the gene expressions of the samples were more similar, the distance between the points reflected in the PCA map was less, indicating a stronger correlation between the samples.

2.6. Real-Time Quantitative Polymerase Chain Reaction (RT-qPCR) Validation

To validate the transcriptome data of this study, we randomly selected 16 DEGs and analyzed their expression levels by RT-qPCR (Table 1). The reverse transcription of cDNA was performed according to the instructions of HiScript II Q RT SuperMix for RT-qPCR (+gDNA wiper) (Vazyme, China). The reverse transcription process was as follows: removal of genomic DNA at 42 °C for 2 min; 55 °C for 15 min; 85 °C for 5 s.
RT-qPCR was performed on the Roche 480 real-time PCR system according to the ChamQ SYBR qPCR Master Mix (Vazyme, China) kit instructions, using β-actin gene as the internal reference. The relative expression of selected genes was calculated by the 2−∆∆Ct [20] method.

2.7. Statistical Analysis

SPSS statistics 26.0 software (SPSS Inc., Chicago, IL, USA) was used for statistical analysis. All the data were analyzed with a t-test. The resulting data were visually analyzed using GraphPad Prism 9 (GraphPad Software, San Diego, CA, USA). Differences were considered statistically significant at p < 0.05.

3. Results

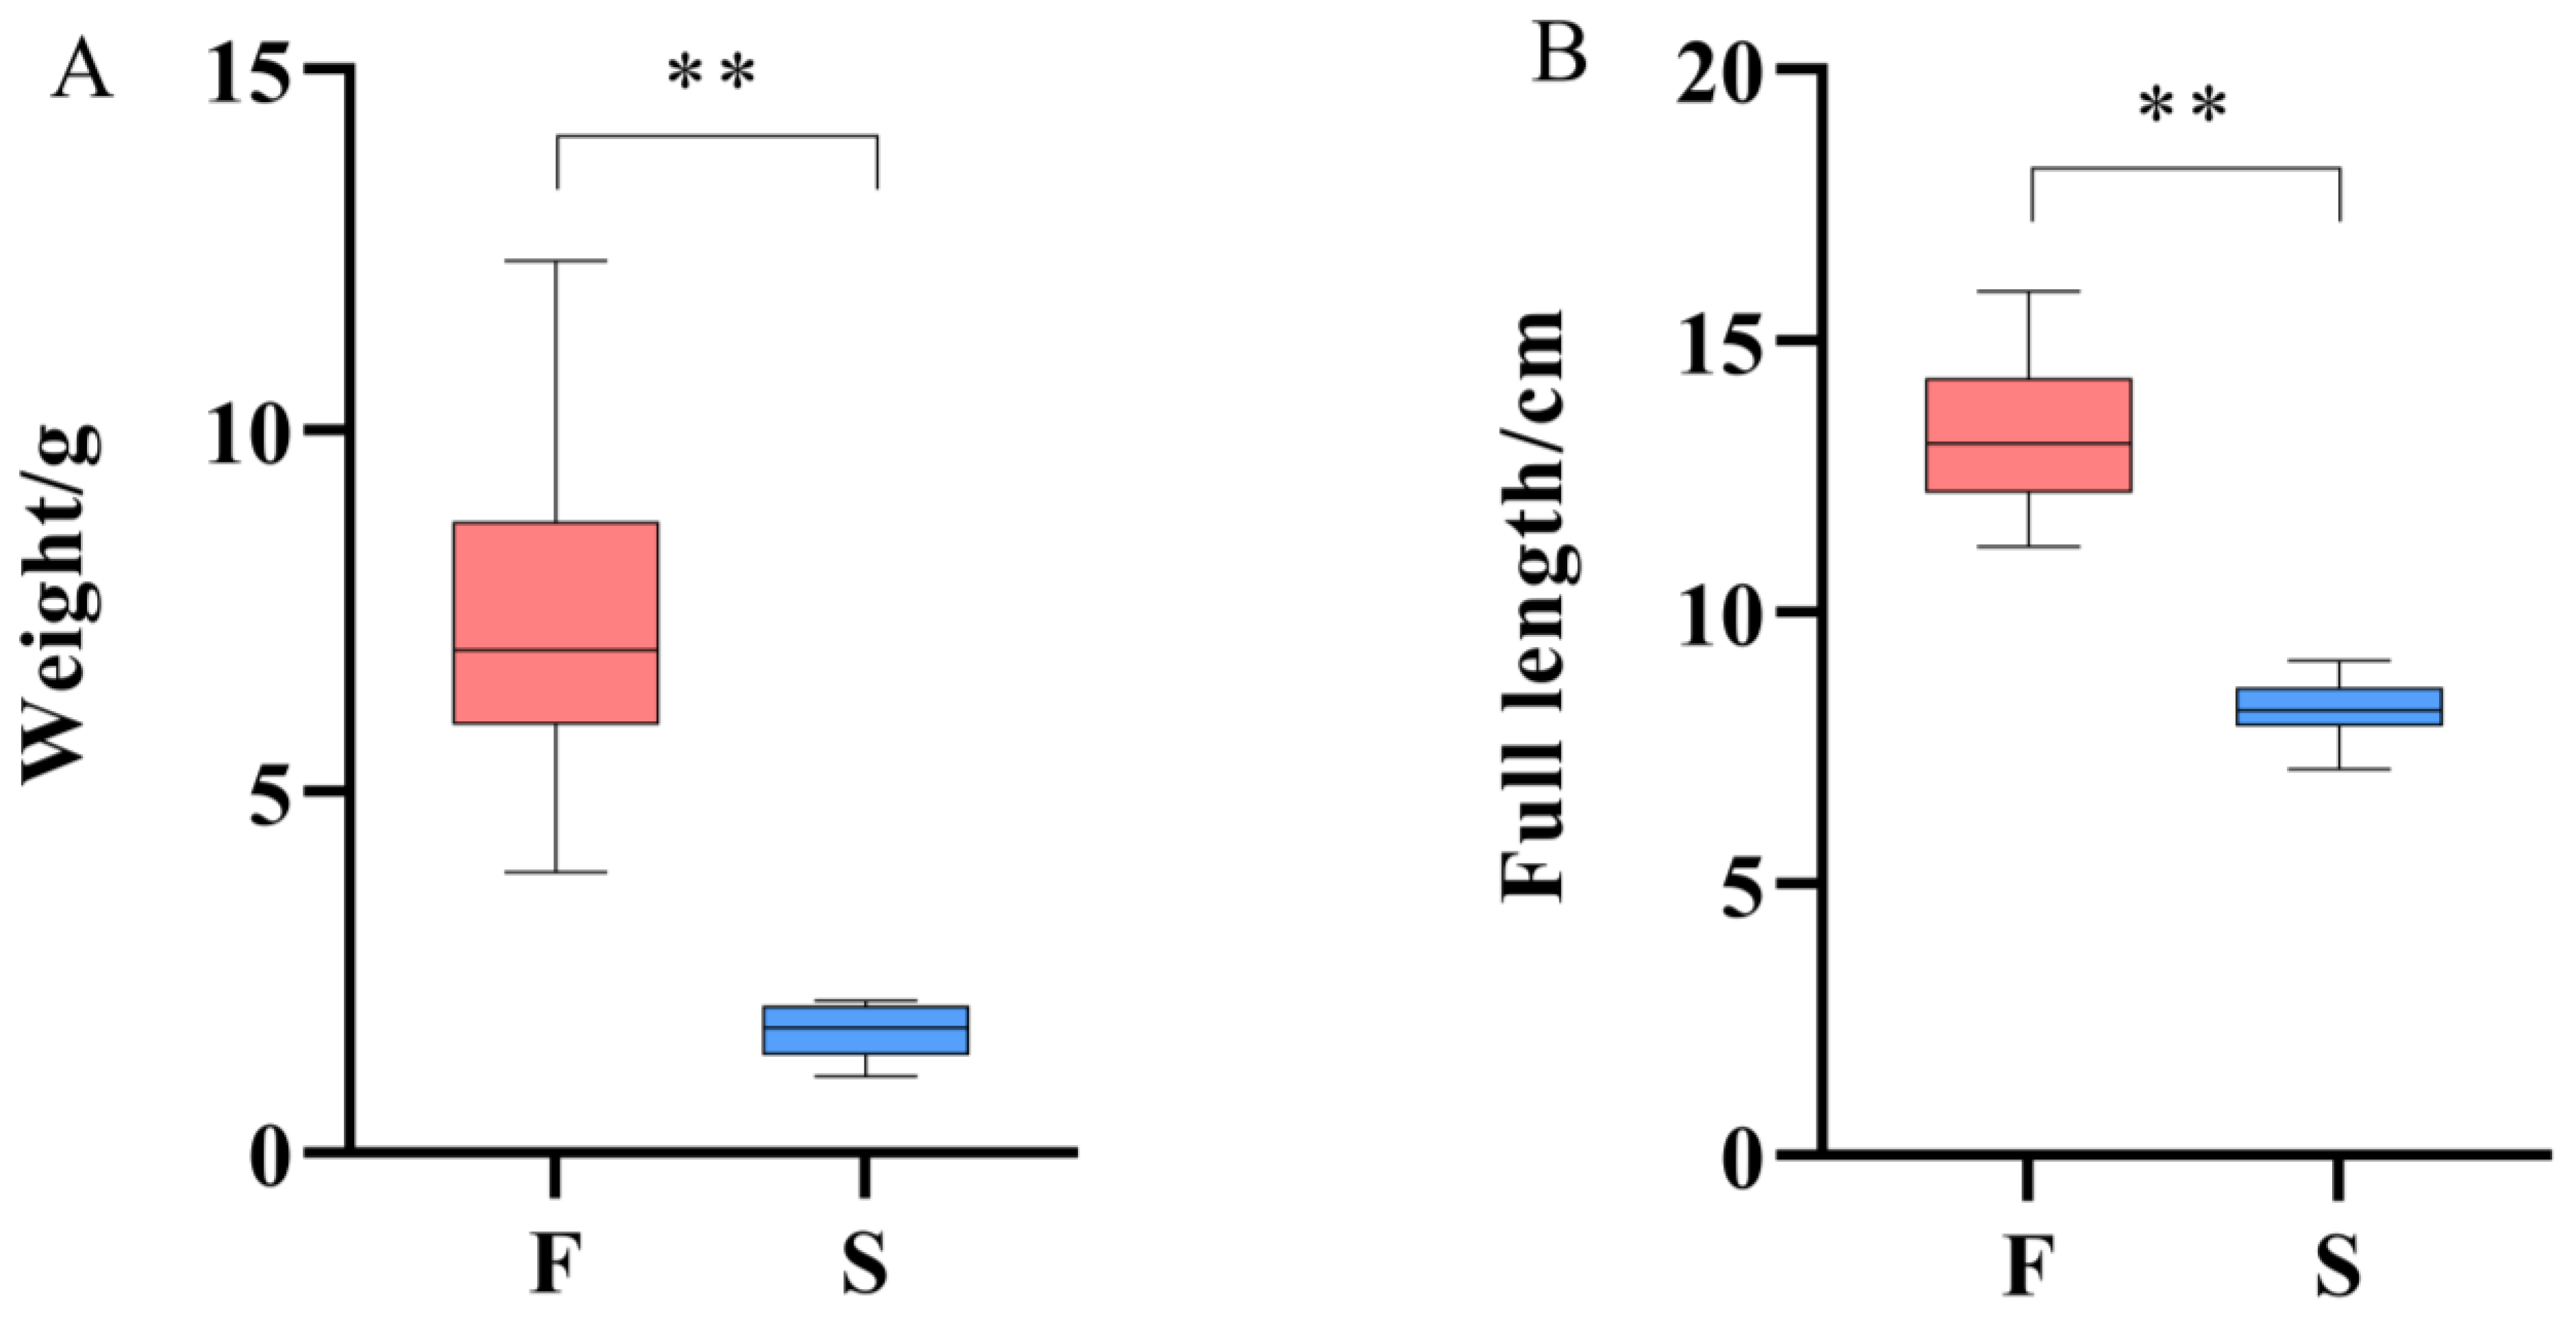
3.1. Analysis of Growth Data

A total of 15 large individuals (group F) and 15 small individuals (group S) were selected from the whole population of M. armatus at 90 dah. Furthermore, we sampled and measured their body length and weight, respectively. The results showed that there were significant differences in body length and body weight between group F and group S (Figure 2). The average body weight of group F was 7.47 g, the maximum body weight was 12.35 g, and the minimum body weight was 3.88 g. The average full length of group F was 13.36 cm, the maximum full length was 15.90 cm, and the minimum full length was 11.20 cm. The average body weight of group S was 1.69 g, the maximum body weight was 2.11 g, and the minimum body weight was 1.05 g. The average full length of group S was 8.25 cm, the maximum full length was 9.10 cm, and the minimum full length was 7.10 cm.

3.2. Transcriptome Sequencing Data, Quality Processing, and Principal Component Analysis

Before the bioinformatics analysis, to ensure the quality of the sequencing data, we first used fastp software (v.0.19.7) to perform quality control on the original sequencing data and remove low-quality reads. After filtering out low-quality reads, the average total number of bases produced in brain tissue (SB), liver tissue (SL), and muscle tissue (SM) of the slow-growing group was 7.96 G, 6.85 G, and 7.13 G, respectively. In the fast-growing group, the average base total produced by brain tissue (FB) was 5.57 G, liver tissue (FL) was 6.10 G, and muscle tissue (FM) was 6.12 G. The average values of Q20 and Q30 were 98.93% and 95.74%, respectively. The GC content was 46.38~50.94%. The rates of clean bases of all samples were in the range of 89.03% to 90.69% (Table 2).
A total of 801,512,980 clean reads were obtained, after removing reads mapped to the rRNA database. The mapping rate of eighteen samples was 74.22–87.08% when the clean reads were aligned with the genome of M. armatus (Table 3).
Based on the gene expression information among different samples, we conducted principal component analysis (PCA). The PC1 coordinate represented the first principal component, and the contribution rate of the first principal component to the sample difference was 64.12%. The PC2 coordinate represented the second principal component, which contributed 30.69% to sample differences (Figure 3). The overall distribution and sample composition of M. armatus with different growth rates were different, and the samples in the group had good repeatability, which met the experimental requirements.

3.3. Screening and Verification of DEGs

The transcriptome data of group F and group S were compared and analyzed. A total of 2887 significant DEGs (FDR ≤ 0.05, |log2FC| ≥ 1) were found in group F as controls, including 734 up-regulated genes and 2153 down-regulated genes (Figure 4). In order to further verify the accuracy of transcriptome data, six DEGs were randomly selected from transcriptional data of the brain, liver, and muscles, respectively, for RT-qPCR validation (Table 1). The results showed that the RT-qPCR identification results and regulatory trends (increase or decrease) of 16 randomly selected DEGs were basically consistent with the transcriptomic data (Figure 5), proving the reliability of transcriptomic sequencing results.

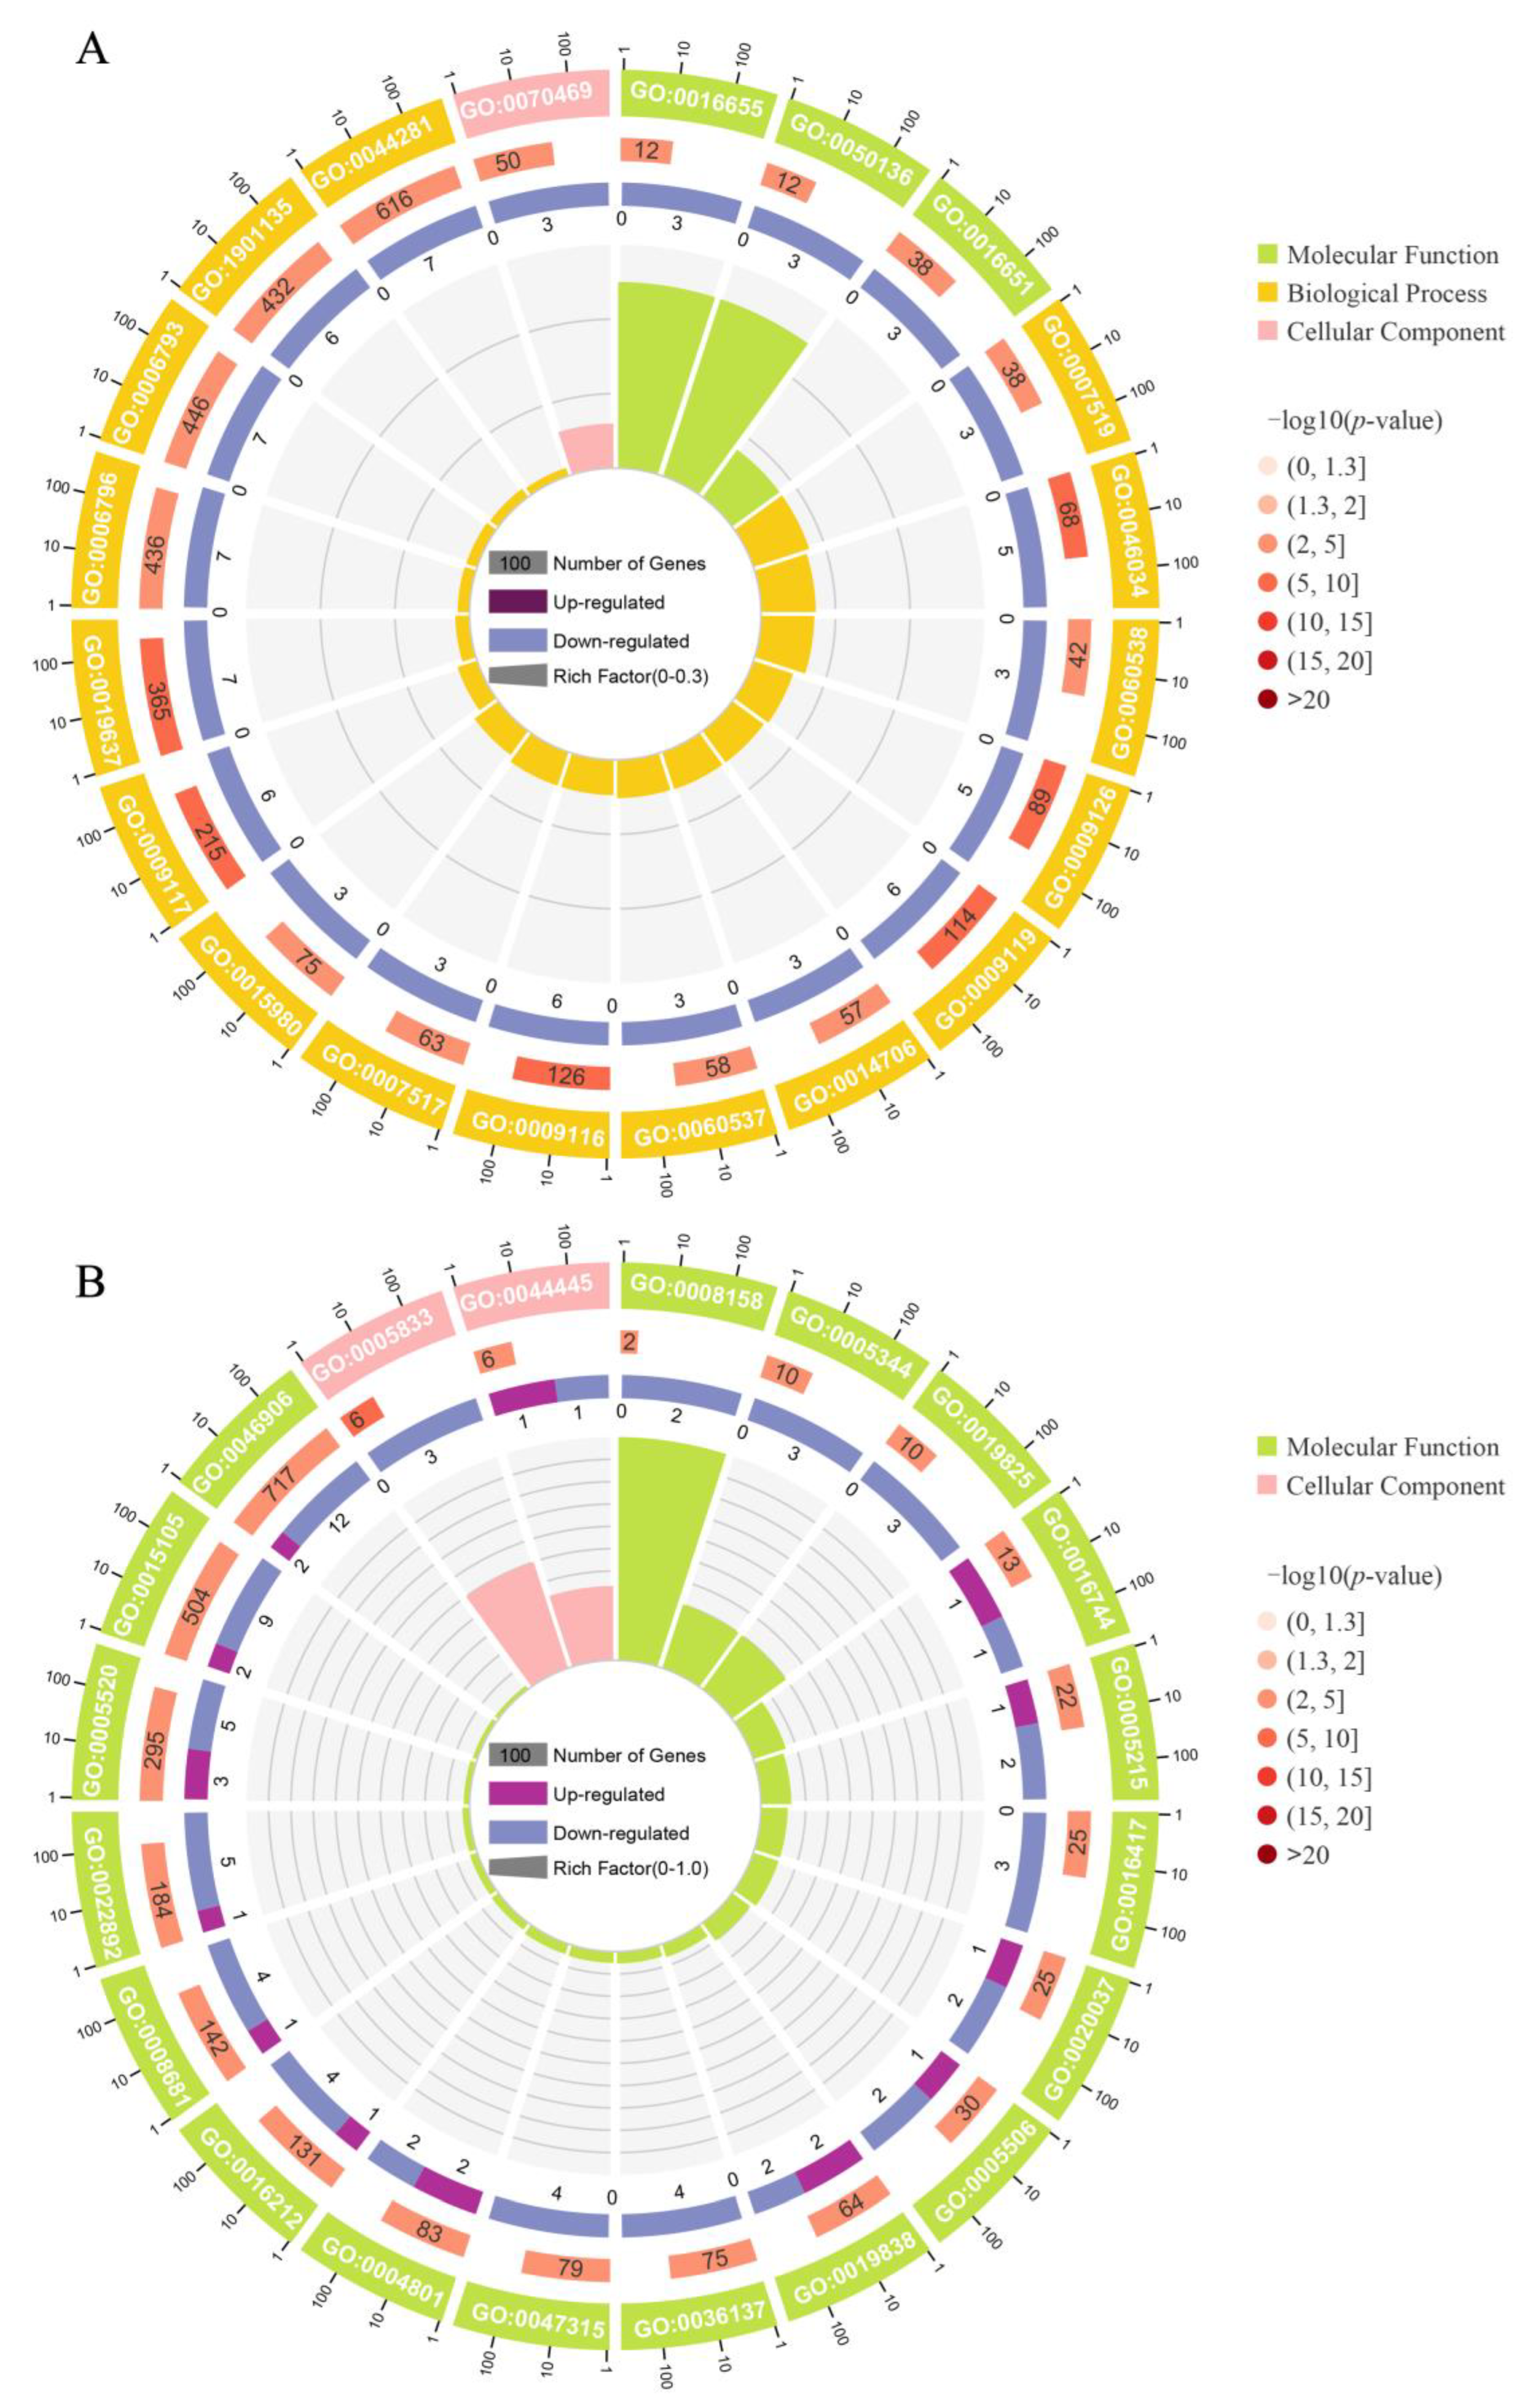
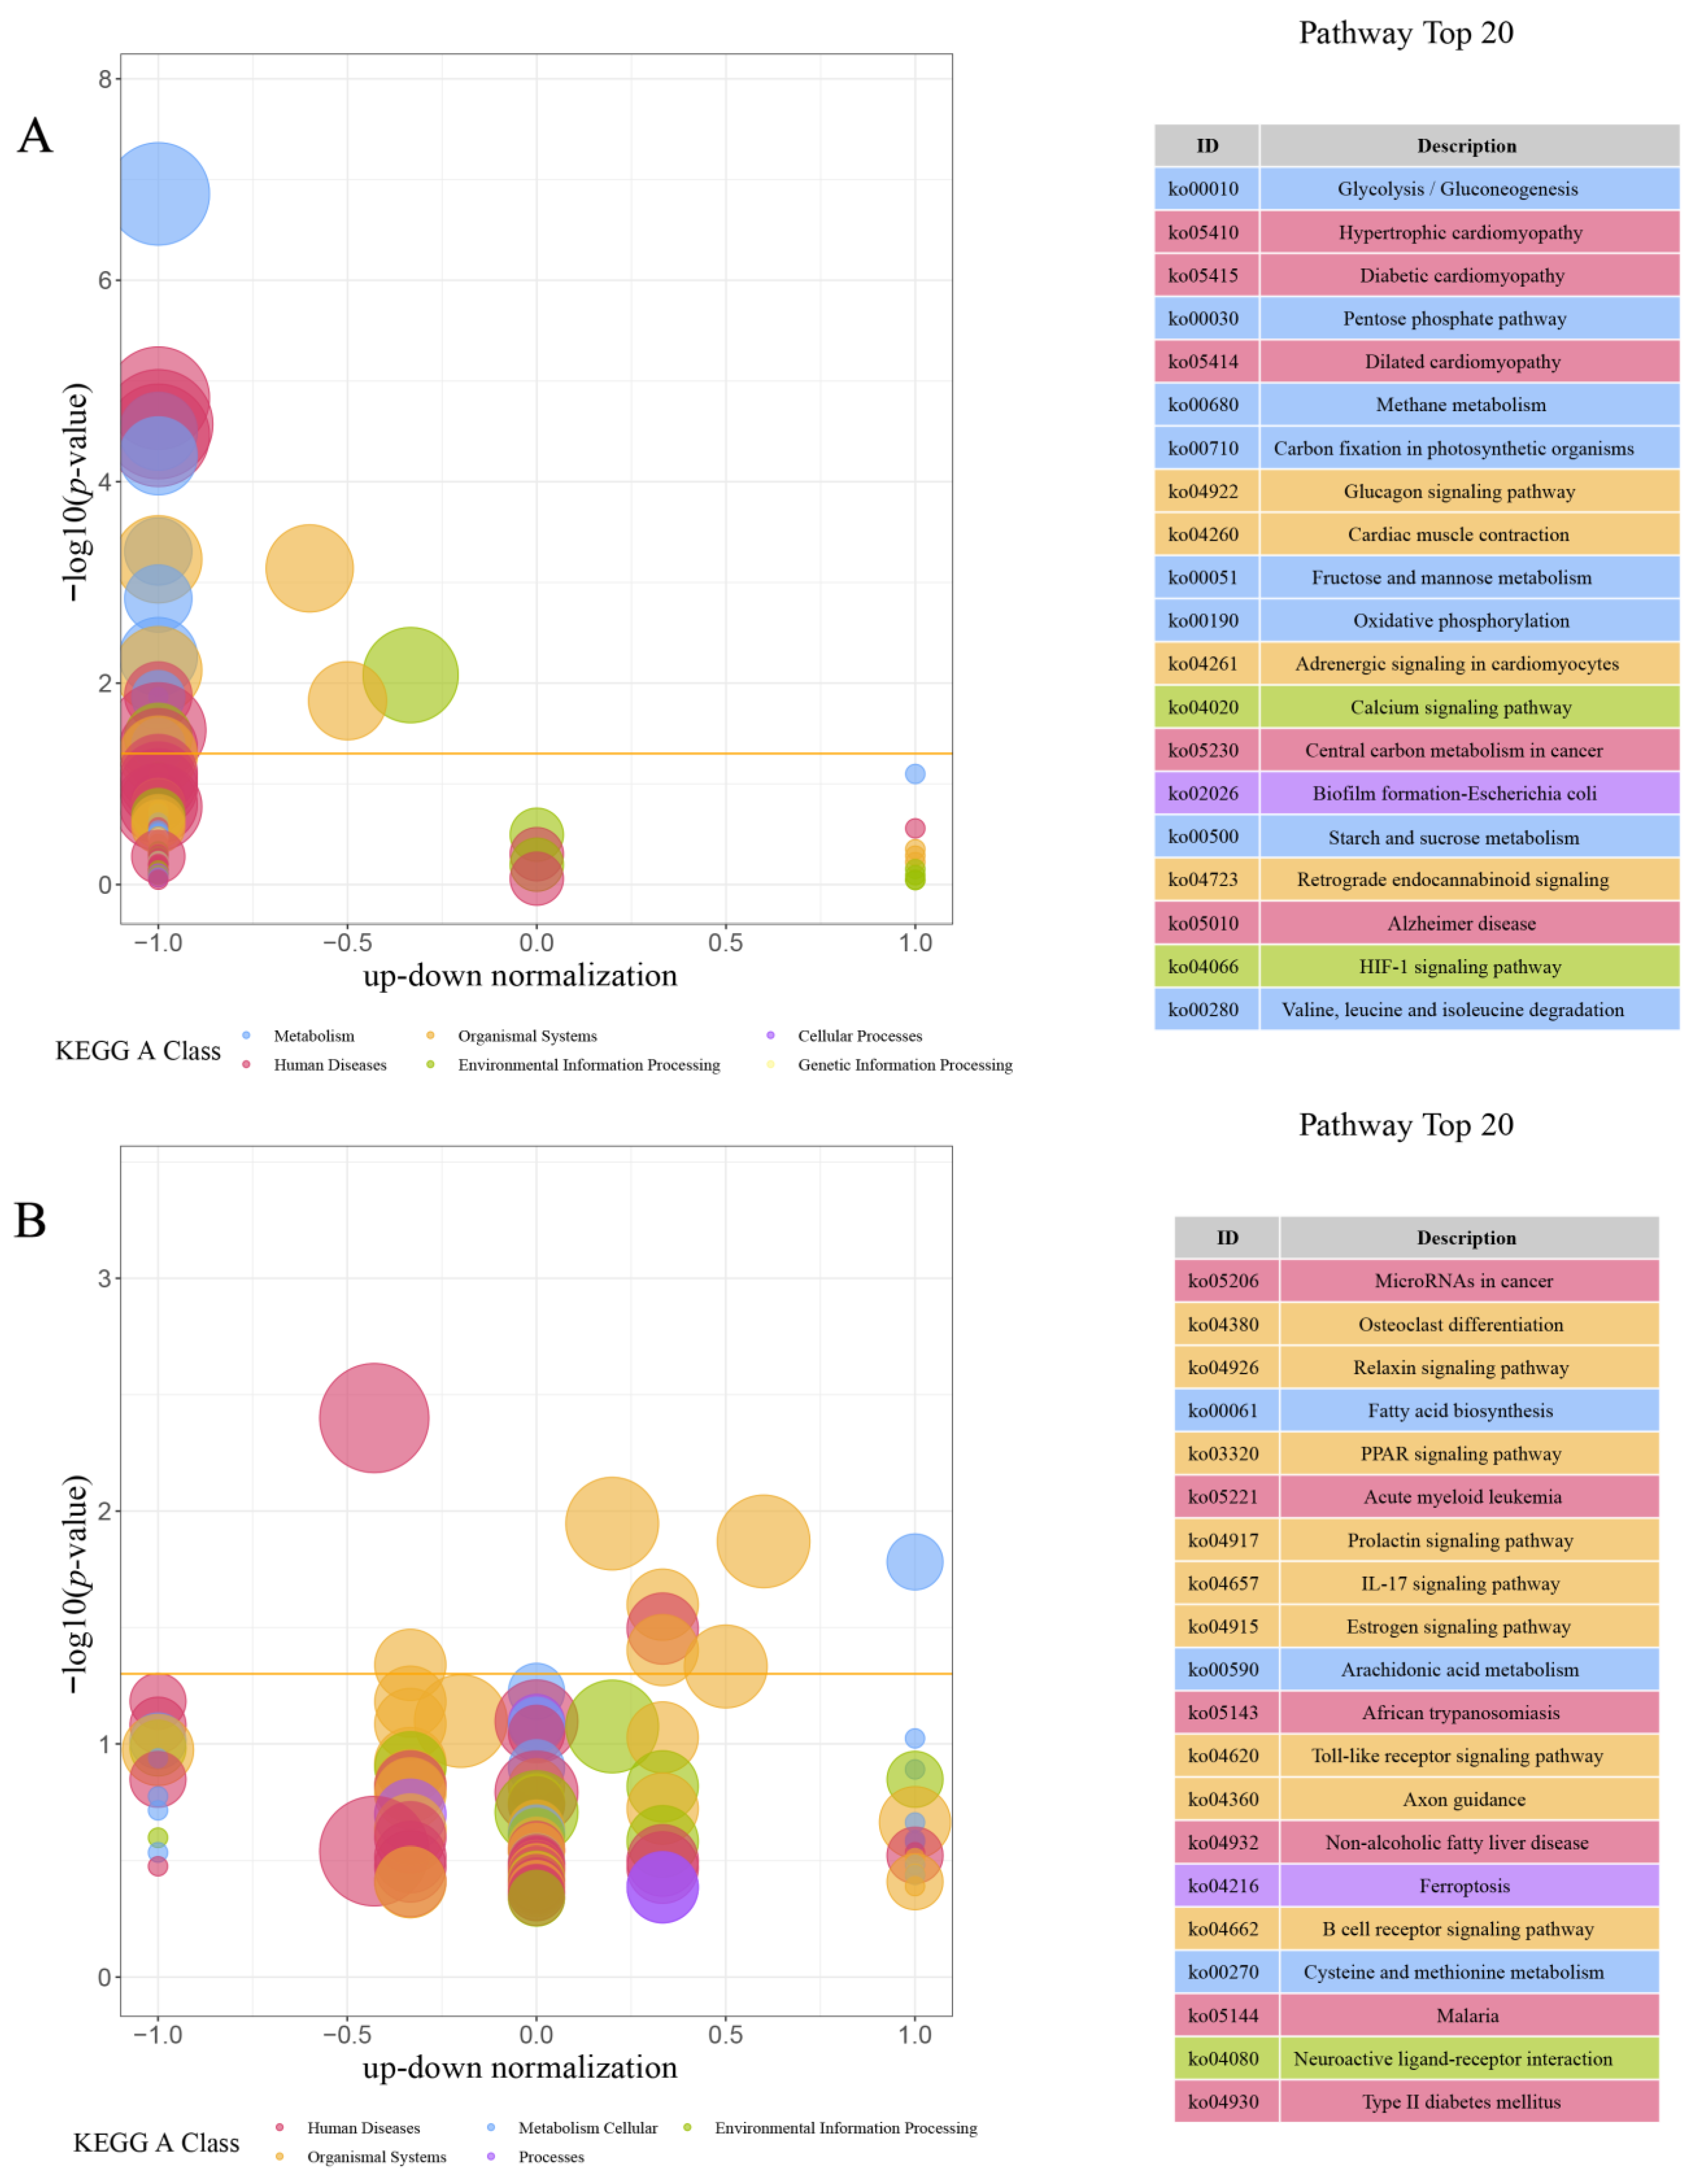
3.4. GO and KEGG Enrichment Analysis

GO enrichment analysis and functional annotation were carried out on 2887 DEGs of the F and S groups. We found that the DEGs of FB vs. SB, FL vs. SL, and FM vs. SM were enriched into 207, 199, and 595 GO items, respectively (p ≤ 0.05). These GO items included skeletal muscle tissue development and metabolic process in FB vs. SB, insulin-like growth factor binding in FL vs. SL, cell cycle process, DNA replication, mitotic cell cycle, and mitotic cell cycle process in FM vs. SM. Among them, there were 288 significantly enriched GO items (Q value ≤ 0.01) (Table S1), which included skeletal muscle tissue development, insulin-like growth factor binding, mitotic cell cycle, etc. The top 20 of the three different tissue GO enrichment terms were shown in Figure 6, and the GO numbers in the figure were provided in the Supplementary Materials (Tables S2–S4).
In order to explore the major signaling pathways related to the growth rate of M. armatus, KEGG functional enrichment analysis was performed on 2887 DEGs. A total of 22 significant related pathways were screened out of 89 enrichment pathways in FB vs. SB, such as glycolysis/gluconeogenesis, pentose phosphate pathway, glucagon signaling pathway, etc. (Figure 7A). Among 188 enrichment pathways of FL vs. SL, 9 significant related pathways were screened, such as fatty acid biosynthesis and the PPAR signaling pathway (Figure 7B). Among 367 enrichment pathways of FM vs. SM, 37 significant related pathways were screened, such as DNA replication, protein digestion and absorption, the citrate cycle (TCA (tricarboxylic acid) cycle), P53 signaling pathway, etc. (Figure 7C). The top 20 KEGG enrichment pathways were shown in Figure 7, and the details of the classes and paths were added to the Supplementary Material (Tables S5–S7).

3.5. Identification of Differentially Expressed Growth Genes

In the DEGs of M. armatus with different growth rates in this study, based on the GO and KEGG annotation, we found that 18 growth-related genes were up-regulated or down-regulated in group F. The down-regulated genes in brain tissue were ACTA1B, MYLPFA, MYL1, TNNT3A, MYLZ3, LDB3B, ACTN3B, and SYNPO2LA, while the up-regulated gene was ZIC5 (Table 4). Down-regulated genes in liver tissues included IGF2BP1, IGFBP1A, IGFBP1B, ITGA7, and IRS2B, while up-regulated genes included ACLY and MYL9B (Table 5). Down-regulated genes in muscle tissue included CDKN1A, IGFBP1B, IGF2BP1, and IGF2BP3, while up-regulated genes included MYOM3 and MB (Table 6).

4. Discussion

In recent years, owing to the rapid development of transcriptome sequencing technology, researchers have been able to conduct in-depth studies on gene expression, gene function, signaling pathways, and other aspects [21]. At present, transcriptome analysis technology has been widely used in related studies on developmental biology [22,23], environmental stress [24], adaptive evolution [25], immunology [26], and growth rate [27].
This study found that under the same breeding conditions, there were significant differences in the growth rate of the same batch of M. armatus seedlings. Transcriptome sequencing was performed on brain, liver, and muscle tissue samples of 3-month-old M. armatus with different growth rates by high-throughput sequencing technology. A total of 2887 DEGs were screened, including IGFBP1B, ACLY, ACTA1, IGFBP1A, MYL1, MB, and other key genes involved in regulating body growth.
The effects of growth hormone on cell growth are mainly mediated by the growth hormone/somatomedin (GH/IGF) growth-axis [28]. It is a major activator of the growth hormone/somatomedin (GH/IGF) growth-axis, stimulating IGF-I secretion in liver or other target tissues [29,30]. The original auxin hypothesis put forward that GH mainly promoted the growth and differentiation of cells by stimulating the liver to secrete IGF-I, and then IGF-I is circulated to the target organ through the blood circulation [31]. Interestingly, the role of growth hormone in promoting individual growth seems to be due to the direct effect of growth hormone on target tissues, rather than the circulating IGF-I mediated by liver production [32]. Studies have shown that growth hormone can not only stimulate the secretion of IGF-I in liver tissues to increase the level of IGF-I in plasma, but it can also affect the IGF-I produced by target tissues to act in an autocrine or paracrine way [33]. Meanwhile, based on relevant experimental data of gene knockout mice, circulating IGF-I is mainly derived from IGF-I produced by the liver, and the influence of circulating IGF-I on growth may be little or even nonexistent, while locally produced IGF-I in target tissues may be the reason why IGF-I promotes growth [34]. In an mRNA localization experiment of the IGF-I and IGF-I receptor in gilthead sea bream (Sparus aurata), Funkenstein et al. [35] found that in the early growth and development of fish larvae, IGF-I might stimulate cell proliferation in target tissues by paracrine or autocrine means, while the liver did not play an important role in IGF-I production. When we subsequently verified the expression of growth-related genes in M. armatus by RT-qPCR, it was found that the expression of GH in group F was significantly higher than that in group S in brain tissue, and there was no difference in the expression of IGF-I between group F and group S in liver tissue, while the expression of IGF-I in the muscle of group F was significantly higher than that in group S. It seemed that the growth-promoting effect of GH might be directly exerted on the growth tissues in the early developmental stage of M. armatus, rather than mediated by liver secretion of IGF-I. Meanwhile, the expression of GH and GHR in the muscle tissue of group F was significantly higher than that in group S, indicating that, like gilthead sea bream [32,35], in the early developmental stage of M. armatus, GH acted directly by binding to the GH receptor (GHR) in the target tissue (e.g., muscle tissue), and induced the target tissue to secrete IGF-I in an autocrine/paracrine manner to participate in the regulation of tissue growth and differentiation. Notably, Silva et al. [36] created double transgenic zebrafish (Danio rerio) and the utilization of the highly expressed GHR in zebrafish muscle tissue reduced the negative effects of overexpressed GH on reproduction. Creating double transgenic M. armatus overexpressing both the growth hormone (GH) and its receptor (GHR) may not only effectively reduce the negative effects of growth hormone, but also further achieve maximal growth and minimal side effects and significantly improve the growth rate of M. armatus in commercial aquaculture settings.
Under the stimulation of growth hormone (GH), the liver secretes insulin-like growth factor (IGF)-I [37]. IGFBP-1 can bind to IGF and regulate the role of IGF in the growth and development of somatic cells [38]. Due to its high affinity for IGF-I, IGFBP-1 can prevent IGF-I from interacting with other receptors and inhibit the effect of IGF-I after binding with IGF-I [39]. Since the IGFBP-1 of fish has no nuclear localization sequence, IGFBP-1 plays a role mainly by regulating the action of IGF-1 [40]. Studies have shown that circulating IGFBP-1 can inhibit the interaction between the IGF-1 and IGF receptor on pituitary cells [40], and IGFBP-1A can inhibit the action of IGF-1 [41]. Because IGFBP-1B has a higher dissociation rate, IGFBP-1B has a much lower affinity for IGF-I and -II than IGFBP-1A, and both IGFBP-1A and IGFBP-1B inhibit the IGF-1-induced cell proliferation process during embryonic development in zebrafish (Danio rerio). Overexpression of IGFBP-1B can significantly reduce the growth and development rate of embryos [38]. It is concluded that IGFBP-1A and IGFBP-1B may play an important role in the growth regulation of M. armatus seedlings, and the expression levels of IGFBP-1A and IGFBP-1B are significantly increased in slow-growing individuals. In this experiment, IGFBP-1A and IGFBP-1B were significantly down-regulated in fast-growing M. armatus seedlings, which was consistent with the above research results.
Myoglobin (MB) is an oxygen-binding protein, which can effectively promote oxygen diffusion in the muscle and is an efficient oxygen carrier [42]. It has been thought to be a protein only found in muscle cells [43], but later studies have shown that MB is not only expressed in the muscles of the Tibetan Plateau endemic schizothoracine fish (Schizopygopsis pylzovi), but also in the liver, muscle, kidney, brain, eyes, and skin [44]. MB, which is rich in bioavailable iron [45], can also clear active oxygen in vivo [46], store oxygen and promote intracellular oxygen diffusion [43], and regulate the concentration of nitric oxide in the sarcoplasm [42]. Transcriptome analysis of mixed tissues of black porgy (Acanthopagrus schlegelii) [2] showed that the expression of MB was significantly down-regulated in the slow-growing group. At the same time, some studies have shown that while the cultured Pacific bluefin tuna (Thunnus orientalis) grows, its MB content also increases continuously (p ≤ 0.05) [47]. Through transcriptome studies on grass carp (Ctenopharyngodon idella) with different growth rates, it was found that the expression of MB in fast-growing individuals was significantly higher than that in slow-growing individuals [48]. In this study, MB was significantly upregulated in the muscle tissue of fast-growing M. armatus individuals, similar to the results of the above study.

5. Conclusions

Transcriptome sequencing and bioinformatics analysis were performed on the brain, liver, and muscle tissues of M. armatus with different growth rates. Based on the results of this study, DEGs IGFBP-1A, IGFBP-1B, and MB were selected for analysis, and the expression of GH, IGF-Ⅰ and GHR of growth-related genes were also verified by RT-qPCR. The expression levels of IGFBP-1A and IGFBP-1B were significantly increased in the liver tissue of slow-growing M. armatus individuals, which might have a negative impact on the growth rate of M. armatus. GH, GHR, and MB were significantly up-regulated in fast-growing M. armatus individuals. From these results, we can infer that, in the early developmental stage of M. armatus, GH may act directly through binding to GH receptors (GHR) in muscle tissues. The results of this study provide a reference for further research on the molecular mechanism of growth and development in teleost fish.

Supplementary Materials

The following supporting information can be downloaded at: https://www.mdpi.com/article/10.3390/ani14020248/s1, Table S1: Significantly enriched GO terms; Table S2: The GO number of picture A in Figure 6; Table S3: The GO number of picture B in Figure 6; Table S4: The GO number of picture C in Figure 6; Table S5: The pathway of picture A in Figure 7; Table S6: The pathway of picture B in Figure 7; Table S7: The pathway of picture C in Figure 7.

Author Contributions

Conceptualization, H.S. and C.H.; methodology, J.Y.; software, J.Y.; validation, Z.Y., L.Z. and B.L.; formal analysis, J.Y. and Y.C.; investigation, J.Y. and B.L.; resources, Z.C.; data curation, J.Y.; writing—original draft preparation, J.Y.; writing—review and editing, H.S., C.H. and J.Y.; visualization, J.Y. and B.L.; supervision, H.S., C.H. and B.L.; project administration, H.S., C.H. and B.L.; funding acquisition, H.S. All authors have read and agreed to the published version of the manuscript.

Funding

This research was funded by the Seed industry revitalization project funded by the Provincial Rural Revitalization Strategy in 2022, grants from 2022-SPY-00-017; by Science, Technology Program of Guangdong Province, grants from 2019B030316022; by China-ASEAN Maritime Cooperation Fund, grants from CAMC-2018F; and by the ”2 + 5” platform funding support from Guangzhou University.

Institutional Review Board Statement

The animal study protocol was approved by the Institutional Review Board of the Experimental Animal Ethics Committee of the Guangzhou University of China (No. URBBB220506).

Informed Consent Statement

Not applicable.

Data Availability Statement

The raw data are available from the SRA (http://www.ncbi.nlm.nih.gov/sra/) (accessed on 17 November 2023) data repository (accession number: PRJNA1053665).

Conflicts of Interest

The authors declare no conflict of interest.

References

  1. Adamek, D.; Rzepkowska, M.; Panagiotopoulou, H.; Ostaszewska, T.; Fajkowska, M.; Kamaszewski, M.; Kolman, R. Morphological Differences of White Muscle Fibers and Genetic Diversity of Fast and Slow Growing Atlantic Sturgeons (Acipenser oxyrinchus). Turk. J. Fish. Aquat. Sci. 2017, 17, 959–966. [Google Scholar] [CrossRef]
  2. Lin, Z.; Zhang, Z.; Solberg, M.F.; Chen, Z.; Wei, M.; Zhu, F.; Jia, C.; Meng, Q.; Zhang, Z. Comparative transcriptome analysis of mixed tissues of black porgy (Acanthopagrus schlegelii) with differing growth rates. Aquac. Res. 2021, 52, 5800–5813. [Google Scholar] [CrossRef]
  3. Sun, Y.; Guo, C.Y.; Wang, D.D.; Li, X.F.; Xiao, L.; Zhang, X.; You, X.; Shi, Q.; Hu, G.J.; Fang, C.; et al. Transcriptome analysis reveals the molecular mechanisms underlying growth superiority in a novel grouper hybrid (Epinephelus fuscogutatusfemale symbol × E. lanceolatusmale symbol). BMC Genet. 2016, 17, 24. [Google Scholar] [CrossRef]
  4. Valente, L.M.P.; Moutou, K.A.; Conceicao, L.E.C.; Engrola, S.; Fernandes, J.M.O.; Johnston, L.A. What determines growth potential and juvenile quality of farmed fish species? Rev. Aquac. 2013, 5, S168–S193. [Google Scholar] [CrossRef]
  5. Tamayo, D.; Ibarrola, I.; Urrutia, M.B.; Navarro, E. The physiological basis for inter-individual growth variability in the spat of clams (Ruditapes philippinarum). Aquaculture 2011, 321, 113–120. [Google Scholar] [CrossRef]
  6. Liao, X.; Cheng, L.; Xu, P.; Lu, G.; Wachholtz, M.; Sun, X.; Chen, S. Transcriptome analysis of crucian carp (Carassius auratus), an important aquaculture and hypoxia-tolerant species. PLoS ONE 2013, 8, e62308. [Google Scholar] [CrossRef]
  7. Zhang, J.; Shen, Y.; Xu, X.; Dai, Y.; Li, J. Transcriptome Analysis of the Liver and Muscle Tissues of Black Carp (Mylopharyngodon piceus) of Different Growth Rates. Mar. Biotechnol. 2020, 22, 706–716. [Google Scholar] [CrossRef]
  8. Fu, B.; Yu, X.; Tong, J.; Pang, M.; Zhou, Y.; Liu, Q.; Tao, W. Comparative transcriptomic analysis of hypothalamus-pituitary-liver axis in bighead carp (Hypophthalmichthys nobilis) with differential growth rate. BMC Genom. 2019, 20, 328. [Google Scholar] [CrossRef]
  9. Fan, H.; Qiu, M.; Zhong, Q.; Xue, L.; Qin, Z. Comparison of nutritional components of wild and farmed Mastacembelus armatus at different growth stages. J. Anhui Agric. Sci. 2018, 46, 92–96. [Google Scholar]
  10. Zhong, D.; Huang, X.; He, P.; Zhou, H.; Zhang, M.; Shu, H. Cloning and expression analysis of growth hormone gene of Mastacembelus armatus. J. South. Agric. 2020, 51, 194–201. [Google Scholar]
  11. Zhong, D.; Lai, X.; Zhang, M.; Shu, H. Cloning and expression analysis of mstn gene of Mastacembelus armatus. J. Guangdong Ocean Univ. 2020, 40, 14–21. [Google Scholar]
  12. Chen, S.; Zhou, Y.; Chen, Y.; Gu, J. fastp: An ultra-fast all-in-one FASTQ preprocessor. Bioinformatics 2018, 34, i884–i890. [Google Scholar] [CrossRef]
  13. Langmead, B.; Salzberg, S. Fast gapped-read alignment with Bowtie 2. Nat. Methods 2012, 9, 357–359. [Google Scholar] [CrossRef]
  14. Kim, D.; Langmead, B.; Salzberg, S.L. HISAT: A fast spliced aligner with low memory requirements. Nat. Methods 2015, 12, 357–360. [Google Scholar] [CrossRef]
  15. Xue, L.; Gao, Y.; Wu, M.; Tian, T.; Fan, H.; Huang, Y.; Huang, Z. Telomere-to-telomere assembly of a fish Y chromosome reveals the origin of a young sex chromosome pair. Genome Biol. 2021, 22, 203. [Google Scholar] [CrossRef]
  16. Love, M.I.; Huber, W.; Anders, S. Moderated estimation of fold change and dispersion for RNA-seq data with DESeq2. Genome Biol. 2014, 15, 550. [Google Scholar] [CrossRef]
  17. Kanehisa, M.; Furumichi, M.; Sato, Y.; Ishiguro-Watanabe, M.; Tanabe, M. KEGG: Integrating viruses and cellular organisms. Nucleic Acids Res. 2021, 49, D545–D551. [Google Scholar] [CrossRef]
  18. Kanehisa, M. Toward understanding the origin and evolution of cellular organisms. Protein Sci. 2019, 28, 1947–1951. [Google Scholar] [CrossRef]
  19. Wang, K.; Bu, T.; Cheng, Q.; Dong, L.; Su, T.; Chen, Z.; Kong, F.; Gong, Z.; Liu, B.; Li, M. Two homologous LHY pairs negatively control soybean drought tolerance by repressing the abscisic acid responses. New Phytol. 2021, 229, 2660–2675. [Google Scholar] [CrossRef]
  20. Livak, K.J.; Schmittgen, T.D. Analysis of relative gene expression data using real-time quantitative PCR and the 2(-Delta Delta C(T)) Method. Methods 2001, 25, 402–408. [Google Scholar] [CrossRef]
  21. Mortazavi, A.; Williams, B.A.; McCue, K.; Schaeffer, L.; Wold, B. Mapping and quantifying mammalian transcriptomes by RNA-Seq. Nat. Methods 2008, 5, 621–628. [Google Scholar] [CrossRef]
  22. Chapman, R.W.; Reading, B.J.; Sullivan, C.V. Ovary transcriptome profiling via artificial intelligence reveals a transcriptomic fingerprint predicting egg quality in striped bass, Morone saxatilis. PLoS ONE 2014, 9, e96818. [Google Scholar] [CrossRef]
  23. Gudbrandsson, J.; Ahi, E.P.; Franzdottir, S.R.; Kapralova, K.H.; Kristjansson, B.K.; Steinhaeuser, S.S.; Maier, V.H.; Johannesson, I.M.; Snorrason, S.S.; Jonsson, Z.O.; et al. The developmental transcriptome of contrasting Arctic charr (Salvelinus alpinus) morphs. F1000Research 2015, 4, 136. [Google Scholar] [CrossRef]
  24. Li, Y.; Zhou, F.; Huang, J.; Yang, L.; Jiang, S.; Yan, Q.; Jiang, S. Transcriptome and miRNA Profiles of Black Tiger Shrimp, Penaeus monodon, Under Different Salinity Conditions. Front. Mar. Sci. 2020, 7, 579381. [Google Scholar] [CrossRef]
  25. Jeukens, J.; Renaut, S.; St-cyr, J.; Nolte, A.W.; Bernatchez, L. The transcriptomics of sympatric dwarf and normal lake whitefish (Coregonus clupeaformis spp., Salmonidae) divergence as revealed by next-generation sequencing. Mol. Ecol. 2010, 19, 5389–5403. [Google Scholar] [CrossRef]
  26. Wang, R.; Hu, X.; Lü, A.; Liu, R.; Sun, J.; Sung, Y.Y.; Song, Y. Transcriptome analysis in the skin of Carassius auratus challenged with Aeromonas hydrophila. Fish Shellfish Immunol. 2019, 94, 510–516. [Google Scholar] [CrossRef]
  27. Guan, W.Z.; Qiu, G.F.; Liu, F. Transcriptome analysis of the growth performance of hybrid mandarin fish after food conversion. PLoS ONE 2020, 15, e0240308. [Google Scholar] [CrossRef]
  28. Kim, H.; Barton, E.; Muja, N.; Yakar, S.; Pennisi, P.; LeRoith, D. Intact Insulin and Insulin-Like Growth Factor-I Receptor Signaling Is Required for Growth Hormone Effects on Skeletal Muscle Growth and Function in Vivo. Endocrinology 2005, 146, 1772–1779. [Google Scholar] [CrossRef]
  29. Ndandala, C.B.; Dai, M.; Mustapha, U.F.; Li, X.; Liu, J.; Huang, H.; Li, G.; Chen, H. Current research and future perspectives of GH and IGFs family genes in somatic growth and reproduction of teleost fish. Aquac. Rep. 2022, 26, 101289. [Google Scholar] [CrossRef]
  30. Triantaphyllopoulos, K.A.; Cartas, D.; Miliou, H. Factors influencing GH and IGF-I gene expression on growth in teleost fish: How can aquaculture industry benefit? Rev. Aquac. 2019, 12, 1637–1662. [Google Scholar] [CrossRef]
  31. Roith, D.L.; Bondy, C.; Yakar, S.; Liu, J.L.; Butler, A. The Somatomedin Hypothesis: 2001. Endocr. Rev. 2001, 22, 53–74. [Google Scholar] [CrossRef]
  32. Pérez-Sánchez, J. The involvement of growth hormone in growth regulation, energy homeostasis and immune function in the gilthead sea bream (Sparus aurata): A short review. Fish Physiol. Biochem. 2000, 22, 135–144. [Google Scholar] [CrossRef]
  33. Sjögren, K.; Liu, J.L.; Blad, K.; Skrtic, S.; Vidal, O.; Wallenius, V.; Leroith, D.; Törnell, J.; Isaksson, O.G.P.; Jansson, J.O.; et al. Liver-derived insulin-like growth factor I (IGF-I) is the principal source of IGF-I in blood but is not required for postnatal body growth in mice. Proc. Natl. Acad. Sci. USA 1999, 96, 7088–7092. [Google Scholar] [CrossRef] [PubMed]
  34. Yakar, S.; Liu, J.L.; Stannard, B.; Butler, A.; Accili, D.; Sauer, B.; Leroith, D. Normal growth and development in the absence of hepatic insulin-like growth factor I. Proc. Natl. Acad. Sci. USA 1999, 96, 7324–7329. [Google Scholar] [CrossRef]
  35. Funkenstein, B.; Almuly, R.; Chan, S.J. Localization of IGF-I and IGF-I Receptor mRNA inSparus aurataLarvae. Gen. Comp. Endocrinol. 1997, 107, 291–303. [Google Scholar] [CrossRef]
  36. Silva, A.C.G.; Almeida, D.V.; Nornberg, B.F.; Pereira, J.R.; Pires, D.M.; Corcini, C.D.; Junior, A.S.V.; Marins, L.F. Reproductive parameters of double transgenic zebrafish (Danio rerio) males overexpressing both the growth hormone (GH) and its receptor (GHR). Transgenic Res. 2017, 26, 123–134. [Google Scholar] [CrossRef] [PubMed]
  37. Daughaday, W.H.; Rotwein, P. Insulin-Like Growth Factors I and II. Peptide, Messenger Ribonucleic Acid and Gene Structures, Serum, and Tissue Concentrations. Endocr. Rev. 1989, 10, 68–91. [Google Scholar] [CrossRef]
  38. Kamei, H.; Lu, L.; Jiao, S.; Li, Y.; Gyrup, C.; Laursen, L.S.; Oxvig, C.; Zhou, J.; Duan, C. Duplication and diversification of the hypoxia-inducible IGFBP-1 gene in zebrafish. PLoS ONE 2008, 3, e3091. [Google Scholar] [CrossRef] [PubMed]
  39. Wheatcroft, S.B.; Kearney, M.T. IGF-dependent and IGF-independent actions of IGF-binding protein-1 and -2: Implications for metabolic homeostasis. Trends Endocrinol. Metab. 2009, 20, 153–162. [Google Scholar] [CrossRef]
  40. Tanaka, H.; Oishi, G.; Nakano, Y.; Mizuta, H.; Nagano, Y.; Hiramatsu, N.; Ando, H.; Shimizu, M. Production of recombinant salmon insulin-like growth factor binding protein-1 subtypes. Gen. Comp. Endocrinol. 2018, 257, 184–191. [Google Scholar] [CrossRef]
  41. Fruchtman, S.; Mcvey, D.C.; Borski, R.J. Characterization of pituitary IGF-I receptors: Modulation of prolactin and growth hormone. Am. J. Physiol. Regul. Integr. Comp. Physiol. 2002, 283, R468–R476. [Google Scholar] [CrossRef]
  42. Wittenberg, J.B.; Wittenberg, B.A. Myoglobin function reassessed. J. Exp. Biol. 2003, 206, 2011–2020. [Google Scholar] [CrossRef] [PubMed]
  43. Ueki, N.; Ochiai, Y. Primary structure and thermostability of bigeye tuna myoglobin in relation to those of other scombridae fish. Fish. Sci. 2004, 70, 875–884. [Google Scholar] [CrossRef]
  44. Qi, D.; Chao, Y.; Zhao, Y.; Xia, M.; Wu, R. Molecular evolution of myoglobin in the Tibetan Plateau endemic schizothoracine fish (Cyprinidae, Teleostei) and tissue-specific expression changes under hypoxia. Fish Physiol. Biochem. 2017, 44, 557–571. [Google Scholar] [CrossRef] [PubMed]
  45. Tan, B.; Sun, B.; Sun, N.; Li, C.; Zhang, J.; Yang, W. Structure, functional properties and iron bioavailability of Pneumatophorus japonicus myoglobin and its glycosylation products. Int. J. Biol. Macromol. 2021, 173, 524–531. [Google Scholar] [CrossRef] [PubMed]
  46. Hasan, M.M.; Ushio, H.; Ochiai, Y. Expression and characterization of rainbow trout Oncorhynchus mykiss recombinant myoglobin. Int. J. Biol. Macromol. 2021, 47, 1477–1488. [Google Scholar] [CrossRef]
  47. Nakamura, Y.-N.; Ando, M.; Seoka, M.; Kawasaki, K.; Tsukamasa, Y. Changes of proximate compositions and myoglobin content in the dorsal ordinary muscles of the cultured Pacific bluefin tuna Thunnus orientalis with growth. Fish. Sci. 2007, 73, 1155–1159. [Google Scholar] [CrossRef]
  48. Lu, X.; Chen, H.M.; Qian, X.Q.; Gui, J.F. Transcriptome analysis of grass carp (Ctenopharyngodon idella) between fast- and slow-growing fish. Comp. Biochem. Physiol. Part D Genom. Proteom. 2020, 35, 100688. [Google Scholar] [CrossRef]
Figure 1. Experimental flow chart.
Animals 14 00248 g001
Figure 2. Weight and full length statistics of individuals with different growth rates. F: group F, S: group S, (A) is the analysis of significant differences in weight, (B) is the analysis of significant differences in full length, ** p-value below 0.01.
Animals 14 00248 g002
Figure 3. Sample principal component analysis (PCA). FB: Brain tissue from the sample individuals in group F. FL: Liver tissue from the sample individuals in group F. FM: Muscle tissue from the sample individuals in group F. SB: Brain tissue from the sample individuals in group S. SL: Liver tissue from the sample individuals in group S. SM: Muscle tissue from the sample individuals in group S.
Animals 14 00248 g003
Figure 4. Statistics of differentially expressed genes.
Animals 14 00248 g004
Figure 5. Gene expression patterns of RNA-Seq and RT-qPCR. (A) The results of RT-qPCR identification of DEGs in brain tissue. (B) The results of RT-qPCR identification of DEGs in liver tissue. (C) The RT-qPCR identification results of DEGs in muscle tissue. ACTA1: actin alpha 1, skeletal muscle b. MYL1: myosin, light chain 1, alkali; skeletal, fast. ZIC5: zic family member 5 (odd-paired homolog, Drosophila). FBP2: fructose-1,6-bisphosphatase 2. GDF10: growth differentiation factor 10b. DUSP2: dual specificity phosphatase 2. IGF2BP1: insulin-like growth factor 2 mRNA binding protein 1. IGFBP1A: insulin-like growth factor binding protein 1a. IGFBP1B: insulin-like growth factor binding protein 1b. ME1: malic enzyme 1, NADP(+)-dependent, cytosolic. ACLYA: ATP citrate lyase a. MYBPC3: myosin binding protein C3. SDS: serine dehydratase-like. HAUS5: HAUS augmin-like complex, subunit 5. TACC3: transforming, acidic coiled-coil containing protein 3. CCNB3: cyclin B3.
Animals 14 00248 g005
Figure 6. GO functional annotation analysis of DEGs in brain (A), liver (B), and muscle (C). Circle diagram (from the outside in, the first circle: enrich the top 25 GO terms, different colors represent different categories. Outside the circle is the coordinate scale of the number of genes. The second circle: the number of GO terms in the background gene and the p-values. A longer bar means more genes, and a redder color means a smaller number. The third circle: the bar chart of up- and down-regulated genes, dark purple represents the up-regulated gene ratio, light purple represents the down-regulated gene ratio. The specific values are shown below. The fourth circle: RichFactor values for each GO term, with background auxiliary lines representing 0.1 in each grid).
Animals 14 00248 g006aAnimals 14 00248 g006b
Figure 7. KEGG enrichment analysis of DEGs in brain (A), liver (B), and muscle (C). The horizontal axis of the bubble diagram is the up–down normalization coefficient; the vertical axis is −log10pvalue; different colors indicate different functional classifications; the orange threshold is p-value = 0.05; the size of the bubble indicates the number of genes enriched in the current term (pathway) (i.e., up + down); the table on the right shows the 20 pathways with the smallest p-value.
Animals 14 00248 g007aAnimals 14 00248 g007b
Table 1. RT-qPCR primers of differentially expressed genes.
Gene NamePrimer Sequence (5′→3′)Melting Temperature/°C
ACTA1F: GCACCACACCTTCTACAA49.5
R: AGCATCCAGCACAATACC49.7
MYL1F: GACCTGTCCTCCATCAAG49
R: AGCCATTCTCATCCTCCT49.3
ZIC5F: GCACGAACTGGTCAATCA50.5
R: TGTGAGTCCTCTTGTGAATC50.4
FBP2F: GCCATCTACAAGCGGTTAT50.5
R: GGTCCAGCATGAAGAAGTT50.5
GDF10F: TCCAGCCAACCTACCATAT50.2
R: CCTTCTTCATCGTCCTCTC49.9
DUSP2F: GGTGGCAGATGAGAACAG50.2
R: AGTCAATGAAGGCGATGG49.8
IGF2BP1F: CAGACGCAGAGCAAGATT50.2
R: AAGTTGTTGTGAGCCAGAA50.2
IGFBP1AF: AGAGCCTGAGATGGAGAAC51.1
R: CCAGAGACGACTCACACT50.7
IGFBP1BF: CAGCACTGGACACGATAG50.1
R: TGACTTCTTGATGACACTCT49.3
ME1F: TCACGAGAAGGAGAGGTT49.3
R: GGAAGATGTAGGCATTGTTC49.8
ACLYAF: GGTATGTCCAACGAACTCA50
R: TCTGTGCCTCCAATCTCT49.6
MYBPC3F: GCCTCCTGTCCTGATTGTGA55.0
R: AGCCATAGATTCTCCGCCATT55.1
SDSF: TGCTGAATGGAGTGGTGGAG55.3
R: CCTGGTCTGTGACTACTTCTGA54.9
HAUS5F: ATCCATAACAGAGCCACAAGTC54.2
R: ACATCCAGAGCAGCCAGTT54.2
TACC3F: ACTGAGAACCTGCCGAACAA55.1
R: AAGGACTCCATTGCTGCTGTA55.2
CCNB3F: TCTCAGTGTCTGTCAGGTTGT54.4
R: GAGTTCTCAGCGTCAATGTCA54.3
Table 2. Data quality control results of each sample.
SampleClean Paired ReadsClean Bases (G)Q20 (%)Q30 (%)GC Content (%)Clean Data Ratio (%)
SB-152,431,1267.6398.8995.6346.9789.03
SB-252,766,5027.798.9495.8147.489.36
SB-358,687,6888.5598.8695.5347.2989.32
SL-143,273,4466.3298.9695.8148.6990.69
SL-250,526,2747.3799.0296.0349.2890.26
SL-346,867,6126.8599.0196.0149.0190.15
SM-145,096,3126.6198.9795.8650.4490.3
SM-253,343,6707.898.9995.9849.8990.07
SM-347,723,2466.9999.0696.1950.4190.64
FB-137,071,3665.4598.7795.2246.6190.16
FB-236,020,4625.398.7495.1446.3889.86
FB-340,536,4465.9798.7595.1846.9189.6
FL-140,133,1865.8798.8995.6248.6189.05
FL-241,425,1866.0499.0696.1749.0189.94
FL-343,314,2106.498.8195.3448.4889.45
FM-139,622,2725.8298.9795.8950.9490.27
FM-240,047,8945.8599.0296.0350.7889.99
FM-345,607,1126.6898.9595.8350.7390.12
Sample: Sample name; Clean Paired Reads: The total number of reads with junctions and low-quality bases were filtered out; Clean Bases: The total number of filtered bases, that is, the number of clean reads multiplied by the length; Q20 (%): The percentage of bases with a correct base recognition rate of more than 99%; Q30 (%): The percentage of bases with a correct base recognition rate of more than 99.9%; GC Content (%): The number of G + C as a percentage of the total number of bases; Clean Data Ratio (%): Rate of clean bases.
Table 3. Alignment results of the reference genome.
SampleTotal ReadsPaired Mapped Reads (%)Unpaired Mapped Reads (%)Unmapped Reads (%)Total Mapped Reads (%)
SB-151,517,494 38,344,392 (74.43%)3,161,940 (6.14%)10,011,162 (19.43%)41,506,332 (80.57%)
SB-251,613,212 36,682,906 (71.07%)3,175,401 (6.15%)11,754,905 (22.77%)39,858,307 (77.23%)
SB-357,178,028 40,208,324 (70.32%)3,507,018 (6.13%)13,462,686 (23.55%)43,715,342 (76.45%)
SL-142,519,140 30,457,448 (71.63%)2,904,978 (6.83%)9,156,714 (21.54%)33,362,426 (78.46%)
SL-249,550,142 35,433,480 (71.51%)3,105,560 (6.27%)11,011,102 (22.22%)38,539,040 (77.78%)
SL-345,301,398 31,087,930 (68.62%)3,084,443 (6.81%)11,129,025 (24.57%)34,172,373 (75.43%)
SM-144,805,510 36,928,266 (82.42%)2,044,978 (4.56%)5,832,266 (13.02%)38,973,244 (86.98%)
SM-253,099,480 40,588,834 (76.44%)3,085,672 (5.81%)9,424,974 (17.75%)43,674,506 (82.25%)
SM-347,381,560 38,406,404 (81.06%)2,163,296 (4.57%)6,811,860 (14.38%)40,569,700 (85.62%)
FB-136,626,502 25,861,926 (70.61%)2,666,815 (7.28%)8,097,761 (22.11%)28,528,741 (77.89%)
FB-235,652,742 24,567,788 (68.91%)2,849,139 (7.99%)8,235,815 (23.10%)27,416,927 (76.90%)
FB-339,921,844 28,220,434 (70.69%)2,825,609 (7.08%)8,875,801 (22.23%)31,046,043 (77.77%)
FL-139,241,700 26,444,650 (67.39%)2,679,001 (6.83%)10,118,049 (25.78%)29,123,651 (74.22%)
FL-240,425,420 27,880,806 (68.97%)2,630,530 (6.51%)9,914,084 (24.52%)30,511,336 (75.48%)
FL-342,839,680 28,279,204 (66.01%)3,870,241 (9.03%)10,690,235 (24.95%)32,149,445 (75.05%)
FM-138,794,238 32,069,580 (82.67%)1,665,771 (4.29%)5,058,887 (13.04%)33,735,351 (86.96%)
FM-239,748,678 33,003,178 (83.03%)1,608,890 (4.05%)5,136,610 (12.92%)34,612,068 (87.08%)
FM-345,296,212 37,355,274 (82.47%)2,009,298 (4.44%)5,931,640 (13.10%)39,364,572 (86.90%)
Total Reads: The number of clean reads after rRNA filtering; Paired Mapped Reads: The number of clean reads that mapped to multiple sites of the reference genome; Unpaired Mapped Reads: The number of clean reads that mapped to a single site of the reference genome; Unmapped Reads: The number of clean reads that were unmapped to the reference genome; Total Mapped Reads: The number of clean reads that mapped to the reference genome.
Table 4. Differentially expressed growth genes in brain tissue.
IDLog2FC (FDR < 0.05)GeneDescription
113122805−2.822629123ACTA1BActin alpha 1, skeletal muscle b.
113141556−2.92542818MYLPFAMyosin light chain, phosphorylatable, fast skeletal muscle a.
113123291−2.913046983MYL1Myosin, light chain 1, alkali; skeletal, fast.
113132910−3.131707241TNNT3ATroponin T type 3a (skeletal, fast).
113127528−3.002337731MYLZ3Myosin, light polypeptide 3, skeletal muscle.
113135302−2.965010599LDB3BLIM domain binding 3b.
113135777−2.476991992ACTN3BActinin alpha 3b.
1131231002.966333471ZIC5Zic family member 5.
113132015−2.568776028SYNPO2LASynaptopodin 2-like a.
Table 5. Differentially expressed growth genes in liver tissue.
IDLog2FC (FDR < 0.05)GeneDescription
113141522−3.854791781IGF2BP1Insulin-like growth factor 2 mRNA binding protein 1.
113139767−3.682401004IGFBP1AInsulin-like growth factor binding protein 1a.
113134287−2.810482959IGFBP1BInsulin-like growth factor binding protein 1b.
113130337−2.274576177ITGA7Integrin, alpha 7.
113122938−2.001084859IRS2BInsulin receptor substrate 2b
1131411422.623058494ACLYAATP citrate lyase a.
1131303282.160598057MYL9BMyosin, light chain 9b, regulatory.
Table 6. Differentially expressed growth genes in muscle tissue.
IDLog2FC (FDR < 0.05)GeneDescription
113130167−3.846745356CDKN1ACyclin-dependent kinase inhibitor 1A.
113134287−3.870604985IGFBP1BInsulin-like growth factor binding protein 1b.
113141522−2.699824093IGF2BP1Insulin-like growth factor 2 mRNA binding protein 1.
113126273−2.520499238IGF2BP3Insulin-like growth factor 2 mRNA binding protein 3.
1131364322.379825043MYOM3Myomesin 3.
1131281572.737550286MBMyoglobin.
Disclaimer/Publisher’s Note: The statements, opinions and data contained in all publications are solely those of the individual author(s) and contributor(s) and not of MDPI and/or the editor(s). MDPI and/or the editor(s) disclaim responsibility for any injury to people or property resulting from any ideas, methods, instructions or products referred to in the content.

