Article

STC2 Inhibits Hepatic Lipid Synthesis and Correlates with Intramuscular Fatty Acid Composition, Body Weight and Carcass Traits in Chickens

1
College of Animal Science and Technology, Henan Agricultural University, Zhengzhou 450046, China
2
International Joint Research Laboratory for Poultry Breeding of Henan, Zhengzhou 450046, China
3
Henan Key Laboratory for Innovation and Utilization of Chicken Germplasm Resources, Zhengzhou 450046, China
*
Author to whom correspondence should be addressed.
These authors contributed equally to this work.
Animals 2024, 14(3), 383; https://doi.org/10.3390/ani14030383
Submission received: 26 October 2023 / Revised: 18 December 2023 / Accepted: 22 January 2024 / Published: 25 January 2024
(This article belongs to the Section Animal Genetics and Genomics)

Abstract

:

Simple Summary

The effect of Scalarpin 2 (STC2) on chicken hepatic lipid metabolism is still unknown. In this study, we found that genetic variation rs9949205 occurring in the STC2 was significantly associated with chicken body weight at different weeks and carcass traits. The inhibitory effect of STC2 on lipid synthesis in LMH cells was observed, and its expression level in muscle showed a significant association with 176 lipids, predominantly enriched in essential omega-3 and omega-6 fatty acids. The evidence suggests that STC2 involved growth and development, as well as lipid metabolism in chickens.

Abstract

Stanniocalcin 2 (STC2) is a secreted glycoprotein involved in multiple biological processes. To systemically study the biological role of STC2 in chickens, phylogenetic tree analysis and conservation analysis were conducted. Association analysis between variations in the STC2 gene and the economic traits of Gushi-Anka F2 was conducted. The tissue expression patterns of STC2 expression in different chicken tissues and liver at different stages were detected. The biological role of STC2 in chicken liver was investigated through overexpression and interfering methods in the LMH cell line. Correlation analyses between STC2 expression and lipid components were conducted. (1) The phylogenetic tree displayed that chicken STC2 is most closely related with Japanese quail and most distantly related with Xenopus tropicalis. STC2 has the same identical conserved motifs as other species. (2) rs9949205 (T > C) found in STC2 intron was highly significantly correlated with chicken body weight at 0, 2, 4, 6, 8, 10 and 12 weeks (p < 0.01). Extremely significant correlations of rs9949205 with semi-evisceration weight (SEW), evisceration weight (EW), breast muscle weight (BMW), leg muscle weight (LMW), liver weight and abdominal fat weight (AFW) were revealed (p < 0.01). Significant associations between rs9949205 and abdominal fat percentage, liver weight rate, breast muscle weight rate and leg muscle weight rate were also found (p < 0.05). Individuals with TT or TC genotypes had significantly lower abdominal fat percentage and liver weight rate compared to those with the CC genotype, while their body weight and other carcass traits were higher. (3) STC2 showed a high expression level in chicken liver tissue, which significantly increased with the progression of age (p < 0.05). STC2 was observed to inhibit the content of lipid droplets, triglycerides (TG) and cholesterol (TC), as well the expression level of genes related to lipid metabolism in LMH cells. (4) Correlation analysis showed that the STC2 gene was significantly correlated with 176 lipids in the breast muscle (p < 0.05) and mainly enriched in omega-3 and omega-6 unsaturated fatty acids. In conclusion, the STC2 gene in chicken might potentially play a crucial role in chicken growth and development, as well as liver lipid metabolism and muscle lipid deposition. This study provides a scientific foundation for further investigation into the regulatory mechanism of the STC2 gene on lipid metabolism and deposition in chicken liver.

1. Introduction

In chicken, the de novo biosynthesis of lipids mostly (90%) occurs in the liver [1,2,3]. After synthesis, lipids are assembled into lipoproteins and transported via the bloodstream to target tissues, where they undergo hydrolysis and release fatty acids for utilization or storage [4,5,6]. The level of lipogenesis in chicken liver and fat deposition in the muscle are crucial factors that significantly affect chicken meat quality, thereby determining the overall quality and nutritional value of the meat [7,8]. Meanwhile, chicken hepatic steatosis is a prevalent manifestation of fatty liver, accompanied by an imbalance in hepatic lipid accumulation, transportation and metabolism [9,10,11], which has a detrimental effect on the health and productivity of laying hens, resulting in economic losses to the poultry industry. Therefore, an in-depth understanding of the key genes involved in controlling lipid homeostasis of chicken can contribute to enhancing poultry health, reproductive performance and meat quality. Consequently, this will enable improvement in feed conversion efficiency (FCE) and breeding efficiency.
Stanniocalcin 2 (STC2) is a secreted glycoprotein involved in multiple biological processes [12,13,14]. Related studies have shown that STC2 is associated with glucose homeostasis and phosphorus metabolism [15,16], proliferation, invasion and metastasis of various cancers [17,18,19]. In addition, STC2 was reported to regulate feeding behavior and body weight in mice [20,21]. The protective effects of STC2 in mice on the pancreas, liver and adipose tissue have been demonstrated [22,23,24]. Zhao et al. (2018) revealed that mouse STC2 ameliorates hepatic steatosis by activating Signal Transducer and Activator of Transcription 3 (STAT3) signaling through in vivo and in vitro assays [25]. Sarapio et al. (2019) revealed that STC2 could decrease triacylglycerol synthesis, reducing glyceride/glycerol generation from 14C-glucose, direct phosphorylation of glycerol and fatty acid synthesis from 14C-glucose in eWAT of fed rats [26]. Khal et al. (2021) also demonstrated STC2 involvement in the mammalian liver gluconeogenesis pathway [27]. Joshi et al. (2022) identified mouse STC2, a novel aryl hydrocarbon receptor (AhR) target gene regulated by endogenous AhR agonists and tryptophan metabolite cinnabaric acid (CA) as having a protective effect on cells with alcohol-induced liver injury [28]. Patil et al. (2023) found that CA-induced AhR-mediated STC2 induction can attenuate fatty liver degeneration, inflammation and liver injury in Non-Alcoholic Fatty Liver Disease (NAFLD) [29]. The aforementioned articles suggest that STC2 is involved in regulating lipid metabolism in mammals and might exert a positive effect in controlling hepatic lipid metabolism homeostasis.
However, until now, few reports on the STC2 gene have existed regarding chicken, especially regarding hepatic lipid metabolism. Mittapalli et al. (2006) cloned chicken STC2 and found that it is expressed in developing rhabdomyosarcoma and joints [30]. Sah et al. (2018) found that the STC2 gene is associated with eggshell mineralization and can increase alkaline phosphatase activity [31]. Action of STC2 on lipid metabolism remains poorly understood in chicken, and our question is does STC2 control lipid metabolism in chicken? The present study systematically investigated the evolutionary conservation, expression pattern and genetic variants of the chicken STC2 gene, as well as its involvement in lipid metabolism. Additionally, we examined the correlation between STC2 gene expression levels and the molecular composition of pectoral intramuscular fat. The findings of this research serve as a valuable guide and reference for further investigation into the role of STC2 in lipid metabolism, as well as for genetic enhancement in chicken breeding.

2. Materials and Methods

2.1. Sample Collection

The experimental chickens (Lushi blue-shell hens) were provided by the germplasm resource farm of Henan Agricultural University. All chickens were caged under the same environmental conditions and had ad libitum access to feed and water, in accordance with China’s yellow-feathered broiler rearing and management technical regulations (NY/T 1871-2010) [32]. The method of euthanasia for chickens is cervical dislocation. The liver tissues of chickens at the age of 10, 20, 30, 50 and 75 weeks old were collected with eight birds in each time point. The liver, duodenum, spleen, ovary, heart, kidney, leg muscle and pectoral muscle tissues were harvested from Lushi blue-shell hens at the age of 20 weeks old. All collected samples were immediately frozen in liquid nitrogen and subsequently stored at −80 °C.

2.2. Bioinformatics Analysis and SNP Site Screening

The amino acid sequences of STC2 from different species were downloaded from the National Center for Biotechnology Information database (GRCg7b, NCBI: https://www.ncbi.nlm.nih.gov/, accessed on 22 September 2023). The software Molecular Evolutionary Genetics Analysis version 10.0 (MEGA10.0) was utilized to perform a comparative analysis of the amino acid sequences of STC2 across various species and construct a phylogenetic tree. The online software MEME (Version 5.5.5) (https://meme-suite.org/meme/tools/meme, accessed on 23 September 2023) was utilized to analyze the conservative motif of STC2 amino acid sequence.
DNA sequence of chicken STC2 gene (containing promoter region 2000 bp) was downloaded from the NCBI database (GRCg6a, NCBI, such as https://www.ncbi.nlm.nih.gov/genome/gdv/browser/genome/?id=GCF_000002315.6, accessed on 24 May 2023). The SNP sites occurring in STC2 gene were screened from the GBS database of Gushi × Anka F2 resource population previously published by Zhang et al. [33].

2.3. Phenotype Data Collection

A total of 734 chickens from Gushi × Anka F2 resource population generated as described previously [34] were used for association analysis. The BW traits of the F2 resource population at the ages of 0, 2, 4, 6, 8, 10 and 12 weeks were recorded, respectively. The carcass traits including semi-evisceration weight (SEW), evisceration weight (EW), breast muscle weight (BMW), leg muscle weight (LMW), liver weight, abdominal fat weight (AFW) and some corresponding percentages were measured after the chickens were slaughtered at 12 weeks.
The intramuscular fat (IMF) content was determined using the Soxhlet (2014) extraction method [35]. For the high groups (G43wHM) and low IMF groups (G43wLM) of the Gushi chicken, refer to the description of Wang et al. (2023) [36]. The non-targeted lipidomic data and transcriptome data of pectoral muscles from 43-week-old Gushi hens with high IMF (n = 8) and low IMF (n = 8) content were obtained from our previously reported information [37]. These Gushi chickens were housed in individual cages with a coop temperature of 25–28 °C and humidity of 40–70%; they were fed with a standard commercial corn/soybean diet and water ad libitum; after 14 weeks of age, the feed contained 12.75 MJ kg−1 of metabolizable energy (ME) and 15.6% crude protein (CP). The lipidomic data included 733 lipid molecules belonging to four distinct categories, namely sterol lipids, sphingolipids, glycerophospholipids and glycerides.

2.4. Vector Construction and Small Interfering RNA (siRNA) Synthesis

The STC2 gene coding sequence (CDS) including HindIII and EcoRI restriction endonuclease sites was cloned. The overexpression plasmid of STC2 gene was constructed using pcDNA3.1 vector (Invitrogen, Carlsbad, CA). The pcDNA3.1 vector was digested with the HindIII and EcoRI. The linearized pcDNA3.1 vector and STC2 gene CDS fragments are ligated with T4 DNA ligase (NEB, Beijing, China). The primer sequences are shown in Table 1.

2.5. Culture and Treatment of Chicken Leghorn Male Hepatoma (LMH) Cell Line

Chicken LMH cells were purchased from the American Type Culture Collection (ATCC) (Manassas, VA, USA). LMH cells were cultured in DMEM/F12 medium containing 10% fetal bovine serum (FBS) (BI, Kibbutz, Beit Haemek, Israel), 1% penicillin G (100 U/mL) and streptomycin (100 µg/mL) (Solarbio, Beijing, China). The culture plates were placed in an incubator containing 5% CO2 at 37 °C. When LMH cells fusion reached 70–80%, they were transfected with pcDNA3.1 vector and STC2 recombination vector pcDNA3.1-STC2 using lipofectamine 3000 reagent (Invitrogen, Carlsbad, MA, USA), respectively. Meanwhile, the siRNA of STC2 (siRNA-STC2) and the negative control siRNA (siRNA-NC) were transfected into LMH cells, respectively. After treated for 24 h, cells were collected to evaluate the effect of STC2 gene on TG and TC synthesis and the expression levels of lipid-metabolism-related genes. All experiments were repeated at least three times independently.

2.6. RNA Exaction, cDNA Synthesis and Quantitative Real-Time PCR (qRT-PCR)

The total RNA was extracted from tissues and cells according to the instructions of Trizol kit (Vazyme, Nanjing, China). The RNA quality was detected through agarose-gel electrophoresis and NanoDrop2000 (Thermo Scientific, Wilmington, DE, USA) ultraviolet spectrophotometer, respectively, and diluted to the same concentration with RNase-free water. According to the instructions of PrimeScriptTM RT reagent Kit (Vazyme, Nanjing, China), the cDNA was synthesized and stored at −20 °C.
The qRT-PCR was carried out on a LightCycler® 96 instrument using the SYBR Green method. GAPDH was used as the reference gene. The reaction components consisted of 5 µL 2× QuantiFast SYBR Green Master Mix, 0.5 μL each of 10 nmol·L−1 forward and reverse primers, 1 µL cDNA, supplemented with RNase-free water to 10 µL. The reaction procedure included pre-denaturation at 95 ℃ for 5 min, followed by 35 cycles of amplification (denatured at 95 °C for 30 s, annealed at 60 °C for 30 s, extended at 72 °C for 30 s); the final elongation was 10 min at 72 °C.
The primers were designed using the NCBI Primer-BLAST tool (https://www.ncbi.nlm.nih.gov/tools/primer-blast/, accessed on 9 May 2022) and synthesized in Beijing Tsingke Biotech Co., Ltd. Company (Beijing, China). The primers information is listed in Table 2.

2.7. Detection of Intracellular Triglycerides and Cholesterol

To detect the intracellular TG and TC, cells were harvested and washed twice with 1% PBS. The intracellular TG and TC were measured according to the Cell TG and T-CHO ELISA kit instructions (Applygen, Beijing, China), respectively. The total intracellular protein was determined using the BCA Protein Assay kit (Applygen, Beijing, China).

2.8. Oil Red O Staining

In order to analyze the accumulation of intracellular lipid droplets, Oil Red O staining was performed. The cells were washed twice with PBS and fixed in 4% paraformaldehyde solution (Solarbio, Beijing, China) for 30 min at room temperature. Then, cells were stained with Oil Red O working solution (Sigma-Aldrich, St. Louis, MO, USA). After stained for 1 h, they were washed three times with PBS and then photographed at 200× magnification. Intracellular Oil Red O was dissolved using 100% isopropyl alcohol for 5 min, and the content of lipid droplets was quantified spectrophotometrically by measuring the absorbance at 510 nm [38,39].

2.9. Statistical Analysis

The association analyses were determined using the generalized linear mixed model (GLM) procedure in SPSS 24.0 (IBM, Chicago, IL, USA). The models were as follows:
Model I: Yijklm = µ + Gi + Hk + fl + eijklm
Model   II :   Y i j k l m = μ + G i + H k + f l   + b   ( W i j k l m   W ¯ )   +   e i j k l m
Model I was used for association analysis between SNP and growth traits. Considering the effect of body weight on carcass traits, Model II was used for association analysis between SNP and carcass traits, where carcass weight was included as a covariate. The Yijklm was the dependent variable (individual phenotype values), µ was the observation mean, Gi was the fixed effect of SNP genotype (i = genotypes), Hk was the effect of batch (k = 1, 2), fl was random effect of familial effect (l = 1, 7), b was the regression coefficient for the carcass weight, Wijklm was the individual carcass weight and W ¯ was the average carcass weight and eiklm the random error. Multiple comparisons were conducted using Bonferroni’s correction. p < 0.05 was determined as significance.
The correlation analysis between the expression level of STC2 gene and lipid contents of muscle tissue was analyzed using Pearson’s correlation. The relative expression level of mRNA was calculated using the 2−ΔΔct method; the relative expression level of gene was normalized to GAPDH. Data were expressed as mean ± SEM. Significant difference between groups was compared using Student’s t-test and one-way ANOVA. p < 0.01 is considered highly significant; p < 0.05 is considered significant. All data were visualized using GraphPad Prism 8.0 software.

3. Results

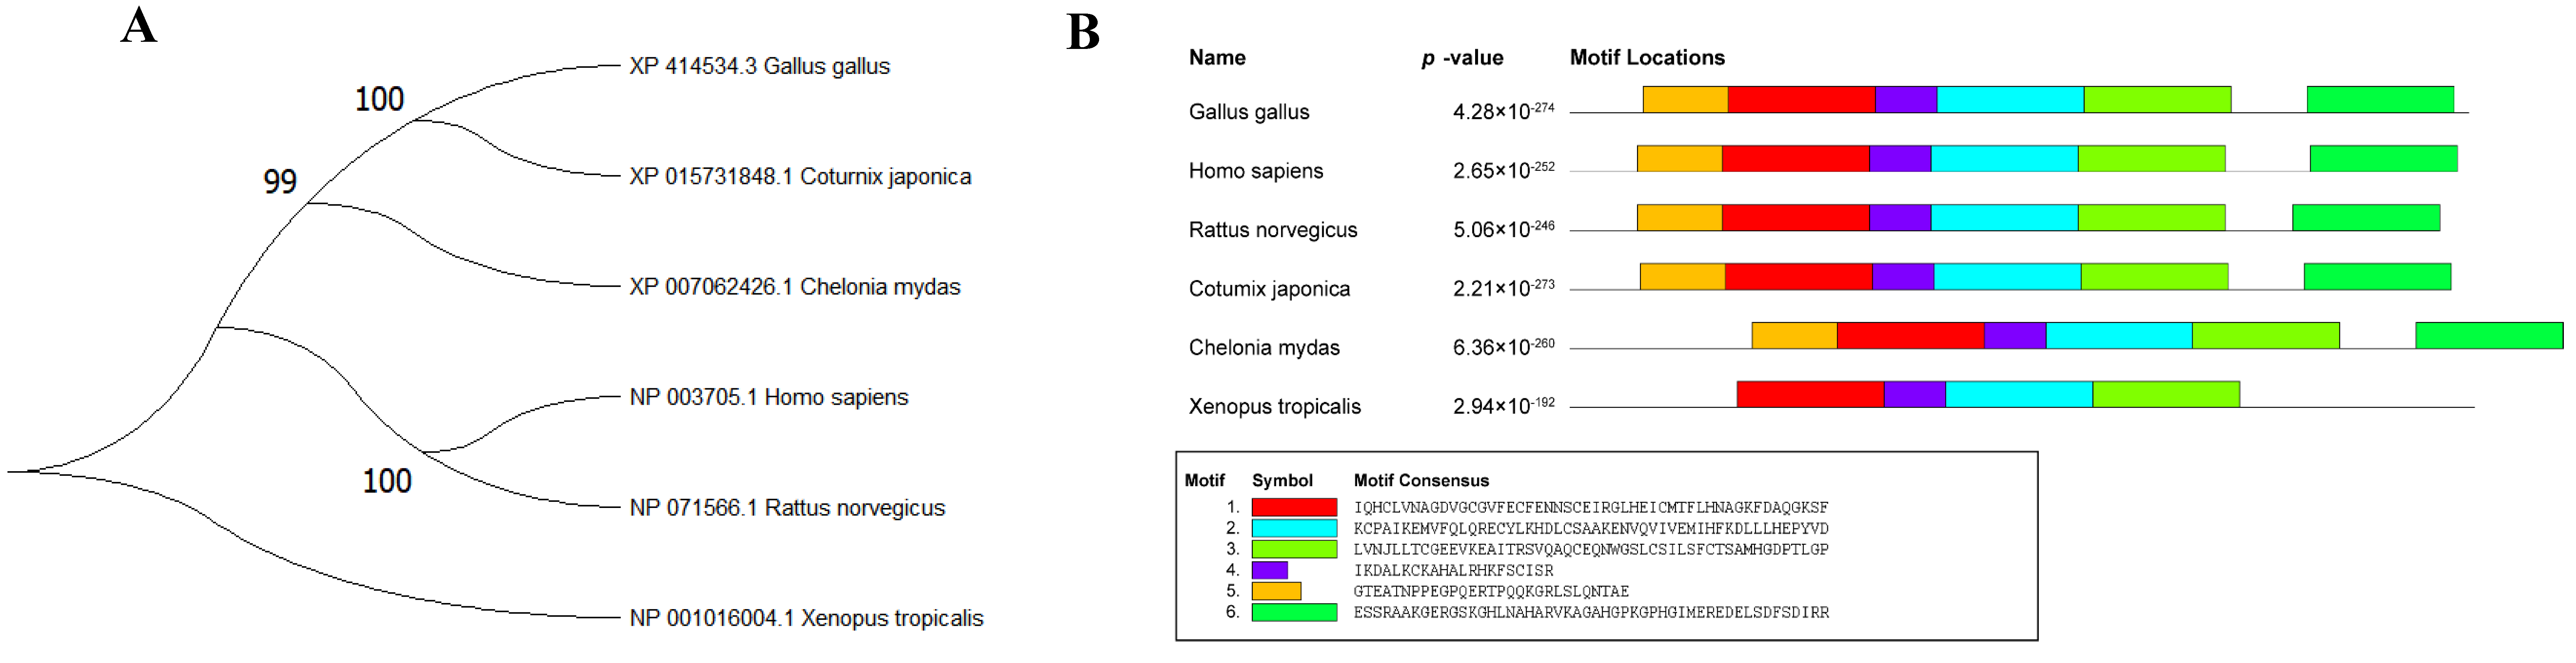
3.1. Phylogenetic Tree Construction and Conserved Motif Analysis of Different Species of STC2

The phylogenetic analysis revealed that STC2 of chicken and Japanese quail exhibited the closest evolutionary relationship, followed by green sea turtle, while Xenopus tropicalis was found to be the most distantly related species (Figure 1A). The conservativeness analysis revealed a high degree of conservation between chicken STC2 and the other five species, as evidenced by the presence of six identical conserved motifs (Figure 1B).

3.2. Association Analysis between Polymorphism in STC2 Gene and Chicken Growth and Carcass Traits

In order to understand the effect of the genetic variation that occurred in the STC2 gene on chicken growth and carcass traits, the correlation analysis between the STC2 gene SNP genotype and growth and carcass traits involved Gushi-Anka F2 population. Based on the genotyping-by-sequencing (GBS) data of F2 resource populations obtained from the previous report [33], nine SNPs that occurred in the STC2 gene were detected (Supplementary Table S1). The association analysis results showed that (Table 3) rs9949205 (T > C) was highly significantly associated with chicken body weight at the ages of 0, 2, 4, 6, 8, 10 and 12 weeks, respectively (p < 0.01). For the carcass traits, significant correlations were observed between the rs9949205 and SEW, EW, BMW, LMW, liver weight, AFW and some corresponding percentage traits, respectively (p < 0.05). Except for the abdominal fat weight, abdominal fat percentage and liver weight rate, the rest of the phenotype means of individuals carrying TT or CT genotypes were significantly higher than that CC genotype individuals (p < 0.05). The individuals carrying the CC genotype showed significantly higher phenotype means in abdominal fat percentage and liver weight rate traits than the TT and CT genotypes (p < 0.05).

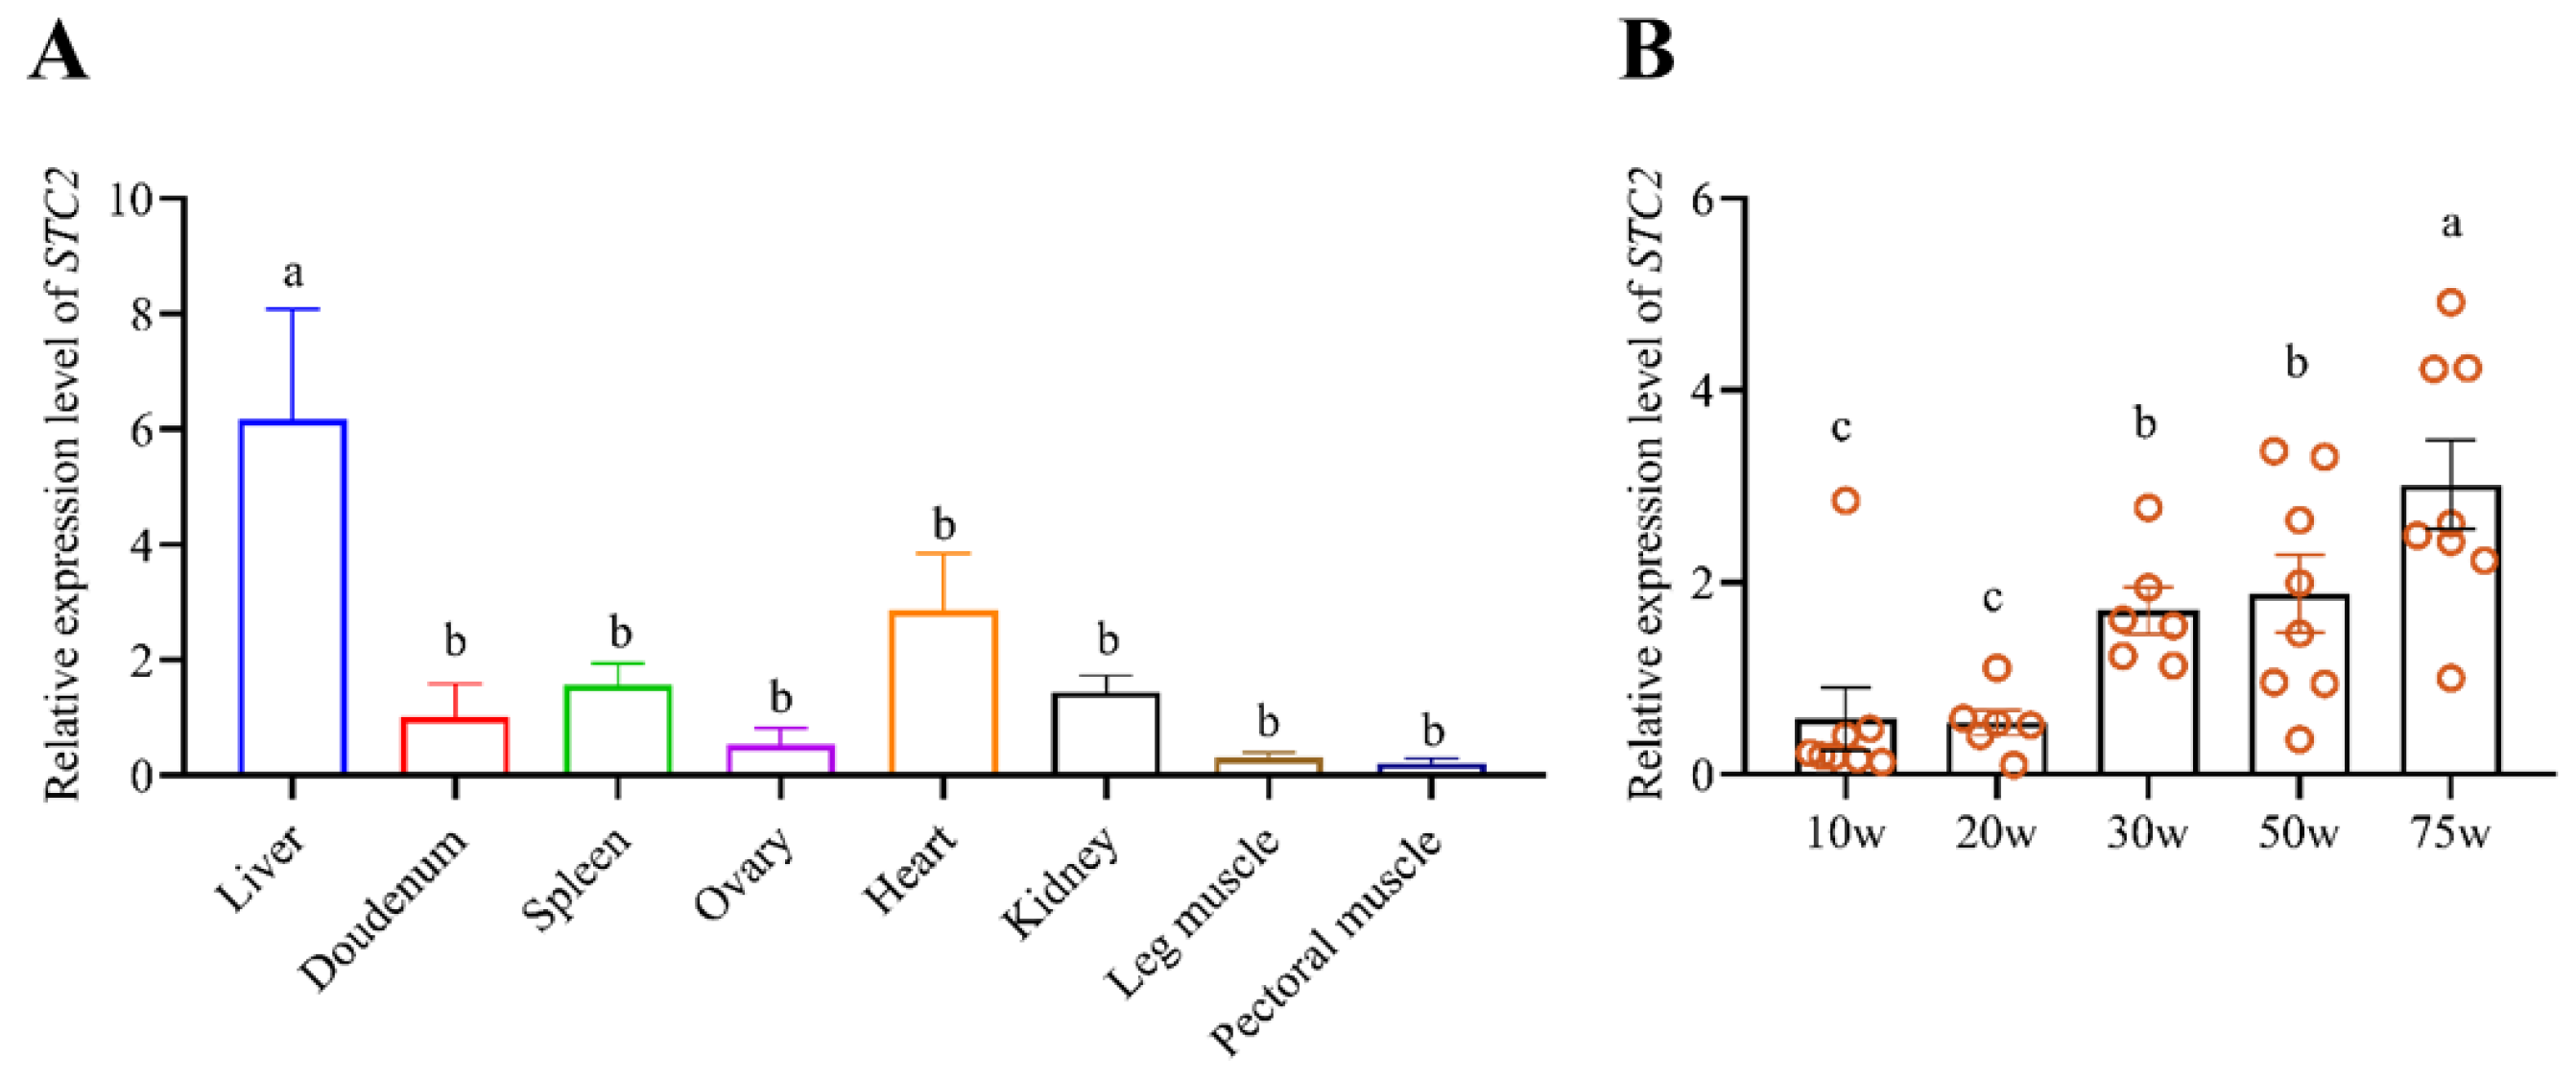
3.3. Expression Pattern of the Chicken STC2 Gene

In order to understand the tissue expression characteristics, the relative expression levels of the STC2 gene in different chicken tissues and liver at different stages were analyzed. The qRT-PCR results showed that the STC2 gene expressed in all the detected tissues and showed the highest expression levels in liver tissue (Figure 2A). Spatio-temporal expression analysis showed that the expression level of the STC2 gene in liver of chicken at 75w was significantly higher than that other stages (p < 0.05). The STC2 expression levels in chicken livers at the ages of 30w and 50w were significantly higher than those at 10w and 20w (p > 0.05). No significant difference was found between 30w and 50w, and the same with 10w and 20w (p > 0.05) (Figure 2B).

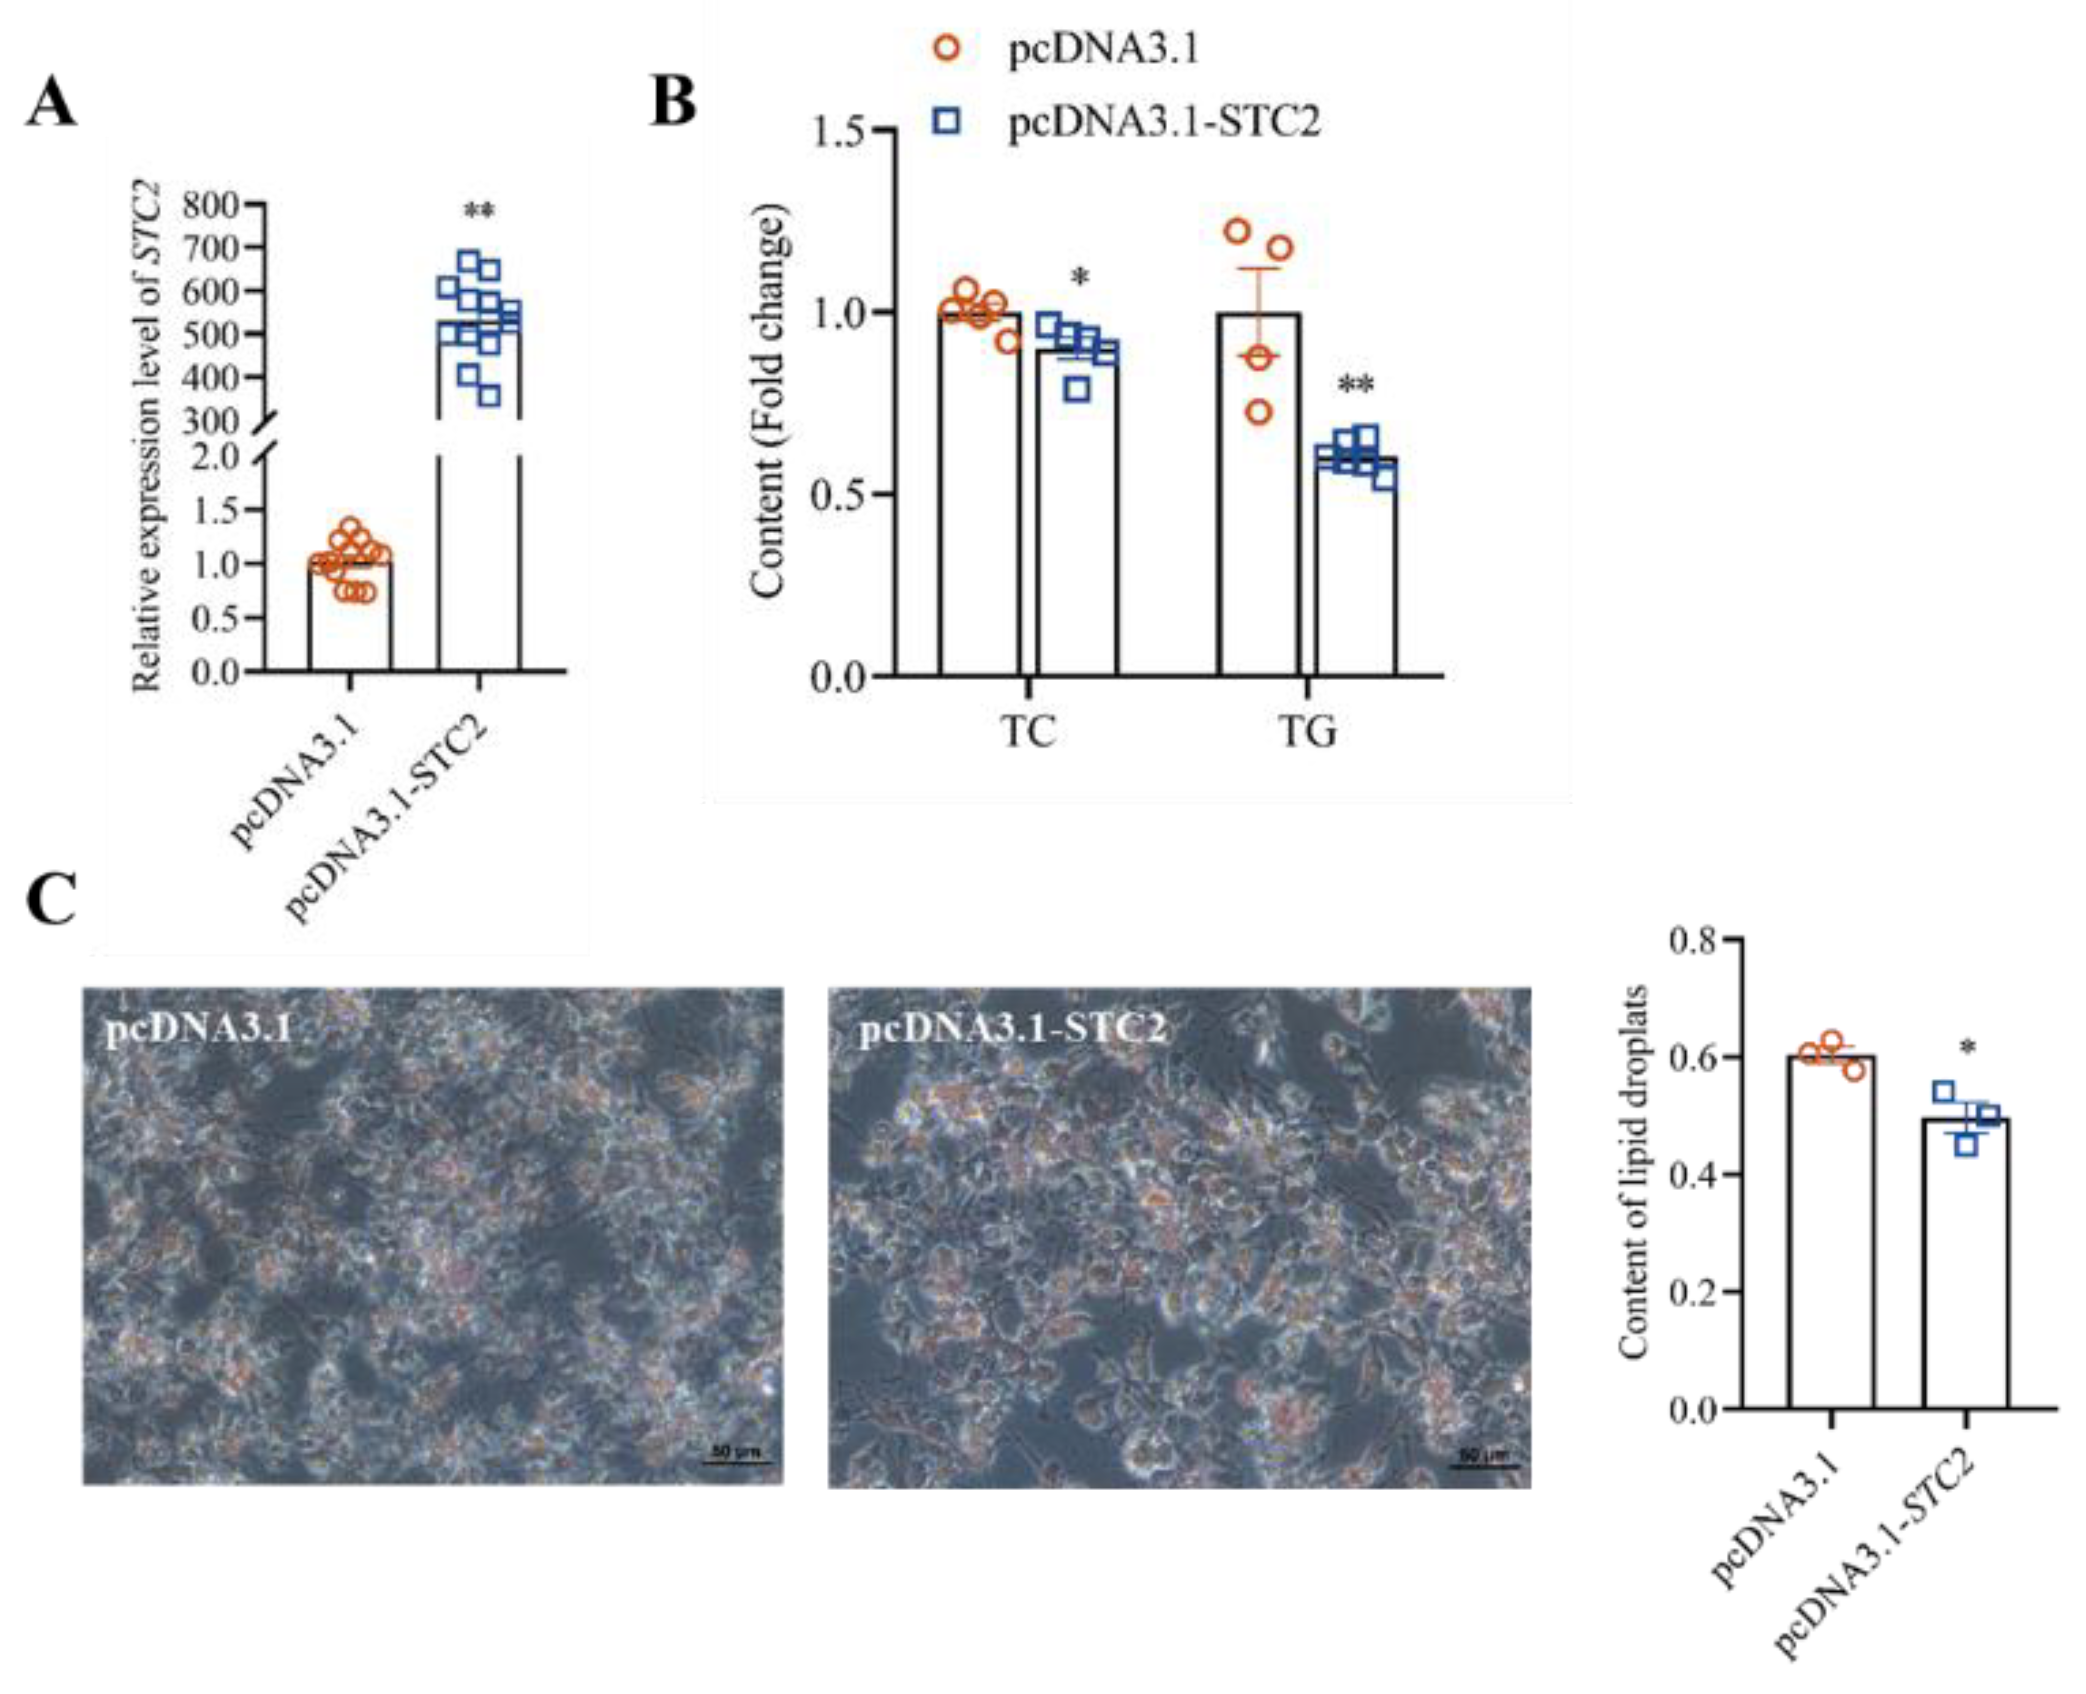
3.4. STC2 Gene Inhibits the Synthesis of TG and TC in LMH Cells

To elucidate the biological function of the STC2 gene in hepatic lipid metabolism of chicken, we transfected the STC2 overexpression vector and the control vector into LMH cells and found that there was a significant difference in the mRNA expression level of STC2 after overexpression (p < 0.01). At the same time, compared with the control vehicle, the contents of intracellular TC and TG were significantly decreased (p < 0.05) (Figure 3B). The intracellular content of lipid droplets in the STC2 overexpressed group was significantly reduced (p < 0.05) (Figure 3C). The TC-synthesis-related genes, including cholesterol synthesis 3-Hydroxy-3-methylglutaryl coenzyme A reductase (HMGCR), sterol regulatory element binding protein 1 (SREBP1), sterol regulatory element binding protein 2 (SREBP2) and squalene epoxidase (SQLE), were significant downregulated (Figure 4A). The fatty-acid-synthesis-related genes, including fatty acid synthesis fatty acid synthase (FASN), acetyl-CoA carboxylase (ACACA) and stearoyl-CoA desaturase (SCD), were significant downregulated in the STC2 overexpression group (Figure 4B). TG-synthesis-related genes, including triglyceride synthesis lipin1 (LPIN1), phosphatidate phosphatase (LPIN2), acylglycerol phosphate acyltransferase 2 (AGPAT2) and diacylglycerol O-Acyltransferase 2 (DGAT2), were significant downregulated (Figure 4C). Lipid-transport-related genes, including very-low-density apolipoprotein II (ApoVLDLII), apolipoprotein B (ApoB) and microsomal triglyceride transfer protein (MTTP), were significantly downregulated (p < 0.05) (Figure 4D).
When LMH cells were treated using siRNA-STC2, the lipid droplet content (Figure 5B), the contents of TC and TG (Figure 5C) and the relative expressions of lipid-metabolism-related genes, including HMGCR, SREBP1, SREBP2, SQLE, FASN, ACACA, SCD, LPIN1, LPIN2, AGPAT2, DGAT2, ApoVLDLII, ApoB and MTTP, were significantly increased compared with the control group (siRNA-NC), respectively (p < 0.05) (Figure 6).

3.5. Correlation Analysis of STC2 Gene Expression with Lipid Molecules

To further investigate the effect of the STC2 gene on different types of lipids and fatty acids component in the pectoral muscle, we evaluated the relationship between STC2 gene expression levels and corresponding lipid molecules in the pectoral muscle of Gushi hens at 43 weeks old (Figure 7). The results showed that the mRNA level of the STC2 gene was higher in the high intramuscular fat group than in the low intramuscular fat group of 43-week-old Gushi chickens (p < 0.05) (Figure 7A). The expression level of the STC2 gene was significantly correlated with 176 lipid molecules (p < 0.05). The above lipid molecules were categorized into four groups, including sterol lipids, sphingolipids, glycerophospholipids and glycerides, and glycerophospholipids exhibited the highest abundance (131/176) (Figure 7B). Further analysis showed that the expression levels of the STC2 gene were mainly positively correlated with 130 lipid molecules in glycerophospholipids, most of which belonged to Phosphatidylcholine (PC), Phosphatidyl ethanolamine (PE), Phospholipids inositol (PI), Lysophosphatidylcholine (LPC), Phosphatidyl glycerol (PG) and Lysophospholipid ethanolamine (LPE) (Figure 7C). Specific lipid molecules are shown in Supplementary Table S2.
Among the 130 positively correlated lipid molecules, the proportions of unsaturated fatty acids in the sn-1 and sn-2 positions were 37% and 72% (Figure 7D), respectively. These polyunsaturated glycerophospholipid molecules were mainly enriched in the essential omega-3 and omega-6 fatty acids, which have beneficial effects on body health (Figure 7E).

4. Discussion

Phylogenetic trees can reflect the affinities and evolutionary history among different species [40,41]. In this study, we constructed evolutionary trees for the amino acid sequences encoded by the STC2 gene in different species and found that chicken STC2 has the closest affinity with birds and may have a closer common ancestor. Conservativeness is to some extent reflected in the similarity of its functions [42], and the chicken STC2 protein sequence is highly conserved among different species and may have similar biological functions.
In recent years, many studies have resolved the genetic mechanisms behind genetic variation that shape phenotypic diversity [43,44]. Jepsen et al. (2015) found that STC2 inhibited mammalian growth by proteolytic inhibition of the insulin-like growth factor axis, and STC2 (C120A), which cannot inhibit PAPP-A, grows like wild-type mice [45]. Marouli et al. (2017) found that genetic variation in the STC2 gene was associated with increased height in humans through genome-wide association analysis [46,47]. Cordero et al. (2019) validated the finding that the STC2 gene is a regulator of myogenesis by analyzing GWAS data from humans and mice [48]. In contrast, the present study investigated for the first time the variation in the STC2 gene and its biological role in lipid metabolism in chickens. According to the GBS data of Gushi-Anka and the F2 resource population previously published by Zhang et al. (2021) [33], the C > T mutation (rs9949205) in the STC2 gene was screened to be significantly related with chicken BW 0, 2, 4, 6, 8, 10, 12 and carcass traits.
Individuals with TT and CT genotypes had significantly higher body weights and carcass weights than individuals with the CC genotype. Conservativeness analysis showed that chicken and mouse have a certain degree of conservativeness, and these five similar conserved motifs may be the main protein sequences for their functions. It is possible that the mutation caused changes in gene expression levels, which in turn affected body weight. Therefore, it is conjectured that the mutant TT genotype and CC genotype of the chicken STC2 gene may have different effects on the individual growth phenotype, which needs to be further verified.
In mammals, liver and adipose tissue serve as the main sites of lipid synthesis; e.g., in pigs, fatty acid synthesis occurs mainly in adipose tissue, whereas, in chickens, liver tissue is the major organ for lipid de novo synthesis [49,50,51,52]. Excessive fat deposition reduces feed remuneration and restricts the development of the poultry industry to a certain extent [53]. We found that the STC2 gene was specifically highly expressed in chicken liver tissues. It is known that more than 90% of de novo synthesis of fatty acids is synthesized in chicken liver [2,54,55], suggesting that the STC2 gene may be involved in lipid metabolism.
In this study, we found that overexpression of STC2 significantly reduced the content of lipid-metabolism-related genes, with a decrease in the accumulation of lipid droplets as well as a significant decrease in the content of TC and TG in LMH cells. Knockdown of the STC2 gene showed the opposite results to that of overexpression. These results validated that the STC2 gene could inhibit the lipid metabolism process in chicken LMH cells. Previous studies have shown that, in mice, the STC2 gene alleviates cellular TG accumulation by inhibiting the lipid de novo synthesis pathway [25]. The results have been consistent with our earlier guesses. Ma et al. (2020) found that overexpression of STC2 significantly reduced lipid droplet formation in human mesenchymal stem cells (hMSC) and led to a significant decrease in peroxisome-proliferator-activated receptor γ (PPARγ) and fatty-acid-binding protein 4 (FABP4) expression [56], which is consistent with the results of the present study. The relative expression levels of STC2 in liver were significantly increased with increased chicken ages. It is well known that lipid deposition in the liver increases with the age of laying hens [57,58]. The STC2 gene was reported to ameliorate hepatic steatosis by activating STAT3 signaling in mice [25]. Fatty liver syndrome (FLS) in chickens involves disorders of nutrient metabolism, impaired liver function and abnormal immune regulation; disorders of hepatic metabolism in chickens affect the normal functions of the liver, such as fatty acid metabolism, cholesterol synthesis, blood glucose regulation and drug metabolism [59]. The above results indicate that STC2 might also exert a similar role in chicken hepatic steatosis, while the possible regulation pathway needs to be deeply investigated further.
Humans and mammals cannot synthesize large amounts of polyunsaturated fatty acids; they must be introduced from the diet. Among them, ω-3 and ω-6 polyunsaturated fatty acids cannot be synthesized by the human body de novo, which is more important. [60,61]. In the present study, we found that the expression levels of the STC2 gene in pectoral muscle are significant correlated with 176 lipid molecules, which mainly belonged to PC, PE, PI, PG, LPC and LPE. The sn-2 position of one of the glycerophospholipid lipids was replaced by a large number of ω-3 and ω-6 long-chain polyunsaturated fatty acids. In recent years, it has been found that ω-3 provides certain benefits for laying hens, broilers and consumers [62,63]. Glycerophospholipids are the most abundant class of phospholipids in the body and play an important role in the study of human cardiovascular metabolic disease risk [64]. In addition, omega-3 fatty acids at the sn-2 position contain eicosapentaenoic acid (EPA), docosapentaenoic acid (DPA) and docosahexaenoic acid (DHA), which act as inflammation antagonists in favor of lowering the risk of cancer and improving the mood of the population, and an increase in the proportion of these fatty acids is beneficial to human health [65]. The ω-6 fatty acids at the sn-2 position contain linoleic acid (LA) and arachidonic acid (ARA), which have contributed significantly to the development of anti-inflammatory drugs as precursors of pro-inflammatory mediators [66], although the relative expression level of STC2 is quite low in pectoral muscle tissue. Stanniocalcin-2 exhibits both paracrine and autocrine effects in mammalian cells [26]. It might influence the lipid type of pectoral muscle via a paracrine manner. Given the above, we found that STC2 genes might be involved in chicken growth, lipid biosynthesis and deposition in muscle through different action mechanisms.

5. Conclusions

In summary, we demonstrated for the first time that SNP rs9949205 in the STC2 gene was significantly associated with chicken body weight at different stages and carcass traits, as well as the abdominal fat deposition in chickens. Moreover, individuals with TT or TC genotypes had significantly lower abdominal fat percentage and liver weight rate but higher body weight and related carcass traits compared to those with the CC genotype. This implies that SNP rs9949205 might serve as a molecular marker for marker-assisted selection in chicken breeding. STC2 was highly expressed in chicken liver tissues and significantly increased with the progression of age. It was observed that STC2 could suppress the synthesis of TC and TG content through decreasing the expression of genes related with lipid synthesis in LMH cells. The correlation analysis showed that the STC2 gene may benefit the meat quality via influencing the ratio of long-chain unsaturated fatty acids and glycerophospholipid molecules enriched in chicken pectoral muscle. Our findings suggest that STC2 might affect chicken growth, IMF and abdominal fat deposition through controlling the lipid metabolism of liver in chicken. However, further research on the biological function of the STC2 gene in chicken growth and lipid metabolism is required.

Supplementary Materials

The following supporting information can be downloaded at https://www.mdpi.com/article/10.3390/ani14030383/s1, Supplementary Table S1: Information of SNPs location on STC2; Supplementary Table S2: List of lipids in intramuscular fat correlated with STC2 expression in pectorals.

Author Contributions

Y.C. planned the research, analyzed the data and drafted the manuscript. Q.J. participated in data analysis and test verification. Y.X. participated in organizing the experimental animals. C.M. and H.G. helped to collect the sample. W.T., X.K. and Y.T. reviewed the manuscript. X.L. conducted critical discussion of this study. H.L. critically discussed the design of the study, supervised the implementation of the study throughout and revised the manuscript. All authors have read and agreed to the published version of the manuscript.

Funding

This work was supported by the Major Scientific and Technological Special Project of Henan Province (No. 221100110200), the Scientific Studio of Zhongyuan Scholars (No. 30601985) and Program for Innovative Research Team (in Science and Technology) in University of Henan Province (No. 21IRTSTHN022).

Institutional Review Board Statement

This study was conducted according to the care and use of experimental animals established by the Ministry of Science and Technology of the People’s Republic of China (approval number: 2006-398). The Institutional Animal Care and Use Committee (IACUC) of Henan Agricultural University (Zhengzhou, China) approved all research protocols involving animal subjects.

Informed Consent Statement

Not applicable as this research did not involve humans.

Data Availability Statement

The data presented in this study are available in article and Supplementary Material.

Conflicts of Interest

The authors declare no conflicts of interest.

References

  1. Leveille, G.A. In vitro hepatic lipogenesis in the hen and chick. Comp. Biochem. Physiol. 1969, 28, 431–435. [Google Scholar] [CrossRef] [PubMed]
  2. Wassie, T.; Cheng, B.; Zhou, T.; Gao, L.; Lu, Z.; Wang, J.; Mulu, B.; Taye, M.; Wu, X. Enteromorpha polysaccharide and yeast glycoprotein mixture improves growth, antioxidant activity, serum lipid profile and regulates lipid metabolism in broiler chickens. Poult. Sci. 2022, 101, 102064. [Google Scholar] [CrossRef] [PubMed]
  3. Liao, Q.; Wu, T.; Fu, Q.; Wang, P.; Zhao, Y.; Li, Y.; Xiao, H.; Zhou, L.; Song, Z. Effects of Dietary Inclusion of β-Hydroxy-β-Methylbutyrate on Growth Performance, Fat Deposition, Bile Acid Metabolism, and Gut Microbiota Function in High-Fat and High-Cholesterol Diet-Challenged Layer Chickens. Curr. Issues Mol. Biol. 2022, 44, 3413–3427. [Google Scholar] [CrossRef] [PubMed]
  4. Sato, K.; Akiba, Y.; Chida, Y.; Takahashi, K. Lipoprotein hydrolysis and fat accumulation in chicken adipose tissues are reduced by chronic administration of lipoprotein lipase monoclonal antibodies. Poult. Sci. 1999, 78, 1286–1291. [Google Scholar] [CrossRef] [PubMed]
  5. Cui, H.; Zheng, M.; Zhao, G.; Liu, R.; Wen, J. Identification of differentially expressed genes and pathways for intramuscular fat metabolism between breast and thigh tissues of chickens. BMC Genom. 2018, 19, 55. [Google Scholar] [CrossRef]
  6. Tunim, S.; Phasuk, Y.; Aggrey, S.E.; Duangjinda, M. Increasing Fat Deposition Via Upregulates the Transcription of Peroxisome Proliferator-Activated Receptor Gamma in Native Crossbred Chickens. Animals 2021, 11, 90. [Google Scholar] [CrossRef] [PubMed]
  7. Ding, X.; Giannenas, I.; Skoufos, I.; Wang, J.; Zhu, W. The effects of plant extracts on lipid metabolism of chickens—A review. Anim. Biosci. 2023, 36, 679–691. [Google Scholar] [CrossRef] [PubMed]
  8. Gou, Z.Y.; Cui, X.Y.; Li, L.; Fan, Q.L.; Lin, X.J.; Wang, Y.B.; Jiang, Z.Y.; Jiang, S.Q. Effects of dietary incorporation of linseed oil with soybean isoflavone on fatty acid profiles and lipid metabolism-related gene expression in breast muscle of chickens. Animal 2020, 14, 2414–2422. [Google Scholar] [CrossRef]
  9. Lin, C.W.; Huang, T.W.; Peng, Y.J.; Lin, Y.Y.; Mersmann, H.J.; Ding, S.T. A novel chicken model of fatty liver disease induced by high cholesterol and low choline diets. Poult. Sci. 2021, 100, 100869. [Google Scholar] [CrossRef]
  10. Chokeshaiusaha, K.; Sananmuang, T.; Puthier, D.; Nguyen, C. Cross-species analysis of differential transcript usage in humans and chickens with fatty liver disease. Vet. World 2023, 16, 1964–1973. [Google Scholar] [CrossRef]
  11. Flees, J.; Rajaei-Sharifabadi, H.; Greene, E.; Beer, L.; Hargis, B.M.; Ellestad, L.; Porter, T.; Donoghue, A.; Bottje, W.G.; Dridi, S. Effect of Morinda citrifolia (Noni)-Enriched Diet on Hepatic Heat Shock Protein and Lipid Metabolism-Related Genes in Heat Stressed Broiler Chickens. Front. Physiol. 2017, 8, 919. [Google Scholar] [CrossRef]
  12. Charpentier, A.H.; Bednarek, A.K.; Daniel, R.L.; Hawkins, K.A.; Laflin, K.J.; Gaddis, S.; MacLeod, M.C.; Aldaz, C.M. Effects of estrogen on global gene expression: Identification of novel targets of estrogen action. Cancer Res. 2000, 60, 5977–5983. [Google Scholar] [PubMed]
  13. Wu, Z.; Cheng, H.; Liu, J.; Zhang, S.; Zhang, M.; Liu, F.; Li, Y.; Huang, Q.; Jiang, Y.; Chen, S.; et al. The Oncogenic and Diagnostic Potential of Stanniocalcin 2 in Hepatocellular Carcinoma. J. Hepatocell. Carcinoma 2022, 9, 141–155. [Google Scholar] [CrossRef] [PubMed]
  14. Li, Q.; Zhou, X.; Fang, Z.; Pan, Z. Effect of STC2 gene silencing on colorectal cancer cells. Mol. Med. Rep. 2019, 20, 977–984. [Google Scholar] [CrossRef] [PubMed]
  15. Li, S.; Huang, Q.; Li, D.; Lv, L.; Li, Y.; Wu, Z. The significance of Stanniocalcin 2 in malignancies and mechanisms. Bioengineered 2021, 12, 7276–7285. [Google Scholar] [CrossRef] [PubMed]
  16. Tang, Y.; Guo, C.; Chen, C.; Zhang, Y. Characterization of cellular senescence patterns predicts the prognosis and therapeutic response of hepatocellular carcinoma. Front. Mol. Biosci. 2022, 9, 1100285. [Google Scholar] [CrossRef]
  17. Hou, J.; Wang, Z.; Xu, H.; Yang, L.; Yu, X.; Yang, Z.; Deng, Y.; Meng, J.; Feng, Y.; Guo, X.; et al. Stanniocalicin 2 suppresses breast cancer cell migration and invasion via the PKC/claudin-1-mediated signaling. PLoS ONE 2015, 10, e0122179. [Google Scholar] [CrossRef]
  18. Roche, F.P.; Pietilä, I.; Kaito, H.; Sjöström, E.O.; Sobotzki, N.; Noguer, O.; Skare, T.P.; Essand, M.; Wollscheid, B.; Welsh, M.; et al. Leukocyte Differentiation by Histidine-Rich Glycoprotein/Stanniocalcin-2 Complex Regulates Murine Glioma Growth through Modulation of Antitumor Immunity. Mol. Cancer Ther. 2018, 17, 1961–1972. [Google Scholar] [CrossRef]
  19. Watanabe, T.; Shiozawa, M.; Kimura, Y.; Hiroshima, Y.; Hashimoto, I.; Komori, K.; Watanabe, H.; Kano, K.; Fujikawa, H.; Aoyama, T.; et al. Clinical Significance of Stanniocalcin2 mRNA Expression in Patients with Colorectal Cancer. Anticancer Res. 2021, 41, 2117–2122. [Google Scholar] [CrossRef]
  20. Chang, A.C.; Hook, J.; Lemckert, F.A.; McDonald, M.M.; Nguyen, M.A.; Hardeman, E.C.; Little, D.G.; Gunning, P.W.; Reddel, R.R. The murine stanniocalcin 2 gene is a negative regulator of postnatal growth. Endocrinology 2008, 149, 2403–2410. [Google Scholar] [CrossRef]
  21. Jiao, Y.; Zhao, J.; Shi, G.; Liu, X.; Xiong, X.; Li, X.; Zhang, H.; Ma, Q.; Lu, Y. Stanniocalcin2 acts as an anorectic factor through activation of STAT3 pathway. Oncotarget 2017, 8, 91067–91075. [Google Scholar] [CrossRef] [PubMed]
  22. Ail, D.; Samardzija, M.; Chang, A.C.M.; Keck, J.; Reddel, R.R.; Grimm, C. Stanniocalcin2, but Not Stanniocalcin1, Responds to Hypoxia in a HIF1-Dependent Manner in the Retina. Front. Neurosci. 2022, 16, 882559. [Google Scholar] [CrossRef] [PubMed]
  23. Niu, X.; Zhan, Y.; Zhang, S.; Liu, Z.; Qu, C. Research progress of STC2 in breast cancer. Biophys. Rep. 2021, 7, 185–192. [Google Scholar] [CrossRef] [PubMed]
  24. Hjortebjerg, R.; Bojsen-Møller, K.N.; Søeby, M.; Oxvig, C.; Madsbad, S.; Frystyk, J. Metabolic improvement after gastric bypass correlates with changes in IGF-regulatory proteins stanniocalcin-2 and IGFBP-4. Metabolism 2021, 124, 154886. [Google Scholar] [CrossRef] [PubMed]
  25. Zhao, J.; Jiao, Y.; Song, Y.; Liu, J.; Li, X.; Zhang, H.; Yang, J.; Lu, Y. Stanniocalcin 2 Ameliorates Hepatosteatosis Through Activation of STAT3 Signaling. Front. Physiol. 2018, 9, 873. [Google Scholar] [CrossRef] [PubMed]
  26. Sarapio, E.; De Souza, S.K.; Model, J.F.A.; Trapp, M.; Da Silva, R.S.M. Stanniocalcin-1 and -2 effects on glucose and lipid metabolism in white adipose tissue from fed and fasted rats. Can. J. Physiol. Pharmacol. 2019, 97, 916–923. [Google Scholar] [CrossRef] [PubMed]
  27. Khal De Souza, S.; Sarapio, E.; Lopes Vogt, E.; Schein, V.; Bandeira Fabres, R.; Felipe Argenta Model, J.; Vieira Lima, M.; Santos Rocha, D.; Silveira Martins Da Silva, R. Effects of stanniocalcin hormones on rat hepatic glucose homeostasis under fed and fasted conditions. Gen. Comp. Endocrinol. 2021, 302, 113661. [Google Scholar] [CrossRef] [PubMed]
  28. Joshi, A.D.; Thinakaran, G.; Elferink, C. Cinnabarinic Acid-Induced Stanniocalcin 2 Confers Cytoprotection against Alcohol-Induced Liver Injury. J. Pharmacol. Exp. Ther. 2022, 381, 1–11. [Google Scholar] [CrossRef]
  29. Patil, N.Y.; Friedman, J.E.; Joshi, A.D. Role of Hepatic Aryl Hydrocarbon Receptor in Non-Alcoholic Fatty Liver Disease. Receptors 2023, 2, 1–15. [Google Scholar] [CrossRef]
  30. Mittapalli, V.R.; Pröls, F.; Huang, R.; Christ, B.; Scaal, M. Avian stanniocalcin-2 is expressed in developing striated muscle and joints. Anat. Embryol. 2006, 211, 519–523. [Google Scholar] [CrossRef]
  31. Sah, N.; Kuehu, D.L.; Khadka, V.S.; Deng, Y.; Peplowska, K.; Jha, R.; Mishra, B. RNA sequencing-based analysis of the laying hen uterus revealed the novel genes and biological pathways involved in the eggshell biomineralization. Sci. Rep. 2018, 8, 16853. [Google Scholar] [CrossRef] [PubMed]
  32. NY/T 1871-2010; China’s Yellow-Feathered Broiler Rearing and Management Technical Regulations. China Agriculture Press: Beijing, China, 2010.
  33. Zhang, Y.; Wang, Y.; Li, Y.; Wu, J.; Wang, X.; Bian, C.; Tian, Y.; Sun, G.; Han, R.; Liu, X.; et al. Genome-wide association study reveals the genetic determinism of growth traits in a Gushi-Anka F(2) chicken population. Heredity 2021, 126, 293–307. [Google Scholar] [CrossRef] [PubMed]
  34. Han, R.L.; Lan, X.Y.; Zhang, L.Z.; Ren, G.; Jing, Y.J.; Li, M.J.; Zhang, B.; Zhao, M.; Guo, Y.K.; Kang, X.T.; et al. A novel single-nucleotide polymorphism of the visfatin gene and its associations with performance traits in the chicken. J. Appl. Genet. 2010, 51, 59–65. [Google Scholar] [CrossRef] [PubMed]
  35. Hopkins, D.L.; Clayton, E.H.; Lamb, T.A.; van de Ven, R.J.; Refshauge, G.; Kerr, M.J.; Bailes, K.; Lewandowski, P.; Ponnampalam, E.N. The impact of supplementing lambs with algae on growth, meat traits and oxidative status. Meat Sci. 2014, 98, 135–141. [Google Scholar] [CrossRef] [PubMed]
  36. Wang, D.; Qin, P.; Zhang, K.; Wang, Y.; Guo, Y.; Cheng, Z.; Li, Z.; Tian, Y.; Kang, X.; Li, H.; et al. Integrated LC/MS-based lipidomics and transcriptomics analyses revealed lipid composition heterogeneity between pectoralis intramuscular fat and abdominal fat and its regulatory mechanism in chicken. Food Res. Int. 2023, 172, 113083. [Google Scholar] [CrossRef] [PubMed]
  37. Wang, D.; Li, X.; Zhang, P.; Cao, Y.; Zhang, K.; Qin, P.; Guo, Y.; Li, Z.; Tian, Y.; Kang, X.; et al. ELOVL gene family plays a virtual role in response to breeding selection and lipid deposition in different tissues in chicken (Gallus gallus). BMC Genom. 2022, 23, 705. [Google Scholar] [CrossRef]
  38. Visweswaran, M.; Schiefer, L.; Arfuso, F.; Dilley, R.J.; Newsholme, P.; Dharmarajan, A. Wnt antagonist secreted frizzled-related protein 4 upregulates adipogenic differentiation in human adipose tissue-derived mesenchymal stem cells. PLoS ONE 2015, 10, e0118005. [Google Scholar] [CrossRef]
  39. Di Vincenzo, M.; Martino, M.; Lariccia, V.; Giancola, G.; Licini, C.; Di Benedetto, G.; Arnaldi, G.; Orciani, M. Mesenchymal Stem Cells Exposed to Persistently High Glucocorticoid Levels Develop Insulin-Resistance and Altered Lipolysis: A Promising In Vitro Model to Study Cushing’s Syndrome. Front. Endocrinol. 2022, 13, 816229. [Google Scholar] [CrossRef]
  40. Biggs, J.S.; Watkins, M.; Corneli, P.S.; Olivera, B.M. Defining a Clade by Morphological, Molecular and Toxinological Criteria: Distinctive Forms related to Conus praecellens A. Adams, 1854. Nautilus 2010, 124, 1–19. [Google Scholar]
  41. Tahiri, N.; Veriga, A.; Koshkarov, A.; Morozov, B. Invariant transformers of Robinson and Foulds distance matrices for Convolutional Neural Network. J. Bioinform. Comput. Biol. 2022, 20, 2250012. [Google Scholar] [CrossRef]
  42. Lipman, D.J.; Souvorov, A.; Koonin, E.V.; Panchenko, A.R.; Tatusova, T.A. The relationship of protein conservation and sequence length. BMC Evol. Biol. 2002, 2, 20. [Google Scholar] [CrossRef] [PubMed]
  43. Sha, Y.; Gao, C.; Liu, M.; Zhao, S. Evaluation of the genetic diversity of six Chinese indigenous chickens. Asian-Australas. J. Anim. Sci. 2020, 33, 1566–1572. [Google Scholar] [CrossRef] [PubMed]
  44. Rubin, C.J.; Zody, M.C.; Eriksson, J.; Meadows, J.R.; Sherwood, E.; Webster, M.T.; Jiang, L.; Ingman, M.; Sharpe, T.; Ka, S.; et al. Whole-genome resequencing reveals loci under selection during chicken domestication. Nature 2010, 464, 587–591. [Google Scholar] [CrossRef]
  45. Jepsen, M.R.; Kløverpris, S.; Mikkelsen, J.H.; Pedersen, J.H.; Füchtbauer, E.M.; Laursen, L.S.; Oxvig, C. Stanniocalcin-2 inhibits mammalian growth by proteolytic inhibition of the insulin-like growth factor axis. J. Biol. Chem. 2015, 290, 3430–3439. [Google Scholar] [CrossRef] [PubMed]
  46. Marouli, E.; Graff, M.; Medina-Gomez, C.; Lo, K.S.; Wood, A.R.; Kjaer, T.R.; Fine, R.S.; Lu, Y.; Schurmann, C.; Highland, H.M.; et al. Rare and low-frequency coding variants alter human adult height. Nature 2017, 542, 186–190. [Google Scholar] [CrossRef] [PubMed]
  47. Guo, M.H.; Hirschhorn, J.N.; Dauber, A. Insights and Implications of Genome-Wide Association Studies of Height. J. Clin. Endocrinol. Metab. 2018, 103, 3155–3168. [Google Scholar] [CrossRef] [PubMed]
  48. Hernandez Cordero, A.I.; Gonzales, N.M.; Parker, C.C.; Sokolof, G.; Vandenbergh, D.J.; Cheng, R.; Abney, M.; Sko, A.; Douglas, A.; Palmer, A.A.; et al. Genome-wide Associations Reveal Human-Mouse Genetic Convergence and Modifiers of Myogenesis, CPNE1 and STC2. Am. J. Hum. Genet. 2019, 105, 1222–1236. [Google Scholar] [CrossRef]
  49. Ma, Z.; Li, H.; Zheng, H.; Jiang, K.; Yan, F.; Tian, Y.; Kang, X.; Wang, Y.; Liu, X. Hepatic ELOVL6 mRNA is regulated by the gga-miR-22-3p in egg-laying hen. Gene 2017, 623, 72–79. [Google Scholar] [CrossRef]
  50. Wan, X.; Yang, Z.; Ji, H.; Li, N.; Yang, Z.; Xu, L.; Yang, H.; Wang, Z. Effects of lycopene on abdominal fat deposition, serum lipids levels and hepatic lipid metabolism-related enzymes in broiler chickens. Anim. Biosci. 2021, 34, 385–392. [Google Scholar] [CrossRef]
  51. Zhao, L.; Cai, H.; Wu, Y.; Tian, C.; Wen, Z.; Yang, P. Severe choline deficiency induces alternative splicing aberrance in optimized duck primary hepatocyte cultures. Anim. Biosci. 2022, 35, 1787–1799. [Google Scholar] [CrossRef]
  52. Chen, W.; Ma, H.; Li, B.; Yang, F.; Xiao, Y.; Gong, Y.; Li, Z.; Li, T.; Zeng, Q.; Xu, K.; et al. Spatiotemporal Regulation of Circular RNA Expression during Liver Development of Chinese Indigenous Ningxiang Pigs. Genes 2022, 13, 746. [Google Scholar] [CrossRef] [PubMed]
  53. Pu, L.; Luo, Y.; Wen, Z.; Dai, Y.; Zheng, C.; Zhu, X.; Qin, L.; Zhang, C.; Liang, H.; Zhang, J.; et al. GPX2 Gene Affects Feed Efficiency of Pigs by Inhibiting Fat Deposition and Promoting Muscle Development. Animals 2022, 12, 3528. [Google Scholar] [CrossRef] [PubMed]
  54. O’Hea, E.K.; Leveille, G.A. Lipid biosynthesis and transport in the domestic chick (Gallus domesticus). Comp. Biochem. Physiol. 1969, 30, 149–159. [Google Scholar] [CrossRef]
  55. Yang, L.; Liu, Z.; Ou, K.; Wang, T.; Li, Z.; Tian, Y.; Wang, Y.; Kang, X.; Li, H.; Liu, X. Evolution, dynamic expression changes and regulatory characteristics of gene families involved in the glycerophosphate pathway of triglyceride synthesis in chicken (Gallus gallus). Sci. Rep. 2019, 9, 12735. [Google Scholar] [CrossRef] [PubMed]
  56. Ma, B.; Xu, X.; He, S.; Zhang, J.; Wang, X.; Wu, P.; Liu, J.; Jiang, H.; Zheng, M.; Li, W.; et al. STC2 modulates ERK1/2 signaling to suppress adipogenic differentiation of human bone marrow mesenchymal stem cells. Biochem. Biophys. Res. Commun. 2020, 524, 163–168. [Google Scholar] [CrossRef] [PubMed]
  57. Gu, Y.F.; Chen, Y.P.; Jin, R.; Wang, C.; Wen, C.; Zhou, Y.M. Age-related changes in liver metabolism and antioxidant capacity of laying hens. Poult. Sci. 2021, 100, 101478. [Google Scholar] [CrossRef] [PubMed]
  58. Zhang, L.; Wang, E.; Peng, G.; Wang, Y.; Huang, F. Comprehensive Proteome and Acetyl-Proteome Atlas Reveals Hepatic Lipid Metabolism in Layer Hens with Fatty Liver Hemorrhagic Syndrome. Int. J. Mol. Sci. 2023, 24, 8491. [Google Scholar] [CrossRef]
  59. Liu, Y.; Wang, Y.; Wang, C.; Sun, X.; Gao, S.; Liu, R.; Yang, X. Alterations in hepatic transcriptome and cecum microbiota underlying potential ways to prevent early fatty liver in laying hens. Poult. Sci. 2023, 102, 102593. [Google Scholar] [CrossRef]
  60. Cartoni Mancinelli, A.; Di Veroli, A.; Mattioli, S.; Cruciani, G.; Dal Bosco, A.; Castellini, C. Lipid metabolism analysis in liver of different chicken genotypes and impact on nutritionally relevant polyunsaturated fatty acids of meat. Sci. Rep. 2022, 12, 1888. [Google Scholar] [CrossRef]
  61. Momot, M.; Nogalski, Z.; Pogorzelska-Przybyłek, P.; Sobczuk-Szul, M. Influence of Genotype and Slaughter Age on the Content of Selected Minerals and Fatty Acids in the Longissimus Thoracis Muscle of Crossbred Bulls. Animals 2020, 10, 2004. [Google Scholar] [CrossRef]
  62. Maina, A.N.; Lewis, E.; Kiarie, E.G. Egg production, egg quality, and fatty acids profiles in eggs and tissues in Lohmann LSL lite hens fed algal oils rich in docosahexaenoic acid (DHA). Poult. Sci. 2023, 102, 102921. [Google Scholar] [CrossRef] [PubMed]
  63. Farinon, B.; Molinari, R.; Costantini, L.; Merendino, N. The seed of industrial hemp (Cannabis sativa L.): Nutritional Quality and Potential Functionality for Human Health and Nutrition. Nutrients 2020, 12, 1935. [Google Scholar] [CrossRef] [PubMed]
  64. Chen, S.; Zong, G.; Wu, Q.; Yun, H.; Niu, Z.; Zheng, H.; Zeng, R.; Sun, L.; Lin, X. Associations of plasma glycerophospholipid profile with modifiable lifestyles and incident diabetes in middle-aged and older Chinese. Diabetologia 2022, 65, 315–328. [Google Scholar] [CrossRef] [PubMed]
  65. Ellulu, M.S.; Khaza’ai, H.; Abed, Y.; Rahmat, A.; Ismail, P.; Ranneh, Y. Role of fish oil in human health and possible mechanism to reduce the inflammation. Inflammopharmacology 2015, 23, 79–89. [Google Scholar] [CrossRef]
  66. Innes, J.K.; Calder, P.C. Omega-6 fatty acids and inflammation. Prostaglandins Leukot. Essent. Fatty Acids 2018, 132, 41–48. [Google Scholar] [CrossRef]
Figure 1. Phylogenetic tree and conservation analysis of STC2 in different species. (A) Phylogenetic analysis of STC2 amino acid sequences for species including chicken (Gallus gallus), Japanese quail (Coturnix japonica), green sea turtle (Chelonia mydas), human (Homo sapiens), Norway rat (Rattus norvegicus), tropical (Xenopus tropicalis). Using MEGA10.0 software, the amino acid sequences of STC2 from six species were selected and a rootless neighbor-joining phylogenetic tree was constructed, and the bootstrap test was set to repeat 2000 times. (B) Distribution of STC2 conserved motifs in different species. Different colored boxes indicate different conserved motif sequences.
Animals 14 00383 g001
Figure 2. Expression characteristics of STC2. (A) Expression pattern of STC2 in different tissues of Lushi hens at 30 weeks old (n = 8). (B) The spatio-temporal expression of STC2 in liver tissue of Lushi chickens at different stages (n = 8). w means week. n ≥ 6 for each group. Each dot represents an individual. The relative expression of genes was normalized to GAPDH. Different letters mean significant difference (p < 0.05).
Animals 14 00383 g002
Figure 3. Effects of overexpression of STC2 gene on lipid metabolism in LMH cells. (A) The overexpression efficiency of STC2. (B) Contents of TC and TG in LMH cells. (C) Lipid accumulation was evaluated with Oil Red O staining and quantified by absorbance value of the extracted Oil Red O dye. Each dot represents a repetition (n ≥ 4). * indicates p < 0.05; ** indicates p < 0.01.
Animals 14 00383 g003
Figure 4. Effect of overexpression of STC2 gene on genes related to lipid metabolism in LMH cells. (A) Relative expression levels of TC-synthesis-related genes. (B) Relative expression levels of fatty-acid-synthesis-related genes. (C) Relative expression levels of TG-synthesis-related genes. (D) Relative expression levels of lipid-transporter-related genes. Each dot represents a repetition (n ≥ 4). The mRNA levels of genes were normalized to GAPDH. * indicates p < 0.05; ** indicates p < 0.01.
Animals 14 00383 g004
Figure 5. Effects of interfering with STC2 gene on lipid metabolism in LMH cells. (A) Interference with STC2 gene efficiency assay. (B) Contents of TC and TG in LMH cells. (C) Lipid accumulation was evaluated with Oil Red O staining and quantified by absorbance value of the extracted Oil Red O dye. Each dot represents a repetition (n ≥ 4). * indicates p < 0.05; ** indicates p < 0.01.
Animals 14 00383 g005
Figure 6. Effects of interfering with STC2 gene on genes related to lipid metabolism in LMH cells. (A) Relative expression levels of TC-synthesis-related genes. (B) Relative expression levels of fatty-acid-synthesis-related genes. (C) Relative expression levels of TG-synthesis-related genes. (D) Relative expression levels of lipid-transporter-related genes. Each dot represents a repetition (n ≥ 4). The mRNA levels of genes were normalized to GAPDH. * indicates p < 0.05; ** indicates p < 0.01.
Animals 14 00383 g006
Figure 7. STC2 expression contributes to the long-chain unsaturated glycerophospholipids deposition in intramuscular fat of Gushi chicken. (A) Transcriptomic data of the STC2 gene in the 43-week high and low intramuscular adiposity group. G43wHM (n = 8) indicates high intramuscular fat group; G43wLM (n = 8) indicates low intramuscular fat group. (B) Lipid molecules in intramuscular fat significantly correlated with STC2 expression in pectoralis of Gushi chicken. (C) Map of 130 positively correlated glycerophospholipid lipid molecules. (D) Proportion of different types of fatty acids at sn-1 and sn-2 positions of the positively correlated glycerophospholipid molecules. SFA (n = 0) indicates saturated fatty acids, MUFA (n = 1) indicates monounsaturated fatty acids and PUFA (n ≥ 2) indicates polyunsaturated fatty acids. (E) Proportional stacking of different types of MUFAs at sn-1 and sn-2 positions in (D). * indicates p < 0.05.
Animals 14 00383 g007
Table 1. Primers for PCR.
Gene NameGenebank IDSequence (5′ → 3′)Product Size (bp)Tm (°C)
STC2XM_414534.8F: ctagcgtttaaacttaagctt-
ATGTGCGCGGGGCTCCGC
96360
R: tgctggatatctgcagaattc-
TCACAGAACGCAGCTAGACCTCC
Note: lowercase indicates added homology arms including restriction sites and protective bases. The bold black are enzyme cleavage sites, and the rest are protective bases.
Table 2. Primers for qRT-PCR.
Gene NameGenebank IDSequence (5′ → 3′)Product Size (bp)Tm (°C)
STC2XM_414534.8F: CGGCTGTCCCTGCAGAACACA11260
R: AGCCTCGGATCTCACAAGAGT
HMGCRXM_046934671.1F: GCGAGGAGTGTCTATTCGCA16760
R: ATAGTGGTCCTGCTACGCCT
SREBP1XM_046900546.1F: TTCTTCGTGGACGGGGATTG21860
R: AGCTGAAGGTACTCCAACGC
SREBP2XM_040660556.2F: CACCTGTGGAACAGCCTCAA16460
R: GGTGAGGCATGGTAGGTCTC
SQLENM_001194927.2F: CATCATGGGTCTCCGAAGGG15260
R: GCGGTGCATGAAGTTCCTTA
FASNNM_205155.4F: AGAGGCTTTGAAGCTCGGAC12760
R: GGTGCCTGAATACTTGGGCT
ACACAXM_046929960.1F: GCCTCCGAGAACCCAA12860
R: CCAGCAGTCTGAGCCACTA
SCDNM_204890.2F: CAAGTTCTCCGAGACGCATG17860
R: GGGCTTGTAGTATCTCCGCT
LPIN1XM_004935771.2 F: TAATGAGAGACAAGATGCCC16460
R: ATCTTTTATTCTGTTTGCCAT
LPIN2NM_001006386.3F: CCACATCTCCAATACCCACT12260
R: AGTCTCTGTTTCCATAGCAT
AGPAT2XM_001235299.4F: CACCGTCAAGAACATGAGGA16560
R: ACCTCCATCAGCCCCATCAT
DGAT2XM_040661934.2F: ACTCCAAGCCCATCACCACT14960
R: CAACCCGAACCTGCCTTTGT
ApoVLDLIINM_205483.4 F: CAGGGCATTGGTGATAGCTG16260
R: CCAGCTCTAGGGGACACC
ApoBNM_001044633.2F: ATGTTCAAAAGATGCGGCCC22460
R: GCATGGCTCTTCTCTCACTG
MTTPNM_001109784.3F: CAGGAGGGATGGAGTTCAGC16660
R: TGGTCACGGAATGCCTGAAA
GAPDHNM_204305.2F: AGAACATCATCCCAGCGT18260
R: AGCCTTCACTACCCTCTTG
Note: F means upstream primer; R means downstream primer. GAPDH used as internal reference gene.
Table 3. The association analysis between genetic variant rs9949205 of STC2 gene and economic traits in F2 resource population.
TraitsMean ± SDp-Value
CC (n = 393)CT (n = 239)TT (n = 87)
Birth weight (g)30.391 ± 0.139 b31.223 ± 0.178 a31.157 ± 0.295 a4.56 × 10−4
2-week weight (g)119.717 ± 0.934 b126.224 ± 1.165 a128.158 ± 2.013 a2.00 × 10−6
4-week weight (g)312.854 ± 2.283 b333.460 ± 2.882 a336.756 ± 4.835 a2.32 × 10−9
6-week weight (g)541.944 ± 4.293 b583.958 ± 5.422 a596.016 ± 9.063 a1.16 × 10−11
8-week weight (g)791.321 ± 6.497 b850.956 ± 8.113 a836.937 ± 13.762 a3.53 × 10−8
10-week weight (g)1084.821 ± 8.054 b1145.940 ± 10.227 a1148.57 ± 16.947 a2.00 × 10−6
12-week weight (g)1321.621 ± 9.633 b1387.644 ± 12.315 a1401.965 ± 20.904 a7.00 × 10−6
Carcass weight rate (%)89.581 ± 0.10190.017 ± 0.12990.032 ± 0.2211.45 × 10−2
Weight after shedding (g)1157.940 ± 8.480 b1222.700 ± 10.871 a1235.754 ± 18.029 a4.71 × 10−7
Semievisceration weight (g)1070.511 ± 8.260 b1131.991 ± 10.611 a1145.031 ± 17.465 a8.67 × 10−7
Semievisceration weight rate (%)81.086 ± 0.101 b81.700 ± 0.130 a81.767 ± 0.217 a1.60 × 10−4
Evisceration weight (g)891.641 ± 7.127 b949.339 ± 9.154 a959.403 ± 15.099 a1.05 × 10−7
Evisceration weight rate (%)67.556 ± 0.099 b68.415 ± 0.128 a68.468 ± 0.214 a4.30 × 10−8
Abdominal fat weight (g)8.980 ± 0.5857.153 ± 0.7486.008 ± 1.2443.65 × 10−2
Abdominal fat percentage (%)1.006 ± 0.061 a0.735 ± 0.079 b0.625 ± 0.130 b3.56 × 10−3
Liver weight rate (%)2.212 ± 0.016 a2.081 ± 0.020 b2.060 ± 0.034 b5.97 × 10−8
breast muscle weight (g)67.778 ± 0.746 b73.787 ± 0.956 a72.929 ± 1.578 a1.00 × 10−6
breast muscle weight rate (%)15.084 ± 0.090 b15.443 ± 0.117 a15.124 ± 0.190 a4.70 × 10−2
Leg muscle weight (g)96.008 ± 0.871 b103.653 ± 1.104 a104.117 ± 1.821 a1.76 × 10−8
Leg muscle weight rate (%)21.375 ± 0.077 b21.737 ± 0.099 a21.637 ± 0.161 a1.24 × 10−2
Note: n represents the number of different genotype individuals. Values with different superscripts in the line indicate significant difference p < 0.05. Values with same superscript in the line indicate not significant difference p > 0.05.
Disclaimer/Publisher’s Note: The statements, opinions and data contained in all publications are solely those of the individual author(s) and contributor(s) and not of MDPI and/or the editor(s). MDPI and/or the editor(s) disclaim responsibility for any injury to people or property resulting from any ideas, methods, instructions or products referred to in the content.

