
Changes in Wolf Occupancy and Feeding Habits in the Northern Apennines: Results of Long-Term Predator–Prey Monitoring
Abstract
:Simple Summary
Abstract
1. Introduction
2. Materials and Methods
2.1. Study Area
2.2. Data Collection
2.3. Occupancy Modelling
2.4. Diet
3. Results
3.1. Range Dynamics
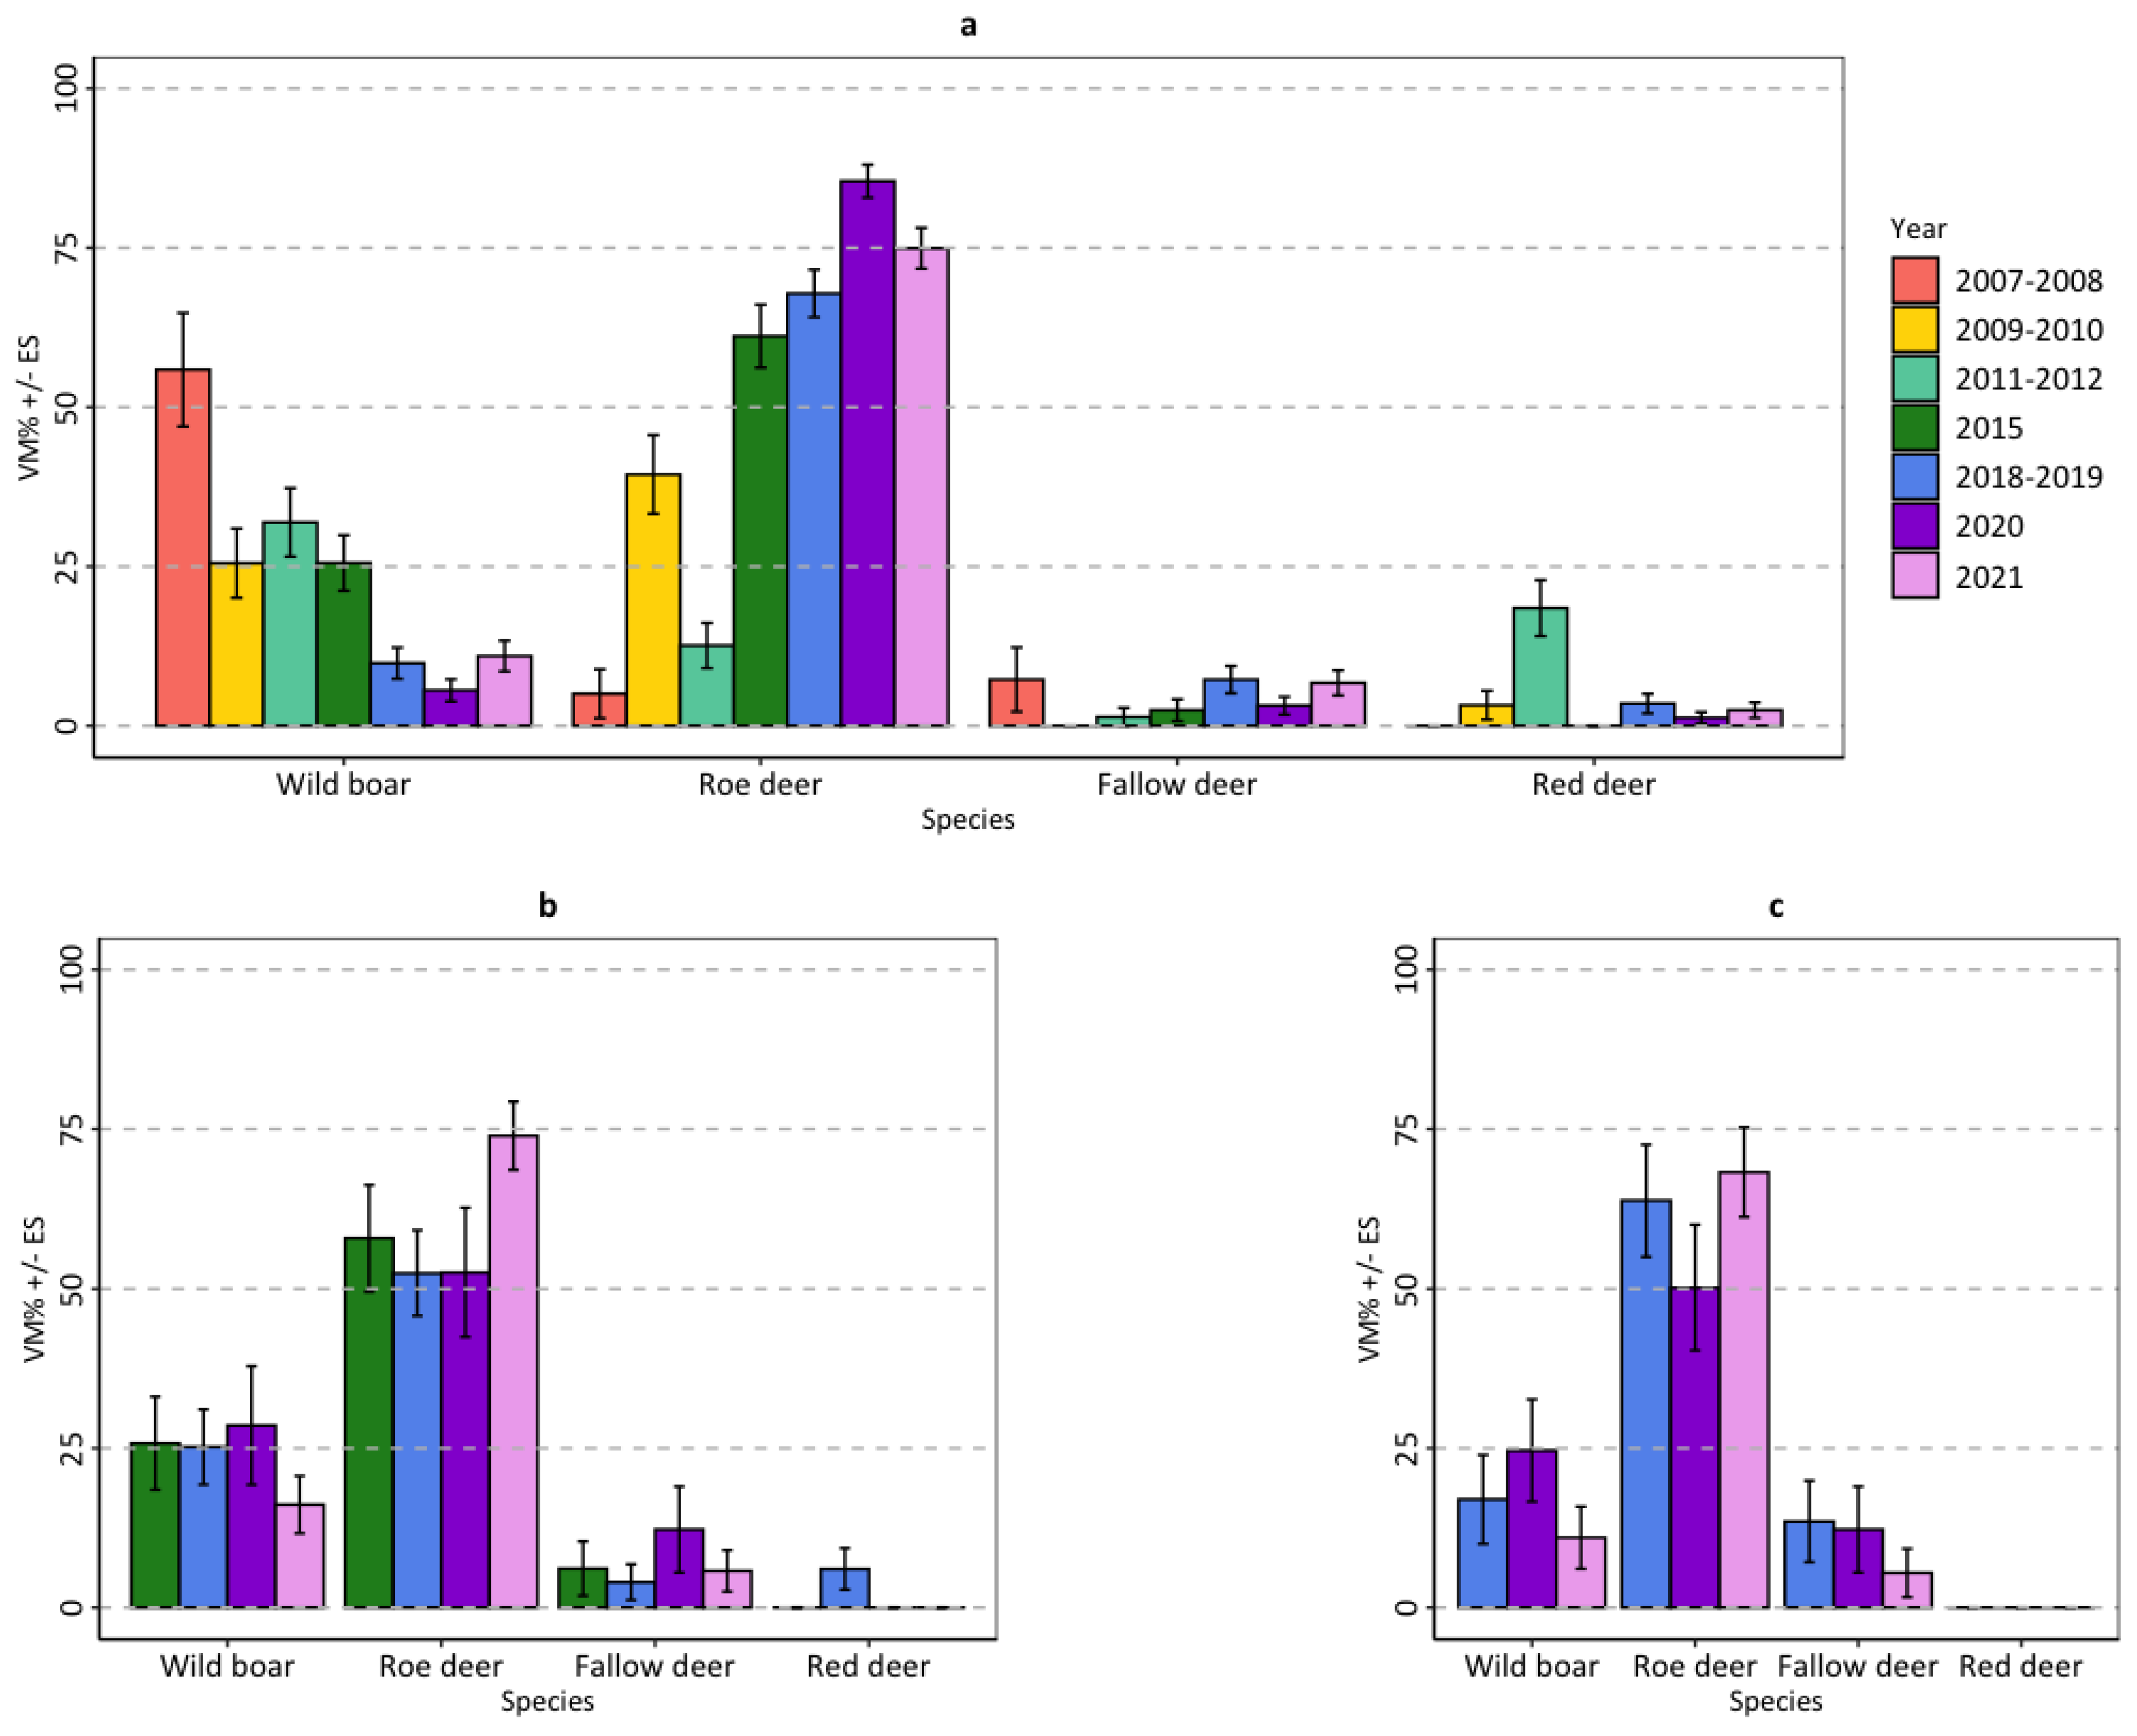
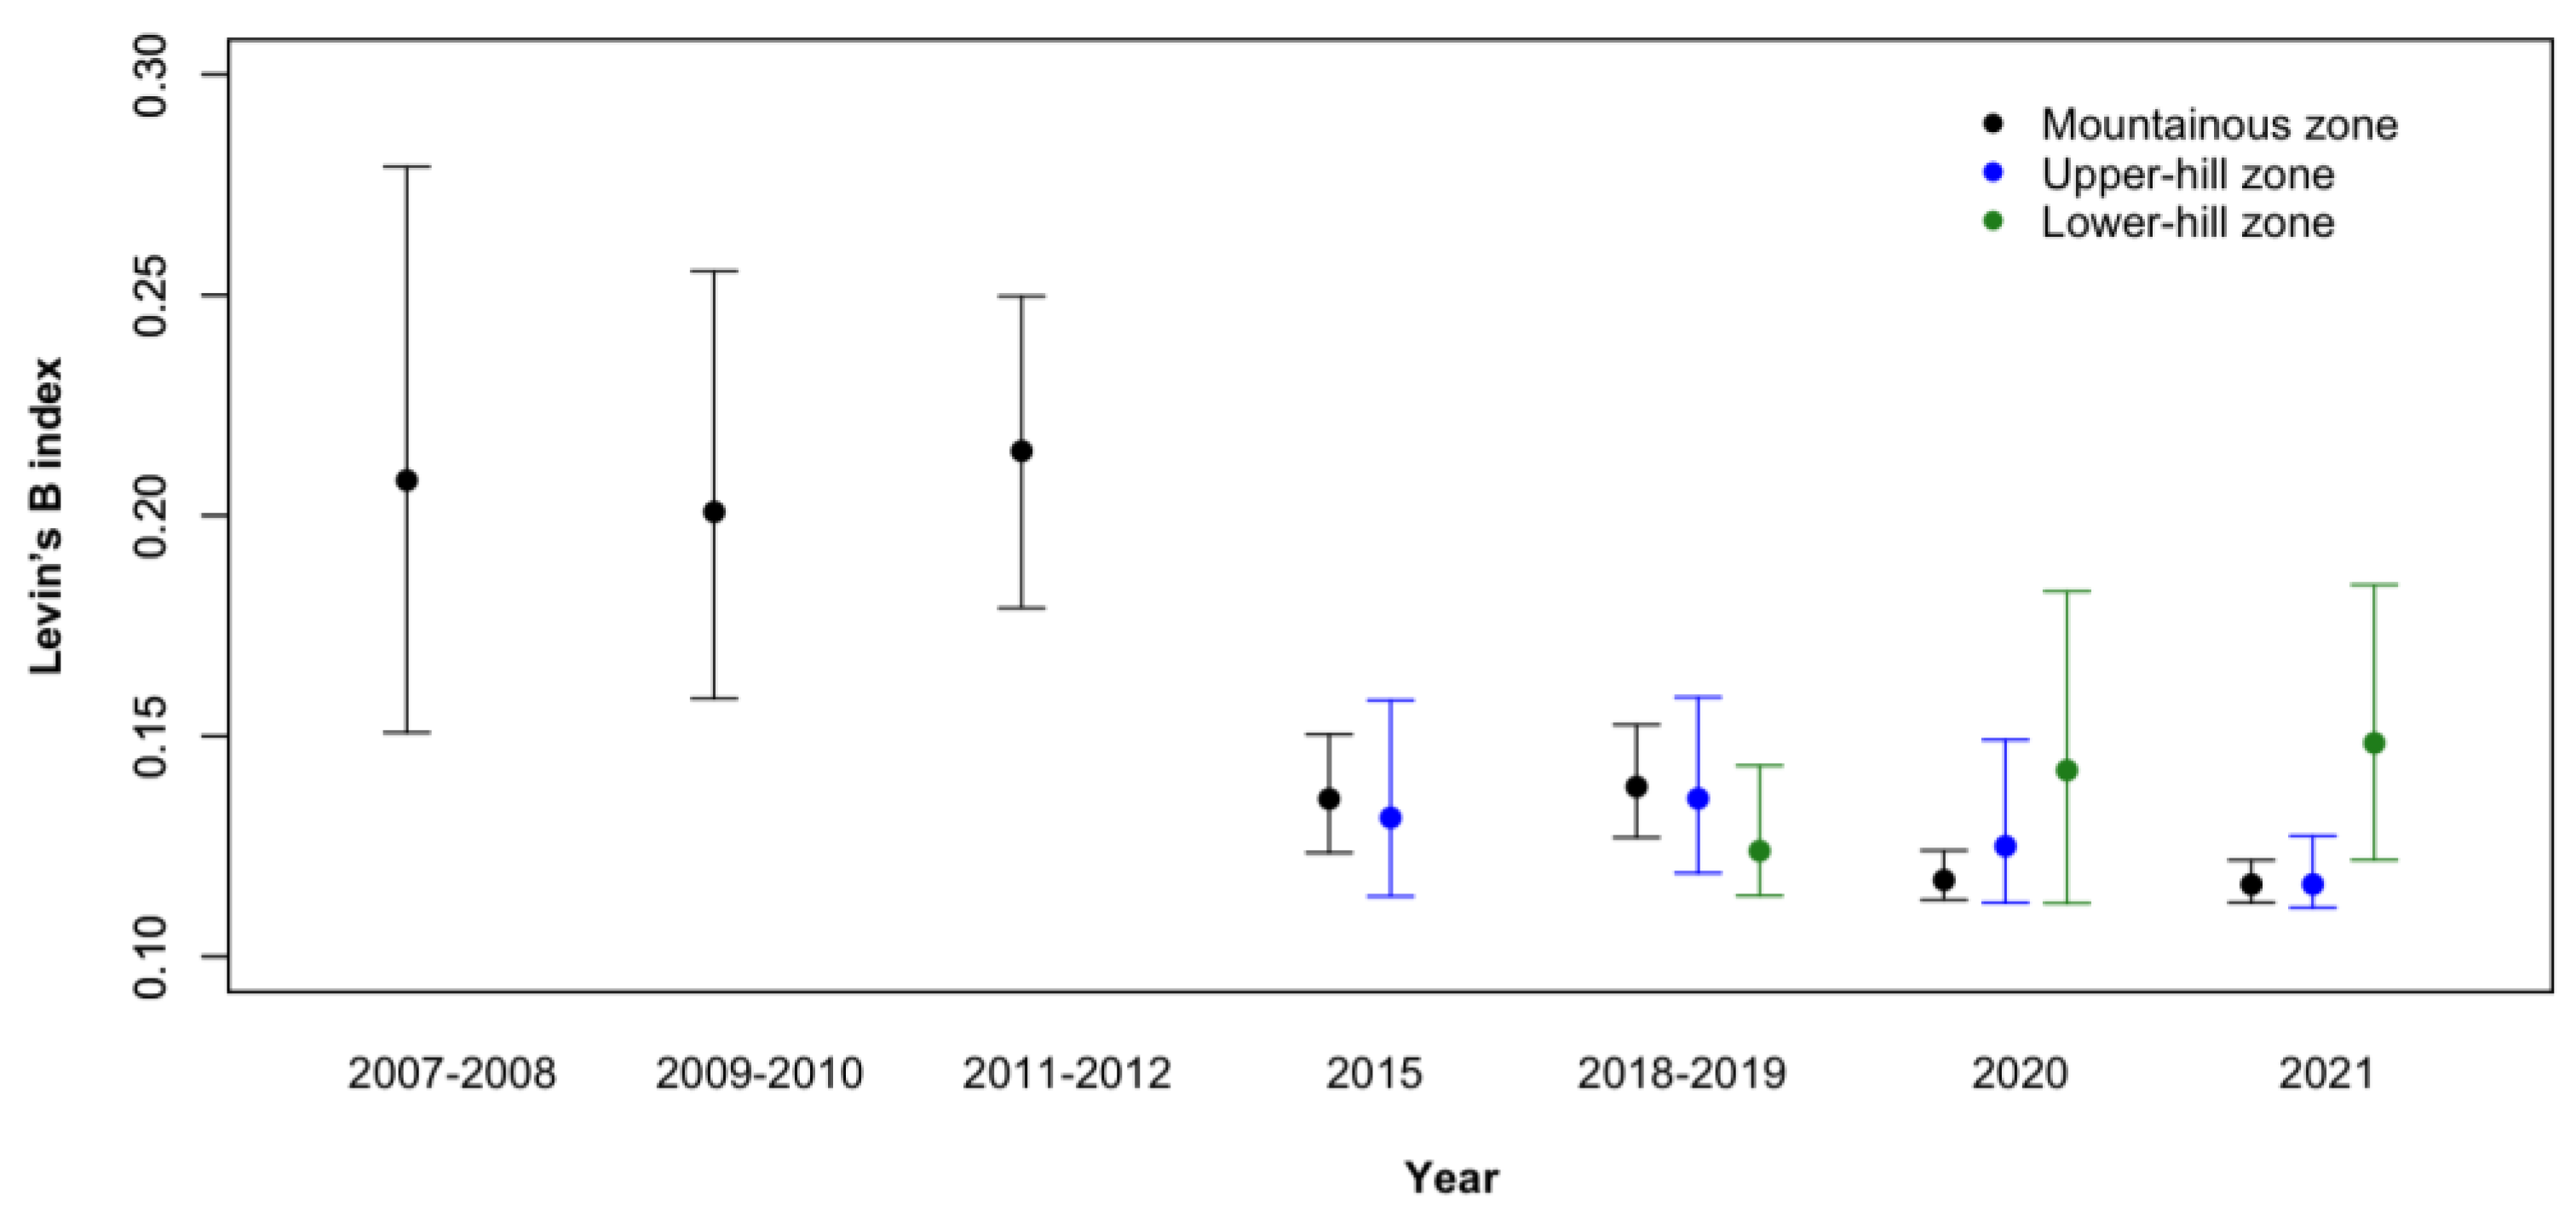
3.2. Diet
4. Discussion
5. Conclusions
Supplementary Materials
Author Contributions
Funding
Institutional Review Board Statement
Data Availability Statement
Acknowledgments
Conflicts of Interest
Appendix A

References
- Pooley, S.; Barua, M.; Beinart, W.; Dickman, A.; Holmes, G.; Lorimer, J.; Loveridge, A.J.; Macdonald, D.W.; Marvin, G.; Redpath, S.; et al. An Interdisciplinary Review of Current and Future Approaches to Improving Human-Predator Relations: Improving Human-Predator Relations. Conserv. Biol. 2017, 31, 513–523. [Google Scholar] [CrossRef]
- Chapron, G.; Kaczensky, P.; Linnell, J.D.C.; Von Arx, M.; Huber, D.; Andrén, H.; López-Bao, J.V.; Adamec, M.; Álvares, F.; Anders, O.; et al. Recovery of Large Carnivores in Europe’s Modern Human-Dominated Landscapes. Science 2014, 346, 1517–1519. [Google Scholar] [CrossRef]
- Cimatti, M.; Ranc, N.; Benítez-López, A.; Maiorano, L.; Boitani, L.; Cagnacci, F.; Čengić, M.; Ciucci, P.; Huijbregts, M.A.J.; Krofel, M.; et al. Large Carnivore Expansion in Europe Is Associated with Human Population Density and Land Cover Changes. Divers. Distrib. 2021, 27, 602–617. [Google Scholar] [CrossRef]
- Kaczensky, P.; Chapron, G.; Von Arx, M.; Huber, D.; Andrén, H.; Linnell, J.D.C. Status, Management and Distribution of Large Carnivores—Bear, Lynx, Wolf and Wolverine. In Europe. Part 1; Europe Summaries; Report: 1-72. A Large Carnivore Initiative for Europe Report prepared for the European Commission; 2013; Available online: https://www.europarc.org/wp-content/uploads/2017/02/Kaczensky_et_al_2013_Status_management_and_distribution_of_large_carnivores_in_Europe_1.pdf (accessed on 16 January 2024).
- Kiffner, C.; Uthes, S.; Ostermann-Miyashita, E.-F.; Harms, V.; König, H.J. Patterns of Livestock Loss Associated with a Recolonizing Wolf Population in Germany. Front. Conserv. Sci. 2022, 3, 989368. [Google Scholar] [CrossRef]
- La Morgia, V.; Marucco, F.; Aragno, P.; Salvatori, V.; Gervasi, V.; De Angelis, D.; Fabbri, E.; Caniglia, R.; Velli, E.; Avanzinelli, E.; et al. Stima Della Distribuzione e Consistenza Del Lupo a Scala Nazionale 2020/2021; Relazione Tecnica Realizzata Nell’ambito Della Convenzione ISPRA-Ministero Della Transizione Ecologica “Attività Di Monitoraggio Nazionale Nell’ambito Del Piano Di Azione Del Lupo”; I.S.P.R.A.: Roma, Italy, 2022. [Google Scholar]
- Bassi, E.; Willis, S.G.; Passilongo, D.; Mattioli, L.; Apollonio, M. Predicting the Spatial Distribution of Wolf (Canis lupus) Breeding Areas in a Mountainous Region of Central Italy. PLoS ONE 2015, 10, e0124698. [Google Scholar] [CrossRef]
- Dondina, O.; Orioli, V.; Torretta, E.; Merli, F.; Bani, L.; Meriggi, A. Combining Ensemble Models and Connectivity Analyses to Predict Wolf Expected Dispersal Routes through a Lowland Corridor. PLoS ONE 2020, 15, e0229261. [Google Scholar] [CrossRef] [PubMed]
- Meriggi, A.; Torretta, E.; Dondina, O. Recent Changes in Wolf Habitat Occupancy and Feeding Habits in Italy: Implications for Conservation and Reducing Conflict with Humans. In Problematic Wildlife II; Angelici, F.M., Rossi, L., Eds.; Springer International Publishing: Cham, Switzerland, 2020; pp. 111–138. ISBN 978-3-030-42334-6. [Google Scholar]
- Ferretti, F.; Lovari, S.; Mancino, V.; Burrini, L.; Rossa, M. Food Habits of Wolves and Selection of Wild Ungulates in a Prey-Rich Mediterranean Coastal Area. Mamm. Biol. 2019, 99, 119–127. [Google Scholar] [CrossRef]
- Rondinini, C.; Battistoni, A.; Teofili, C. Lista Rossa IUCN Dei Vertebrati Italiani 2022; Comitato Italiano IUCN e Ministero Dell’Ambiente e Della Sicurezza Energetica: Roma, Italy, 2022. [Google Scholar]
- Galaverni, M.; Caniglia, R.; Fabbri, E.; Milanesi, P.; Randi, E. One, No One, or One Hundred Thousand: How Many Wolves Are There Currently in Italy? Mamm. Res. 2016, 61, 13–24. [Google Scholar] [CrossRef]
- Kelly, M.J.; Betsch, J.; Wultsch, C.; Mesa, B.; Mills, L.S.; Boitani, L.; Powell, R. Carnivore Ecology and Conservation: A Handbook of Techniques; Boitani, L., Powell, R.A., Eds.; Techniques in Ecology and Conservation Series; Oxford University Press: Oxford, UK; New York, NY, USA, 2012; ISBN 978-0-19-955852-0. [Google Scholar]
- Nakamura, M.; Rio-Maior, H.; Godinho, R.; Petrucci-Fonseca, F.; Álvares, F. Source-Sink Dynamics Promote Wolf Persistence in Human-Modified Landscapes: Insights from Long-Term Monitoring. Biol. Conserv. 2021, 256, 109075. [Google Scholar] [CrossRef]
- Fabbri, E.; Miquel, C.; Lucchini, V.; Santini, A.; Caniglia, R.; Duchamp, C.; Weber, J.-M.; Lequette, B.; Marucco, F.; Boitani, L.; et al. From the Apennines to the Alps: Colonization Genetics of the Naturally Expanding Italian Wolf (Canis lupus) Population. Mol. Ecol. 2007, 16, 1661–1671. [Google Scholar] [CrossRef]
- Lucchini, V.; Galov, A.; Randi, E. Evidence of Genetic Distinction and Long-Term Population Decline in Wolves (Canis lupus) in the Italian Apennines. Mol. Ecol. 2004, 13, 523–536. [Google Scholar] [CrossRef]
- Zimen, E.; Boitani, L. Number and Distribution of Wolves in Italy. Zeitschrift Für Säugetierkunde 1975, 40, 102–112. [Google Scholar]
- Meriggi, A.; Rosa, P.; Brangi, A.; Matteucci, C. Habitat Use and Diet of the Wolf in Northern Italy. Acta Theriologica. 1991, 36, 141–151. [Google Scholar] [CrossRef]
- Meriggi, A.; Brangi, A.; Matteucci, C.; Sacchi, O. The Feeding Habits of Wolves in Relation to Large Prey Availability in Northern Italy. Ecography 1996, 19, 287–295. [Google Scholar] [CrossRef]
- Meriggi, A.; Torretta, E. Lupi e Ricolonizzazione Dell’arco Alpino. Evoluzione Della Presenza e Dell’ecologia Del Lupo Nell’Appennino Nord-Occidentale. Arch. Stor. Ticin. 2021, 169, 88–101. [Google Scholar]
- Dondina, O.; Meriggi, A.; Dagradi, V.; Perversi, M.; Milanesi, P. Wolf Predation on Livestock in an Area of Northern Italy and Prediction of Damage Risk. Ethol. Ecol. Evol. 2015, 27, 200–219. [Google Scholar] [CrossRef]
- Meriggi, A.; Dagradi, V.; Dondina, O.; Perversi, M.; Milanesi, P.; Lombardini, M.; Raviglione, S.; Repossi, A. Short-Term Responses of Wolf Feeding Habits to Changes of Wild and Domestic Ungulate Abundance in Northern Italy. Ethol. Ecol. Evol. 2015, 27, 389–411. [Google Scholar] [CrossRef]
- Milanesi, P.; Meriggi, A.; Merli, E. Selection of Wild Ungulates by Wolves Canis lupus (L. 1758) in an Area of the Northern Apennines (North Italy). Ethol. Ecol. Evol. 2012, 24, 81–96. [Google Scholar] [CrossRef]
- Torretta, E.; Binetti, C.; Meriggi, A. Distribuzione, Dieta e Impatto Del Lupo Sulla Zootecnia e Previsione Del Rischio Di Predazione Nell’Appennino Pavese. In Relazione Tecnica Realizzata Nell’ambito Del Progetto LIFE GESTIRE 2020; Azione A16—Strategia Regionale Sui Grandi Carnivori: Pavia, Italy, 2018; p. 72. [Google Scholar]
- Torretta, E.; Meriggi, A. Monitoraggio Della Presenza Del Lupo Nell’Appennino Pavese: Espansione Dell’areale, Idoneità Ambientale e Stima Della Popolazione. Relazione Tecnica Realizzata Nell’ambito Del Progetto LIFE GESTIRE 2020; Azione A16—Strategia Regionale Sui Grandi Carnivori: Pavia, Italy, 2018; p. 41. [Google Scholar]
- Barabesi, L.; Fattorini, L. Random versus Stratified Location of Transects or Points in Distance Sampling: Theoretical Results and Practical Considerations. Environ. Ecol. Stat. 2013, 20, 215–236. [Google Scholar] [CrossRef]
- Bartol, M.; Černe, R.; Krofel, M.; Jonozovič, M.; Sila, A.; Potočnik, H.; Marenče, M.; Molinari, P.; Kusak, J.; Berce, T. A Fieldguide for Investigating Damages Caused by Carnivores: Brown Bear, Grey Wolf, Golden Jackal, Red Fox, Eurasian Lynx; Slovenia Forest Service: Ljubljana, Slovenia, 2019; ISBN 961-6605-39-9. [Google Scholar]
- Llaneza, L.; García, E.J.; López-Bao, J.V. Intensity of Territorial Marking Predicts Wolf Reproduction: Implications for Wolf Monitoring. PLoS ONE 2014, 9, e93015. [Google Scholar] [CrossRef]
- Zub, K.; Theuerkauf, J.; Jędrzejewski, W.; Jędrzejewska, B.; Schmidt, K.; Kowalczyk, R. Wolf Pack Territory Marking in the Białowieża Primeval Forest (Poland). Behaviour 2003, 140, 635–648. [Google Scholar] [CrossRef]
- MacKenzie, D.I.; Nichols, J.D.; Hines, J.E.; Knutson, M.G.; Franklin, A.B. Estimating Site Occupancy, Colonization, and Local Extinction When a Species Is Detected Imperfectly. Ecology 2003, 84, 2200–2207. [Google Scholar] [CrossRef]
- Morales-González, A.; Fernández-Gil, A.; Quevedo, M.; Revilla, E. Patterns and Determinants of Dispersal in Grey Wolves (Canis lupus). Biol. Rev. 2022, 97, 466–480. [Google Scholar] [CrossRef]
- Sanz-Pérez, A.; Ordiz, A.; Sand, H.; Swenson, J.E.; Wabakken, P.; Wikenros, C.; Zimmermann, B.; Åkesson, M.; Milleret, C. No Place like Home? A Test of the Natal Habitat-Biased Dispersal Hypothesis in Scandinavian Wolves. R. Soc. Open Sci. 2018, 5, 181379. [Google Scholar] [CrossRef]
- Worton, B.J. Kernel Methods for Estimating the Utilization Distribution in Home-range Studies. Ecology 1989, 70, 164–168. [Google Scholar] [CrossRef]
- Dormann, C.F.; Elith, J.; Bacher, S.; Buchmann, C.; Carl, G.; Carré, G.; Marquéz, J.R.G.; Gruber, B.; Lafourcade, B.; Leitão, P.J.; et al. Collinearity: A Review of Methods to Deal with It and a Simulation Study Evaluating Their Performance. Ecography 2013, 36, 27–46. [Google Scholar] [CrossRef]
- Zuur, A.F.; Ieno, E.N.; Elphick, C.S. A Protocol for Data Exploration to Avoid Common Statistical Problems. Methods Ecol. Evol. 2010, 1, 3–14. [Google Scholar] [CrossRef]
- Naimi, B.; Hamm, N.A.S.; Groen, T.A.; Skidmore, A.K.; Toxopeus, A.G. Where Is Positional Uncertainty a Problem for Species Distribution Modelling? Ecography 2014, 37, 191–203. [Google Scholar] [CrossRef]
- R Core Team. R: A Language and Environment for Statistical Computing; R Core Team: Vienna, Austria, 2023. [Google Scholar]
- Capitani, C.; Mattioli, L.; Avanzinelli, E.; Gazzola, A.; Lamberti, P.; Mauri, L.; Scandura, M.; Viviani, A.; Apollonio, M. Selection of Rendezvous Sites and Reuse of Pup Raising Areas among Wolves Canis lupus of North-Eastern Apennines, Italy. Acta Theriol. 2006, 51, 395–404. [Google Scholar] [CrossRef]
- Jȩdrzejewski, W.; Niedziałkowska, M.; Nowak, S.; Jȩdrzejewska, B. Habitat Variables Associated with Wolf (Canis lupus) Distribution and Abundance in Northern Poland. Divers. Distrib. 2004, 10, 225–233. [Google Scholar] [CrossRef]
- Massolo, A.; Meriggi, A. Factors Affecting Habitat Occupancy by Wolves in Northern Apennines (Northern Italy): A Model of Habitat Suitability. Ecography 1998, 21, 97–107. [Google Scholar] [CrossRef]
- Theuerkauf, J.; Rouys, S.; Jedrzejewski, W. Selection of Den, Rendezvous, and Resting Sites by Wolves in the Bialowieza Forest, Poland. Can. J. Zool. 2003, 81, 163–167. [Google Scholar] [CrossRef]
- Jędrzejewski, W.; Jędrzejewska, B.; Zawadzka, B.; Borowik, T.; Nowak, S.; Mysłajek, R.W. Habitat Suitability Model for Polish Wolves Based on Long-term National Census. Anim. Conserv. 2008, 11, 377–390. [Google Scholar] [CrossRef]
- Llaneza, L.; López-Bao, J.V.; Sazatornil, V. Insights into Wolf Presence in Human-dominated Landscapes: The Relative Role of Food Availability, Humans and Landscape Attributes. Divers. Distrib. 2012, 18, 459–469. [Google Scholar] [CrossRef]
- Louvrier, J.; Duchamp, C.; Lauret, V.; Marboutin, E.; Cubaynes, S.; Choquet, R.; Miquel, C.; Gimenez, O. Mapping and Explaining Wolf Recolonization in France Using Dynamic Occupancy Models and Opportunistic Data. Ecography 2018, 41, 647–660. [Google Scholar] [CrossRef]
- Theuerkauf, J.; Jedrzejewski, W.; Schmidt, K.; Gula, R. Spatiotemporal Segregation of Wolves from Humans in the Bialowieza Forest (Poland). J. Wildl. Manag. 2003, 67, 706. [Google Scholar] [CrossRef]
- Burnham, K.P.; Anderson, D.R. Model Selection and Multimodel Inference: A Practical Information-Theoretic Approach, 2nd ed.; Springer: New York, NY, USA, 2002; ISBN 978-0-387-95364-9. [Google Scholar]
- Fiske, I.; Chandler, R. Unmarked: An R Package for Fitting Hierarchical Models of Wildlife Occurrence and Abundance. J. Stat. Soft. 2011, 43, 1–23. [Google Scholar] [CrossRef]
- Brunner, H.; Coman, B.J. The Identification of Mammalian Hair; Inkata Press: Melbourne, Australia, 1974. [Google Scholar]
- De Marinis, A.M.; Asprea, A. Hair Identification Key of Wild and Domestic Ungulates from Southern Europe. Wildl. Biol. 2006, 12, 305–320. [Google Scholar] [CrossRef]
- Teerink, B.J. Hair of West-European Mammals: Atlas and Identification Key; Cambridge University Press: Cambridge, UK, 1991. [Google Scholar]
- Brillouin, L. Science and Information Theory; Academic Press: New York, NY, USA, 1956. [Google Scholar]
- Anderson, M.J. A New Method for Non-parametric Multivariate Analysis of Variance. Austral Ecol. 2001, 26, 32–46. [Google Scholar] [CrossRef]
- Feinsinger, P.; Spears, E.E.; Poole, R.W. A Simple Measure of Niche Breadth. Ecology 1981, 62, 27–32. [Google Scholar] [CrossRef]
- Grueber, C.E.; Nakagawa, S.; Laws, R.J.; Jamieson, I.G. Multimodel Inference in Ecology and Evolution: Challenges and Solutions. J. Evol. Biol. 2011, 24, 699–711. [Google Scholar] [CrossRef]
- Zanni, M.; Brogi, R.; Merli, E.; Apollonio, M. The Wolf and the City: Insights on Wolves Conservation in the Anthropocene. Anim. Conserv. 2023, 26, 766–780. [Google Scholar] [CrossRef]
- Mech, L.D.; Boitani, L. Wolves: Behavior, Ecology and Conservation; University of Chicago Press: Chicago, IL, USA, 2003. [Google Scholar]
- Ciucci, P.; Boitani, L.; Falco, M.; Maiorano, L. Hierarchical, Multi-grain Rendezvous Site Selection by Wolves in Southern Italy. J. Wildl. Manag. 2018, 82, 1049–1061. [Google Scholar] [CrossRef]
- Iliopoulos, Y.; Youlatos, D.; Sgardelis, S. Wolf Pack Rendezvous Site Selection in Greece Is Mainly Affected by Anthropogenic Landscape Features. Eur. J. Wildl. Res. 2014, 60, 23–34. [Google Scholar] [CrossRef]
- Lovari, S.; Serrao, G.; Mori, E. Woodland Features Determining Home Range Size of Roe Deer. Behav. Process. 2017, 140, 115–120. [Google Scholar] [CrossRef] [PubMed]
- Merli, E.; Meriggi, A. Using Harvest Data to Predict Habitat-Population Relationship of the Wild Boar Sus Scrofa in Northern Italy. Acta Theriol. 2006, 51, 383–394. [Google Scholar] [CrossRef]
- Santilli, F.; Varuzza, P. Factors Affecting Wild Boar (Sus Scrofa) Abundance in Southern Tuscany. Hystrix Ital. J. Mammal. 2013, 24, 169–173. [Google Scholar] [CrossRef]
- Danilkin, A.A.; Hewison, A.J.M. Behavioural Ecology of Siberian and European Roe Deer; wildlife ecology and behaviour series; Chapman & Hall: London, UK; Glasgow, UK; Weinheim, Germany, 1996; ISBN 978-0-412-63880-0. [Google Scholar]
- Massei, G.; Kindberg, J.; Licoppe, A.; Gačić, D.; Šprem, N.; Kamler, J.; Baubet, E.; Hohmann, U.; Monaco, A.; Ozoliņš, J.; et al. Wild Boar Populations up, Numbers of Hunters down? A Review of Trends and Implications for Europe. Pest Manag. Sci. 2015, 71, 492–500. [Google Scholar] [CrossRef] [PubMed]
- Dondina, O.; Orioli, V.; Chiatante, G.; Meriggi, A.; Bani, L. Species Specialization Limits Movement Ability and Shapes Ecological Networks: The Case Study of 2 Forest Mammals. Curr. Zool. 2019, 65, 237–249. [Google Scholar] [CrossRef] [PubMed]
- Ferretti, F.; Lazzeri, L.; Mori, E.; Cesaretti, G.; Calosi, M.; Burrini, L.; Fattorini, N. Habitat Correlates of Wild Boar Density and Rooting along an Environmental Gradient. J. Mammal. 2021, 102, 1536–1547. [Google Scholar] [CrossRef]
- Torretta, E.; Serafini, M.; Imbert, C.; Milanesi, P.; Meriggi, A. Wolves and Wild Ungulates in the Ligurian Alps (Western Italy): Prey Selection and Spatial-Temporal Interactions. Mammalia 2017, 81, 537–551. [Google Scholar] [CrossRef]
- Torretta, E.; Corradini, A.; Pedrotti, L.; Bani, L.; Bisi, F.; Dondina, O. Hide-and-Seek in a Highly Human-Dominated Landscape: Insights into Movement Patterns and Selection of Resting Sites of Rehabilitated Wolves (Canis lupus) in Northern Italy. Animals 2022, 13, 46. [Google Scholar] [CrossRef] [PubMed]
- Meriggi, A.; Lovari, S. A Review of Wolf Predation in Southern Europe: Does the Wolf Prefer Wild Prey to Livestock? J. Appl. Ecol. 1996, 33, 1561. [Google Scholar] [CrossRef]
- Newsome, T.M.; Boitani, L.; Chapron, G.; Ciucci, P.; Dickman, C.R.; Dellinger, J.A.; López-Bao, J.V.; Peterson, R.O.; Shores, C.R.; Wirsing, A.J.; et al. Food Habits of the World’s Grey Wolves. Mammal. Rev. 2016, 46, 255–269. [Google Scholar] [CrossRef]
- Zlatanova, D.; Ahmed, A.; Valasseva, A.; Genov, P. Adaptive Diet Strategy of the Wolf (Canis lupus L.) in Europe: A Review. Acta Zool. Bulg. 2014, 66, 439–452. [Google Scholar]
- Mori, E.; Benatti, L.; Lovari, S.; Ferretti, F. What Does the Wild Boar Mean to the Wolf? Eur. J. Wildl. Res. 2017, 63, 9. [Google Scholar] [CrossRef]
- Mattioli, L.; Capitani, C.; Avanzinelli, E.; Bertelli, I.; Gazzola, A.; Apollonio, M. Predation by Wolves (Canis lupus) on Roe Deer (Capreolus capreolus) in North-Eastern Apennine, Italy. J. Zool. 2004, 264, 249–258. [Google Scholar] [CrossRef]
- Barja, I.; Navarro-Castilla, Á.; Ortiz-Jiménez, L.; España, Á.; Hinojosa, R.; Sánchez-Sotomayor, D.; Iglesias, Á.; España, J.; Rubio-Sánchez, S.; Martín-Romero, S.; et al. Wild Ungulates Constitute the Basis of the Diet of the Iberian Wolf in a Recently Recolonized Area: Wild Boar and Roe Deer as Key Species for Its Conservation. Animals 2023, 13, 3364. [Google Scholar] [CrossRef]
- Mysłajek, R.W.; Stachyra, P.; Figura, M.; Nędzyńska-Stygar, M.; Stefański, R.; Korga, M.; Kwiatkowska, I.; Stępniak, K.M.; Tołkacz, K.; Nowak, S. Diet of the Grey Wolf Canis lupus in Roztocze and Solska Forest, South-East Poland. J. Vertebr. Biol. 2022, 71, 22040.1-12. [Google Scholar] [CrossRef]
- De Pasquale, D.D.; Dondina, O.; Scancarello, E.; Meriggi, A. Long-Term Viability of a Reintroduced Population of Roe Deer Capreolus capreolus, in a Lowland Area of Northern Italy. Folia Zool. 2019, 68, 9. [Google Scholar] [CrossRef]


| Monitoring Session | Year | Seasonal Surveys 1 | N. of Surveyed Sample Squares | N. of Sampling Routes | Length of Routes (Mean ± SD) | Total Length of Routes | |||
|---|---|---|---|---|---|---|---|---|---|
| 1 | 2007 | w | sp | su | a | 11 | 12 | 6.8 ± 2.5 km | 81.9 km |
| 2008 | w | sp | su | a | |||||
| 2 | 2008 | w | sp | su | a | 11 | 12 | 6.8 ± 2.5 km | 81.9 km |
| 2009 | w | sp | su | a | |||||
| 3 | 2010 | w | sp | su | a | 11 | 13 | 6.8 ± 2.3 km | 87.9 km |
| 2011 | w | sp | su | a | |||||
| 4 | 2011 | w | sp | su | a | 11 | 13 | 6.8 ± 2.3 km | 87.9 km |
| 2012 | w | sp | su | a | |||||
| 5 | 2015 | w | sp | su | a | 20 | 26 | 5.4 ± 2.3 km | 139.2 km |
| 6 | 2018 | w | sp | su | a | 29 | 37 | 5.4 ± 2.6 km | 199.1 km |
| 2019 | w | sp | su | a | |||||
| 7 | 2020 | w | sp | su | a | 34 | 39 | 5.3 ± 2.6 km | 205.8 km |
| 8 | 2021 | w | sp | su | a | 34 | 42 | 5.1 ± 2.6 km | 215.0 km |
| 2022 | w | sp | su | a | |||||
| Covariate | Description | Parameter | Expected Effect | References |
|---|---|---|---|---|
| Site level | ||||
| Woodlands | Percentage cover of mixed, coniferous, and broad-leaved woodlands | Initial occupancy (Ψ) | + | [38,39,40,41] |
| Open areas | Percentage cover of open areas (grasslands, meadows, and pastures) | Initial occupancy (Ψ) | + | [18,42] |
| Uncultivated areas | Percentage cover of unutilized areas | Initial occupancy (Ψ) | + | [18] |
| Arable lands | Percentage cover of cultivated fields | Initial occupancy (Ψ) | − | [8] |
| Permanent crops | Percentage cover of vineyards and fruit trees | Initial occupancy (Ψ) | − | [8] |
| Urban areas | Percentage cover of built-up areas | Extinction (ε) | + | [43,44,45] |
| Road density | Length of primary and secondary roads (km/km2) | Extinction (ε) | + | [43,44,45] |
| Yearly site-level | ||||
| Roe deer abundance | KDE based on occurrence data recorded during seasonal surveys | Colonization (γ) | + | [40] |
| Wild boar abundance | KDE based on occurrence data recorded during seasonal surveys | Colonization (γ) | + | [40] |
| Observation level | ||||
| Year | Year of monitoring | Detection (p) | + | |
| Season | Season of survey | Detection (p) | −/+ | |
| Parameter | Term | β | SE |
|---|---|---|---|
| Occupancy | Intercept | 0.04 | 0.68 |
| Colonization | Intercept | 1.63 | 1.21 |
| Roe deer abundance | 5.09 | 2.66 | |
| Wild boar abundance | −10.67 | 4.76 | |
| Extinction | Intercept | −3.64 | 0.91 |
| Urban areas | 1.14 | 0.56 | |
| Detection | Intercept | 0.55 | 0.77 |
| Y 2008 | −1.25 | 0.92 | |
| Y 2009 | −1.82 | 0.90 | |
| Y 2010 | −0.74 | 0.87 | |
| Y 2011 | −1.45 | 1.04 | |
| Y 2012 | 0.07 | 0.87 | |
| Y 2015 | 1.36 | 0.94 | |
| Y 2018 | 0.25 | 0.84 | |
| Y 2019 | 2.63 | 1.06 | |
| Y 2020 | 1.72 | 0.95 | |
| Y 2021 | 0.29 | 0.82 |
| Categories and Species | Mountain (n = 696) | Upper Hills (n = 156) | Lower Hills (n = 89) | |||
|---|---|---|---|---|---|---|
| VM% | SE | VM% | SE | VM% | SE | |
| Livestock | 6.55 | 0.88 | 2.39 | 1.09 | 6.08 | 2.44 |
| Ovis aries | 1.04 | 0.32 | 0.87 | 0.67 | 2.07 | 1.46 |
| Capra hircus | 2.22 | 0.52 | 0.73 | 0.64 | 1.81 | 1.30 |
| Bos taurus | 3.01 | 0.61 | 0.79 | 0.60 | 2.20 | 1.55 |
| Equus caballus | 0.29 | 0.20 | 0.00 | 0.00 | 0.00 | 0.00 |
| Wild ungulates | 86.70 | 1.11 | 91.68 | 1.72 | 88.44 | 2.90 |
| Sus scrofa | 16.33 | 1.34 | 22.88 | 3.13 | 16.62 | 3.71 |
| Capreolus capreolus | 62.22 | 1.74 | 60.61 | 3.62 | 61.91 | 4.83 |
| Dama dama | 4.45 | 0.77 | 6.28 | 1.93 | 9.91 | 3.15 |
| Cervus elaphus | 3.71 | 0.70 | 1.90 | 1.04 | 0.00 | 0.00 |
| Small mammals | 1.70 | 0.46 | 0.63 | 0.63 | 0.00 | 0.00 |
| Medium-sized mammals | 1.90 | 0.49 | 1.36 | 0.89 | 2.38 | 1.56 |
| Birds | 0.14 | 0.14 | 0.00 | 0.00 | 0.00 | 0.00 |
| Invertebrates | 0.01 | 0.01 | 0.00 | 0.00 | 0.00 | 0.00 |
| Fruits | 0.15 | 0.07 | 0.12 | 0.10 | 1.12 | 0.62 |
| Grasses | 0.72 | 0.15 | 1.60 | 0.59 | 0.67 | 0.20 |
| Garbage | 0.004 | 0.004 | 0.003 | 0.003 | 0.00 | 0.00 |
Disclaimer/Publisher’s Note: The statements, opinions and data contained in all publications are solely those of the individual author(s) and contributor(s) and not of MDPI and/or the editor(s). MDPI and/or the editor(s) disclaim responsibility for any injury to people or property resulting from any ideas, methods, instructions or products referred to in the content. |
© 2024 by the authors. Licensee MDPI, Basel, Switzerland. This article is an open access article distributed under the terms and conditions of the Creative Commons Attribution (CC BY) license (https://creativecommons.org/licenses/by/4.0/).
Share and Cite
Torretta, E.; Brangi, A.; Meriggi, A. Changes in Wolf Occupancy and Feeding Habits in the Northern Apennines: Results of Long-Term Predator–Prey Monitoring. Animals 2024, 14, 735. https://doi.org/10.3390/ani14050735
Torretta E, Brangi A, Meriggi A. Changes in Wolf Occupancy and Feeding Habits in the Northern Apennines: Results of Long-Term Predator–Prey Monitoring. Animals. 2024; 14(5):735. https://doi.org/10.3390/ani14050735
Chicago/Turabian StyleTorretta, Elisa, Anna Brangi, and Alberto Meriggi. 2024. "Changes in Wolf Occupancy and Feeding Habits in the Northern Apennines: Results of Long-Term Predator–Prey Monitoring" Animals 14, no. 5: 735. https://doi.org/10.3390/ani14050735