Article

Assessing the Distribution and Richness of Mammalian Species Using a Stacking Species Distribution Model in a Temperate Forest

1
Space and Environment Laboratory, Chungnam Institute, 73-26 Institute Road, Gongju 32589, Republic of Korea
2
Division of Life Sciences, College of Life Sciences and Bioengineering, Incheon National University, 119 Academy-ro, Yeonsu-gu, Incheon 22012, Republic of Korea
*
Author to whom correspondence should be addressed.
Animals 2024, 14(5), 759; https://doi.org/10.3390/ani14050759
Submission received: 12 January 2024 / Revised: 3 February 2024 / Accepted: 23 February 2024 / Published: 29 February 2024

Abstract

:

Simple Summary

This study examined the question of how many different mammalian species reside in the Province of Chungnam, Korea, and the influence of environmental, climatic, and human factors. A special model that combines the distribution of each species was used. Distance to forest boundary, elevation, slope, human population density, and distance to water streams were the major factors in determining overall species richness, while climate factors showed relatively less importance. Of particular interest was the fact that the map of unique species aligned with the location of many mammal species. The model would be very helpful to land managers, as well as those who are seeking a method for accommodating greater species diversity.

Abstract

This study was conducted as an effort to examine the association between mammalian species richness and environmental, anthropogenic, and bioclimate factors in the Province of Chungnam, Korea, using a stacked species distribution model (SSDM) approach. An SSDM model was constructed using an extensive dataset collected from 1357 mammal sampling points and their corresponding forest, geographical, anthropogenic, and bioclimatic information. Distance to forest edge, elevation, slope, population density, and distance to water channels were identified as important variables for determining species richness, whereas the impact of bioclimate variables was less important. The endemism map showed a strong correlation with species richness, suggesting the important role of endemic species. Overestimation was observed in areas with lower species richness. However, the findings of the study still demonstrated that valuable insights can be obtained through the use of the SSDM, which may be helpful to land managers, aiding in the effective management of wildlife habitats, particularly in regions with an abundance of species richness and endemism.

1. Introduction

In recent decades, species distribution models (SDMs) have been utilized as essential tools for understanding the suitability of current habitats and evaluating biological responses to specific or changing environmental factors [1]. Increased numbers of large datasets with spatial information, incorporating diverse species, and advances in computing capabilities and modeling techniques have led to increased efforts toward the development of SDMs [2,3]. Thus, various SDMs using different modeling/machine learning approaches, including generalized linear models (GLMs), generalized additive models (GAMs), multivariate adaptive regression splines (MARSs), artificial neural networks (ANNs), classification and regression trees (CARTs), maximum entropy (MaxEnt), gradient boosting machine (GBM), and random forest (RF), have been suggested and applied to many regions and taxonomy [4].
However, coincident forecasts are not always obtained when using SDMS; they often yield contrasting predictions [1]. These discrepancies can result from differences in model parameterizations, model selection criteria, and data characteristics (e.g., sample size, scale, and correlations between the environmental variables [5]). However, consistent superior performances across diverse species and regions have not yet been reported for a single novel method [5,6,7].
To address this challenge, a proposed solution involving the development of a consensus by combining outputs from multiple SDMs (termed “ensembles”) has been suggested [8]. Each SDM contains both true signals representing the relationships that the model intends to capture and the false noise generated by errors and uncertainties inherent to the data and model structure [5]. It is anticipated that the process of combining will result in the enhanced segregation of true signals [8].
The aggregation and extrapolation of multiple SDMs can be regarded as a promising measure for the assessment of site- or community-level biodiversity [9]. The process of combining is often called “stacking”; thus, such models are also referred to as stacked species distribution models (SSDMs, e.g., [3,10]). Valuable insights into the spatial distribution patterns of biodiversity can be obtained through the use of SSDMs, providing scientists and decision makers with information that is more accessible and interpretable [9].
Considering the significance of species richness as a simple yet substantial metric in assessing biodiversity [11], identifying regions with high species richness (e.g., richness maps) can be critical in the effort to develop strategies that can be used for the effective management and conservation of habitats. However, capturing sufficient variation in species richness across large areas with comprehensive inventories is always challenging [12], often due to insufficient or inadequate planning of data collection efforts [13]. Particularly in Korea, the structure and organization of communities, including the mammalian community, are largely unknown and lack statistical/quantitative robustness.
Therefore, the objective of this study was to examine the associations between mammalian species richness and various environmental, anthropogenic, or bioclimatic variables using a stacked species distribution approach. An additional objective of this study was to identify specific areas where high species richness is predicted within the Province of Chungnam. If the results of the study can be extrapolated to other species (e.g., [14]), the findings of this study will provide valuable insights that may be useful to land managers, supporting their decisions toward more effective strategies that can be used for the management of wildlife habitats and land.

2. Materials and Methods
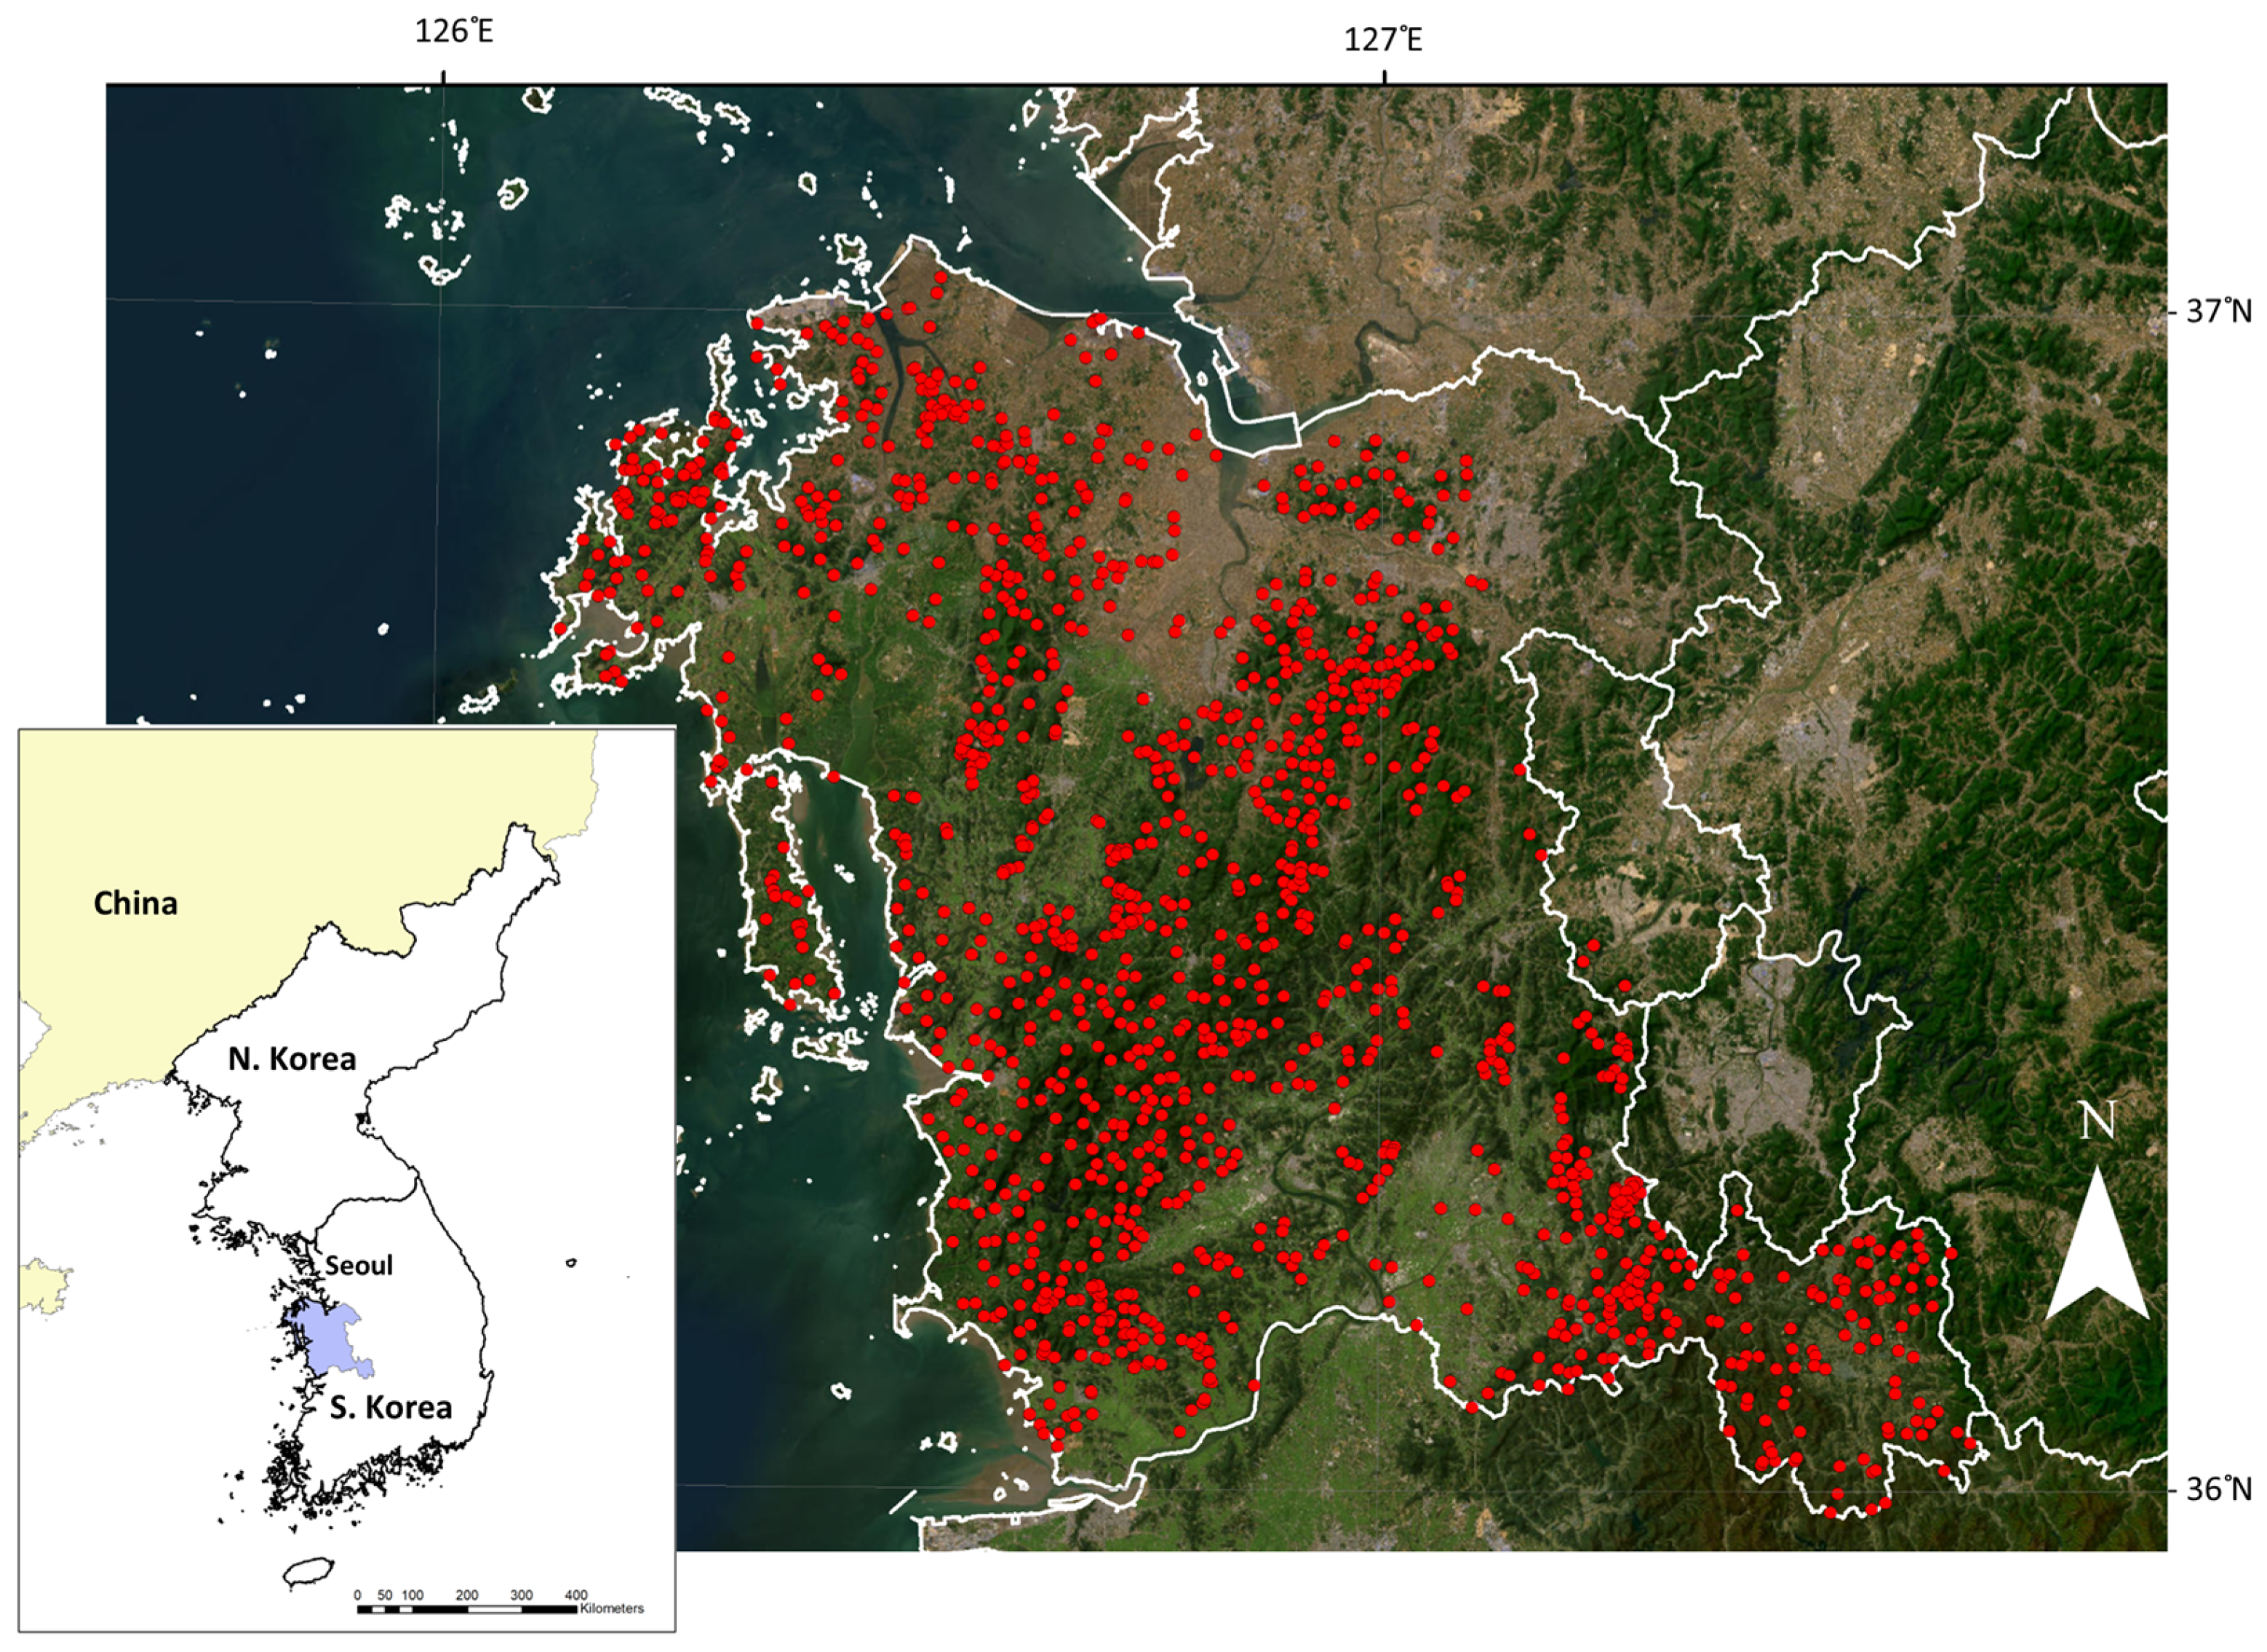
2.1. Study Area

This study was conducted across the Province of Chungcheongnam (“Chungcheongnam-do” or “Chungnam”; hereafter referred to as Chungnam), which is located in the mid-western part of South Korea (35°00′~37°06′ N, 126°13′~127°63′ E; Figure 1). Chungnam covers an area of 8226 km2, consisting primarily of hilly or lowland terrain [15]. Over 70% of the land consists of forests and agricultural lands [16], and most forests have been reforested since the 1970s, featuring a mix of coniferous, deciduous, and mixed forests [17]. The average stocking volume of these forests was 139 m3/ha as of 2018 [18].
The humid continental climate of the study area is characterized by hot and humid summers and dry and cold winters [19]. The average annual temperature is 12.2 °C; the highest monthly temperature is 25.3 °C in August, and the lowest temperature is 1.7 °C in January. The average annual precipitation is 1310 mm, primarily concentrated in summer (July–September) [20].

2.2. Data and Analysis
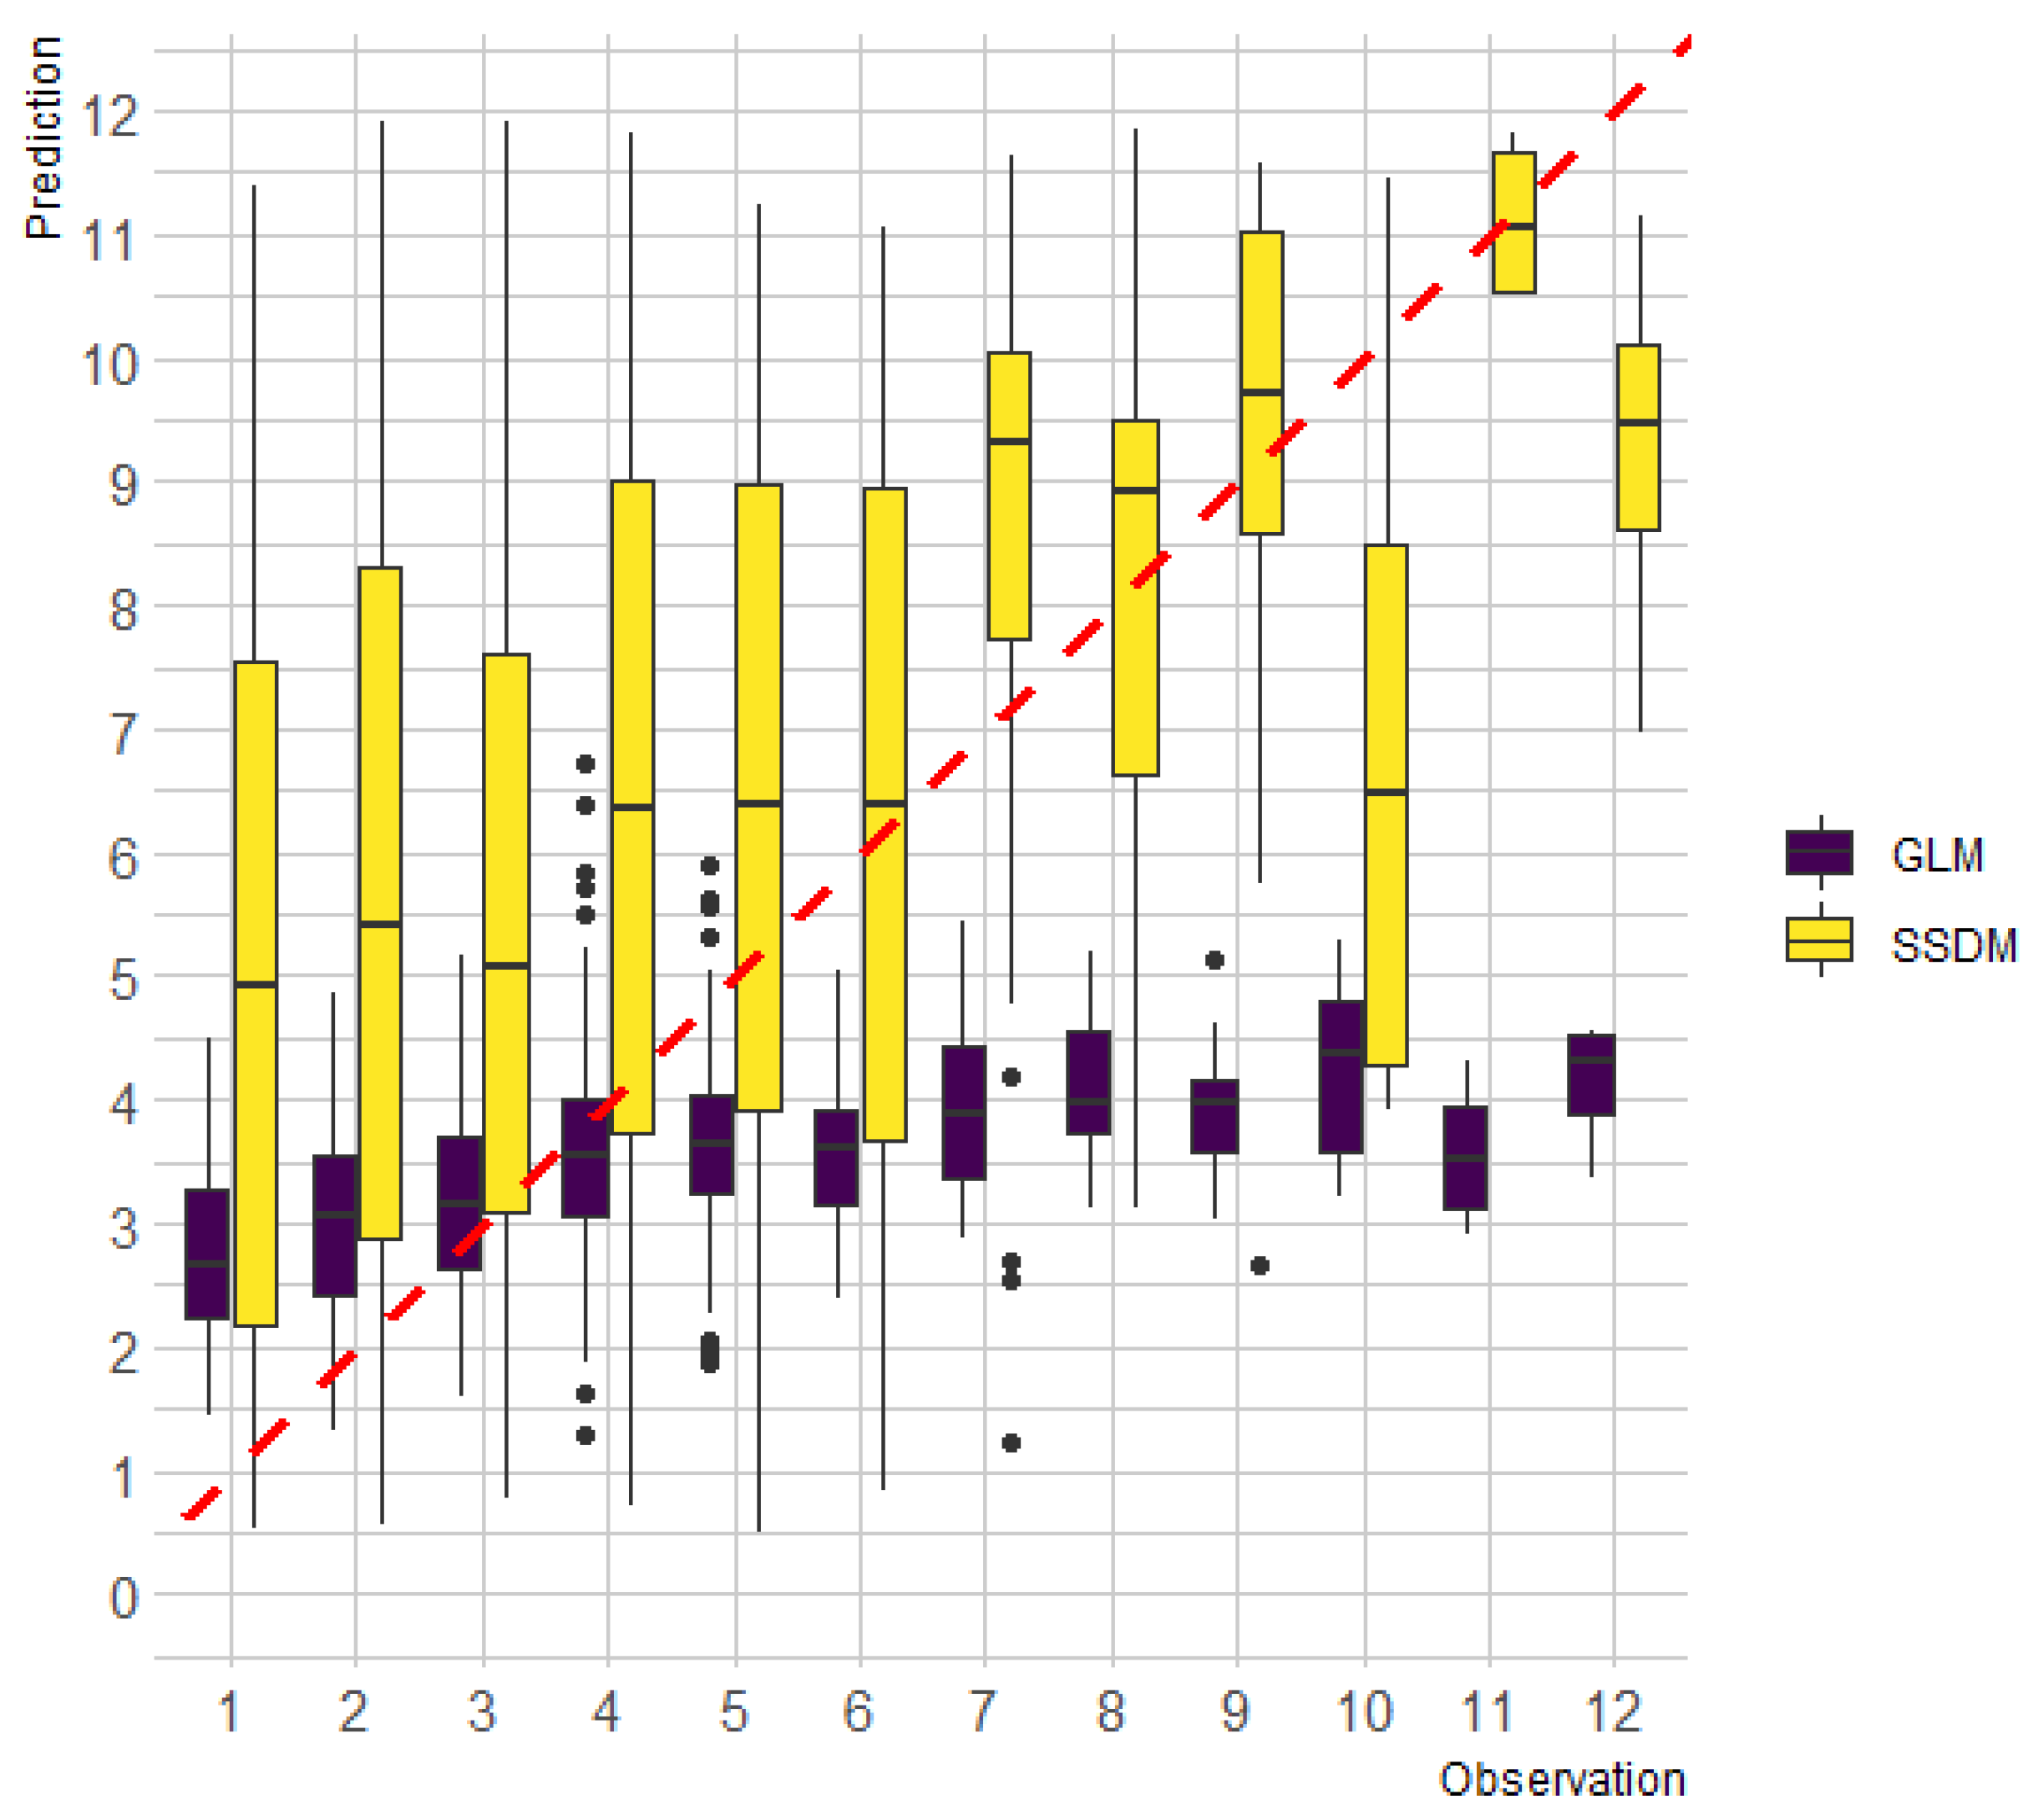
The collection of extensive mammal survey data was performed during the Biotope Mapping Project (2008–2014; Chungnam Institute) in the Province of Chungnam. The project was conducted for the purpose of classifying and identifying biotopes across the province; 1483 sampling points were randomly assigned. The field campaign also included an extensive wildlife survey (>~3500 survey points) across the province through 2–3 phases [21]. For the mammal survey, the researchers performed a thorough examination of the trace of mammal species within a 50 m radius at each sampling point. One to three skilled surveyors systematically established transects with 5–10 m intervals across the sampling area. They traversed these transects while recording the presence of all mammalian species through direct observations or the detection of signs such as tracks, feeding signs, habitats, scat, hair/fur, and carcasses. In this study, 1357 mammal sampling points randomly located in the forests were used for analysis (Figure 1).
Information relating to the forests in the sampling points was derived from the Korea Forest Cover Type Map (Korea Forest Service, Daejeon, Republic of Korea). The extracted information on forests included forest area (F_AREA), tree diameter class (DIA_CL), and the distance to the nearest forest edge (DIST_FOR; Table 1). The tree diameter class was categorized as median diameter at breast height (DBH) within the stand: (>50% of total trees were) <6 cm as size class 1, 6–18 cm as size class 2, 18–30 cm as size class 3, and >30 cm as size class 4, respectively.
Geographical and anthropogenic variables were extracted from digital thematic maps provided by the Korea National Geographic Information Institute (Suwon, Republic of Korea). A digital elevation model, road network, water channel maps, and population data were used to obtain the distance to the water channel (DIST_WAT), elevation (ELEV), population density (POP_DEN), and road density (RD_DEN) for each wildlife sampling point (Table 1).
Bioclimatic information for each sampling point was obtained from historical climate data from the WorldClim database (WorldClim.org (accessed on 15 October 2023), ver. 2.1; [22]). Nineteen standard bioclimate variables represent the averages for 1970–2000 with 30 s resolution. Details regarding the bioclimate variables are shown in Table 1.
All procedures for the processing and mapping of spatial data were performed at a resolution of 100 m × 100 m (except bioclimate variables) using ArcGIS Desktop (ver. 10.8.1 ESRI Inc. Redlands, CA, USA).
The ensemble species distribution model (ESDM) for each species of mammal was fitted against the 27 variables (Table 1) using a generalized linear model (GLM; [23]), generalized boosted regression model (GBM [24]), random forest (RF [25]), MaxEnt (MAXENT [26]), classification tree analysis (CTA [27]), and support vector machines (SVMs [28]). Each algorithm was implemented and evaluated using a hold-out cross-validation method. Seventy percent of the data were partitioned into a training set, and the cross-validation process was iterated twice per algorithm. All of the other settings for the individual algorithms were tuned to the defaults specified by Schmitt et al. [12]. The area under the receiver operating characteristic curve, with a selection threshold set to 0.6, was used to select the algorithms for the ensemble process.
The stacked species distribution model (SSDM) was generated to evaluate species richness by aggregating continuous habitat suitability maps for the ESDM for each species [29]. The staking process employed the spatially explicit species assemblage modeling (SESAM) framework [30]. The SESAM framework refines species richness prediction through four consecutive filtering processes: (1) dispersal filtering, (2) habitat suitability filtering using SDMs, (3) incorporating macroecological constraints through macroecological models, and (4) biotic filtering through ecological assembly rules [12,30].
The importance of environmental variables was analyzed in two steps. First, each ESDM (full model) was compared with a refitted ESDM that omitted the target environmental variable (reduced model). The Pearson’s correlation coefficient (r) for predictions between the full model and the reduced model was computed, and the score for each environmental variable was calculated as 1-r. Subsequently, these scores were averaged across all ESDMs [12].
Additionally, an endemism map was constructed to explore the location where a unique species occurs within the study area. This involved the weighted endemism index by scoring endemism (i.e., counting species richness) in a cell while weighing each species by the inverse of its range [31].
The assessment of the performance of SSDM was based on (1) the species richness error, (2) assemblage prediction success, (3) Cohen’s kappa, (4) specificity, (5) sensitivity, and (6) the Jaccard index [32], as suggested by Schmitt et al. [12]. In addition, a simple macroecological model (i.e., Poisson regression fitting species richness as a dependent variable) was fitted and compared using a scatter plot for the evaluation of the overprediction issue. All model constructions (ESDMs and an SSDM) and assessments were performed using the SSDM package [12] of R statistical software [23].

3. Results

The field campaign identified 4414 traces from 16 mammal species found throughout the province. Korean water deer (Hydropotes inermis) was observed most frequently, followed by large mole (Mogera robusta), Eurasian red squirrel (Sciurus vulgaris), common raccoon dog (Nyctereutes procyonoides), and leopard cat (Prionailurus bengalensis), respectively (Table 2).
The local species richness of mammalian species estimated using the SSDM ranged from 0.3 to 12.6 (average: 4.4). High species richness was observed in regions dispersed in southwestern directions, along with mountain ranges such as the Charyeong and Noryeong mountain ranges (Figure 2a). The pattern shown on the endemism map was similar to that observed on the local species richness map, suggesting a trend toward greater mammalian species richness in regions with high endemism (Figure 2b).
Distance to forest edge, elevation, slope, population density, and distance to water channels were identified as the major contributors to local mammalian species richness (Table 3). These five variables collectively accounted for 53% of the total relative importance. In particular, in 10 out of 16 surveyed species, distance to the forest edge and elevation were crucial factors (i.e., within the top 3) influencing their distribution. In contrast, bioclimate variables were not important factors affecting mammalian species.
The difference between predicted and observed species richness, denoted as species richness error, averaged 3.89 (Table 4), indicating that the SSDM somewhat lacked precision for the prediction of mammalian species richness. However, the metrics of the proportion of correct predictions (0.72) and sensitivity (0.93) indicated that the performance of the model in detecting the presence of mammalian species was notable. Compared to a macroecological model, the overprediction of species richness by SSDM tended to occur at the sampling points with lower species richness. In contrast, superior performance was demonstrated at sampling points with higher species richness (Figure 3).

4. Discussion

The modeling results indicating that the distance to the forest edge is the most important variable influencing mammalian richness in Chungnam were not unexpected. This result supports other findings; for example, Rovero et al. [33] reported that the distance to the forest edge is the major determinant for the distribution of most tropical mammalian species. In the context of fragmented forests, such as our study area, the impact of the distance to the forest edge on species richness may be more pronounced [34].
This speculation is reinforced by our observations of a decline in species richness with increasing distance to the forest edge when using both SSDM and the macroecological model (Figure S1a and Table S1). The prevalence of generalist species that have been observed among species that are highly affected by the distance to the forest edge might indicate that the long history of forest fragmentation in the study area [21] might be a factor in the dominance of matrix-tolerant mammals. According to Laurance [35], those species may have advantages in (1) dispersing between fragments (rescue effect), (2) recolonizing fragments against local extinctions, and (3) exploitation of resources such as food and habitat around fragments (edge effect).
The relationship between biodiversity and elevation has been studied extensively in the fields of ecology and biogeography [36,37]. Considering the hump-shaped pattern of species richness with elevation [38,39], the peak of species richness would be expected to occur at intermediate elevation levels (Mid-domain effect; sensu [40]). This effect explains the increasing pattern observed in the mid-elevational zone, which can be attributed in part to the increased overlapping of species’ random placements among hard boundaries such as rivers and summits at the mid-point of the domain, even without any ecological or evolutionary processes [40,41]. If so, the continuously increasing species richness with increasing elevation (Figure S1b) might indicate that the topography of the study area is adequately gentle, allowing for a broad range of overlapping habitat types.
While preferences for slope gradients may differ for each wildlife species, a common preference for gentle slopes can be observed in many mammalian species in Korea [42], including Siberian roe deer (Capreolus pygargus) [43], leopard cat [17], Korean water deer [15,44], and wild boar (Sus scrofa) [45]. Compared to other neighboring provinces, the adequate forests with gentle slope gradients found within the study region can serve as ecological corridors, facilitating movement [44], enhancing the availability of water [43] and food resources [44], providing sites for resting and hunting [46], and for avoiding mountainous carnivores [15] and human conflicts [17].
The growing human population and subsequent activities have led to the shift from a mosaic of diverse ecosystems to a uniform landscape with human-dominated ecosystems [47]. The impact of humans on species diversity has been well-documented, as human population density has been reported as a major cause of the decline of species diversity, including mammalian species [48]. The observed tendency toward a negative association between population density and mammalian richness (Figure S1d) corresponds with this assertion. However, the relationship is still being debated, and the existing documented studies focus primarily on sensitive individual species; thus, caution is warranted in drawing a general conclusion [49].
Proximity to water, in conjunction with food sources and green vegetation cover, has been reported as a critical factor in shaping species distribution [50,51]. However, the low relative importance value for the distance to water may be attributed in part to the scale of the study region. Rich et al. [52] suggested that water might be less of a limiting factor on a regional scale. In addition, given the generally moist and mild climate and abundant water resources within the study region, water is not considered a limiting factor for wildlife habitat [53]. Additionally, for certain prey species, maintaining distance from water may be an adoptable strategic behavior to avoid predation, as suggested by de Boer et al. [54].
However, caution is warranted when interpreting SSDM results due to several limitations. First, as with all other species distribution modeling approaches, incomplete species occurrence data and imperfect model specification can result in increased uncertainty and bias [55]. Discrepancies in resolutions and mismatches among environmental variables used in fitting the ESDMs (for detail, please refer to Table S2) may not be a sound representation of the actual conditions experienced by each organism [56]. Furthermore, the environmental variables identified by SSDM do not account for the positive or negative relationships to individual species. As a result, the magnitudes of effects of environmental variables on species richness could be different from those predicted by SSDM.
Overestimation has also been a criticism of SSDM ([12,30,57]), and the results of our study support these concerns, showing overestimation in areas where low species richness has been observed. Earlier studies (e.g., [11,58,59]) reported on the impact of species prevalence using biased results. In addition, the scale of the study region may be another factor affecting model performance, as relationships between species richness and environmental effects can vary according to spatial scale [13]. Lack of consideration for biotic interaction might also be a potential contributor to overestimation [60].
Nonetheless, the results of the study demonstrated the usefulness of the SSDM in the management of wildlife in Chungnam. Its superior performance, when compared with the macroecological approach in areas where high species richness was observed, was demonstrated. It was able to identify environmental variables that are important for mammalian species richness, which were not identified when using the macroecological model. The discrepancy in results between the SSDM and the macroecological approach might indicate the necessity of using an ensemble modeling approach. In addition, the strong correlation between species richness and endemism shown by the SSDM (Figure 2) might indicate that areas with an abundance of endemic species should be given higher priority for enhancing and conserving overall species richness. Therefore, the findings of this study can provide valuable insights that may be helpful to land managers in the effort to facilitate better decision-making for effective management of wildlife habitats.

5. Conclusions

Based on the results of SSDM modeling, significant environmental variables influencing regional mammalian species richness in Chungnam were identified. The distance to the forest edge, which was the most influential variable, would presumably be more pronounced in fragmented forests with a long history of land use. The negative association between the distance to the forest edge and mammalian species richness might indicate that forest fragmentation supports matrix-tolerant mammals. The model indicated that the gentle topography (i.e., elevation and slope) is also a critical environmental variable affecting mammalian species richness in the study region. Human impacts appear to have a negative impact on mammalian species richness, whereas bioclimate variables were not a limiting factor for species richness. Overestimation, when using the SSDM, cautions that species prevalence, spatial scale, and biotic interaction should be considered when interpreting modeling results. Despite these challenges, the findings of the study demonstrated that valuable information and insights can be obtained with use of the SSDM, which can be utilized by land managers for effective management of wildlife habitats, particularly in areas with high species richness and an abundance of endemic species.

Supplementary Materials

The following supporting information can be downloaded at: https://www.mdpi.com/article/10.3390/ani14050759/s1. Figure S1: Scatter plots between observed species richness and (a) the distance to forest edge, (b) elevation, (c) slope, and (d) population density, respectively. Red lines present the loess smoothing lines.; Table S1: Summary statistics of the macroecology model (Poisson regression) for mammalian species richness in the Province of Chungman. Notations for the variables were described in Table 2.; Table S2: Summary statistics of ensemble species distribution model performance for individual mammalian species in the Province of Chungman. Notations for the species were described in Table 3.

Author Contributions

Conceptualization, O.-S.C. and J.K.L.; writing—review and editing, O.-S.C. and J.K.L.; funding acquisition, J.K.L. All authors have read and agreed to the published version of the manuscript.

Funding

This study was carried out with the support of ‘R&D Program for Forest Science Technology (Project No. 2021336B10-2123-CD02) provided by Korea Forest Service (Korea Forestry Promotion Institute).

Institutional Review Board Statement

Not applicable.

Informed Consent Statement

Not applicable.

Data Availability Statement

The data presented in this study were obtained from various entities, as shown in Table 1. The data may be available from the entities upon reasonable request.

Acknowledgments

The authors appreciate Woongsoon Jang for his effort and comments on this article.

Conflicts of Interest

The authors declare no conflicts of interest.

References

  1. Buisson, L.; Thuiller, W.; Casajus, N.; Lek, S.; Grenouillet, G. Uncertainty in Ensemble Forecasting of Species Distribution. Glob. Chang. Biol. 2010, 16, 1145–1157. [Google Scholar] [CrossRef]
  2. Thuiller, W. BIOMOD–Optimizing Predictions of Species Distributions and Projecting Potential Future Shifts under Global Change. Glob. Chang. Biol. 2003, 9, 1353–1362. [Google Scholar] [CrossRef]
  3. Calabrese, J.M.; Certain, G.; Kraan, C.; Dormann, C.F. Stacking Species Distribution Models and Adjusting Bias by Linking Them to Macroecological Models. Glob. Ecol. Biogeogr. 2014, 23, 99–112. [Google Scholar] [CrossRef]
  4. Pecchi, M.; Marchi, M.; Burton, V.; Giannetti, F.; Moriondo, M.; Bernetti, I.; Bindi, M.; Chirici, G. Species Distribution Modelling to Support Forest Management. A Literature Review. Ecol. Model. 2019, 411, 108817. [Google Scholar] [CrossRef]
  5. Hao, T.; Elith, J.; Guillera-Arroita, G.; Lahoz-Monfort, J.J. A Review of Evidence about Use and Performance of Species Distribution Modelling Ensembles like BIOMOD. Divers. Distrib. 2019, 25, 839–852. [Google Scholar] [CrossRef]
  6. Elith, J.H.; Graham, C.P.; Anderson, R.; Dudík, M.; Ferrier, S.; Guisan, A.; Hijmans, R.J.; Huettmann, F.; Leathwick, J.R.; Lehmann, A.; et al. Novel Methods Improve Prediction of Species’ Distributions from Occurrence Data. Ecography 2006, 29, 129–151. [Google Scholar] [CrossRef]
  7. Segurado, P.; Araújo, M.B. An Evaluation of Methods for Modelling Species Distributions. J. Biogeogr. 2004, 31, 1555–1568. [Google Scholar] [CrossRef]
  8. Araújo, M.B.; New, M. Ensemble Forecasting of Species Distributions. Trends Ecol. Evol. 2007, 22, 42–47. [Google Scholar] [CrossRef]
  9. Ferrier, S.; Guisan, A. Spatial Modelling of Biodiversity at the Community Level. J. Appl. Ecol. 2006, 43, 393–404. [Google Scholar] [CrossRef]
  10. Mateo, R.G.; Felicísimo, Á.M.; Pottier, J.; Guisan, A.; Muñoz, J. Do Stacked Species Distribution Models Reflect Altitudinal Diversity Patterns? PLoS ONE 2012, 7, e32586. [Google Scholar] [CrossRef]
  11. Biber, M.F.; Voskamp, A.; Niamir, A.; Hickler, T.; Hof, C. A Comparison of Macroecological and Stacked Species Distribution Models to Predict Future Global Terrestrial Vertebrate Richness. J. Biogeogr. 2020, 47, 114–129. [Google Scholar] [CrossRef]
  12. Schmitt, S.; Pouteau, R.; Justeau, D.; de Boissieu, F.; Birnbaum, P. SSDM: An r Package to Predict Distribution of Species Richness and Composition Based on Stacked Species Distribution Models. Methods Ecol. Evol. 2017, 8, 1795–1803. [Google Scholar] [CrossRef]
  13. Hortal, J.; Lobo, J.M.; Jiménez-Valverde, A. Limitations of Biodiversity Databases: Case Study on Seed-Plant Diversity in Tenerife, Canary Islands. Conserv. Biol. 2007, 21, 853–863. [Google Scholar] [CrossRef]
  14. Hortal, J.; Rodríguez, J.; Nieto-Díaz, M.; Lobo, J.M. Regional and Environmental Effects on the Species Richness of Mammal Assemblages. J. Biogeogr. 2008, 35, 1202–1214. [Google Scholar] [CrossRef]
  15. Jang, W.; Kim, B.; Chung, O.-S.; Lee, J.K. Analysis of Water Deer Roadkills Using Point Process Modeling in Chungcheongnamdo, South Korea. Forests 2022, 13, 209. [Google Scholar] [CrossRef]
  16. MOLIT Statistics System Korean Statistical Information Service. Available online: https://kosis.kr/index/index.do (accessed on 22 August 2023).
  17. Chung, O.-S.; Lee, J.K. Association of Leopard Cat Occurrence with Environmental Factors in Chungnam Province, South Korea. Animals 2023, 13, 122. [Google Scholar] [CrossRef]
  18. Korea Forest Service. Statistical Yearbook of Forestry 2018; Korea Forest Service: Daejeon, Republic of Korea, 2018. [Google Scholar]
  19. Kim, E.S.; Choi, H.I. Estimation of the Relative Severity of Floods in Small Ungauged Catchments for Preliminary Observations on Flash Flood Preparedness: A Case Study in Korea. Int. J. Environ. Res. Public Health 2012, 9, 1507–1522. [Google Scholar] [CrossRef]
  20. Korea Meteorological Administration Korea Meteorological Administration Website. Available online: https://www.weather.go.kr/w/index.do (accessed on 14 May 2023).
  21. Jang, W.; Seol, A.; Chung, O.-S.; Sagong, J.; Lee, J.K. Avian Reporting Rates in Chugcheongnam Province, South Korea Depend on Distance from Forest Edge, Size of Trees, and Size of Forest Fragments. Forests 2019, 10, 364. [Google Scholar] [CrossRef]
  22. Fick, S.E.; Hijmans, R.J. WorldClim 2: New 1-Km Spatial Resolution Climate Surfaces for Global Land Areas. Int. J. Climatol. 2017, 37, 4302–4315. [Google Scholar] [CrossRef]
  23. R Core Team. R: A Language and Environment for Statistical Computing; R Core Team: Vienna, Austria, 2021. [Google Scholar]
  24. Greenwell, B.; Boehmke, B.; Cunningham, J. GBM Developers. Gbm: Generalized Boosted Regression Models. Available online: https://cran.r-project.org/web/packages/gbm/gbm.pdf (accessed on 13 August 2022).
  25. Liaw, A.; Wiener, M. Classification and Regression by randomForest. R News 2002, 2, 18–22. Available online: https://journal.r-project.org/articles/RN-2002-022/RN-2002-022.pdf (accessed on 19 December 2023).
  26. Hijmans, R.J.; Phillips, S.; Leathwick, J.; Elith, J. Dismo: Species Distribution Modeling. Available online: https://cran.r-project.org/web/packages/dismo/dismo.pdf (accessed on 4 December 2022).
  27. Therneau, T.; Atkinson, B. Rpart: Recursive Partitioning and Regression Trees. Available online: https://cran.r-project.org/web/packages/rpart/rpart.pdf (accessed on 18 May 2021).
  28. Meyer, D.; Dimitriadou, E.; Hornik, K.; Weingessel, A.; Leisch, F. E1071: Misc Functions of the Department of Statistics, Probability Theory Group (Formerly: E1071), TU Wien. Available online: https://cran.r-project.org/web/packages/e1071/e1071.pdf (accessed on 28 June 2021).
  29. Mateo, R.G.; de la Estrella, M.; Felicísimo, Á.M.; Muñoz, J.; Guisan, A. A New Spin on a Compositionalist Predictive Modelling Framework for Conservation Planning: A Tropical Case Study in Ecuador. Biol. Conserv. 2013, 160, 150–161. [Google Scholar] [CrossRef]
  30. Guisan, A.; Rahbek, C. SESAM–A New Framework Integrating Macroecological and Species Distribution Models for Predicting Spatio-Temporal Patterns of Species Assemblages. J. Biogeogr. 2011, 38, 1433–1444. [Google Scholar] [CrossRef]
  31. Crisp, M.D.; Laffan, S.; Linder, H.P.; Monro, A. Endemism in the Australian Flora. J. Biogeogr. 2001, 28, 183–198. [Google Scholar] [CrossRef]
  32. Pottier, J.; Dubuis, A.; Pellissier, L.; Maiorano, L.; Rossier, L.; Randin, C.F.; Vittoz, P.; Guisan, A. The Accuracy of Plant Assemblage Prediction from Species Distribution Models Varies along Environmental Gradients. Glob. Ecol. Biogeogr. 2013, 22, 52–63. [Google Scholar] [CrossRef]
  33. Rovero, F.; Martin, E.; Rosa, M.; Ahumada, J.A.; Spitale, D. Estimating Species Richness and Modelling Habitat Preferences of Tropical Forest Mammals from Camera Trap Data. PLoS ONE 2014, 9, e103300. [Google Scholar] [CrossRef]
  34. de la Sancha, N.U. Patterns of Small Mammal Diversity in Fragments of Subtropical Interior Atlantic Forest in Eastern Paraguay. Mammalia 2014, 78, 437–449. [Google Scholar] [CrossRef]
  35. Laurance, W.F. Rainforest Fragmentation and the Structure of Small Mammal Communities in Tropical Queensland. Biol. Conserv. 1994, 69, 23–32. [Google Scholar] [CrossRef]
  36. Rickart, E.A. Elevational Diversity Gradients, Biogeography and the Structure of Montane Mammal Communities in the Intermountain Region of North America. Glob. Ecol. Biogeogr. 2001, 10, 77–100. [Google Scholar] [CrossRef]
  37. Li, J.S.; Song, Y.L.; Zeng, Z.G. Elevational Gradients of Small Mammal Diversity on the Northern Slopes of Mt. Qilian, China. Glob. Ecol. Biogeogr. 2003, 12, 449–460. [Google Scholar] [CrossRef]
  38. Rahbek, C. The Elevational Gradient of Species Richness: A Uniform Pattern? Ecography 1995, 18, 200–205. [Google Scholar] [CrossRef]
  39. Lomolino, M.V. Elevation Gradients of Species-Density: Historical and Prospective Views. Glob. Ecol. Biogeogr. 2001, 10, 3–13. [Google Scholar] [CrossRef]
  40. Colwell, R.K.; Lees, D.C. The Mid-Domain Effect: Geometric Constraints on the Geography of Species Richness. Trends Ecol. Evol. 2000, 15, 70–76. [Google Scholar] [CrossRef]
  41. Shuai, L.-Y.; Ren, C.-L.; Yan, W.-B.; Song, Y.-L.; Zeng, Z.-G. Different Elevational Patterns of Rodent Species Richness between the Southern and Northern Slopes of a Mountain. Sci. Rep. 2017, 7, 8743. [Google Scholar] [CrossRef]
  42. Jeong, E.; Cho, M.; Cho, H.; Cho, B.; Han, S. Characteristics of Forest Road Cut Slopes Affecting the Movement of Mammals in South Korea. For. Sci. Technol. 2021, 17, 155–161. [Google Scholar] [CrossRef]
  43. Park, Y.-S.; Lee, W.-S. Characteristics of Habitat-using of Siberian Roe Deer in Seoraksan(Mt.) National Park. J. Korean Soc. Environ. Restor. Technol. 2014, 17, 91–109. [Google Scholar] [CrossRef]
  44. Jeong, S.; Kim, H.G.; Thorne, J.H.; Lee, H.; Cho, Y.-H.; Lee, D.K.; Park, C.H.; Seo, C. Evaluating Connectivity for Two Mid-Sized Mammals across Modified Riparian Corridors with Wildlife Crossing Monitoring and Species Distribution Modeling. Glob. Ecol. Conserv. 2018, 16, e00485. [Google Scholar] [CrossRef]
  45. Kim, Y.; Cho, S.; Choung, Y. Habitat Preference of Wild Boar (Sus scrofa) for Feeding in Cool-Temperate Forests. J. Ecol. Environ. 2019, 43, 30. [Google Scholar] [CrossRef]
  46. Wu, J.; Wang, J.; Zhu, Y.; Bu, X.; Xiang, R.; Lu, Q.; Cui, S.; Hao, Y.; Sheng, Y.; Meng, X. Summer Habitat Selection and Impacts of Human Disturbance on Leopard Cats (Prionailurus bengalensis). Ecosyst. Health Sustain. 2020, 6, 1856630. [Google Scholar] [CrossRef]
  47. Cincotta, R.P. The Biological Diversity That Is Humanly Possible: Three Models Relevant to Human Population’s Relationship with Native Species. In Human Population: Its Influences on Biological Diversity; Cincotta, R.P., Gorenflo, L.J., Eds.; Ecological Studies; Springer: Berlin/Heidelberg, Germany, 2011; pp. 61–73. ISBN 978-3-642-16707-2. [Google Scholar]
  48. McKee, J.; Chambers, E.; Guseman, J. Human Population Density and Growth Validated as Extinction Threats to Mammal and Bird Species. Hum. Ecol. 2013, 41, 773–778. [Google Scholar] [CrossRef]
  49. Luck, G.W. A Review of the Relationships between Human Population Density and Biodiversity. Biol. Rev. 2007, 82, 607–645. [Google Scholar] [CrossRef]
  50. Megaze, A.; Balakrishnan, M.; Belay, G. Current Population Estimate and Distribution of the African Buffalo in Chebera Churchura National Park, Ethiopia. Afr. J. Ecol. 2018, 56, 12–19. [Google Scholar] [CrossRef]
  51. Gunda, D.M.; Chambi, D.; Eustace, A. Do Vegetation, Disturbances, and Water Influence Large Mammal Distribution? Geol. Ecol. Landsc. 2022, 6, 150–158. [Google Scholar] [CrossRef]
  52. Rich, L.N.; Miller, D.A.W.; Robinson, H.S.; McNutt, J.W.; Kelly, M.J. Using Camera Trapping and Hierarchical Occupancy Modelling to Evaluate the Spatial Ecology of an African Mammal Community. J. Appl. Ecol. 2016, 53, 1225–1235. [Google Scholar] [CrossRef]
  53. Rho, P.-H. Using a Landscape Ecological Approach to Develop a Wildlife Habitat Model in Korea; Korea Environment Institute: Seoul, Republic of Korea, 2004; p. 22. [Google Scholar]
  54. de Boer, W.F.; Vis, M.J.P.; de Knegt, H.J.; Rowles, C.; Kohi, E.M.; van Langevelde, F.; Peel, M.; Pretorius, Y.; Skidmore, A.K.; Slotow, R.; et al. Spatial Distribution of Lion Kills Determined by the Water Dependency of Prey Species. J. Mammal. 2010, 91, 1280–1286. [Google Scholar] [CrossRef]
  55. Barry, S.; Elith, J. Error and Uncertainty in Habitat Models. J. Appl. Ecol. 2006, 43, 413–423. [Google Scholar] [CrossRef]
  56. Lyons, D.A.; Lowen, J.B.; Therriault, T.W.; Brickman, D.; Guo, L.; Moore, A.M.; Peña, A.; Wang, Z.; DiBacco, C. Identifying Marine Invasion Hotspots Using Stacked Species Distribution Models. Biol. Invasions 2020, 22, 3406–3423. [Google Scholar] [CrossRef]
  57. Hortal, J.; De Marco, P., Jr.; Santos, A.M.C.; Diniz-Filho, J.A.F. Integrating Biogeographical Processes and Local Community Assembly. J. Biogeogr. 2012, 39, 627–628. [Google Scholar] [CrossRef]
  58. Lobo, J.M.; Jiménez-Valverde, A.; Real, R. AUC: A Misleading Measure of the Performance of Predictive Distribution Models. Glob. Ecol. Biogeogr. 2008, 17, 145–151. [Google Scholar] [CrossRef]
  59. Leroy, B.; Delsol, R.; Hugueny, B.; Meynard, C.N.; Barhoumi, C.; Barbet-Massin, M.; Bellard, C. Without Quality Presence–Absence Data, Discrimination Metrics Such as TSS Can Be Misleading Measures of Model Performance. J. Biogeogr. 2018, 45, 1994–2002. [Google Scholar] [CrossRef]
  60. Grenié, M.; Violle, C.; Munoz, F. Is Prediction of Species Richness from Stacked Species Distribution Models Biased by Habitat Saturation? Ecol. Indic. 2020, 111, 105970. [Google Scholar] [CrossRef]
Figure 1. The Province of Chungnam (marked light blue in bottom left panel) and the location of the sampling points (red dots).
Animals 14 00759 g001
Figure 2. (a) Mammalian species richness and (b) endemism maps of the Province of Chungnam, predicted using a stacked species distribution model.
Animals 14 00759 g002
Figure 3. Comparison of mammalian species richness prediction between the stacked species distribution model (SSDM) and a macroecological model (GLM, i.e., Poisson regression). The red dashed line represents a 1:1 line.
Animals 14 00759 g003
Table 1. Description of variables for model construction.
VariablesNotationUnitNoteSource
Mammal Occurrence--BinomialCI
Forest AreaF_AREAm2 KFS
Diameter ClassDIA_CL-Categorical dataKFS
Distance to Forest EdgeDIST_FORmLog-transformedKFS
Distance to Water ChannelDIST_WATmLog-transformedKNGII
ElevationELEVm KNGII
SlopeSLOPE% KNGII
Population DensityPOP_DENpeople km−2Log-transformedKNGII
Road DensityRD_DENroads km−2 KNGII
Annual Mean TemperatureBIO1°C WorldClim
Mean Diurnal RangeBIO2°C WorldClim
IsothermalityBIO3%BIO2/BIO7 × 100WorldClim
Temperature SeasonalityBIO4°CStandard deviation × 100WorldClim
Max Temperature of Warmest MonthBIO5°C WorldClim
Min Temperature of Coldest MonthBIO6°C WorldClim
Temperature Annual RangeBIO7°CBIO5-BIO6WorldClim
Mean Temperature of Wettest QuarterBIO8°C WorldClim
Mean Temperature of Driest QuarterBIO9°C WorldClim
Mean Temperature of Warmest QuarterBIO10°C WorldClim
Mean Temperature of Coldest QuarterBIO11°C WorldClim
Annual PrecipitationBIO12mm WorldClim
Precipitation of Wettest MonthBIO13mm WorldClim
Precipitation of Driest MonthBIO14mm WorldClim
Precipitation SeasonalityBIO15-Coefficient of variationWorldClim
Precipitation of Wettest QuarterBIO16mm WorldClim
Precipitation of Driest QuarterBIO17mm WorldClim
Precipitation of Warmest QuarterBIO18mm WorldClim
Precipitation of Coldest QuarterBIO19mm WorldClim
CI: Chungnam Institute; KFS: Korea Forest Service; KNGII: Korea National Geographic Information Institute; WorldClim: WorldClim Database Bioclimate Variables (ver. 2.1).
Table 2. Mammalian species identified during the field campaign (n = 1357). The nomenclature of species names followed the Database of the National Species List of Korea.
Species NameScientific NameNotationOccurrences
Korean water deerHydropotes inermisHYIN1209
Large moleMogera robustaMORO858
Eurasian red squirrelSciurus vulgarisSCVU675
Common raccoon dogNyctereutes procyonoidesNYPR545
Leopard catPrionailurus bengalensisPRBE370
Siberian chipmunksEutamias sibiricusEUSI177
Yellow weaselMustela sibiricaMUSI167
Korean hareLepus coreanusLECO136
Wild boarSus scrofaSUSC90
Eurasian river otterLutra lutraLULU76
Asian BadgerMeles leucurusMELE34
Amur hedgehogErinaceus amurensisERAM24
Siberian roe deerCapreolus pygargusCAPY23
Yellow-throated martenMartes flavigulaMAFL10
Eurasian harvest mouseMicromys minutusMIMI10
Siberian flying squirrelPteromys volansPTVO5
Table 3. Relative importance of the top 10 variables affecting mammalian species richness and species whose distribution is impacted by those variables. Species were listed if each species’ distribution model indicated that the relative importance (parenthesis) of the variable was within the top three variables. Notations for variable and species are described in Table 2 and Table 3, respectively.
VariableRelative
Importance
Impacted Species
DIST_FOR28.4EUSI (16.8), HYIN (74.6), LECO (19.4), LULU (17.5), MORO (78.6), MUSI (43.7), NYPR (51.6), PRBE (54.2), SCVU (62.5), SUSC (7.9)
ELEV10.1CAPY (13.8), ERAM (12.2), EUSI (12.8), HYIN (5.5), MAFL (9.5), MELE (13.3), MUSI (9.3), NYPR (5.4), PRBE (5.6), SUSC (50.5)
SLOPE5.8CAPY (9.7), ERAM (16.0), LECO (12.4), LULU (10.9), MAFL (7.8), MORO (2.9)
POP_DEN4.9MAFL (15.3), MELE (11.6)
DIST_WAT4.1LECO (11.7), MELE (13.4)
DIA_CL3.7CAPY (16.9), LULU (7.5), MORO (1.6)
BIO103.3ERAM (22.1)
BIO132.9-
F_AREA2.7SUSC (4.6)
BIO42.7EUSI (6.6), SCVU (4.3)
Table 4. Model evaluation matrix for the stacked species distribution model for mammals in the Province of Chungnam.
Species Richness ErrorPrediction SuccessCohen’s KappaSpecificitySensitivityJaccard Index
3.890.721.000.670.930.41
Disclaimer/Publisher’s Note: The statements, opinions and data contained in all publications are solely those of the individual author(s) and contributor(s) and not of MDPI and/or the editor(s). MDPI and/or the editor(s) disclaim responsibility for any injury to people or property resulting from any ideas, methods, instructions or products referred to in the content.

