
Whole-Genome Sequencing Analyses Reveal the Evolution Mechanisms of Typical Biological Features of Decapterus maruadsi
 ,
,
Abstract
:Simple Summary
Abstract
1. Introduction
2. Materials and Methods
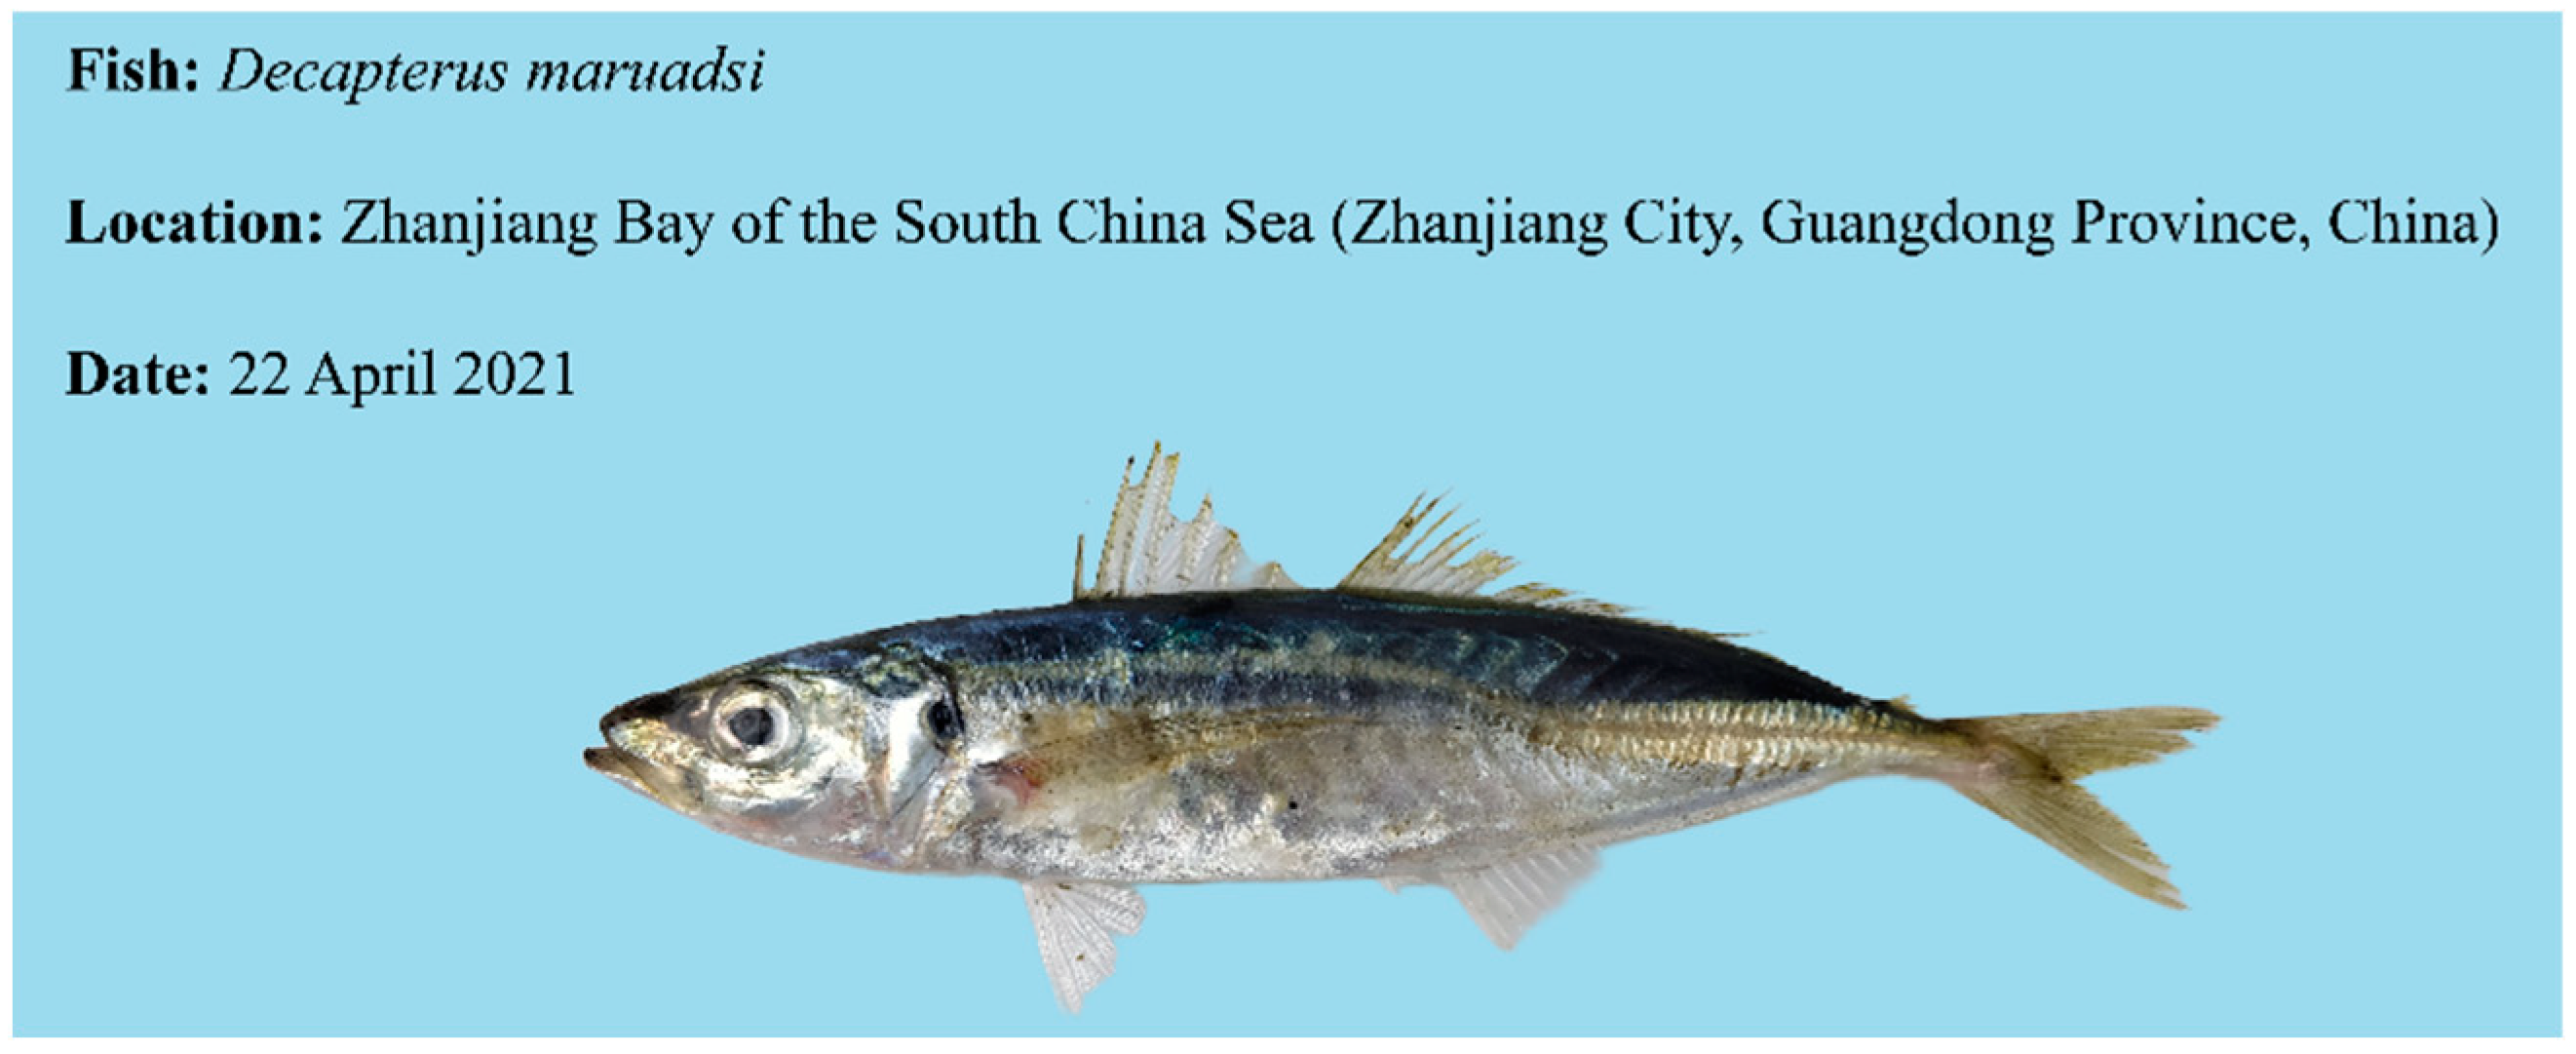
2.1. Sample Collection
2.2. DNA Library Construction and Sequencing (Illumina and PacBio)
2.3. De Novo Genome Assembly and Quality Assessment
2.4. Chromosome-Level Genome Assembly
2.5. Genome Annotation
2.5.1. RNA Library Construction and Sequencing (Illumina and PacBio)
2.5.2. Genome Annotation
2.6. Comparative Genome Analysis
3. Results
3.1. Analysis of Genomic Characterization
3.2. Genome Assembly and Evaluation
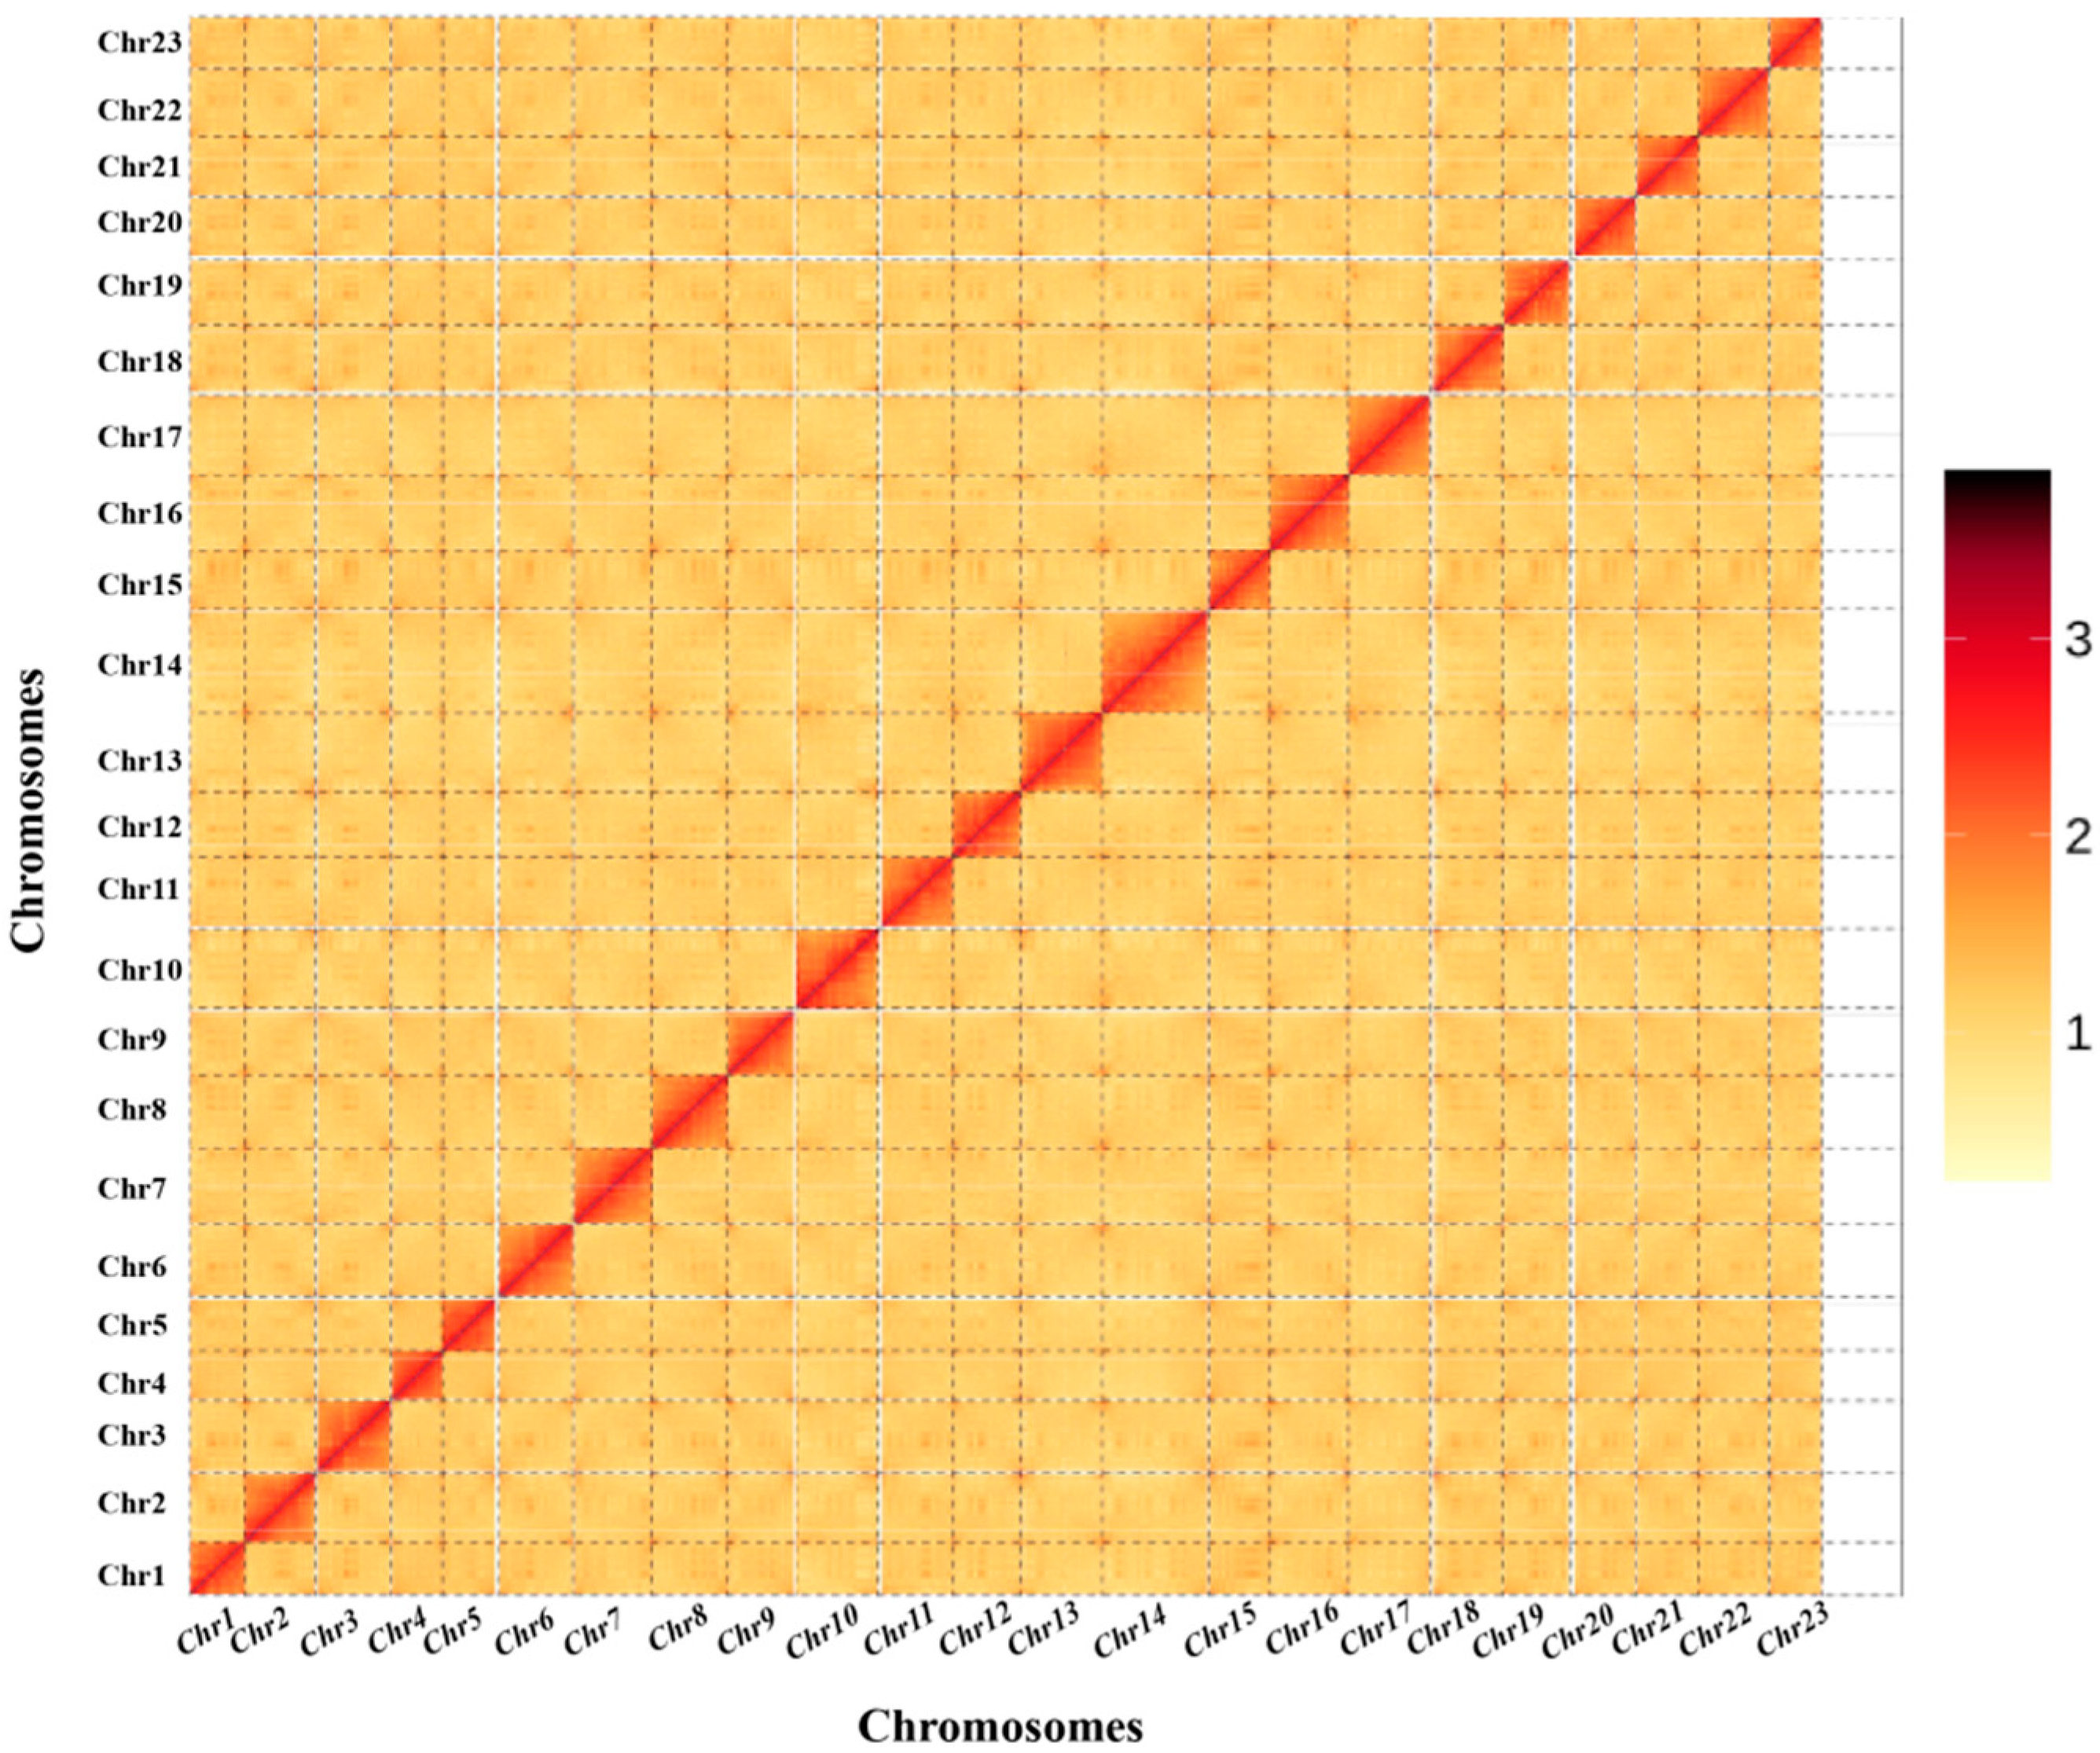
3.3. Chromosome-Level Genome Assembly by Hi-C
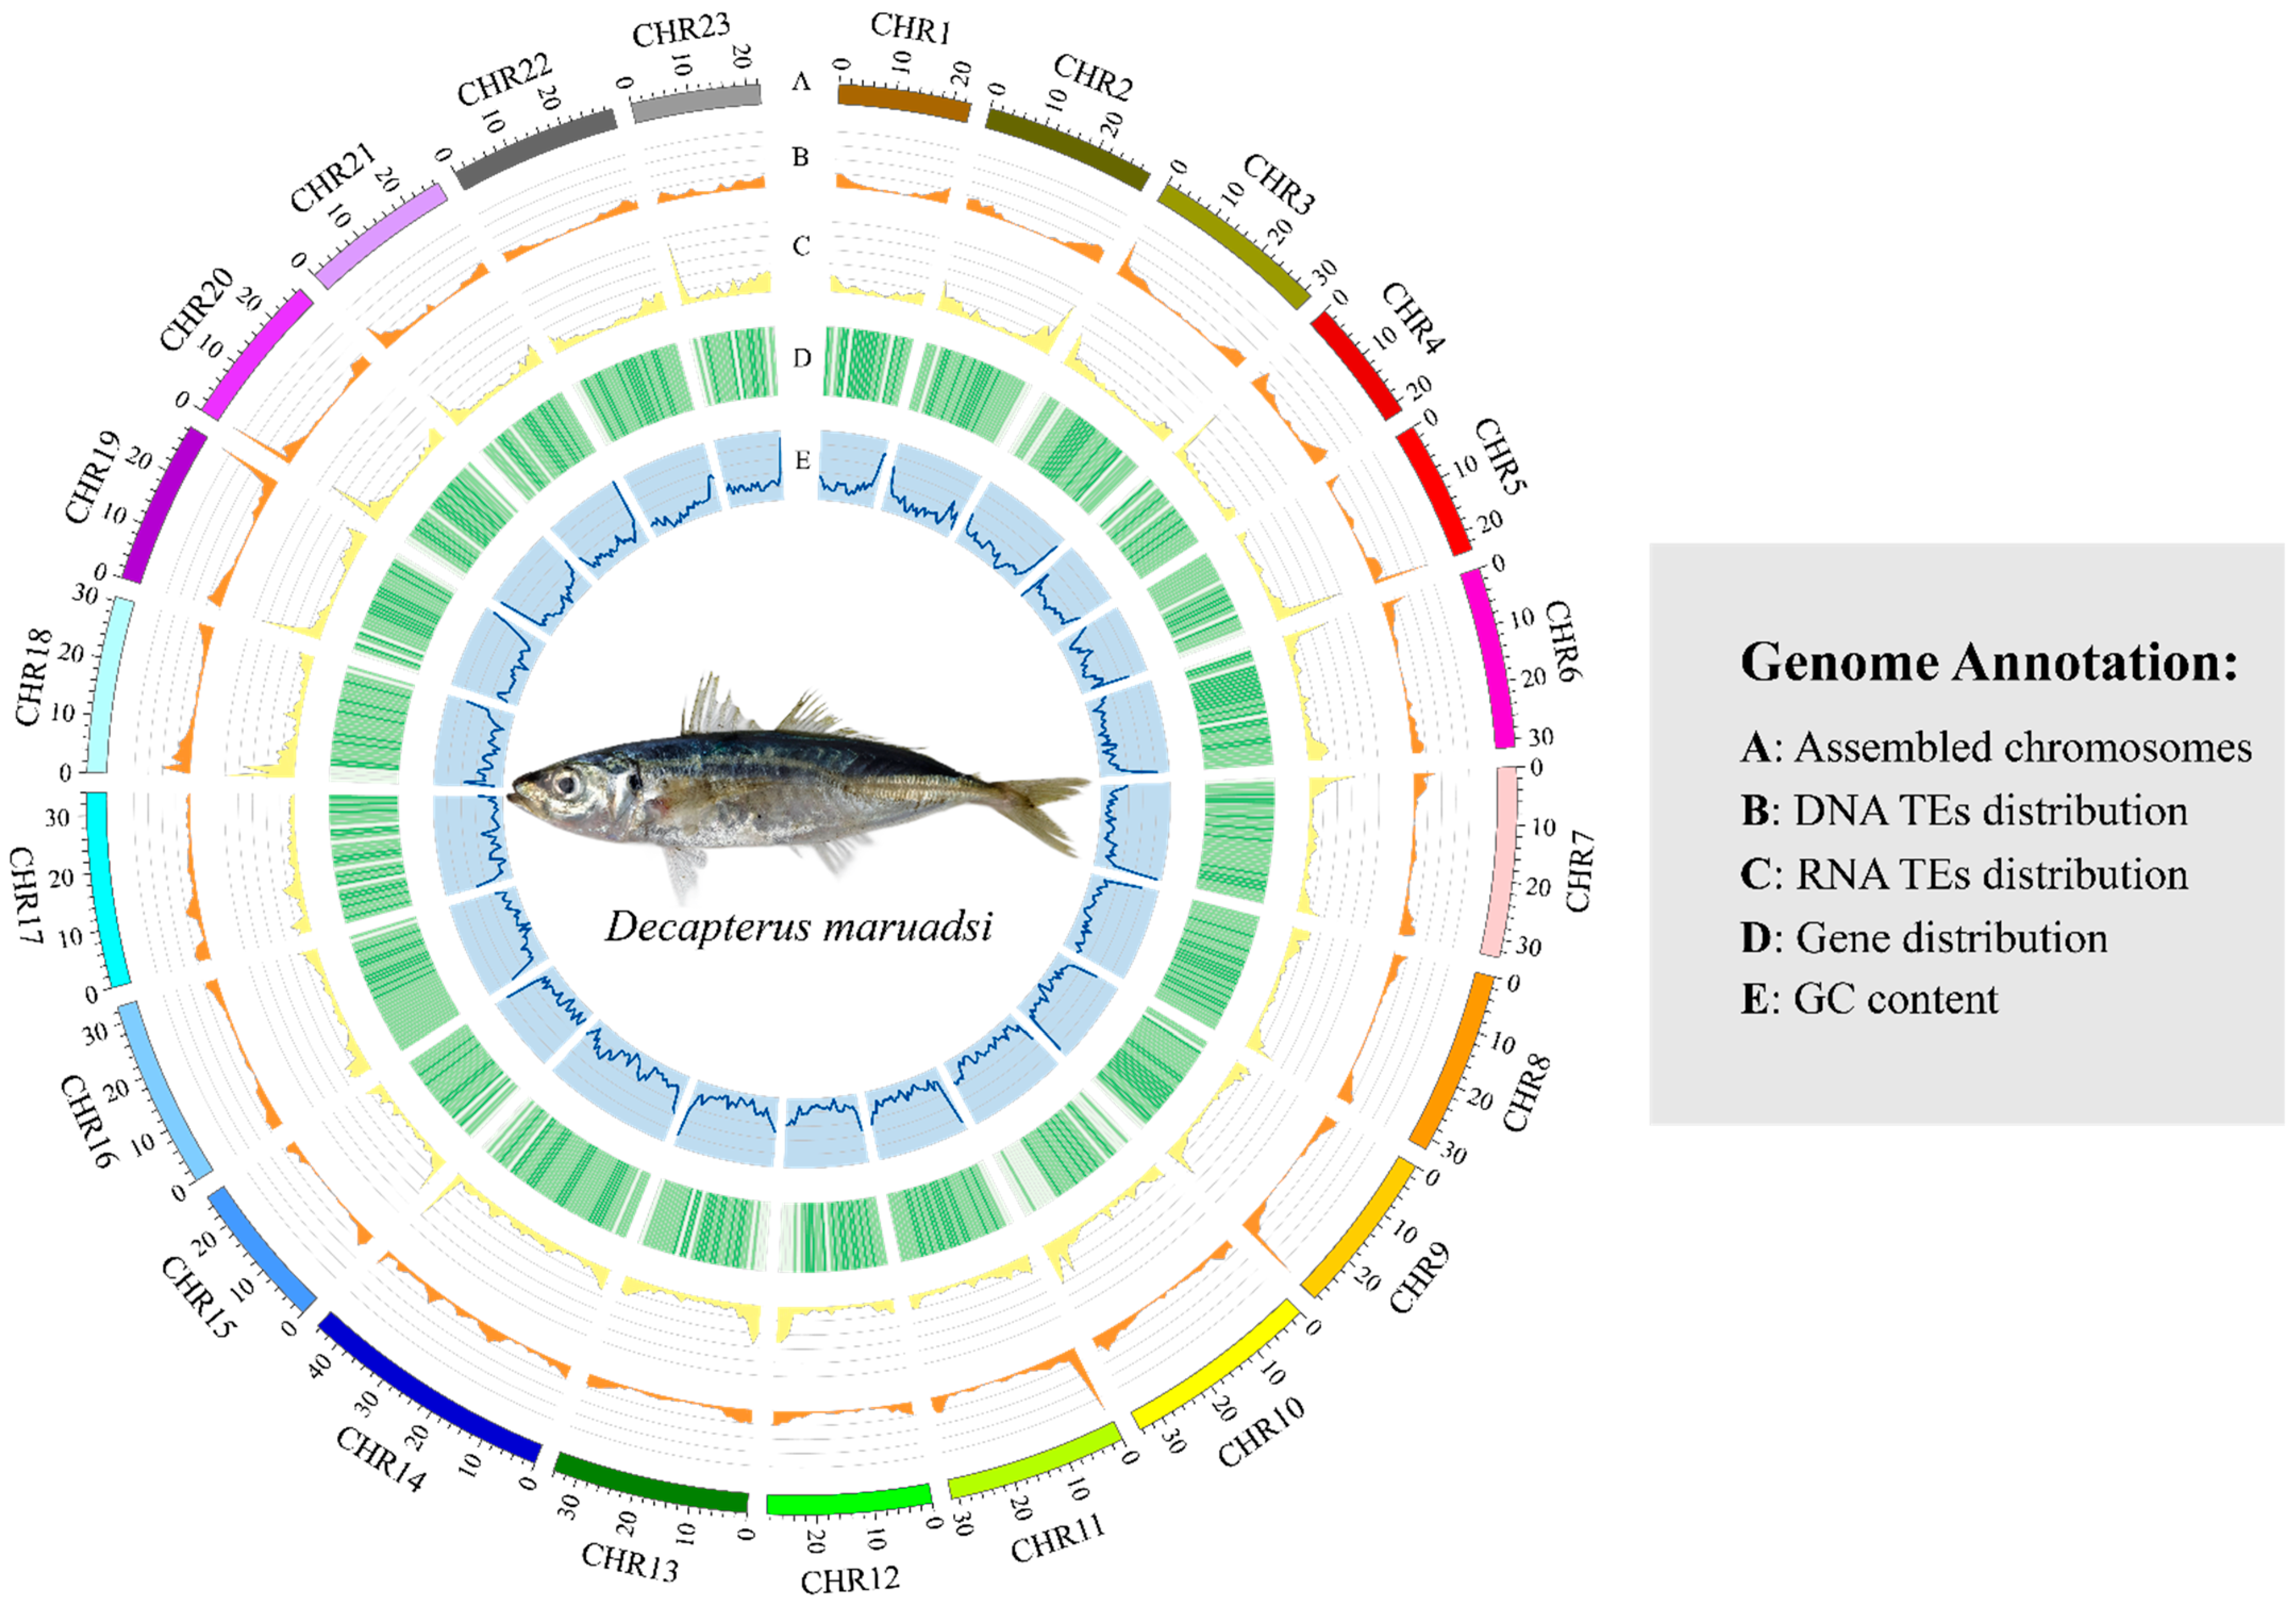
3.4. Genome Annotation
3.4.1. PacBio and Illumina RNA-Seq Data
3.4.2. Prediction of Repetitive Sequences
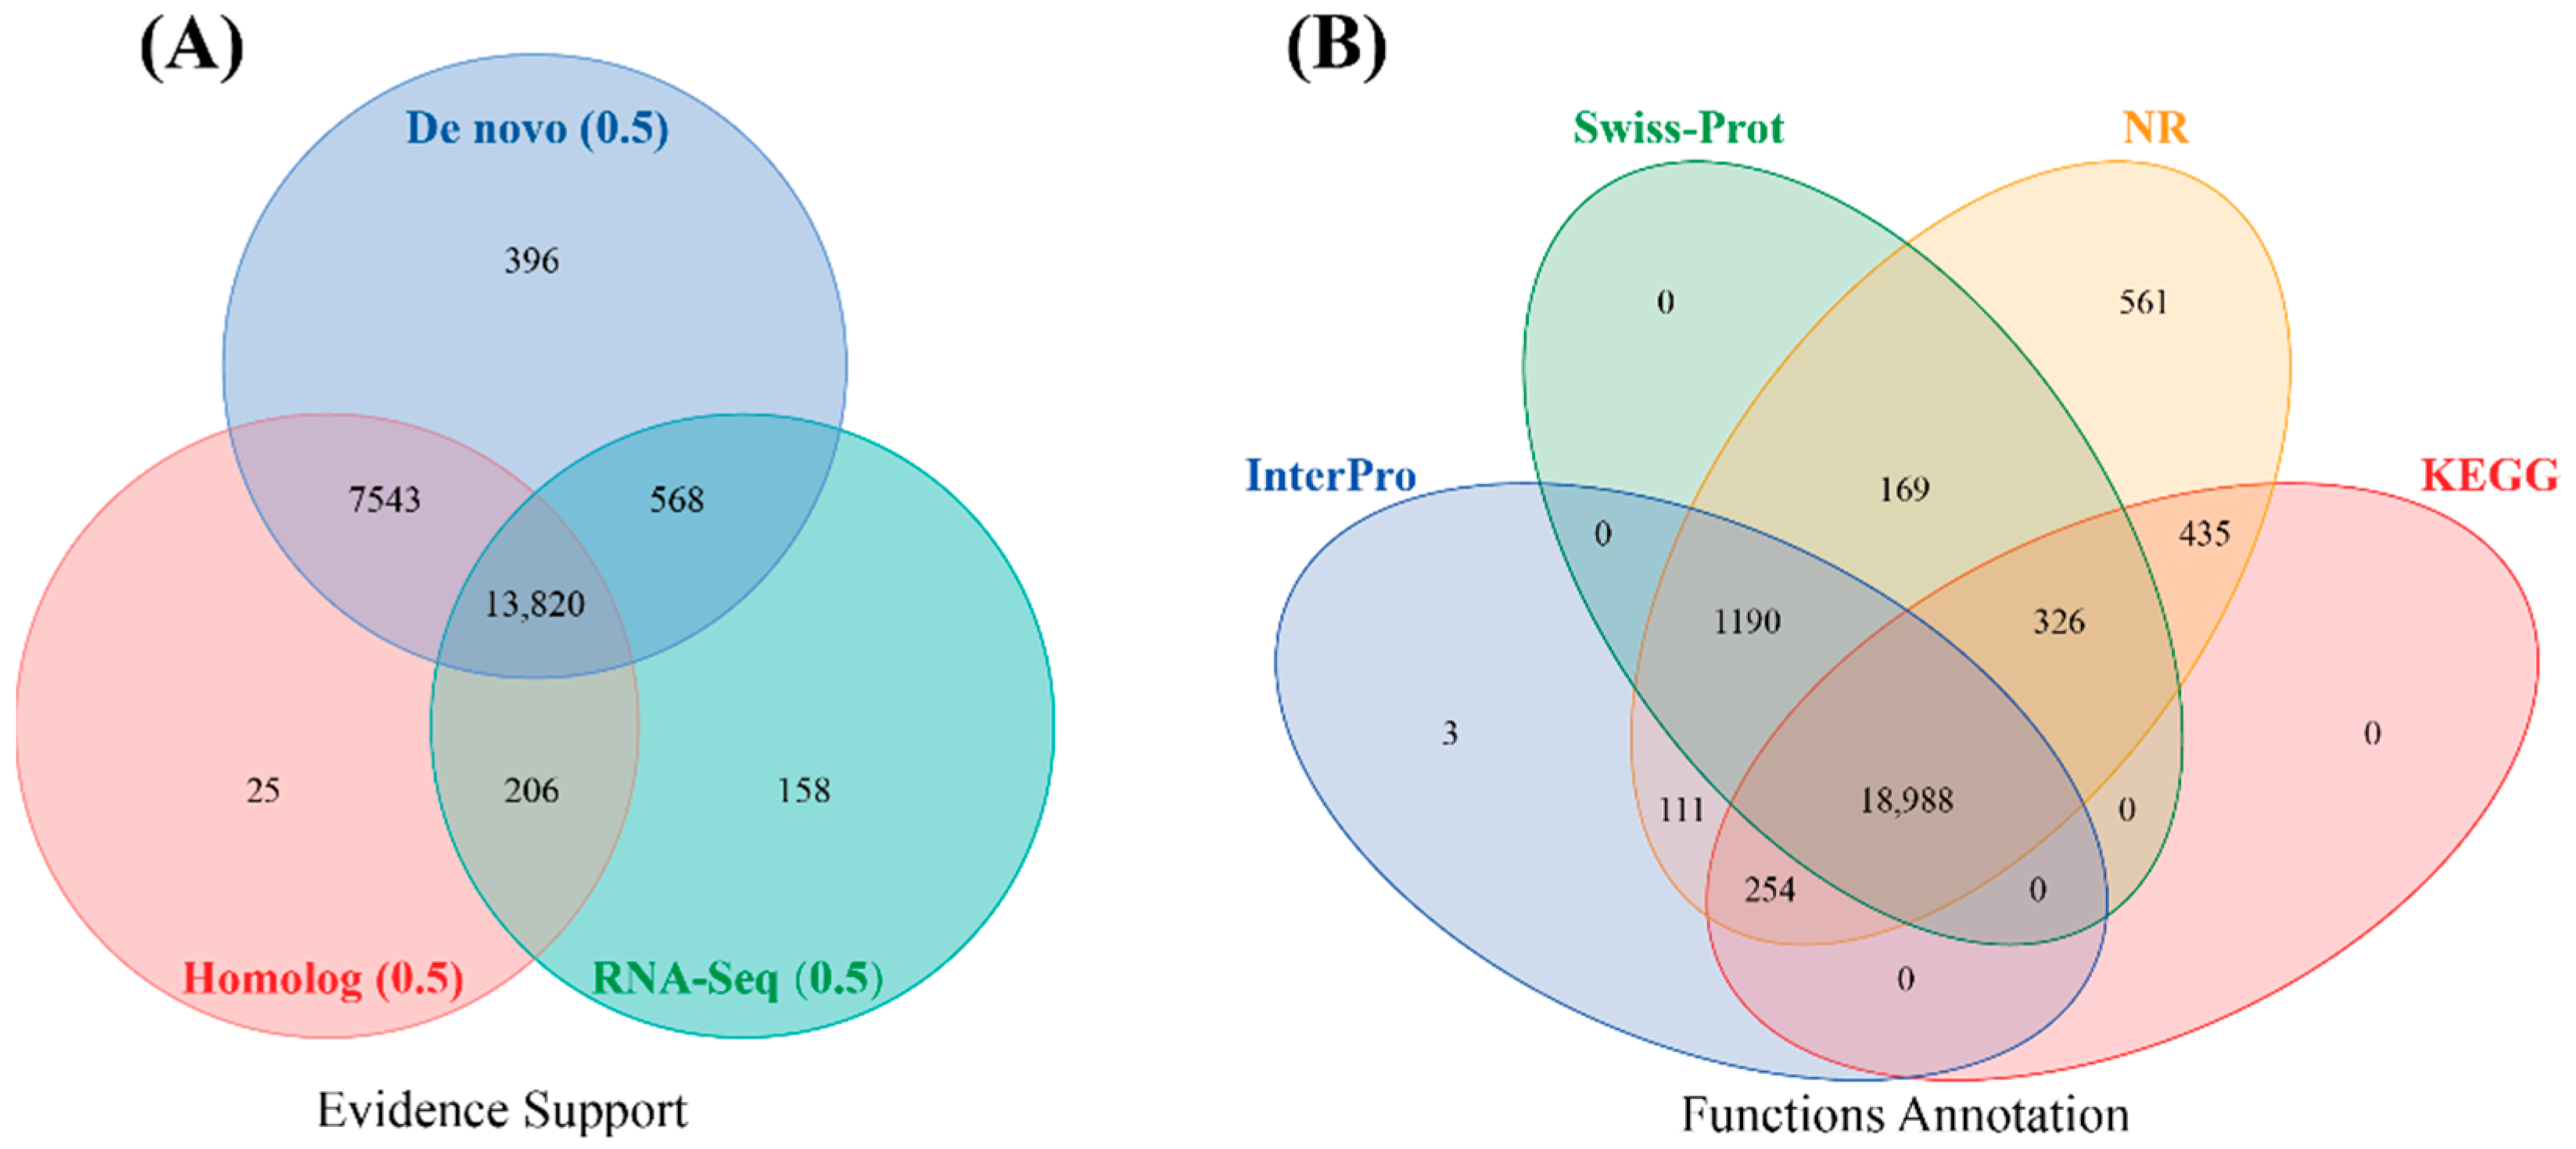
3.4.3. Structural and Functional Annotation of Protein-Coding Genes
3.4.4. ncRNA Annotation
3.5. Comparative Genome Analysis
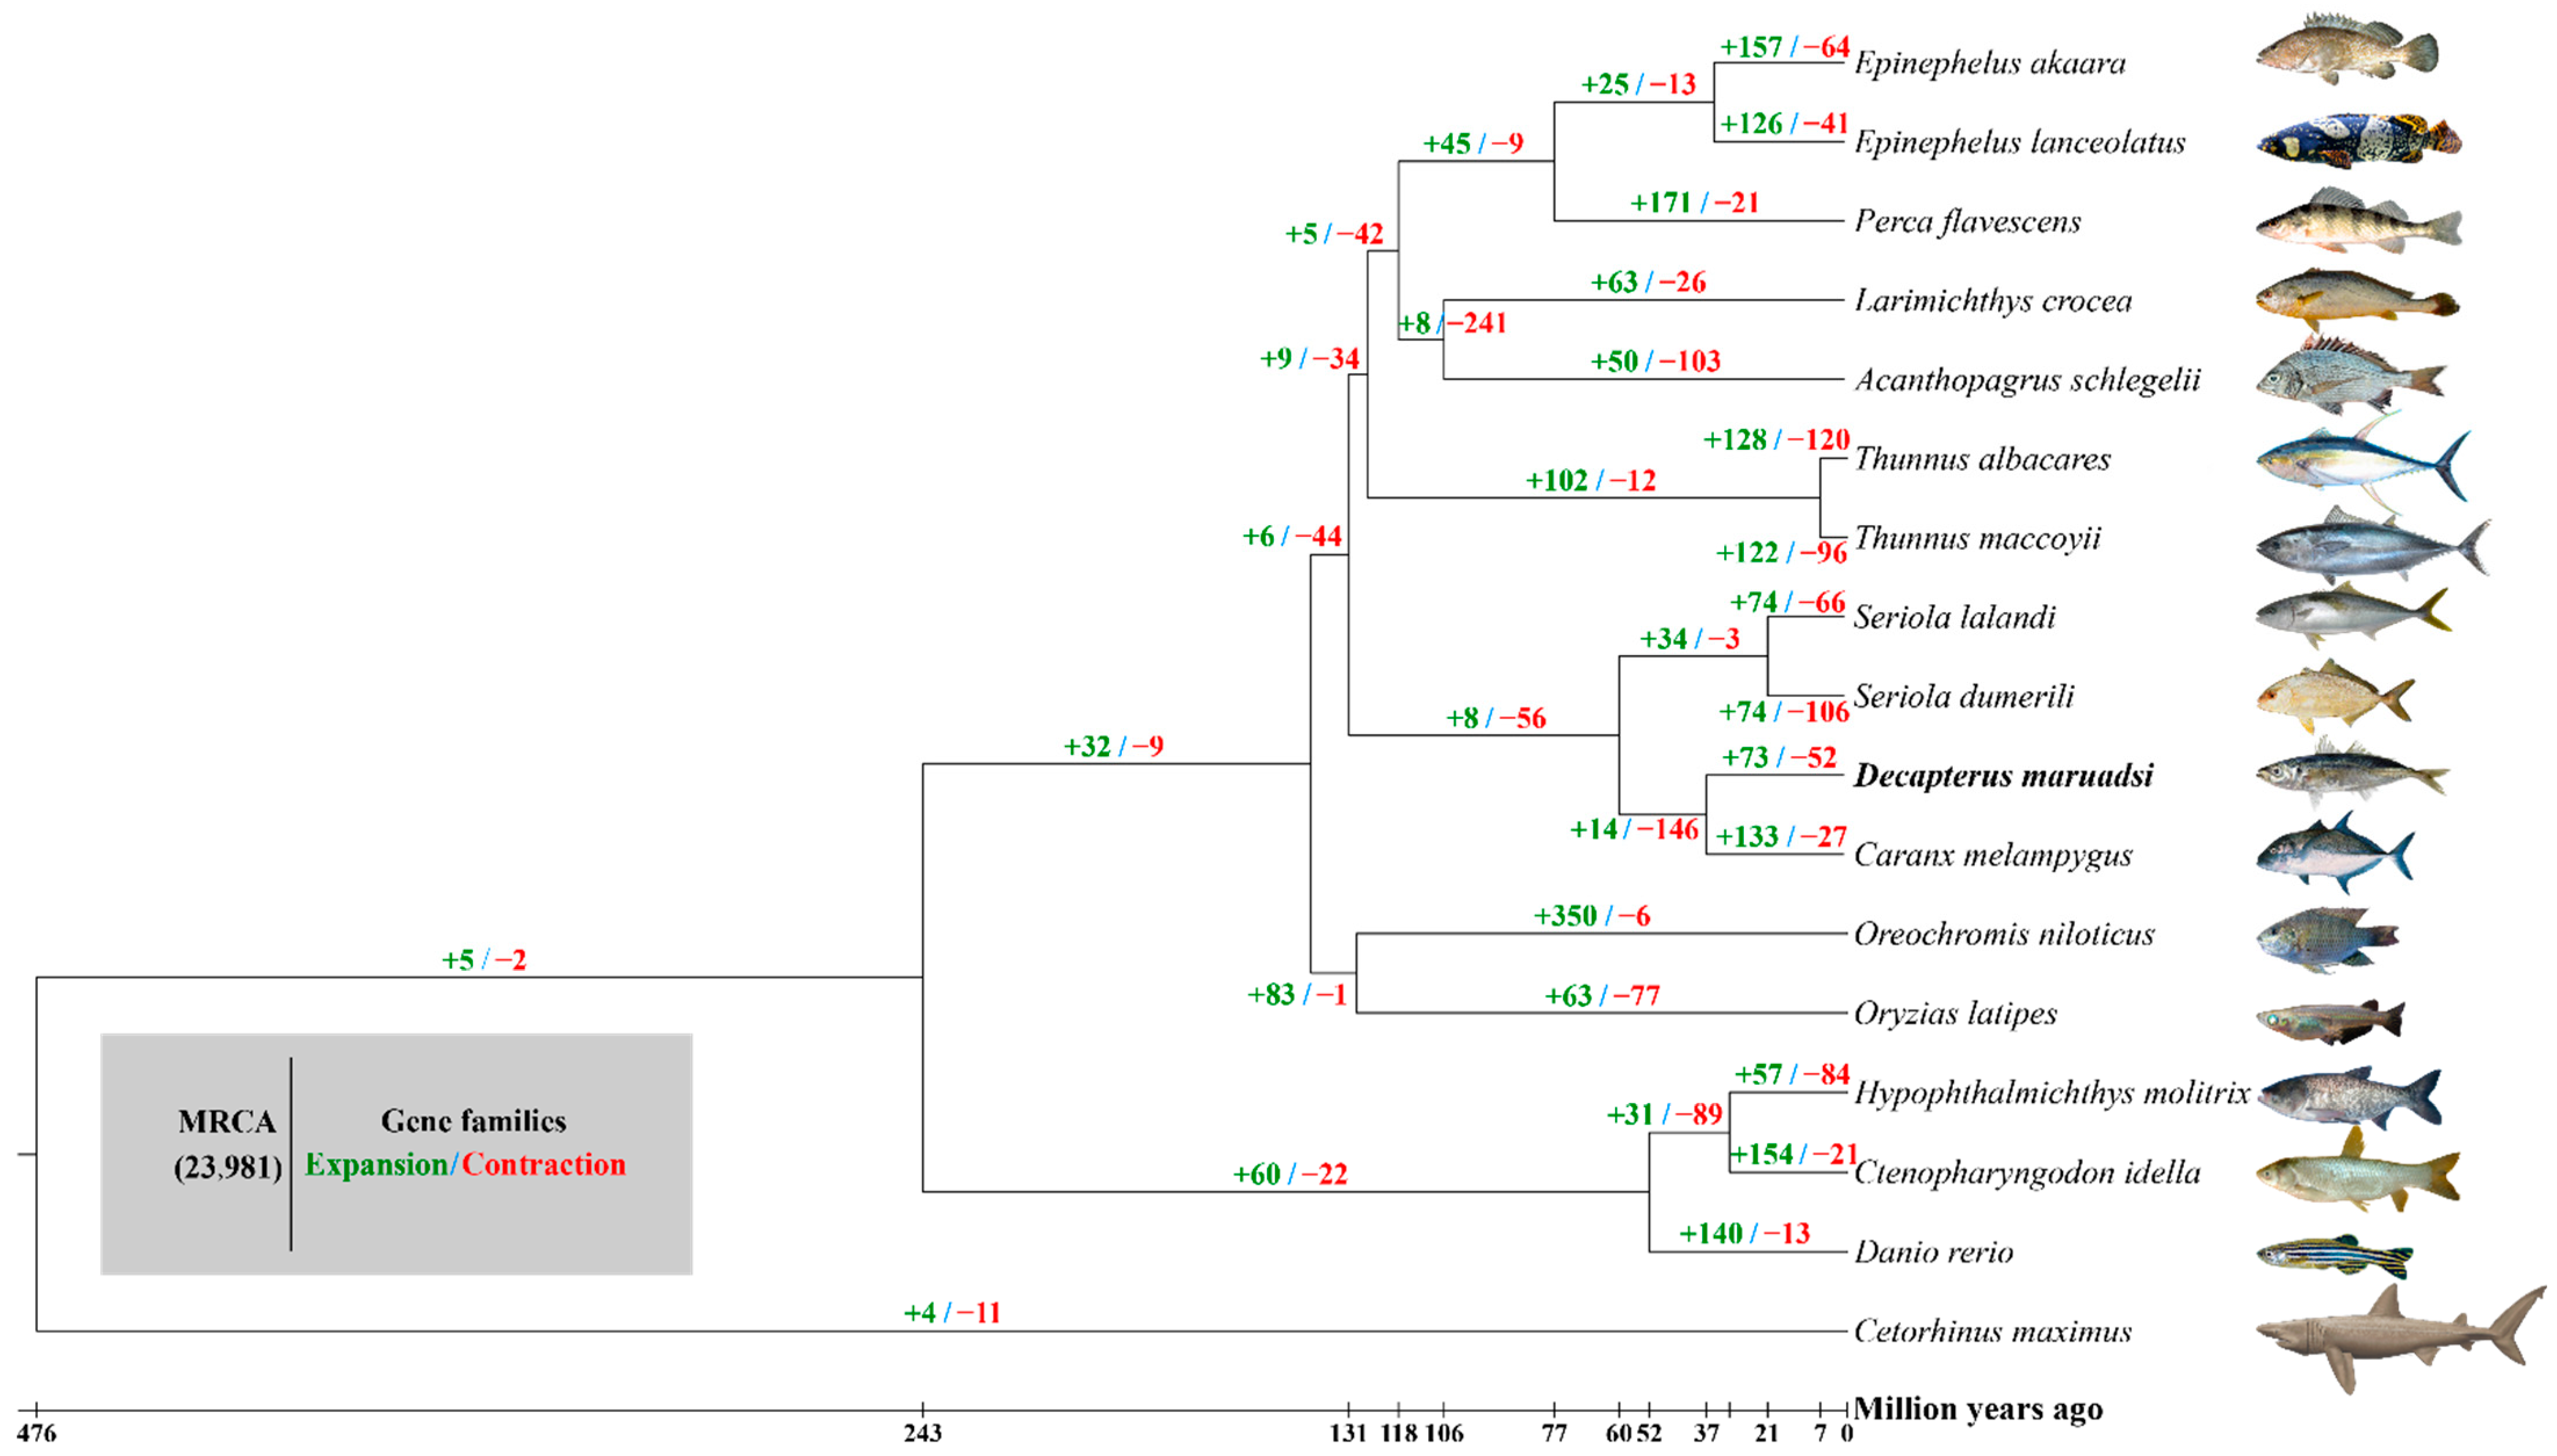
3.5.1. Gene Family Clustering, Expansions, and Contractions
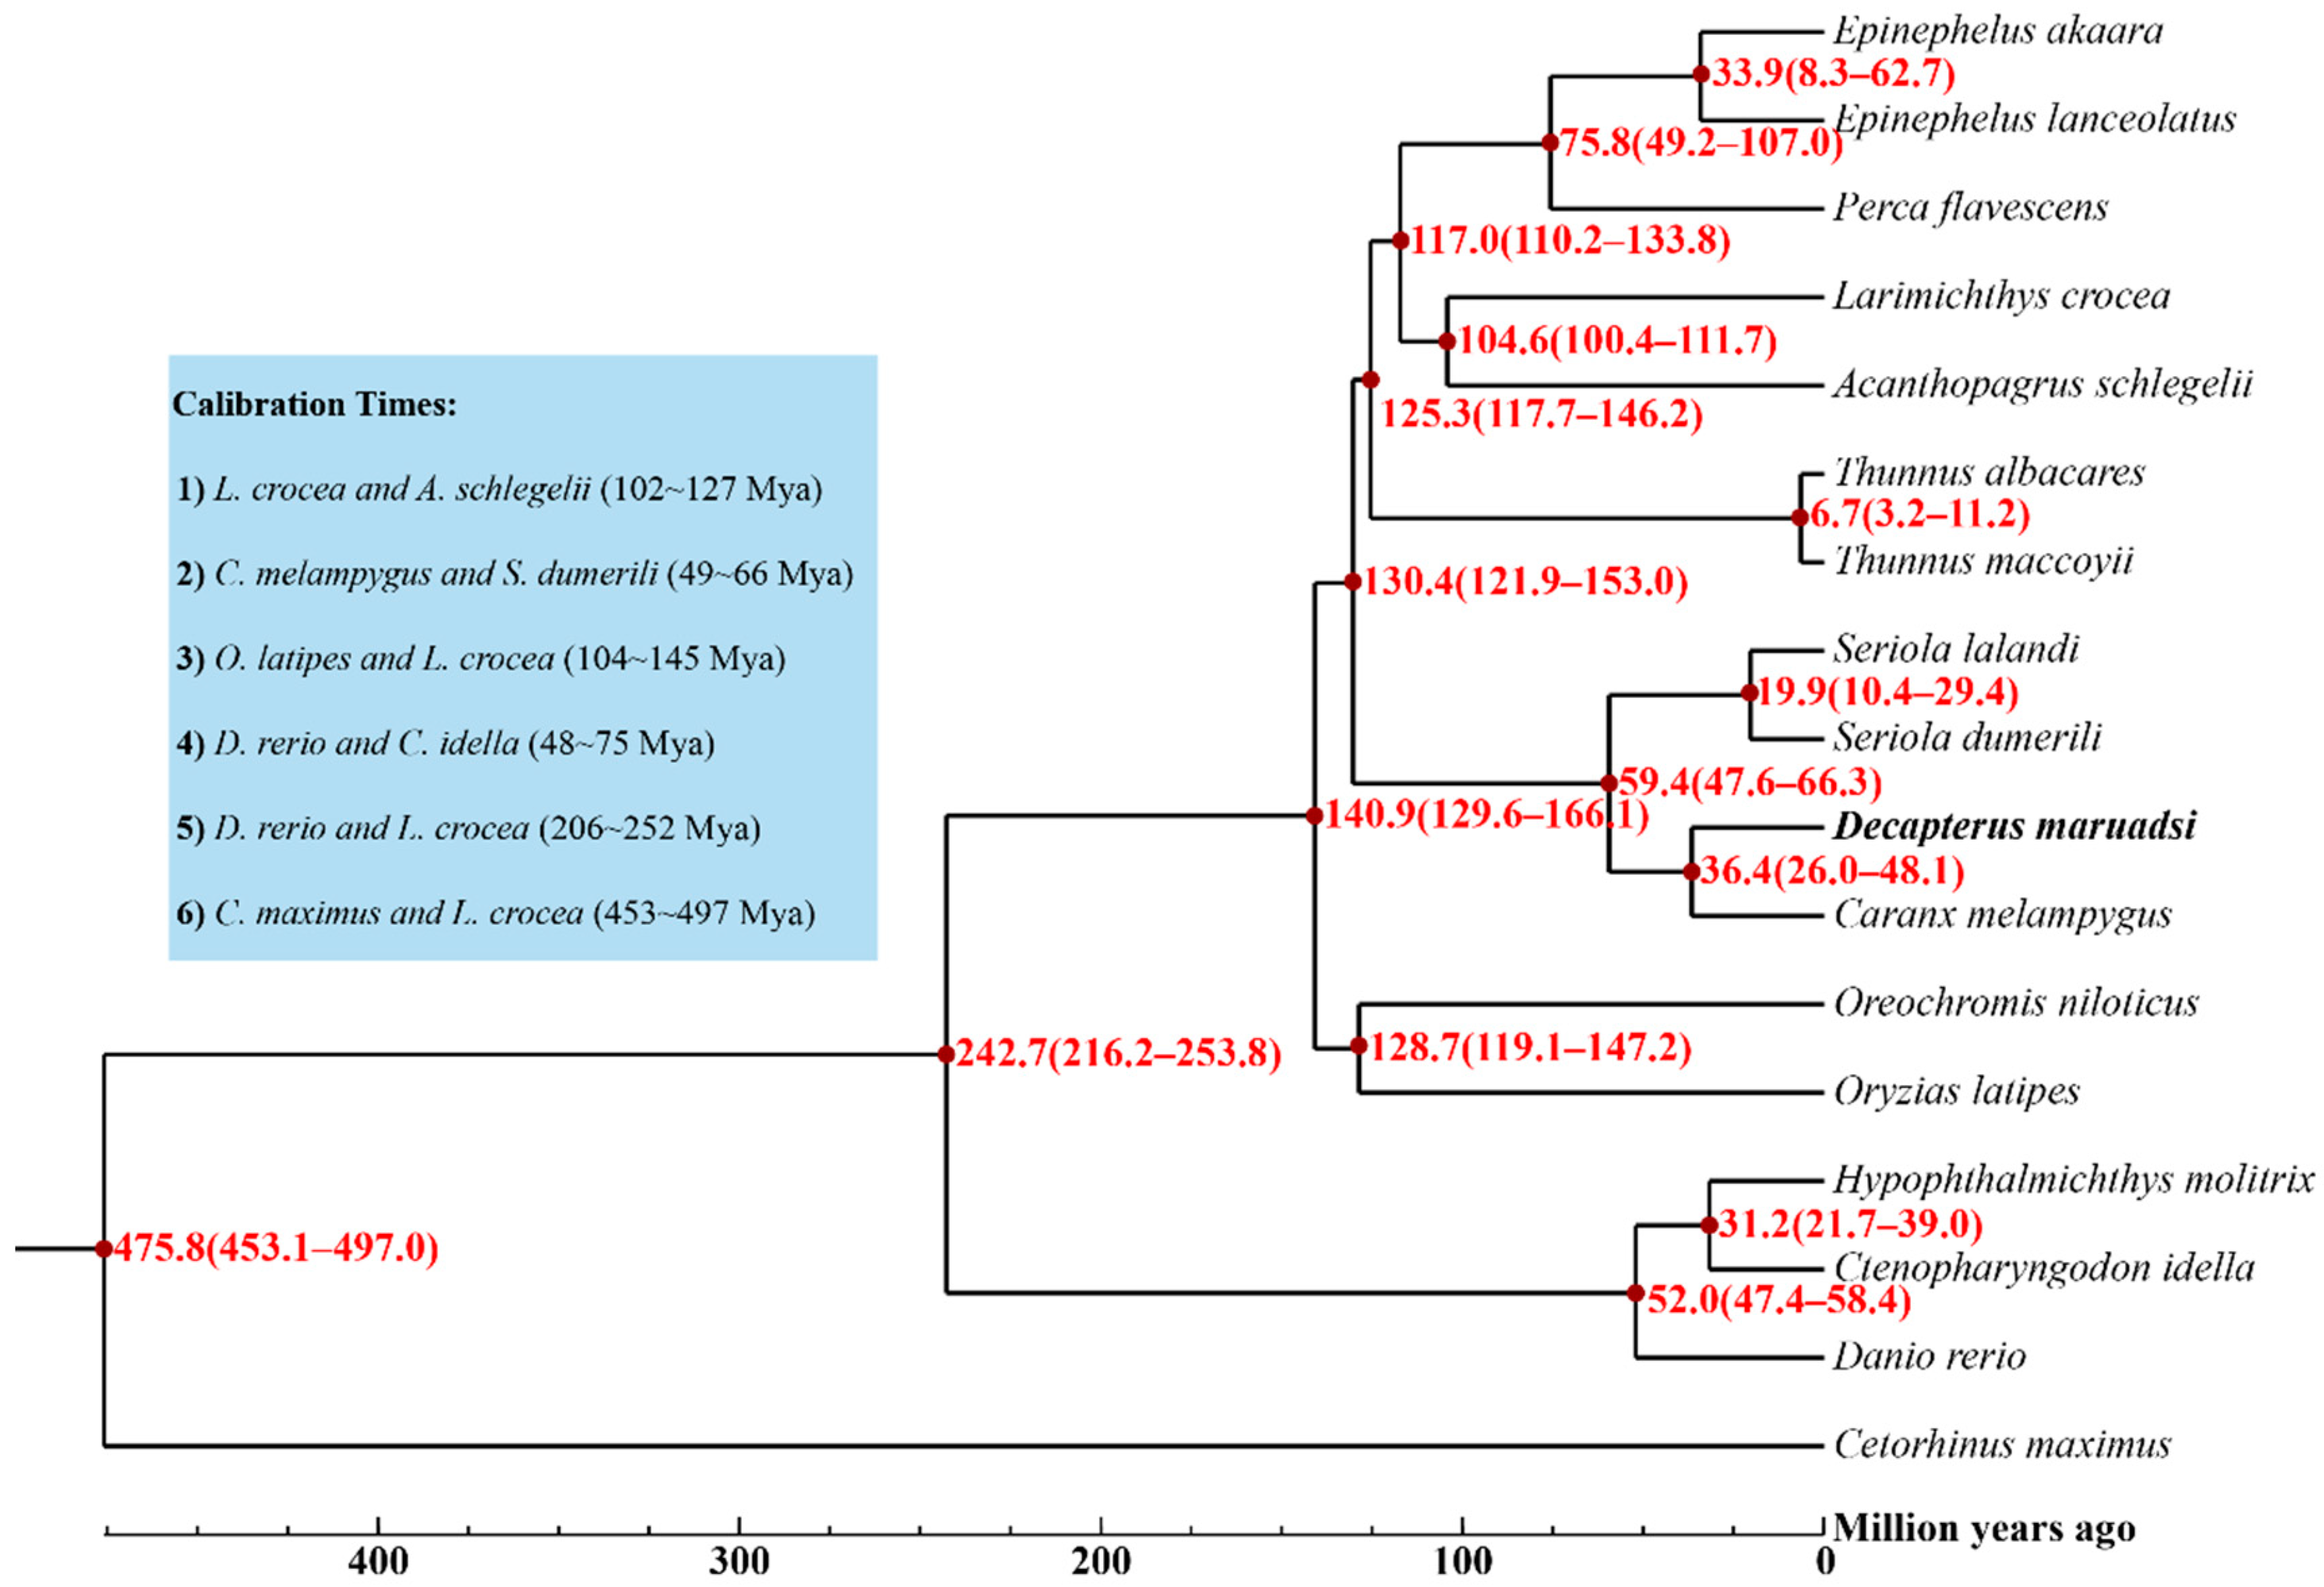
3.5.2. Phylogenetic Tree and Divergence Times
3.5.3. Positive Selection Analysis
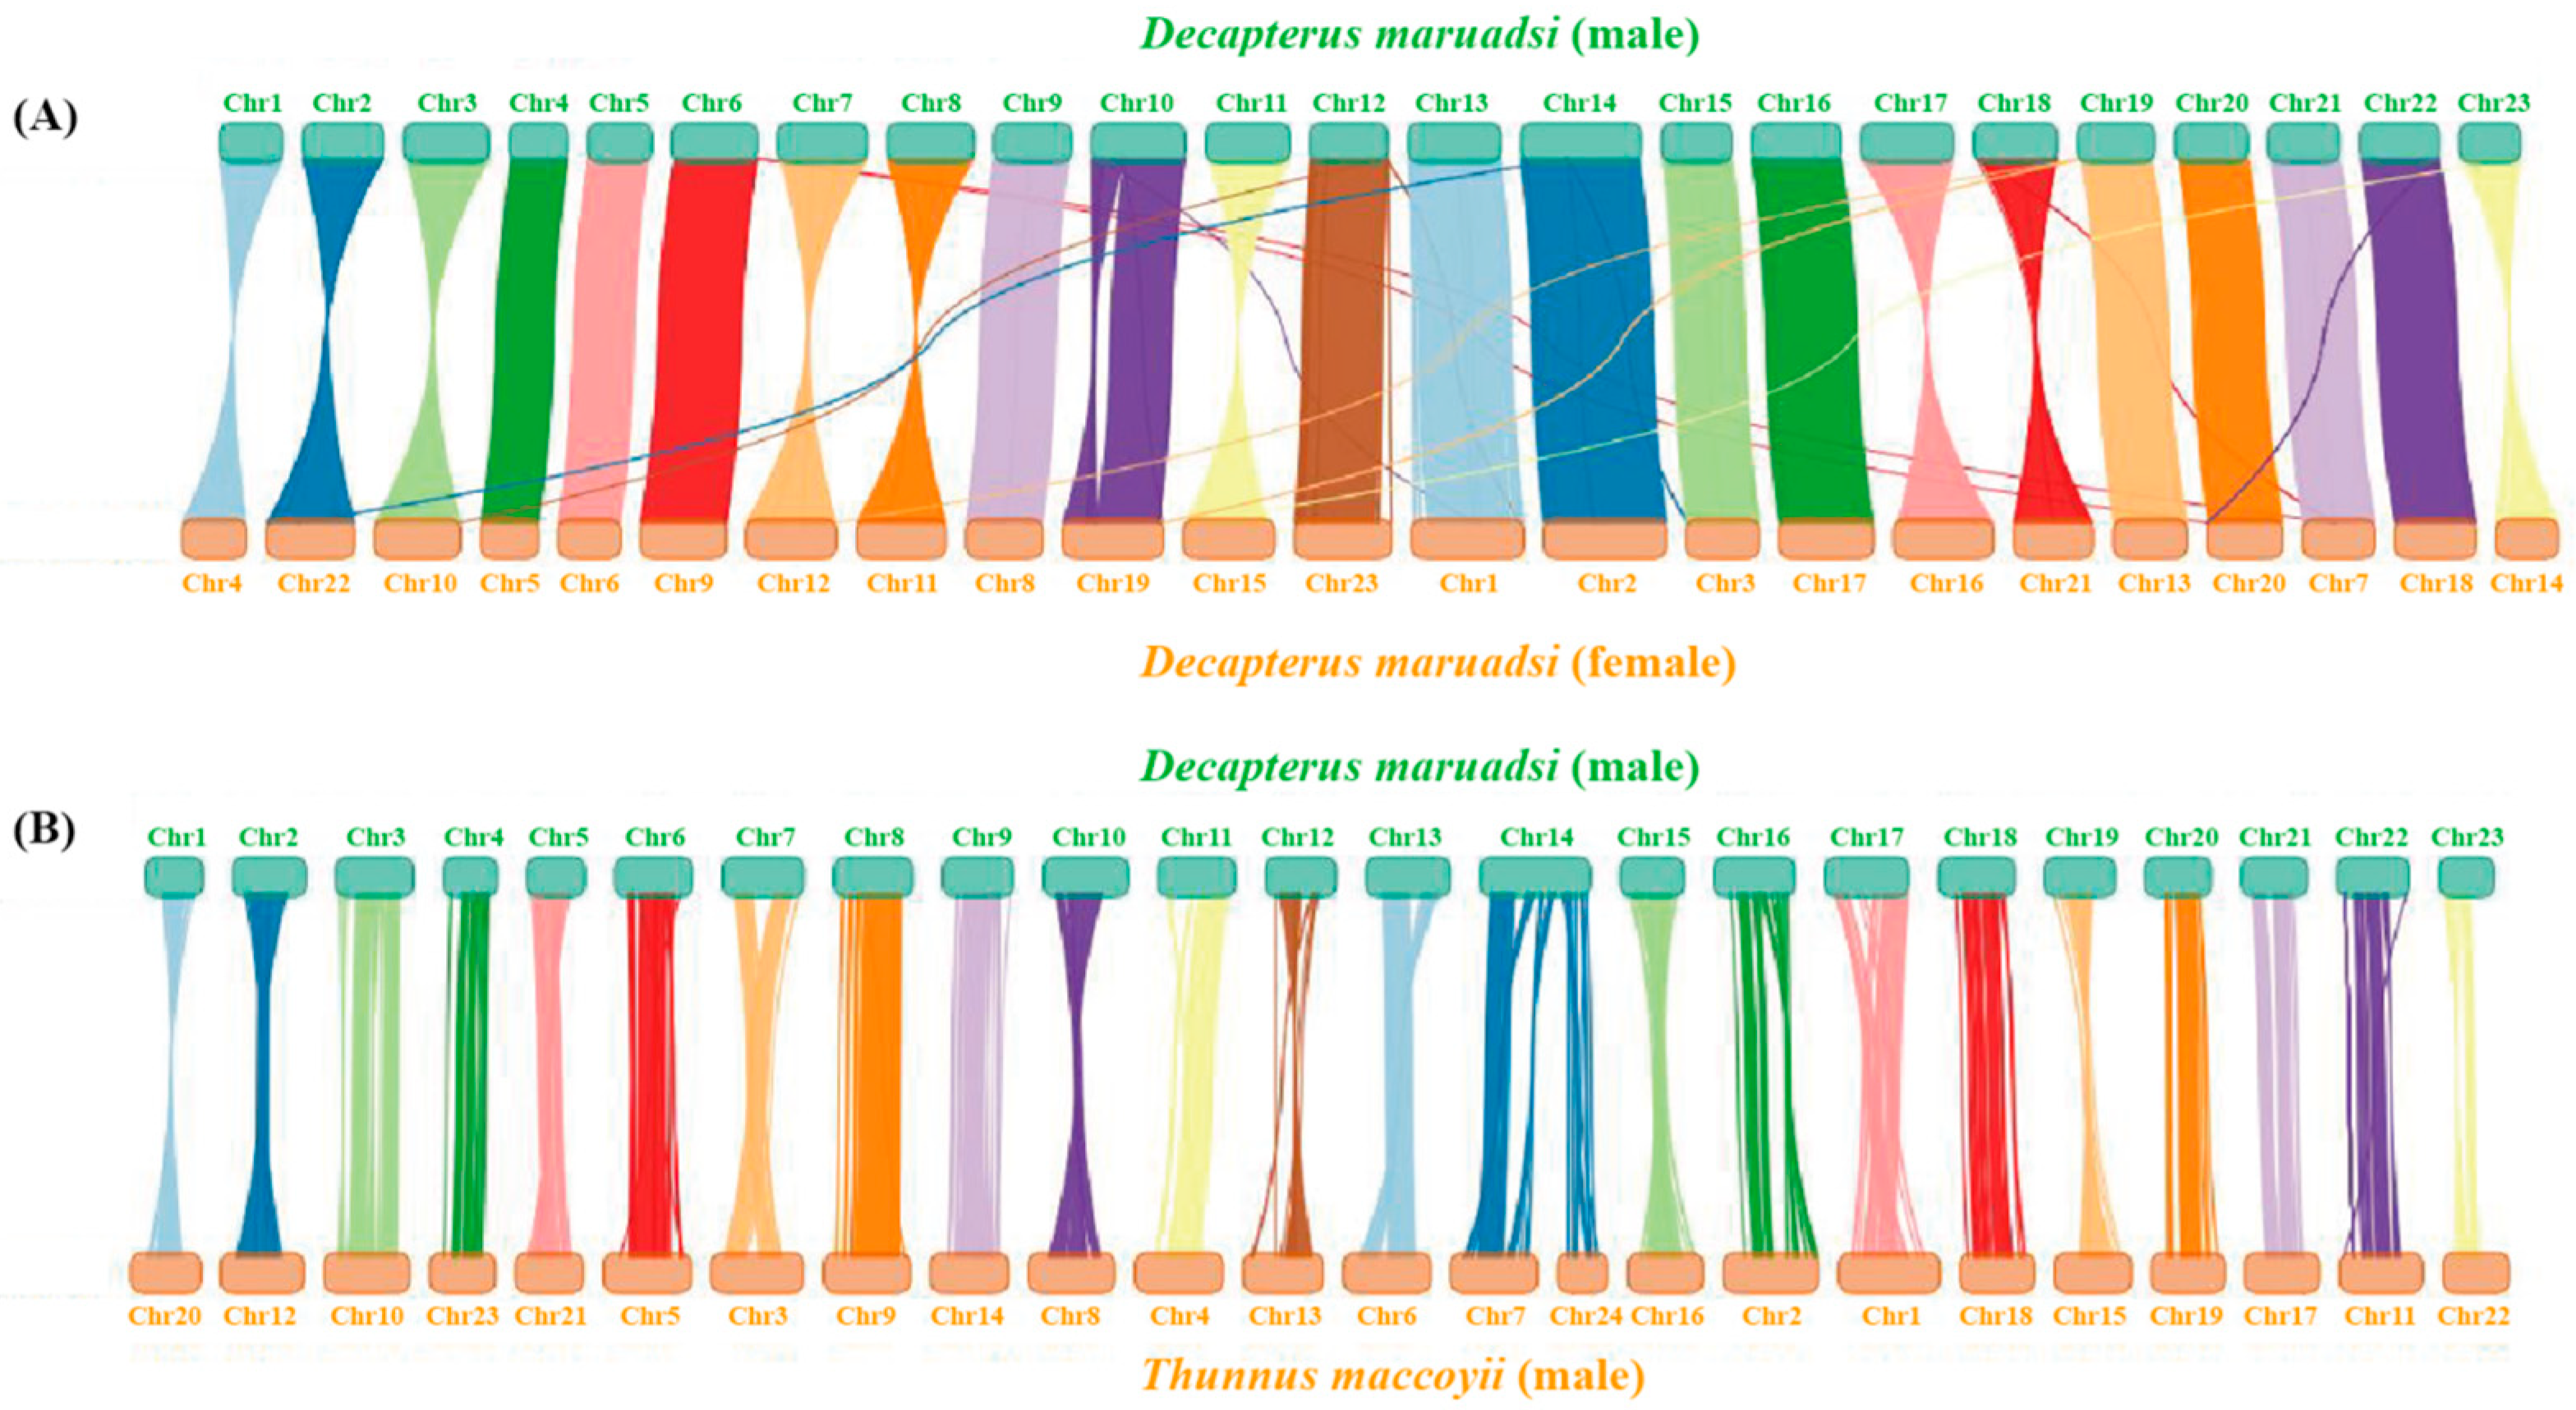
3.5.4. Collinearity Analysis
4. Discussion
4.1. Genome Features
4.2. Genes Associated with Growth, Development, and Reproduction
5. Conclusions
Supplementary Materials
Author Contributions
Funding
Institutional Review Board Statement
Informed Consent Statement
Data Availability Statement
Conflicts of Interest
References
- Jiang, R.J.; Xu, H.X.; Jin, H.W.; Zhou, Y.D.; He, Z.T. Feeding habits of blue mackerel scad Decapterus maruadsi Temminck et Schlegel in the East China Sea. J. Fish. China 2012, 36, 216–227. [Google Scholar]
- Zheng, Y.J.; Li, J.S.; Zhang, Q.Y.; Hong, W.S. Research progresses of resource biology of important marine pelagic food fishes in China. J. Fish. China 2014, 38, 149–160. [Google Scholar]
- Jamaludin, N.A.; Mohd-Arshaad, W.; Mohd Akib, N.A.; Zainal Abidin, D.H.; Nghia, N.V.; Nor, S.M. Phylogeography of the Japanese scad, Decapterus maruadsi (Teleostei; Carangidae) across the Central Indo-West Pacific: Evidence of strong regional structure and cryptic diversity. Mitochondrial DNA A 2020, 31, 298–310. [Google Scholar] [CrossRef] [PubMed]
- Thiansilakul, Y.; Benjakul, S.; Shahidi, F. Antioxidative activity of protein hydrolysate from round scad muscle using alcalase and flavourzyme. J. Food Biochem. 2007, 31, 266–287. [Google Scholar] [CrossRef]
- Bureau of Fisheries. Chinese Fishery Statistical Yearbook; China Agriculture Press: Beijing, China, 1997–2023.
- Geng, P.; Zhang, K.; Chen, Z.Z.; Xu, Y.W.; Sun, M.S. Interannual change in biological traits and exploitation rate of Decapterus maruadsi in Beibu Gulf. South China Fish. Sci. 2018, 14, 1–9. [Google Scholar] [CrossRef]
- Cui, M.Y.; Chen, W.F.; Dai, L.B.; Ma, Q.Y. Growth heterogeneity and natural mortality of Japanese scad in offshore waters of southern Zhejiang. J. Fish. Sci. China 2020, 27, 1427–1437. [Google Scholar] [CrossRef]
- Wang, K.L.; Chen, Z.Z.; Xu, Y.W.; Sun, M.S.; Wang, H.H.; Cai, Y.C.; Zhang, K.; Xu, S.N. Biological characteristics of Decapterus maruadsi in the northern South China Sea. Mar. Fish. 2021, 43, 12–21. [Google Scholar] [CrossRef]
- Wang, Q.H.; Wu, R.X.; Li, Z.L.; Niu, S.F.; Zhai, Y.; Huang, M.; Li, B. Effects of Late Pleistocene Climatic Fluctuations on the Phylogeographic and Demographic History of Japanese Scad (Decapterus maruadsi). Front. Mar. Sci. 2022, 9, 878506. [Google Scholar] [CrossRef]
- Deng, J.Y.; Zhao, C.Y. Marine Fishery Biology; China Agricultural Press: Beijing, China, 1991. [Google Scholar]
- Geng, P. A Study of Inter-Annual Changes in Growth, Mortality and Exploitation Rate of Representative Fish Stocks in Beibu Gulf; Shanghai Ocean University: Shanghai, China, 2019. [Google Scholar] [CrossRef]
- Chen, G.B.; Li, Y.Z.; Chen, P.M. A study on spawning ground of blue mackerel scad (Decapterus maruadsi) in continental shelf waters of northern South China Sea. J. Trop. Oceanogr. 2003, 22, 22–28. [Google Scholar]
- Chen, X.T.; Wu, J.N.; Lu, H.X.; Liu, Z.Y.; Chen, Y.H. Analysis and evaluation of nutritional components in the muscle of Decapterus maruadsi. Fish. Mod. 2016, 43, 56–61. [Google Scholar]
- Huang, M.K.; Lai, P.F. Analysis and evaluation of nutritional components in the muscle of cultured Decapterus maruadsi. J. Wuhan Polytech. Univ. 2022, 41, 44–52. [Google Scholar]
- Zhao, F.C. Genomic Sequencing and Phylogenetic Analysis of 8 Species of Cangidae Fish; Dalian Ocean University: Dalian, China, 2023. [Google Scholar] [CrossRef]
- Chen, L.; Zhou, Z.; Zhou, Z.; Yang, J.; Deng, Y.; Bai, Y.; Pu, F.; Zhou, T.; Xu, P. Chromosome-level assembly and gene annotation of Decapterus maruadsi genome using Nanopore and Hi-C technologies. Sci. Data 2024, 11, 69. [Google Scholar] [CrossRef] [PubMed]
- Li, M.; Chen, Z.Z.; Chen, T.; Xiong, D.; Fan, J.T.; Liang, P.W. Whole mitogenome of the Japanese scad Decapterus maruadsi (Perciformes: Carangidae). Mitochondrial DNA A 2016, 27, 306–307. [Google Scholar] [CrossRef] [PubMed]
- Niu, S.F.; Wu, R.X.; Zhang, L.Y.; Zhang, R.H.; Liang, R.; Li, Z.L. Genetic diversity analysis of Decapterus maruadsi from northern South China Sea based on mitochondrial DNA Cyt b sequence. J. Appl. Oceanogr. 2018, 37, 263–273. [Google Scholar]
- Niu, S.F.; Wu, R.X.; Zhai, Y.; Zhang, H.R.; Li, Z.L.; Liang, Z.B.; Chen, Y.H. Demographic history and population genetic analysis of Decapterus maruadsi from the northern South China Sea based on mitochondrial control region sequence. PeerJ 2019, 7, e7953. [Google Scholar] [CrossRef] [PubMed]
- Xu, S.; Zhang, Q.; Wang, Y.L.; Pei, L.M.; Luo, C.; Huang, Z.J. Genetic diversity of Decapterus maruadsi in coastal waters of China based on mtDNA COI sequences. Mar. Fish. 2020, 42, 129–137. [Google Scholar] [CrossRef]
- Hou, G.; Wang, J.; Chen, Z.; Zhou, J.; Huang, W.; Zhang, H. Molecular and Morphological Identification and Seasonal Distribution of Eggs of Four Decapterus Fish Species in the Northern South China Sea: A Key to Conservation of Spawning Ground. Front. Mar. Sci. 2020, 7, 590564. [Google Scholar] [CrossRef]
- Sambrook, J.; Russell, D.W. The Inoue Method for Preparation and Transformation of Competent E. coli: “Ultra-Competent” Cells. CSH Protoc. 2006, 2006, 1–5. [Google Scholar] [CrossRef]
- Marçais, G.; Kingsford, C. A fast, lock-free approach for efficient parallel counting of occurrences of k-mers. Bioinformatics 2011, 27, 764–770. [Google Scholar] [CrossRef]
- Gordon, S.P.; Tseng, E.; Salamov, A.; Zhang, J.; Meng, X.; Zhao, Z.; Kang, D.; Underwood, J.; Grigoriev, I.V.; Figueroa, M.; et al. Widespread Polycistronic Transcripts in Fungi Revealed by Single-Molecule mRNA Sequencing. PLoS ONE 2015, 10, e0132628. [Google Scholar] [CrossRef]
- Cheng, H.; Concepcion, G.T.; Feng, X.; Zhang, H.; Li, H. Haplotype-resolved de novo assembly using phased assembly graphs with hifiasm. Nat. Methods 2021, 18, 170–175. [Google Scholar] [CrossRef] [PubMed]
- Simão, F.A.; Waterhouse, R.M.; Ioannidis, P.; Kriventseva, E.V.; Zdobnov, E.M. BUSCO: Assessing genome assembly and annotation completeness with single-copy orthologs. Bioinformatics 2015, 31, 3210–3212. [Google Scholar] [CrossRef] [PubMed]
- Parra, G.; Bradnam, K.; Korf, I. CEGMA: A pipeline to accurately annotate core genes in eukaryotic genomes. Bioinformatics 2007, 23, 1061–1067. [Google Scholar] [CrossRef] [PubMed]
- Li, H.; Durbin, R. Fast and accurate short read alignment with Burrows-Wheeler transform. Bioinformatics 2009, 25, 1754–1760. [Google Scholar] [CrossRef] [PubMed]
- Li, H.; Handsaker, B.; Wysoker, A.; Fennell, T.; Ruan, J.; Homer, N.; Marth, G.; Abecasis, G.; Durbin, R. The Sequence Alignment/Map format and SAMtools. Bioinformatics 2009, 25, 2078–2079. [Google Scholar] [CrossRef] [PubMed]
- van Berkum, N.L.; Lieberman-Aiden, E.; Williams, L.; Imakaev, M.; Gnirke, A.; Mirny, L.A.; Dekker, J.; Lander, E.S. Hi-C: A method to study the three-dimensional architecture of genomes. J. Vis. Exp. 2010, 39, e1869. [Google Scholar] [CrossRef]
- Rao, S.S.; Huntley, M.H.; Durand, N.C.; Stamenova, E.K.; Bochkov, I.D.; Robinson, J.T.; Sanborn, A.L.; Machol, I.; Omer, A.D.; Lander, E.S.; et al. A 3D map of the human genome at kilobase resolution reveals principles of chromatin looping. Cell 2014, 159, 1665–1680. [Google Scholar] [CrossRef]
- Wingett, S.; Ewels, P.; Furlan-Magaril, M.; Nagano, T.; Schoenfelder, S.; Fraser, P.; Andrews, S. HiCUP: Pipeline for mapping and processing Hi-C data. F1000Research 2015, 4, 1310. [Google Scholar] [CrossRef]
- Zhang, X.; Zhang, S.; Zhao, Q.; Ming, R.; Tang, H. Assembly of allele-aware, chromosomal-scale autopolyploid genomes based on Hi-C data. Nat. Plants 2019, 5, 833–845. [Google Scholar] [CrossRef]
- Chen, S.; Zhou, Y.; Chen, Y.; Gu, J. fastp: An ultra-fast all-in-one FASTQ preprocessor. Bioinformatics 2018, 34, i884–i890. [Google Scholar] [CrossRef]
- Chen, N. Using RepeatMasker to identify repetitive elements in genomic sequences. Curr. Protoc. Bioinform. 2004, 5, 4–10. [Google Scholar] [CrossRef] [PubMed]
- Bergman, C.M.; Quesneville, H. Discovering and detecting transposable elements in genome sequences. Brief. Bioinform. 2007, 8, 382–392. [Google Scholar] [CrossRef] [PubMed]
- Xu, Z.; Wang, H. LTR_FINDER: An efficient tool for the prediction of full-length LTR retrotransposons. Nucleic Acids Res. 2007, 35, 65–68. [Google Scholar] [CrossRef] [PubMed]
- Price, A.L.; Jones, N.C.; Pevzner, P.A. De novo identification of repeat families in large genomes. Bioinformatics 2005, 21 (Suppl. S1), i351–i358. [Google Scholar] [CrossRef] [PubMed]
- Benson, G. Tandem repeats finder: A program to analyze DNA sequences. Nucleic Acids Res. 1999, 27, 573–580. [Google Scholar] [CrossRef] [PubMed]
- Stanke, M.; Morgenstern, B. AUGUSTUS: A web server for gene prediction in eukaryotes that allows user-defined constraints. Nucleic Acids Res. 2005, 33, W465–W467. [Google Scholar] [CrossRef] [PubMed]
- Salamov, A.A.; Solovyev, V.V. Ab initio gene finding in Drosophila genomic DNA. Genome Res. 2000, 1, 516–522. [Google Scholar] [CrossRef] [PubMed]
- Parra, G.; Blanco, E.; Guigó, R. GeneID in Drosophila. Genome Res. 2000, 10, 511–515. [Google Scholar] [CrossRef] [PubMed]
- Majoros, W.H.; Pertea, M.; Salzberg, S.L. TigrScan and GlimmerHMM: Two open source ab initio eukaryotic gene-finders. Bioinformatics 2004, 20, 2878–2879. [Google Scholar] [CrossRef]
- Korf, I. Gene finding in novel genomes. BMC Bioinform. 2004, 5, 59. [Google Scholar] [CrossRef]
- Altschul, S.F.; Madden, T.L.; Schäffer, A.A.; Zhang, J.; Zhang, Z.; Miller, W.; Lipman, D.J. Gapped BLAST and PSI-BLAST: A new generation of protein database search programs. Nucleic Acids Res. 1997, 25, 3389–3402. [Google Scholar] [CrossRef] [PubMed]
- Birney, E.; Clamp, M.; Durbin, R. GeneWise and genomewise. Genome Res. 2004, 14, 988–995. [Google Scholar] [CrossRef] [PubMed]
- Kim, D.; Pertea, G.; Trapnell, C.; Pimentel, H.; Kelley, R.; Salzberg, S.L. TopHat2: Accurate alignment of transcriptomes in the presence of insertions, deletions and gene fusions. Genome Biol. 2013, 14, R36. [Google Scholar] [CrossRef] [PubMed]
- Trapnell, C.; Williams, B.A.; Pertea, G.; Mortazavi, A.; Kwan, G.; van Baren, M.J.; Salzberg, S.L.; Wold, B.J.; Pachter, L. Transcript assembly and quantification by RNA-Seq reveals unannotated transcripts and isoform switching during cell differentiation. Nat. Biotechnol. 2010, 28, 511–515. [Google Scholar] [CrossRef] [PubMed]
- Haas, B.J.; Salzberg, S.L.; Zhu, W.; Pertea, M.; Allen, J.E.; Orvis, J.; White, O.; Buell, C.R.; Wortman, J.R. Automated eukaryotic gene structure annotation using EVidenceModeler and the Program to Assemble Spliced Alignments. Genome Biol. 2008, 9, R7. [Google Scholar] [CrossRef] [PubMed]
- Johnson, M.; Zaretskaya, I.; Raytselis, Y.; Merezhuk, Y.; McGinnis, S.; Madden, T.L. NCBI BLAST: A better web interface. Nucleic Acids Res. 2008, 36, W5–W9. [Google Scholar] [CrossRef] [PubMed]
- Finn, R.D.; Clements, J.; Eddy, S.R. HMMER web server: Interactive sequence similarity searching. Nucleic Acids Res. 2011, 39, W29–W37. [Google Scholar] [CrossRef]
- Chan, P.P.; Lowe, T.M. tRNAscan-SE: Searching for tRNA Genes in Genomic Sequences. Methods Mol. Biol. 2019, 1962, 1–14. [Google Scholar] [CrossRef]
- Nawrocki, E.P.; Kolbe, D.L.; Eddy, S.R. Infernal 1.0: Inference of RNA alignments. Bioinformatics 2009, 25, 1335–1337. [Google Scholar] [CrossRef]
- Kalvari, I.; Nawrocki, E.P.; Argasinska, J.; Quinones-Olvera, N.; Finn, R.D.; Bateman, A.; Petrov, A.I. Non-Coding RNA Analysis Using the Rfam Database. Curr. Protoc. Bioinform. 2018, 62, e51. [Google Scholar] [CrossRef]
- Li, L.; Stoeckert, C.J.; Roos, D.S. OrthoMCL: Identification of ortholog groups for eukaryotic genomes. Genome Res. 2003, 13, 2178–2189. [Google Scholar] [CrossRef]
- De Bie, T.; Cristianini, N.; Demuth, J.P.; Hahn, M.W. CAFE: A computational tool for the study of gene family evolution. Bioinformatics 2006, 22, 1269–1271. [Google Scholar] [CrossRef] [PubMed]
- Edgar, R.C. MUSCLE: Multiple sequence alignment with high accuracy and high throughput. Nucleic Acids Res. 2004, 32, 1792–1797. [Google Scholar] [CrossRef] [PubMed]
- Stamatakis, A. RAxML version 8: A tool for phylogenetic analysis and post-analysis of large phylogenies. Bioinformatics 2014, 30, 1312–1313. [Google Scholar] [CrossRef]
- Kumar, S.; Stecher, G.; Suleski, M.; Hedges, S.B. TimeTree: A Resource for Timelines, Timetrees, and Divergence Times. Mol. Biol. Evol. 2017, 34, 1812–1819. [Google Scholar] [CrossRef]
- He, W.M.; Yang, J.; Jing, Y.; Xu, L.; Yu, K.; Fang, X.D. NGenomeSyn: An easy-to-use and flexible tool for publication-ready visualization of syntenic relationships across multiple genomes. Bioinformatics 2023, 39, btad121. [Google Scholar] [CrossRef]
- Faucon, P.C.; Balachandran, P.; Crook, S. SNaReSim: Synthetic Nanopore Read Simulator. In Proceedings of the International Conference on Healthcare Informatics (ICHI), Park City, UT, USA, 23–27 August 2017; pp. 338–344. [Google Scholar] [CrossRef]
- Ono, Y.; Asai, K.; Hamada, M. PBSIM2: A simulator for long-read sequencers with a novel generative model of quality scores. Bioinformatics 2021, 37, 589–595. [Google Scholar] [CrossRef] [PubMed]
- Rang, F.J.; Kloosterman, W.P.; de Ridder, J. From squiggle to basepair: Computational approaches for improving nanopore sequencing read accuracy. Genome Biol. 2018, 19, 90. [Google Scholar] [CrossRef]
- Shao, Y.; Lu, N.; Wu, Z.; Cai, C.; Wang, S.; Zhang, L.L.; Zhou, F.; Xiao, S.; Liu, L.; Zeng, X.; et al. Creating a functional single-chromosome yeast. Nature 2018, 560, 331–335. [Google Scholar] [CrossRef]
- Zhao, X.; Huang, Y.; Bian, C.; You, X.; Zhang, X.; Chen, J.; Wang, M.; Hu, C.; Xu, Y.; Xu, J.; et al. Whole genome sequencing of the fast-swimming Southern bluefin tuna (Thunnus maccoyii). Front. Genet. 2022, 13, 1020017. [Google Scholar] [CrossRef]
- Genner, M.; Collins, R. The genome sequence of the Atlantic horse mackerel, Trachurus trachurus (Linnaeus 1758). Wellcome Open Res. 2022, 7, 118. [Google Scholar] [CrossRef]
- Araki, K.; Aokic, J.Y.; Kawase, J.; Hamada, K.; Ozaki, A.; Fujimoto, H.; Yamamoto, I.; Usuki, H. Whole Genome Sequencing of Greater Amberjack (Seriola dumerili) for SNP Identification on Aligned Scaffolds and Genome Structural Variation Analysis Using Parallel Resequencing. Int. J. Genom. 2018, 2018, 7984292. [Google Scholar] [CrossRef] [PubMed]
- Zhang, D.C.; Guo, L.; Guo, H.Y.; Zhu, K.C.; Li, S.Q.; Zhang, Y.; Zhang, N.; Liu, B.S.; Jiang, S.G.; Li, J.T. Chromosome-level genome assembly of golden pompano (Trachinotus ovatus) in the family Carangidae. Sci. Data 2019, 6, 216. [Google Scholar] [CrossRef]
- Li, M.; Xu, X.; Liu, S.; Fan, G.; Zhou, Q.; Chen, S. The chromosome-level genome assembly of the Japanese yellowtail jack Seriola aureovittata provides insights into genome evolution and efficient oxygen transport. Mol. Ecol. Resour. 2022, 22, 2701–2712. [Google Scholar] [CrossRef] [PubMed]
- Accioly, I.V.; Bertollo, L.A.C.; Costa, G.W.W.F.; Jacobina, U.P.; Molina, W.F. Chromosomal population structuring in carangids (Perciformes) between the north-eastern and south-eastern coasts of Brazil. S. Afr. J. Mar. Sci. 2012, 34, 383–389. [Google Scholar] [CrossRef]
- Jacobina, U.P.; Vicari, M.R.; Martinez, P.A.; Cioffi, M.D.; Bertollo, L.A.C.; Molina, W.F. Atlantic moonfishes: Independent pathways of karyotypic and morphological differentiation. Helgol. Mar. Res. 2013, 67, 499–506. [Google Scholar] [CrossRef]
- Tian, F.; Liu, S.; Zhou, B.; Tang, Y.; Zhang, Y.; Zhang, C.; Zhao, K. Chromosome-level genome of Tibetan naked carp (Gymnocypris przewalskii) provides insights into Tibetan highland adaptation. DNA Res. 2022, 29, dsac025. [Google Scholar] [CrossRef]
- Wang, F.Y. Genomic Structure and Spatiotemporal Expression of Functional Differentiation of Hemoglobin in Gymnocypris eckloni; Qinghai University: Xining, China, 2022. [Google Scholar] [CrossRef]
- Ma, Q.; Jiang, C.; Zhou, L.Q.; Sun, T.; Liu, S.F.; Zhuang, Z.M. Karyotype characteristics of white trevally (Pseudocaranx dentex). J. Fish. China 2021, 28, 561–568. [Google Scholar] [CrossRef]
- Mezzasalma, M.; Andreone, F.; Aprea, G.; Glaw, F.; Odierna, G.; Guarino, F.M. When can chromosomes drive speciation? The peculiar case of the Malagasy tomato frogs (genus Dyscophus). Zool. Anz. 2017, 268, 41–46. [Google Scholar] [CrossRef]
- Wu, C.S.; Ma, Z.Y.; Zheng, G.D.; Zou, S.M.; Zhang, X.J.; Zhang, Y.A. Chromosome-level genome assembly of grass carp (Ctenopharyngodon idella) provides insights into its genome evolution. BMC Genom. 2022, 23, 271. [Google Scholar] [CrossRef]
- Ayala, F.J.; Coluzzi, M. Chromosome speciation: Humans, Drosophila, and mosquitoes. Proc. Natl. Acad. Sci. USA 2005, 102 (Suppl. S1), 6535–6542. [Google Scholar] [CrossRef] [PubMed]
- Painter, T.S.; Stone, W. Chromosome Fusion and Speciation in Drosophilae. Genetics 1935, 20, 327–341. [Google Scholar] [CrossRef] [PubMed]
- Li, S.; Liu, K.; Cui, A.; Hao, X.; Wang, B.; Wang, H.Y.; Jiang, Y.; Wang, Q.; Feng, B.; Xu, Y.; et al. A Chromosome-Level Genome Assembly of Yellowtail Kingfish (Seriola lalandi). Front. Genet. 2022, 12, 825742. [Google Scholar] [CrossRef] [PubMed]
- Pickett, B.D.; Glass, J.R.; Ridge, P.G.; Kauwe, J.S.K. De novo genome assembly of the marine teleost, bluefin trevally (Caranx melampygus). G3 2021, 11, jkab229. [Google Scholar] [CrossRef]
- Shao, F.; Han, M.; Peng, Z. Evolution and diversity of transposable elements in fish genomes. Sci. Rep. 2019, 9, 15399. [Google Scholar] [CrossRef] [PubMed]
- Mezzasalma, M.; Andreone, F.; Glaw, F.; Guarino, F.M.; Odierna, G.; Petraccioli, A.; Picariello, O. Changes in heterochromatin content and ancient chromosome fusion in the endemic Malagasy boid snakes Sanzinia and Acrantophis (Squamata: Serpentes). Salamandra 2019, 55, 140–144. [Google Scholar]
- Chen, L.; Qiu, Q.; Jiang, Y.; Wang, K.; Lin, Z.; Li, Z.; Bibi, F.; Yang, Y.; Wang, J.; Nie, W.; et al. Large-scale ruminant genome sequencing provides insights into their evolution and distinct traits. Science 2019, 364, eaav6202. [Google Scholar] [CrossRef] [PubMed]
- Earl, D.; Bradnam, K.; St John, J.; Darling, A.; Lin, D.; Fass, J.; Yu, H.O.; Buffalo, V.; Zerbino, D.R.; Diekhans, M.; et al. Assemblathon 1: A competitive assessment of de novo short read assembly methods. Genome Res. 2011, 12, 2224–2241. [Google Scholar] [CrossRef]
- Tzavlaki, K.; Moustakas, A. TGF-β Signaling. Biomolecules 2020, 10, 487. [Google Scholar] [CrossRef]
- Funkenstein, B.; Olekh, E.; Jakowlew, S.B. Identification of a novel transforming growth factor-beta (TGF-beta6) gene in fish: Regulation in skeletal muscle by nutritional state. BMC Mol. Biol. 2010, 11, 37. [Google Scholar] [CrossRef]
- Johnston, E.F.; Gillis, T.E. Transforming growth factor-β1 induces differentiation of rainbow trout (Oncorhynchus mykiss) cardiac fibroblasts into myofibroblasts. J. Exp. Biol. 2018, 221, jeb189167. [Google Scholar] [CrossRef] [PubMed]
- Kohli, G.; Hu, S.; Clelland, E.; Di Muccio, T.; Rothenstein, J.; Peng, C. Cloning of transforming growth factor-beta 1 (TGF-beta 1) and its type II receptor from zebrafish ovary and role of TGF-beta 1 in oocyte maturation. Endocrinology 2003, 144, 1931–1941. [Google Scholar] [CrossRef] [PubMed]
- Kohli, G.; Clelland, E.; Peng, C. Potential targets of transforming growth factor-beta1 during inhibition of oocyte maturation in zebrafish. Reprod. Biol. Endocrinol. 2005, 3, 53. [Google Scholar] [CrossRef] [PubMed]
- Calp, M.K.; Matsumoto, J.A.; Van Der Kraak, G. Activin and transforming growth factor-beta as local regulators of ovarian steroidogenesis in the goldfish. Gen. Comp. Endocrinol. 2003, 132, 142–150. [Google Scholar] [CrossRef] [PubMed]
- de Mello, F.; Streit, D.P.; Sabin, N.; Gabillard, J.C. Dynamic expression of tgf-β2, tgf-β3 and inhibin βA during muscle growth resumption and satellite cell differentiation in rainbow trout (Oncorhynchus mykiss). Gen. Comp. Endocrinol. 2015, 210, 23–29. [Google Scholar] [CrossRef] [PubMed]
- Foitzik, K.; Paus, R.; Doetschman, T.; Dotto, G.P. The TGF-beta2 isoform is both a required and sufficient inducer of murine hair follicle morphogenesis. Dev. Biol. 1999, 212, 278–289. [Google Scholar] [CrossRef]
- Xu, Q.Y. The Expression Patterns of BMPR-I, BMPR-II, Smadl, Smad4 and Smad7 in Amphioxus Tail Regeneration Process and Prokaryotic Expression, Polyclonal Antibody Preparation, Immunohistochemical Localization of BMP2/4, BMPR-I and BMPR-II; Ocean University of China: Qingdao, China, 2015. [Google Scholar]
- Cerny, R.; Cattell, M.; Sauka-Spengler, T.; Bronner-Fraser, M.; Yu, F.; Medeiros, D.M. Evidence for the prepattern/cooption model of vertebrate jaw evolution. Proc. Natl. Acad. Sci. USA 2010, 107, 17262–17267. [Google Scholar] [CrossRef]
- Su, R.X. The Functional Study of BMP2 Gene in the Heart Development of Zebrafish; Hunan Normal University: Changsha, China, 2017. [Google Scholar] [CrossRef]
- Quint, E.; Smith, A.; Avaron, F.; Laforest, L.; Miles, J.; Gaffield, W.; Akimenko, M.A. Bone patterning is altered in the regenerating zebrafish caudal fin after ectopic expression of sonic hedgehog and bmp2b or exposure to cyclopamine. Proc. Natl. Acad. Sci. USA 2002, 99, 8713–8718. [Google Scholar] [CrossRef]
- Waldmann, L.; Leyhr, J.; Zhang, H.; Allalou, A.; Öhman-Mägi, C.; Haitina, T. The role of Gdf5 in the development of the zebrafish fin endoskeleton. Dev. Dyn. 2022, 251, 1535–1549. [Google Scholar] [CrossRef]
- Bandyopadhyay, A.; Tsuji, K.; Cox, K.; Harfe, B.D.; Rosen, V.; Tabin, C.J. Genetic analysis of the roles of BMP2, BMP4, and BMP7 in limb patterning and skeletogenesis. PLoS Genet. 2006, 2, e216. [Google Scholar] [CrossRef]
- Yin, Y.; Zhang, Y.; Hua, Z.; Wu, A.; Pan, X.; Yang, J.; Wang, X. Muscle transcriptome analysis provides new insights into the growth gap between fast- and slow-growing Sinocyclocheilus grahami. Front. Genet. 2023, 14, 1217952. [Google Scholar] [CrossRef]
- Schoenebeck, J.J.; Hutchinson, S.A.; Byers, A.; Beale, H.C.; Carrington, B.; Faden, D.L.; Rimbault, M.; Decker, B.; Kidd, J.M.; Sood, R.; et al. Variation of BMP3 contributes to dog breed skull diversity. PLoS Genet. 2012, 8, e1002849. [Google Scholar] [CrossRef]
- Luo, D.S. The Study of bmp3 Regulation of Cerebral Hemorrhage and Blood-Brain Barrier Leakage in Zebrafish Embryos; Chongqing University: Chongqing, China, 2018. [Google Scholar]
- Daluiski, A.; Engstrand, T.; Bahamonde, M.E.; Gamer, L.W.; Agius, E.; Stevenson, S.L.; Cox, K.; Rosen, V.; Lyons, K.M. Bone morphogenetic protein-3 is a negative regulator of bone density. Nat. Genet. 2001, 27, 84–88. [Google Scholar] [CrossRef]
- Zhao, R.; Lawler, A.M.; Lee, S.J. Characterization of GDF-10 expression patterns and null mice. Dev. Biol. 1999, 212, 68–79. [Google Scholar] [CrossRef]
- Matsumoto, Y.; Otsuka, F.; Hino, J.; Miyoshi, T.; Takano, M.; Miyazato, M.; Makino, H.; Kangawa, K. Bone morphogenetic protein-3b (BMP-3b) inhibits osteoblast differentiation via Smad2/3 pathway by counteracting Smad1/5/8 signaling. Mol. Cell Endocrinol. 2012, 350, 78–86. [Google Scholar] [CrossRef] [PubMed]
- Ma, X.; Su, B.; Tian, Y.; Backenstose, N.J.C.; Ye, Z.; Moss, A.; Duong, T.Y.; Wang, X.; Dunham, R.A. Deep Transcriptomic Analysis Reveals the Dynamic Developmental Progression during Early Development of Channel Catfish (Ictalurus punctatus). Int. J. Mol. Sci. 2020, 21, 5535. [Google Scholar] [CrossRef] [PubMed]
- Hino, J.; Nishimatsu, S.; Nagai, T.; Matsuo, H.; Kangawa, K.; Nohno, T. Coordination of BMP-3b and cerberus is required for head formation of Xenopus embryos. Dev. Biol. 2003, 260, 138–157. [Google Scholar] [CrossRef]
- Ravindran, S.; Gao, Q.; Kotecha, M.; Magin, R.L.; Karol, S.; Bedran-Russo, A.; George, A. Biomimetic extracellular matrix-incorporated scaffold induces osteogenic gene expression in human marrow stromal cells. Tissue Eng. Part A 2012, 18, 295–309. [Google Scholar] [CrossRef] [PubMed]
- Guo, A.N. The Molecular Mechanism of bmp10, dusp1 by Cold Stress and Construction of gsdf Transgenic Line in Zebrafish; Shanghai Ocean University: Shanghai, China, 2014. [Google Scholar]
- Schartl, M. Beyond the zebrafish: Diverse fish species for modeling human disease. Dis. Model. Mech. 2014, 7, 181–192. [Google Scholar] [CrossRef]
- Niu, B.H. The Mechanism of bmp10 and dusp1 in Apoptosis of Zebrafish Induced by Low Temperature; Shanghai Ocean University: Shanghai, China, 2017. [Google Scholar]
- Chen, H.; Yong, W.; Ren, S.; Shen, W.; He, Y.; Cox, K.A.; Zhu, W.; Li, W.; Soonpaa, M.; Payne, R.M.; et al. Overexpression of bone morphogenetic protein 10 in myocardium disrupts cardiac postnatal hypertrophic growth. J. Biol. Chem. 2006, 281, 27481–27491. [Google Scholar] [CrossRef]
- Otsuka, F.; Shimasaki, S. A negative feedback system between oocyte bone morphogenetic protein 15 and granulosa cell kit ligand: Its role in regulating granulosa cell mitosis. Proc. Natl. Acad. Sci. USA 2002, 99, 8060–8065. [Google Scholar] [CrossRef] [PubMed]
- Peng, C.; Clelland, E.; Tan, Q. Potential role of bone morphogenetic protein-15 in zebrafish follicle development and oocyte maturation. Comp. Biochem. Physiol. A Mol. Integr. Physiol. 2009, 153, 83–87. [Google Scholar] [CrossRef] [PubMed]
- Yan, C.; Wang, P.; DeMayo, J.; DeMayo, F.J.; Elvin, J.A.; Carino, C.; Prasad, S.V.; Skinner, S.S.; Dunbar, B.S.; Dube, J.L.; et al. Synergistic roles of bone morphogenetic protein 15 and growth differentiation factor 9 in ovarian function. Mol. Endocrinol. 2001, 15, 854–866. [Google Scholar] [CrossRef] [PubMed]
- Zhang, L.C. Mechanisms of Prolactin Affecting Growth and Development of Secondary Hair Follicles in Cashmere Goats; Hebei Agricultural University: Baoding, China, 2022. [Google Scholar] [CrossRef]
- Liang, X.M. Studies about the Role of Prolactin in Osmoregulation of the Spotted Scat (Scatophagus argus) Response to Environmental Salinity Change; Shanghai Ocean University: Shanghai, China, 2019. [Google Scholar]
- Ma, D.; Ma, A.; Huang, Z.; Wang, G.; Wang, T.; Xia, D.; Ma, B. Transcriptome Analysis for Identification of Genes Related to Gonad Differentiation, Growth, Immune Response and Marker Discovery in The Turbot (Scophthalmus maximus). PLoS ONE 2016, 11, e0149414. [Google Scholar] [CrossRef]
- Wilson, A.B.; Whittington, C.M.; Meyer, A.; Scobell, S.K.; Gauthier, M.E. Prolactin and the evolution of male pregnancy. Gen. Comp. Endocrinol. 2023, 334, 114210. [Google Scholar] [CrossRef] [PubMed]
- Yada, T.; Misumi, I.; Muto, K.; Azuma, T.; Schreck, C.B. Effects of prolactin and growth hormone on proliferation and survival of cultured trout leucocytes. Gen. Comp. Endocrinol. 2004, 136, 298–306. [Google Scholar] [CrossRef] [PubMed]
- Zhang, Q. Construction of Eukaryotic Expression Vector of Sika Deer PDGFA Gene and Expression in 293T Cells; Northeast Forestry University: Harbin, China, 2020. [Google Scholar] [CrossRef]
- Tallquist, M.D.; Soriano, P. Cell autonomous requirement for PDGFRalpha in populations of cranial and cardiac neural crest cells. Development 2003, 130, 507–518. [Google Scholar] [CrossRef]
- Bjarnegård, M.; Enge, M.; Norlin, J.; Gustafsdottir, S.; Fredriksson, S.; Abramsson, A.; Takemoto, M.; Gustafsson, E.; Fässler, R.; Betsholtz, C. Endothelium-specific ablation of PDGFB leads to pericyte loss and glomerular, cardiac and placental abnormalities. Development 2004, 131, 1847–1857. [Google Scholar] [CrossRef]
- Li, Y. Molecular Cloning and Expression Patterns of Leptin and Its Receptor Genes and Their Roles in Feeding Regulation of Seriola aureovittata; Tianjin Agricultural University: Tianjin, China, 2021. [Google Scholar] [CrossRef]
- Escobar, S.; Rocha, A.; Felip, A.; Carrillo, M.; Zanuy, S.; Kah, O.; Servili, A. Leptin receptor gene in the European sea bass (Dicentrarchus labrax): Cloning, phylogeny, tissue distribution and neuroanatomical organization. Gen. Comp. Endocrinol. 2016, 229, 100–111. [Google Scholar] [CrossRef]
- Wang, B.; Cui, A.; Wang, P.; Zhang, Y.; Liu, X.; Jiang, Y.; Xu, Y. Temporal expression profiles of leptin and its receptor genes during early development and ovarian maturation of Cynoglossus semilaevis. Fish. Physiol. Biochem. 2020, 46, 359–370. [Google Scholar] [CrossRef]


| Platform | Library Size | Raw Data | Clean Data | Coverage |
|---|---|---|---|---|
| Illumina DNA-Seq | 350 bp | 35.55 G | 27.32 G | 49.18× |
| PacBio SMRT DNA-Seq | 15 kb | 23.16 G | - | 32.04× |
| Illumina Hi-Seq | 350 bp | 75.38 G | 62.54 G | 106.57× |
| Illumina RNA-Seq | 350 bp | 18.88 G | 18.17 G | 26.75× |
| PacBio RNA-Seq | - | 83.33 G | 81.52 G | 118.06× |
| Sample ID | Contig Length | Scaffold Length | Contig Number | Scaffold Number |
|---|---|---|---|---|
| Total | 716,127,322 | 716,155,622 | 357 | 74 |
| Max | 32,717,515 | 44,530,477 | - | - |
| Number ≥ 2000 | - | - | 357 | 74 |
| N50 | 19,703,568 | 30,768,099 | 14 | 11 |
| N60 | 17,277,660 | 28,712,820 | 18 | 14 |
| N70 | 10,918,262 | 28,631,201 | 23 | 16 |
| N80 | 8,369,130 | 25,845,031 | 31 | 19 |
| N90 | 1,424,252 | 22,449,952 | 57 | 22 |
| Methods | Gene Set | Number | Average Transcript Length (bp) | Average CDS Length (bp) | Average Exons Per Gene | Average Exons Length (bp) | Average Intron Length (bp) |
|---|---|---|---|---|---|---|---|
| De novo | Augustus | 27,707 | 8899.69 | 1341.68 | 7.69 | 174.52 | 1130.15 |
| GlimmerHMM | 84,170 | 7253.22 | 685.44 | 4.35 | 157.69 | 1962.40 | |
| SNAP | 52,373 | 10,543.74 | 840.02 | 5.78 | 145.23 | 2028.32 | |
| Geneid | 35,529 | 13,193.54 | 1226.37 | 6.17 | 198.82 | 2315.45 | |
| GenScan | 33,288 | 15,169.07 | 1517.03 | 8.59 | 176.64 | 1799.14 | |
| Homolog | C. melampygus | 22,005 | 9440.80 | 1419.12 | 8.05 | 176.26 | 1137.62 |
| D. rerio | 22,061 | 10,042.42 | 1643.80 | 7.92 | 207.44 | 1212.92 | |
| E. akaara | 25,181 | 10,476.56 | 1580.20 | 8.12 | 194.55 | 1249.10 | |
| E. lanceolatus | 23,758 | 11,030.34 | 1687.10 | 8.55 | 197.44 | 1238.32 | |
| G. aculeatus | 24,659 | 8854.54 | 1370.85 | 7.34 | 186.66 | 1179.61 | |
| H. sapiens | 18,440 | 10,332.37 | 1457.94 | 7.96 | 183.2 | 1275.43 | |
| O. latipes | 23,140 | 10,611.21 | 1735.47 | 8.33 | 208.29 | 1210.57 | |
| P. leopardus | 23,258 | 11,014.54 | 1665.17 | 8.51 | 195.76 | 1245.56 | |
| S. dumerili | 22,091 | 11,876.31 | 1678.07 | 9.15 | 183.31 | 1250.63 | |
| S. lalandi | 23,283 | 11,313.71 | 1677.08 | 8.81 | 190.27 | 1233.19 | |
| T. rubripes | 21,501 | 11,393.36 | 1723.54 | 8.88 | 194.18 | 1227.75 | |
| RNA-Seq | PASA | 36,827 | 10,915.62 | 1482.82 | 8.97 | 165.35 | 1183.84 |
| Cufflinks | 31,993 | 11,076.56 | 2484.57 | 8.06 | 308.17 | 1216.58 | |
| EVM (EVidenceModeler) | 27,885 | 10,820.37 | 1437.70 | 8.2 | 175.25 | 1302.49 | |
| PASA-update * | 27,384 | 11,297.04 | 1486.17 | 8.48 | 175.17 | 1310.91 | |
| Final set ** | 22,716 | 12,823.03 | 1676.66 | 9.65 | 173.83 | 1289.29 | |
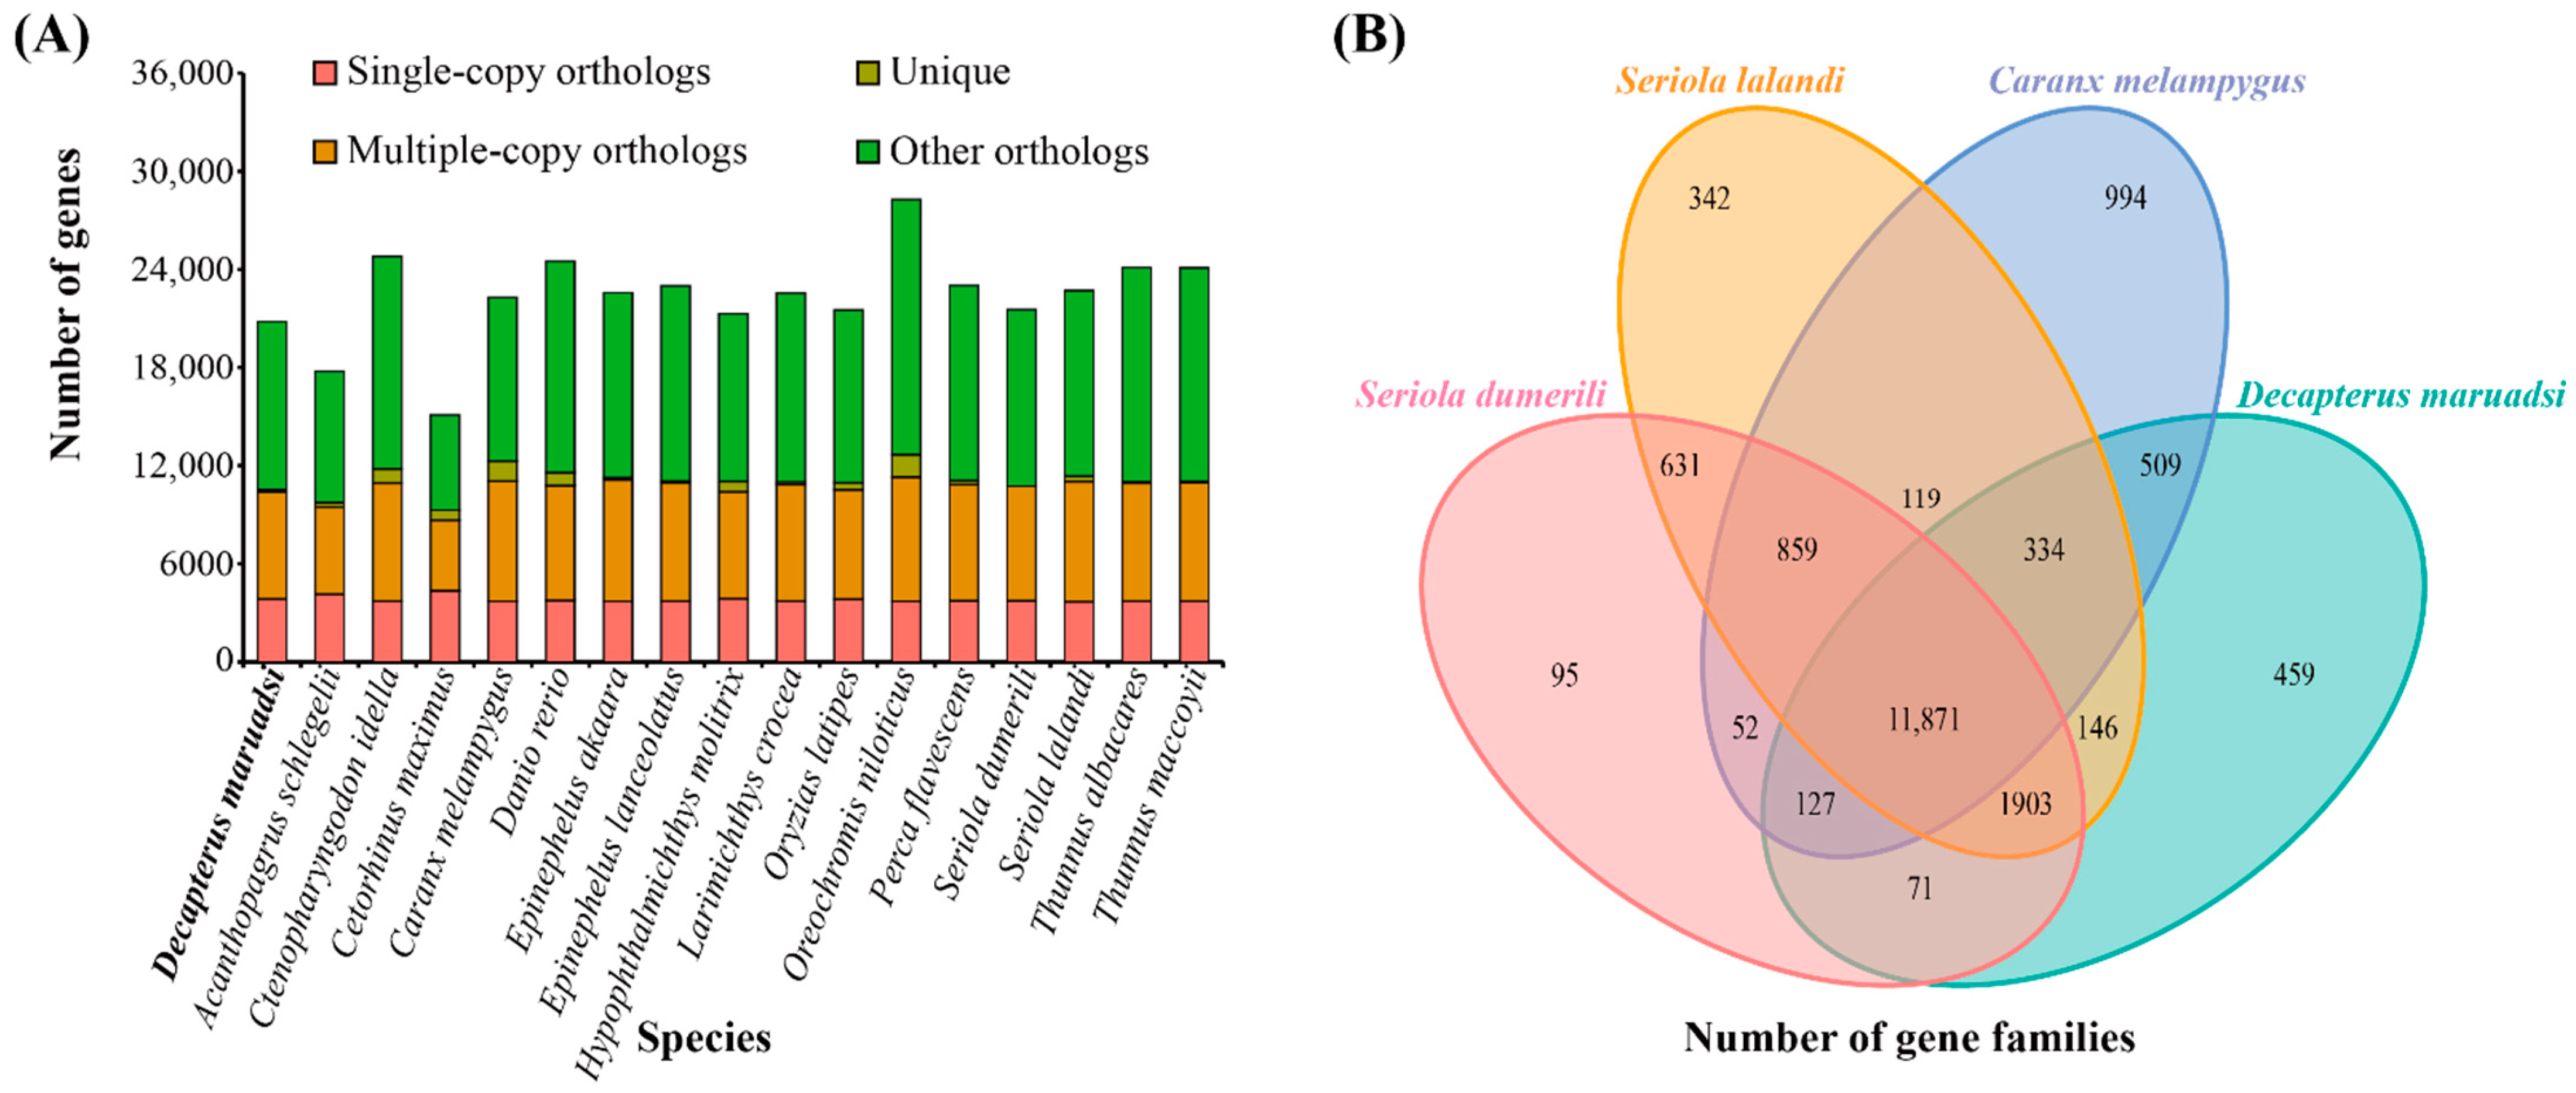
| Species | Gene | Single-Copy Gene Families | Multiple-Copy Gene Families | Unique Gene Families |
|---|---|---|---|---|
| D. maruadsi | 22,716 | 2768 | 12,652 | 45 |
| A. schlegelii | 18,785 | 2429 | 10,652 | 95 |
| C. idella | 32,712 | 3749 | 13,044 | 292 |
| C. maximus | 16,858 | 2137 | 9007 | 170 |
| C. melampygus | 30,852 | 3974 | 10,891 | 524 |
| D. rerio | 25,573 | 3477 | 12,254 | 165 |
| E. akaara | 23,923 | 3222 | 12,435 | 51 |
| E. lanceolatus | 23,673 | 3177 | 13,011 | 46 |
| H. molitrix | 24,571 | 3002 | 11,764 | 146 |
| L. crocea | 23,201 | 3101 | 13,021 | 51 |
| O. latipes | 21,981 | 2879 | 12,065 | 93 |
| O. niloticus | 29,430 | 3808 | 12,597 | 297 |
| P. flavescens | 23,609 | 3126 | 12,684 | 60 |
| S. dumerili | 21,740 | 2901 | 12,708 | 5 |
| S. lalandi | 24,983 | 3275 | 12,930 | 159 |
| T. albacares | 24,526 | 3126 | 13,629 | 23 |
| T. maccoyii | 24,560 | 3154 | 13,604 | 20 |
| Common | 23,981 | 2468 | 882 | - |
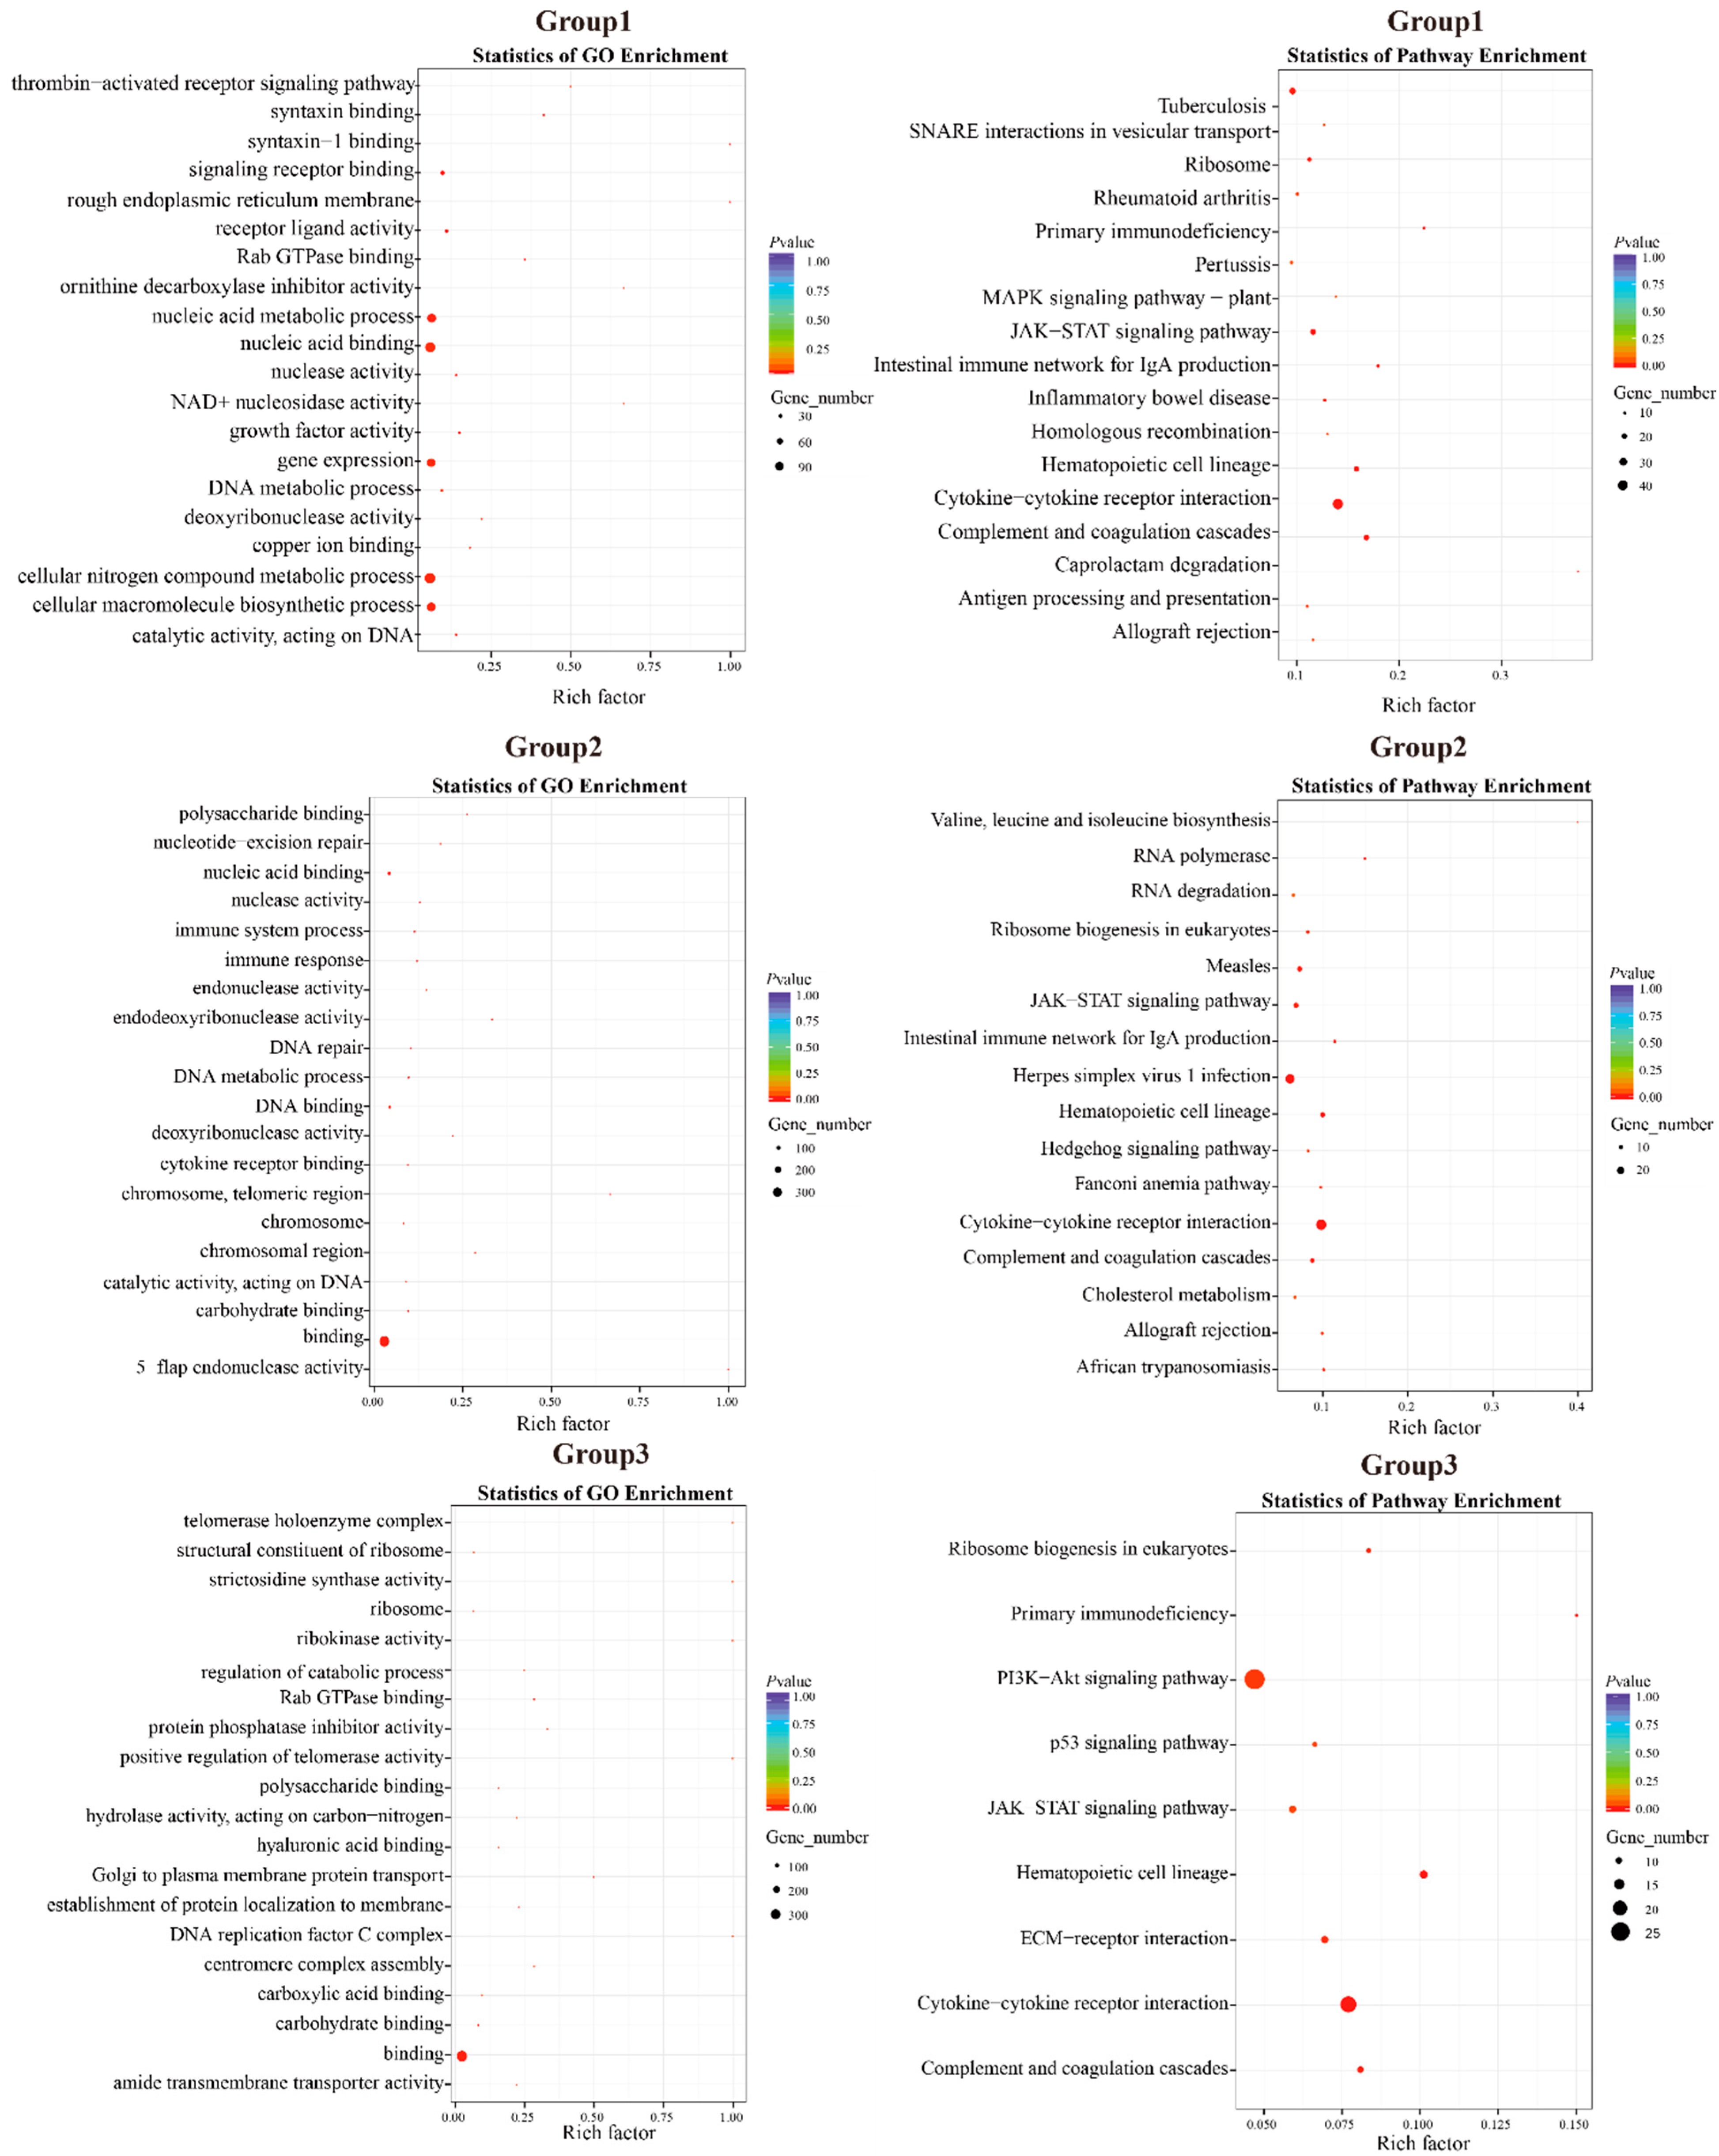
| Group 1: D. maruadsi vs. C. melampygus, S. dumerili, and S. lalandi; 1233 Genes; 17 KEGG Pathways, p < 0.05 | ||
| KEGG Pathways | p-Value | Genes Screened |
| Cytokine-cytokine receptor interaction | 6.74 × 10⁻¹² | TNFRSF9, TGFB1, MPL, LEPR, PRLR, IFNGR1, PAQR8, IL2RB, CSF2RB2, TNF, TNFRSF6B, LIFR, IL6ST, CCR9, IL10RB, IL13RA1, CCL13, BMP15, IL12A, CCL20, GDF15, CSF2RA, CD4, LEP-B, TNFRSF1B, BMPR2, GDF5, BMP3, IL12B, TNFSF15, IFNGR1L, FAS |
| Complement and coagulation cascades | 1.10 × 10⁻⁸ | CSMD1, F9, PRG4, SHD, PRRG4, PRRG2, F2RL2, C9, FNDC1, PLG, F5, SERPINE1, PLAUR, F3, CD55, THADA |
| Hematopoietic cell lineage | 3.22 × 10⁻⁷ | CSMD1, CD2, TNF, LEC, CSF2RA, CD4, CD22, CD38, CD55, CD8A |
| JAK-STAT signaling pathway | 9.19 × 10⁻⁵ | MPL, LEPR, PRLR, IFNGR1, IL2RB, CSF2RB2, PDGFA, LIFR, IL10RB, IL13RA1, IL12A, CSF2RA, LEP-B, CCND2, IL12B, IFNGR1L, IL22RA2 |
| Primary immunodeficiency | 0.000167663 | RFXANK, CIITA, CD4, AICDA, RAG1, CD8A |
| Intestinal immune network for IgA production | 0.000266305 | TGFB1, PIGR, MAP3K14, PIGR, CCR9, AICDA |
| Tuberculosis | 0.001444511 | CSMD1, TGFB1, TIRAP, RFXANK, CABP5, CABP1, IFNGR1, CABP4, CLEC2I, CITTA, PRRT1, TNF, PVALEF, MRC1, LAMP5, IL10RB, IL12A, PLA2R1, OLR1, IL12B, CD74, IFNGR1L |
| Ribosome | 0.002606518 | RPS25, TTC4, MRPL33, RPS6, RPL12, RPS11, RPS2, RPLP1, RPS19, MRPL19, MRPS14, RPL18, MRPL13, RPS10, MRPS5 |
| Caprolactam degradation | 0.006439168 | AKR1A1B, HADHA |
| Inflammatory bowel disease | 0.006937031 | TGFB1, IFNGR1, PAQR8, TNF, IL10RB, IL12A, IL12B, IFNGR1L |
| Rheumatoid arthritis | 0.025399593 | TGFB1, ATP6V1C1B, PAQR8, TNF, CTLA4, CCL13, CCL20, VEGFAA, ATP6V1E1 |
| Antigen processing and presentation | 0.02616887 | RFXANK, TXNDC11, CIITA, TNF, CD4, CD8A, CD74 |
| Homologous recombination | 0.03081775 | FH13, EME2, PALB2, TOP3A, BRCC3, RBBP8 |
| SNARE interactions in vesicular transport | 0.033834986 | STX3, BUD23, STX8, GOSR2, STX19, VAMP8 |
| Allograft rejection | 0.035246855 | TNF, IL12A, IL12B, FAS |
| MAPK signaling pathway—plant | 0.037166119 | CABP5, NME7, CABP1, CABP4, PVALEF |
| Pertussis | 0.042868873 | IRF1, CASP1, TIRAP, CABP5, PLEKHS1, CABP1, CABP4, TNF, PVALEF, IL12A, IL12B, CFL2 |
| Group 2: D. maruadsi vs. T. albacares and T. maccoyii; 810 Genes; 16 KEGG Pathways, p < 0.05 | ||
| KEGG Pathways | p-Value | Genes Screened |
| Cytokine-cytokine receptor interaction | 3.01 × 10⁻¹¹ | IL20RB, FASLG, CXCL6, TNFRSF13B, IL17RC, IL6ST, TNFSF14, IL2RB, CCR6, CCL26, IL20RA, CILP2, IFNAR2, IL12A, XCL1, CSF2RA, CXCR3, CD4, CD40, IL6R, IL15RA, IL10, BMPR2, FAS |
| Herpes simplex virus 1 infection | 0.000268892 | FASLG, ZNF425, ZNF16, FAM111A, ZNF644, TNFSF14, HIC2, ALYREF, ZNF768, DAXX, ZNF436, IFNAR2, IL12A, ZNF260, TICAM2, CASP8, ZFAT, IRF9, MYNN, ZNF229, ZNF227, CD74, ZFP69, FAS |
| Hematopoietic cell lineage | 0.000360577 | CD2, LEC, CSF2RA, CD22, CD4, IL6R, CD44 |
| RNA polymerase | 0.001447104 | ABBX, POLR3F, FHAB, ITPRID1, POLR1D, RPII |
| Complement and coagulation cascades | 0.001815605 | F9, PRG4, F7, C6, F3, F5, C8A, PLAUR, C5, THADA |
| Measles | 0.002456453 | FASLG, FAM111A, CD28, IL2RB, IFNAR2, IL12A, CASP8, CDKN1B, IRF9, CCND2, FAS |
| Intestinal immune network for IgA production | 0.002919063 | TNFRSF13B, CD28, PIGR, CD40, IL15RA, IL10 |
| JAK-STAT signaling pathway | 0.005214936 | IL20RB, IL6ST, IL2RB, IL20RA, IFNAR2, IL12A, CSF2RA, IL6R, IL15RA, IRF9, IL10, CCND2 |
| Valine, leucine and isoleucine biosynthesis | 0.009278319 | BCAT1, TD |
| African trypanosomiasis | 0.010319507 | FASLG, HMCN1, IL12A, IL10, FAS |
| Ribosome biogenesis in eukaryotes | 0.010659323 | DKC1, REXO5, RPP25, XRN1, RIOK1, UTP14A, VSTM2A |
| Allograft rejection | 0.011171214 | FASLG, CD28, IL12A, IL10, FAS |
| Fanconi anemia pathway | 0.012071448 | BRCA1, FANCM, SLX4, PALB2, ATRIP, RMI1 |
| Hedgehog signaling pathway | 0.02553919 | ARR3, KIN, CFAP100, ARRB1, ZFC3H1, CCND2 |
| Cholesterol metabolism | 0.043687605 | FAM43B, APOA4, TMEM259, LDLRAP1, PLTP, STAR |
| RNA degradation | 0.049693288 | EXOSC3, LSM7, PATL1, DIS3L, XRN1M WDR55, OXR1 |
| Group 3: D. maruadsi vs. A. schlegelii, L. crocea, and E. akaara; 761 Genes; 9 KEGG Pathways; p < 0.05 | ||
| KEGG Pathways | p-Value | Genes Screened |
| Cytokine-cytokine receptor interaction | 4.70 × 10⁻⁶ | IL20RB, IL17RB, TNFRSF13B, TUB, PRLR, IL2RB, CCR6, CCR9, TNFSF12, IL12A, CCL20, CSF2RA, IL22RA2, CD4, IL11, NGFR, BMP10, BMP3, ILFR, TNFSF15, FAS |
| Hematopoietic cell lineage | 0.000202903 | GP9, CSF2RA, CD22, CD4, IL11, CD38, KITLG, CD44, CD8A |
| Primary immunodeficiency | 0.001047259 | TNFRSF13B, CD4, RAG1, CD8A, UNG, BLNK |
| Complement and coagulation cascades | 0.00368767 | F9, PRG4, PRRG4, PRRG2, PLAU, PRG4, F3, SERPINE1, C8A, THADA |
| Ribosome biogenesis in eukaryotes | 0.007445272 | HEATR1, XRN1, UTP14A, POP1, VSTM2A, VSTM2L, REXO1 |
| ECM-receptor interaction | 0.007558111 | GP9, COL9A3, PRG4, NEFH, PRG4, COL24A1, SVOP1, RELN, CD44, CCDC71 |
| PI3K-Akt signaling pathway | 0.020929921 | PDGFC, COL9A3, ATLG62600, PRG4, PRLR, BRCA1, NEFH, PIK3R6, FGF3, GADD45GIP1, IL2RB, EFNA1, RAB1A, EIF4E2, COL24A1, LSR, EFNA4, NGFR, SGK1, MDM2, KITLG, RELN, CCDC71, EREG, THADA |
| p53 signaling pathway | 0.026972984 | GORAB, IGFBP5, SERPINE, CASP8, MDM2, CD82, CHEK2, FAS |
| JAK-STAT signaling pathway | 0.030400518 | IL20RB, TUB, PRLR, IL2RB, IL12A, CSF2RA, IL22RA2, IL1L, IRF9, LIFR |
| Male D. maruadsi | Female D. maruadsi | Male T. maccoyii | |||
|---|---|---|---|---|---|
| Chromosome | Length (bp) | Chromosome | Length (bp) | Chromosome | Length (bp) |
| Chr1 | 23,026,827 | Chr4 | 23,735,607 | Chr20 | 28,299,982 |
| Chr2 | 29,845,322 | Chr22 | 32,348,910 | Chr12 | 33,635,709 |
| Chr3 | 31,476,057 | Chr10 | 31,747,162 | Chr10 | 34,909,826 |
| Chr4 | 21,740,779 | Chr5 | 21,359,908 | Chr23 | 26,533,419 |
| Chr5 | 23,517,350 | Chr6 | 22,930,063 | Chr21 | 27,656,739 |
| Chr6 | 31,525,687 | Chr9 | 31,512,500 | Chr5 | 35,576,159 |
| Chr7 | 33,120,671 | Chr12 | 33,226,575 | Chr3 | 37,555,862 |
| Chr8 | 31,939,948 | Chr11 | 33,111,663 | Chr9 | 35,071,145 |
| Chr9 | 28,712,820 | Chr8 | 28,300,000 | Chr14 | 31,544,571 |
| Chr10 | 34,370,581 | Chr19 | 37,058,507 | Chr8 | 35,154,190 |
| Chr11 | 31,272,706 | Chr15 | 33,635,488 | Chr4 | 35,765,724 |
| Chr12 | 28,690,070 | Chr23 | 35,658,500 | Chr13 | 32,533,796 |
| Chr13 | 34,239,528 | Chr1 | 41,317,494 | Chr6 | 35,338,069 |
| Chr14 | 44,530,477 | Chr2 | 45,095,783 | Chr7 Chr24 | 35,252,955 20,451,074 |
| Chr15 | 25,845,031 | Chr3 | 26,889,330 | Chr16 | 30,468,816 |
| Chr16 | 32,890,911 | Chr17 | 34,731,214 | Chr2 | 38,771,177 |
| Chr17 | 34,080,461 | Chr16 | 36,885,046 | Chr1 | 41,002,747 |
| Chr18 | 30,768,099 | Chr21 | 29,349,286 | Chr18 | 30,220,260 |
| Chr19 | 28,631,201 | Chr13 | 27,185,605 | Chr15 | 31,126,207 |
| Chr20 | 26,979,794 | Chr20 | 27,911,733 | Chr19 | 29,765,142 |
| Chr21 | 26,623,482 | Chr7 | 26,730,606 | Chr17 | 30,337,103 |
| Chr22 | 29,266,683 | Chr18 | 29,852,700 | Chr11 | 33,761,101 |
| Chr23 | 22,449,952 | Chr14 | 23,005,116 | Chr22 | 26,962,447 |
Disclaimer/Publisher’s Note: The statements, opinions and data contained in all publications are solely those of the individual author(s) and contributor(s) and not of MDPI and/or the editor(s). MDPI and/or the editor(s) disclaim responsibility for any injury to people or property resulting from any ideas, methods, instructions or products referred to in the content. |
© 2024 by the authors. Licensee MDPI, Basel, Switzerland. This article is an open access article distributed under the terms and conditions of the Creative Commons Attribution (CC BY) license (https://creativecommons.org/licenses/by/4.0/).
Share and Cite
Deng, W.-J.; Li, Q.-Q.; Shuai, H.-N.; Wu, R.-X.; Niu, S.-F.; Wang, Q.-H.; Miao, B.-B. Whole-Genome Sequencing Analyses Reveal the Evolution Mechanisms of Typical Biological Features of Decapterus maruadsi. Animals 2024, 14, 1202. https://doi.org/10.3390/ani14081202
Deng W-J, Li Q-Q, Shuai H-N, Wu R-X, Niu S-F, Wang Q-H, Miao B-B. Whole-Genome Sequencing Analyses Reveal the Evolution Mechanisms of Typical Biological Features of Decapterus maruadsi. Animals. 2024; 14(8):1202. https://doi.org/10.3390/ani14081202
Chicago/Turabian StyleDeng, Wen-Jian, Qian-Qian Li, Hao-Nan Shuai, Ren-Xie Wu, Su-Fang Niu, Qing-Hua Wang, and Ben-Ben Miao. 2024. "Whole-Genome Sequencing Analyses Reveal the Evolution Mechanisms of Typical Biological Features of Decapterus maruadsi" Animals 14, no. 8: 1202. https://doi.org/10.3390/ani14081202