

Serum Metabolomic Profiling in Healthy Dogs Supplemented with Increasing Levels of Purified Beta-1,3/1,6-Glucans

 , , , , , , , and
Simple Summary
Abstract
1. Introduction
2. Materials and Methods
2.1. Ethical Statement
2.2. Animals, Diets, and Experimental Design
2.3. Metabolomic Analysis
2.4. Statistical Analysis
3. Results
4. Discussion
5. Conclusions
Supplementary Materials
Author Contributions
Funding
Institutional Review Board Statement
Informed Consent Statement
Data Availability Statement
Acknowledgments
Conflicts of Interest
References
- Roessner, U.; Bowne, J. What is metabolomics all about? BioTechniques 2009, 46, 363–365. [Google Scholar] [CrossRef]
- Aleksandrova, K.; Egea Rodrigues, C.; Floegel, A.; Ahrens, W. Omics biomarkers in obesity: Novel etiological insights and targets for precision prevention. Curr. Obes. Rep. 2020, 9, 219–230. [Google Scholar] [CrossRef]
- Avela, H.F.; Sirén, H. Advances in lipidomics. Clin. Chim. Acta 2020, 510, 123–141. [Google Scholar] [CrossRef]
- Zhou, Z.; Luo, M.; Chen, X.; Yin, Y.; Xiong, X.; Wang, R.; Zhu, Z.-J. Ion mobility collision cross-section atlas for known and unknown metabolite annotation in untargeted metabolomics. Nat. Commun. 2020, 11, 4334. [Google Scholar] [CrossRef]
- Qiu, S.; Cai, Y.; Yao, H.; Lin, C.; Xie, Y.; Tang, S.; Zhang, A. Small molecule metabolites: Discovery of biomarkers and therapeutic targets. Signal Transduct. Target. Ther. 2023, 8, 132. [Google Scholar] [CrossRef]
- Bar, N.; Korem, T.; Weissbrod, O.; Zeevi, D.; Rothschild, D.; Leviatan, S.; Kosower, N.; Pompan-Lotan, M.; Weinberger, A.; Le Roy, C.I.; et al. A reference map of potential determinants for the human serum metabolome. Nature 2020, 588, 135–140. [Google Scholar] [CrossRef]
- Patti, G.J.; Yanes, O.; Siuzdak, G. Innovation: Metabolomics: The apogee of the omics trilogy. Nat. Rev. Mol. Cell Biol. 2012, 13, 263–269. [Google Scholar] [CrossRef]
- Carlos, G.; dos Santos, F.P.; Fröehlich, P.E. Canine metabolomics advances. Metabolomics 2020, 16, 16. [Google Scholar] [CrossRef]
- Vasanthan, T.; Temelli, F. Grain fractionation technologies for cereal beta-glucan concentration. Food Res. Int. 2008, 41, 876–881. [Google Scholar] [CrossRef]
- Ferreira, L.G.; Endrighi, M.; Lisenko, K.G.; de Oliveira, M.R.D.; Damasceno, M.R.; Claudino, J.A.; Gutierres, G.P.; Peconick, A.P.; Saad, F.M.O.B.; Zangeronimo, M.G. Oat beta-glucan as a dietary supplement for dogs. PLoS ONE 2018, 13, e0201133. [Google Scholar] [CrossRef]
- Brennan, C.S.; Cleary, L.J. The potential use of cereal (1→3,1→4)-Beta-d-glucans as functional food ingredients. J. Cereal Sci. 2005, 42, 1–13. [Google Scholar] [CrossRef]
- Volman, J.J.; Ramakers, J.D.; Plat, J. Dietary modulation of immune function by beta-glucans. Physiol. Behav. 2008, 94, 276–284. [Google Scholar] [CrossRef]
- Kaur, R.; Sharma, M.; Ji, D.; Xu, M.; Agyei, D. Structural features, modification, and functionalities of beta-glucan. Fibers 2020, 8, 1. [Google Scholar] [CrossRef]
- Kim, H.S.; Hong, J.T.; Kim, Y.; Han, S.-B. Stimulatory Effect of Beta-glucans on Immune Cells. Immune Netw. 2011, 11, 191. [Google Scholar] [CrossRef]
- Manners, D.J.; Masson, A.J.; Patterson, J.C. The structure of a beta-(1→3)-D-glucan from yeast cell walls. Biochem. J. 1973, 135, 19–30. [Google Scholar] [CrossRef]
- De Oliveira, C.A.F.; Vetvicka, V.; Zanuzzo, F.S. Beta-Glucan successfully stimulated the immune system in different jawed vertebrate species. Comp. Immunol. Microbiol. Infect. Dis. 2019, 62, 1–6. [Google Scholar] [CrossRef]
- Vetvicka, V.; Vannucci, L.; Sima, P.; Richter, J. Beta-glucan: Supplement or drug? From laboratory to clinical trials. Molecules 2019, 24, 1251. [Google Scholar] [CrossRef]
- Vetvicka, V.; Vetvickova, J. An evaluation of the immunological activities of commercially available beta-1,3-glucans. Jana 2006, 10, 25–31. [Google Scholar]
- Ferreira, C.S.; Vendramini, T.H.A.; Amaral, A.R.; Rentas, M.F.; Ernandes, M.C.; Silva, F.L.; Oba, P.M.; Filho, F.O.R.; Brunetto, M.A. Metabolic variables of obese dogs with insulin resistance supplemented with yeast beta-glucan. BMC Vet. Res. 2022, 18, 14. [Google Scholar] [CrossRef]
- Amaral, A.R.; Rentas, M.F.; Rosa, T.C.T.; Pereira, T.A.E.; Marchi, P.H.; Teixeira, F.A.; Brunetto, M.A. Microbiota in mild inflammatory bowel disease (IBD) can be modulated by beta-glucans and mannanoligosaccharides: A randomized, double-blinded study in dogs. Vet. Sci. 2024, 11, 349. [Google Scholar] [CrossRef]
- Marchi, P.H.; Vendramini, T.H.A.; Zafalon, R.V.A.; Príncipe, L.A.; Cesar, C.G.L.; Perini, M.P.; Putarov, T.C.; Gomes, C.O.M.; Balieiro, J.C.C.; Brunetto, M.A. Effects of increasing levels of purified beta-1,3/1,6-glucans on the fecal microbiome, digestibility, and immunity variables of healthy adult dogs. Microorganisms 2024, 12, 113. [Google Scholar] [CrossRef] [PubMed]
- Laflamme, D.P. Development and Validation of a Body Condition Score System for Dogs. Canine Pract. 1997, 22, 10–15. [Google Scholar]
- FEDIAF—The European Pet Food Industry Federation. Nutritional Guidelines for Complete and Complementary Pet Food for Cats and Dogs; European Pet Food Industry Federation: Brussels, Belgium, 2024. [Google Scholar]
- NRC. Nutrient Requirements of Dogs and Cats; National Academies Press: Washington, DC, USA, 2006. [Google Scholar]
- Beckonert, O.; Keun, H.C.; Ebbels, T.M.D.; Bundy, J.; Holmes, E.; Lindon, J.C.; Nicholson, J.K. Metabolic profiling, metabolomic and metabonomic procedures for NMR spectroscopy of urine, plasma, serum and tissue extracts. Nat. Protoc. 2007, 2, 2692–2703. [Google Scholar] [CrossRef] [PubMed]
- Chong, J.; Wishart, D.S.; Xia, J. Using MetaboAnalyst 4.0 for comprehensive and integrative metabolomics data analysis. Curr. Protoc. Bioinform. 2019, 68, e86. [Google Scholar] [CrossRef]
- Wiedmer, S.K.; Hyötyläinen, T. Selection of analytical methodology for metabolomics. In Chromatographic Methods in Metabolomics; The Royal Society of Chemistry: Cambridge, UK, 2013; pp. 1–10. [Google Scholar]
- Pilon, A.; Selegato, D.; Fernandes, R.P.; Bueno, P.C.P.; Pinho, D.R.; Neto, F.C.; Freire, R.T.; Castro-Gamboa, I.; Bolzani, V.S.; Lopes, N.P. Metabolômica de plantas: Métodos e desafios. Quim. Nova 2020, 43, 329–354. [Google Scholar] [CrossRef]
- Walsh, M.C.; Brennan, L.; Malthouse, J.P.G.; Roche, H.M.; Gibney, M.J. Effect of acute dietary standardization on the urinary, plasma, and salivary metabolomic profiles of healthy humans. Am. J. Clin. Nutr. 2006, 84, 531–539. [Google Scholar] [CrossRef]
- Han, X.; Gross, R.W. The Foundations and Development of Lipidomics. J. Lipid Res. 2022, 63, 100164. [Google Scholar] [CrossRef]
- Ephraim, E.; Cochrane, C.-Y.; Jewell, D.E. Varying protein levels influence metabolomics and the gut microbiome in healthy adult dogs. Toxins 2020, 12, 517. [Google Scholar] [CrossRef]
- Nelson, D.L.; Cox, M.M. Princípios de Bioquímica de Lehninger, 7th ed.; Artmed Editora: Porto Alegre, Brazil, 2019. [Google Scholar]
- Wang, M.; Wang, X.; Zhang, L.; Yang, R.; Fei, C.; Zhang, K.; Wang, C.; Liu, Y.; Xue, F. Effect of sulfated yeast beta-glucan on cyclophosphamide-induced immunosuppression in chickens. Int. Immunopharmacol. 2019, 74, 105690. [Google Scholar] [CrossRef]
- Chiechio, S.; Canonico, P.L.; Grilli, M. L-acetylcarnitine: A mechanistically distinctive and potentially rapid-acting antidepressant drug. Int. J. Mol. Sci. 2017, 19, 11. [Google Scholar] [CrossRef]
- Vetvicka, V. Beta(1-3)(1-6)-D-glucans modulate immune status and blood glucose levels in dogs. Br. J. Pharm. Res. 2014, 4, 981–991. [Google Scholar] [CrossRef]
- Klop, B.; Elte, J.W.F.; Cabezas, M.C. Dyslipidemia in obesity: Mechanisms and potential targets. Nutrients 2013, 5, 1218–1240. [Google Scholar] [CrossRef] [PubMed]
- Sookoian, S.; Pirola, C.J. Alanine and aspartate aminotransferase and glutamine-cycling pathway: Their roles in pathogenesis of metabolic syndrome. World J. Gastroenterol. 2012, 18, 3775–3781. [Google Scholar] [CrossRef] [PubMed]
- Brosnan, J.T. Interorgan Amino Acid Transport and its Regulation. J. Nutr. 2003, 133, 2068S–2072S. [Google Scholar] [CrossRef]
- DeBerardinis, R.J.; Cheng, T. Q’s next: The diverse functions of glutamine in metabolism, cell biology and cancer. Oncogene 2010, 29, 313–324. [Google Scholar] [CrossRef]
- Kopple, J.D. Phenylalanine and tyrosine metabolism in chronic kidney failure. J. Nutr. 2007, 137 (Suppl. S1), 1586S–1590S; discussion 1597S–1598S. [Google Scholar] [CrossRef]
- Pascual, M.B.; El-Azaz, J.; de la Torre, F.N.; Cañas, R.A.; Avila, C.; Cánovas, F.M. Biosynthesis and metabolic fate of phenylalanine in conifers. Front. Plant Sci. 2016, 7, 1030. [Google Scholar] [CrossRef]
- Tohge, T.; Watanabe, M.; Hoefgen, R.; Fernie, A.R. Shikimate and phenylalanine biosynthesis in the green lineage. Front. Plant Sci. 2013, 4, 62. [Google Scholar] [CrossRef]
- Banderet, L.E.; Lieberman, H.R. Treatment with tyrosine, a neurotransmitter precursor, reduces environmental stress in humans. Brain Res. Bull. 1989, 22, 759–762. [Google Scholar] [CrossRef]
- Kano, M.; Uchiyama, H.; Ohta, M.; Ohtani, N. Oral tyrosine changed the responses to commands in German shepherds and Labrador retrievers but not in toy poodles. J. Vet. Behav. Clin. Appl. Res. 2015, 10, 194–198. [Google Scholar] [CrossRef]
- Morris, J.G.; Yu, S.; Rogers, Q.R. Red hair in black cats is reversed by addition of tyrosine to the diet. J. Nutr. 2002, 132, 1646S–1648S. [Google Scholar] [CrossRef]
- Watson, A.; Wayman, J.; Kelley, R.; Feugier, A.; Biourge, V. Increased dietary intake of tyrosine upregulates melanin deposition in the hair of adult black-coated dogs. Anim. Nutr. 2018, 4, 422–428. [Google Scholar] [CrossRef] [PubMed]
- Yu, S.; Rogers, Q.R.; Morris, J.G. Effect of low levels of dietary tyrosine on the hair colour of cats. J. Small Anim. Pract. 2001, 42, 176–180. [Google Scholar] [CrossRef] [PubMed]
- Lev, R.; Griffiths, W.C. Colonic and small intestinal alkaline phosphatase. A histochemical and biochemical study. Gastroenterology 1982, 82, 1427–1435. [Google Scholar] [CrossRef]
- Lallès, J.-P. Recent advances in intestinal alkaline phosphatase, inflammation, and nutrition. Nutr. Rev. 2019, 77, 710–724. [Google Scholar] [CrossRef]
- Ruddick, J.P.; Evans, A.K.; Nutt, D.J.; Lightman, S.L.; Rook, G.A.W.; Lowry, C.A. Tryptophan metabolism in the central nervous system: Medical implications. Expert Rev. Mol. Med. 2006, 8, 1–27. [Google Scholar] [CrossRef]
- Le Floc’h, N.; Otten, W.; Merlot, E. Tryptophan metabolism, from nutrition to potential therapeutic applications. Amino Acids 2011, 41, 1195–1205. [Google Scholar] [CrossRef]
- Xue, C.; Li, G.; Zheng, Q.; Gu, X.; Shi, Q.; Su, Y.; Chu, Q.; Yuan, X.; Bao, Z.; Lu, J.; et al. Tryptophan metabolism in health and disease. Cell Metab. 2023, 35, 1304–1326. [Google Scholar] [CrossRef]
- Höglund, E.; Øverli, Ø.; Winberg, S. Tryptophan Metabolic Pathways and Brain Serotonergic Activity: A Comparative Review. Front. Endocrinol. 2019, 10, 158. [Google Scholar] [CrossRef]
- Hankinson, O. The ARYL hydrocarbon receptor complex. Annu. Rev. Pharmacol. Toxicol. 1995, 35, 307–340. [Google Scholar] [CrossRef]
- Bansal, T.; Alaniz, R.C.; Wood, T.K.; Jayaraman, A. The bacterial signal indole increases epithelial-cell tight junction resistance and attenuates indicators of inflammation. Proc. Natl. Acad. Sci. USA 2010, 107, 228–233. [Google Scholar] [CrossRef]
- Wilczak, J.; Prostek, A.; Dziendzikowska, K.; Gajewska, M.; Kopiasz, Ł.; Harasym, J.; Oczkowski, M.; Gromadzka-Ostrowska, J. Oat beta-glucan as a metabolic regulator in the early stage of colorectal cancer—A model study on azoxymethane-treated rats. Int. J. Mol. Sci. 2024, 25, 4635. [Google Scholar] [CrossRef] [PubMed]
- Kaszaki, J.; Palásthy, Z.; Érczes, D.; Rácz, A.; Torday, C.; Varga, G.; Vécsei, L.; Boros, M. Kynurenic acid inhibits intestinal hypermotility and xanthine oxidase activity during experimental colon obstruction in dogs. Neurogastroenterol. Motil. 2008, 20, 53–62. [Google Scholar] [CrossRef] [PubMed]
- Guard, B.C.; Barr, J.W.; Reddivari, L.; Klemashevich, C.; Jayaraman, A.; Steiner, J.W.; Vanamala, J.; Suchodolski, J.S. Characterization of microbial dysbiosis and metabolomic changes in dogs with acute diarrhea. PLoS ONE 2015, 10, e0127259. [Google Scholar] [CrossRef] [PubMed]
- Luo, Z.; Ma, L.; Zhou, T.; Huang, Y.; Zhang, L.; Du, Z.; Yong, K.; Yao, X.; Shen, L.; Yu, S.; et al. Beta-Glucan Alters Gut Microbiota and Plasma Metabolites in Pre-Weaning Dairy Calves. Metabolites 2022, 12, 687. [Google Scholar] [CrossRef]
- Chew, S.Y.; Chee, W.; Than, L.T.L. The glyoxylate cycle and alternative carbon metabolism as metabolic adaptation strategies of Candida glabrata: Perspectives from Candida albicans and Saccharomyces cerevisiae. J. Biomed. Sci. 2019, 26, 52. [Google Scholar] [CrossRef]
- Handl, S.; Dowd, S.E.; Garcia-Mazcorro, J.F.; Steiner, J.M.; Suchodolski, J.S. Massive parallel 16S rRNA gene pyrosequencing reveals highly diverse fecal bacterial and fungal communities in healthy dogs and cats. FEMS Microbiol. Ecol. 2011, 76, 301–310. [Google Scholar] [CrossRef]
- Zhen, W.; Liu, Y.; Shao, Y.; Ma, Y.; Wu, Y.; Guo, F.; Abbas, W.; Guo, Y.; Wang, Z. Yeast β-Glucan Altered Intestinal Microbiome and Metabolome in Older Hens. Front. Microbiol. 2021, 12, 766878. [Google Scholar] [CrossRef]
- Allaway, D.; Kamlage, B.; Gilham, M.S.; Hewson-Hughes, A.K.; Wiemer, J.C.; Colyer, A.; Rein, D. Effects of dietary glucose supplementation on the fasted plasma metabolome in cats and dogs. Metabolomics 2013, 9, 1096–1108. [Google Scholar] [CrossRef]
- O’Gorman, A.; Brennan, L. Metabolomic applications in nutritional research: A perspective: Nutritional metabolomics. J. Sci. Food Agric. 2015, 95, 2567–2570. [Google Scholar] [CrossRef]
- Monteiro, M.S.; Carvalho, M.; Bastos, M.L.; Guedes de Pinho, P. Metabolomics analysis for biomarker discovery: Advances and challenges. Curr. Med. Chem. 2012, 20, 257–271. [Google Scholar] [CrossRef]


| Item | Diets | |||
|---|---|---|---|---|
| 0.0% | 0.07% | 0.14% | 0.28% | |
| Ingredients (%) | ||||
| Corn grain | 33.26 | 33.19 | 33.12 | 32.98 |
| Common viscera meal | 26.38 | 26.38 | 26.38 | 26.38 |
| Broken rice | 15.00 | 15.00 | 15.00 | 15.00 |
| Corn gluten | 7.99 | 7.99 | 7.99 | 7.99 |
| Beet pulp | 4.00 | 4.00 | 4.00 | 4.00 |
| Fish oil | 0.82 | 0.82 | 0.82 | 0.82 |
| Potassium chloride | 0.42 | 0.42 | 0.42 | 0.42 |
| Mineral and vitamin premix 1 | 0.50 | 0.50 | 0.50 | 0.50 |
| Common salt | 0.30 | 0.30 | 0.30 | 0.30 |
| Choline | 0.17 | 0.17 | 0.17 | 0.17 |
| Whole egg powder | 0.15 | 0.15 | 0.15 | 0.15 |
| Antifungal | 0.10 | 0.10 | 0.10 | 0.10 |
| Antioxidant | 0.07 | 0.07 | 0.07 | 0.07 |
| Methionine | 0.03 | 0.03 | 0.03 | 0.03 |
| Poultry viscera fat | 6.81 | 6.81 | 6.81 | 6.81 |
| Swine fat | 4.00 | 4.00 | 4.00 | 4.00 |
| Purified beta-1,3/1,6-glucan 2 | 0.00 | 0.07 | 0.14 | 0.28 |
| Total | 100 | 100 | 100 | 100 |
| Chemical composition | ||||
| Dry matter (%) | 93.11 | 94.31 | 94.00 | 93.13 |
| Chemical composition in dry matter (%) | ||||
| Organic matter | 92.13 | 92.07 | 92.04 | 91.93 |
| Crude protein | 25.25 | 25.07 | 27.81 | 28.24 |
| Fat | 17.69 | 17.82 | 17.71 | 17.42 |
| Ash | 7.87 | 7.93 | 7.96 | 8.07 |
| Crude fiber | 10.17 | 9.92 | 10.15 | 8.28 |
| Nitrogen-free extract 3 | 39.02 | 39.26 | 36.37 | 37.99 |
| Calcium | 2.09 | 2.07 | 2.13 | 2.06 |
| Phosphorus | 1.19 | 1.17 | 1.18 | 1.17 |
| Metabolizable energy (kcal/g) 4 | 4.10 | 4.15 | 4.14 | 4.09 |
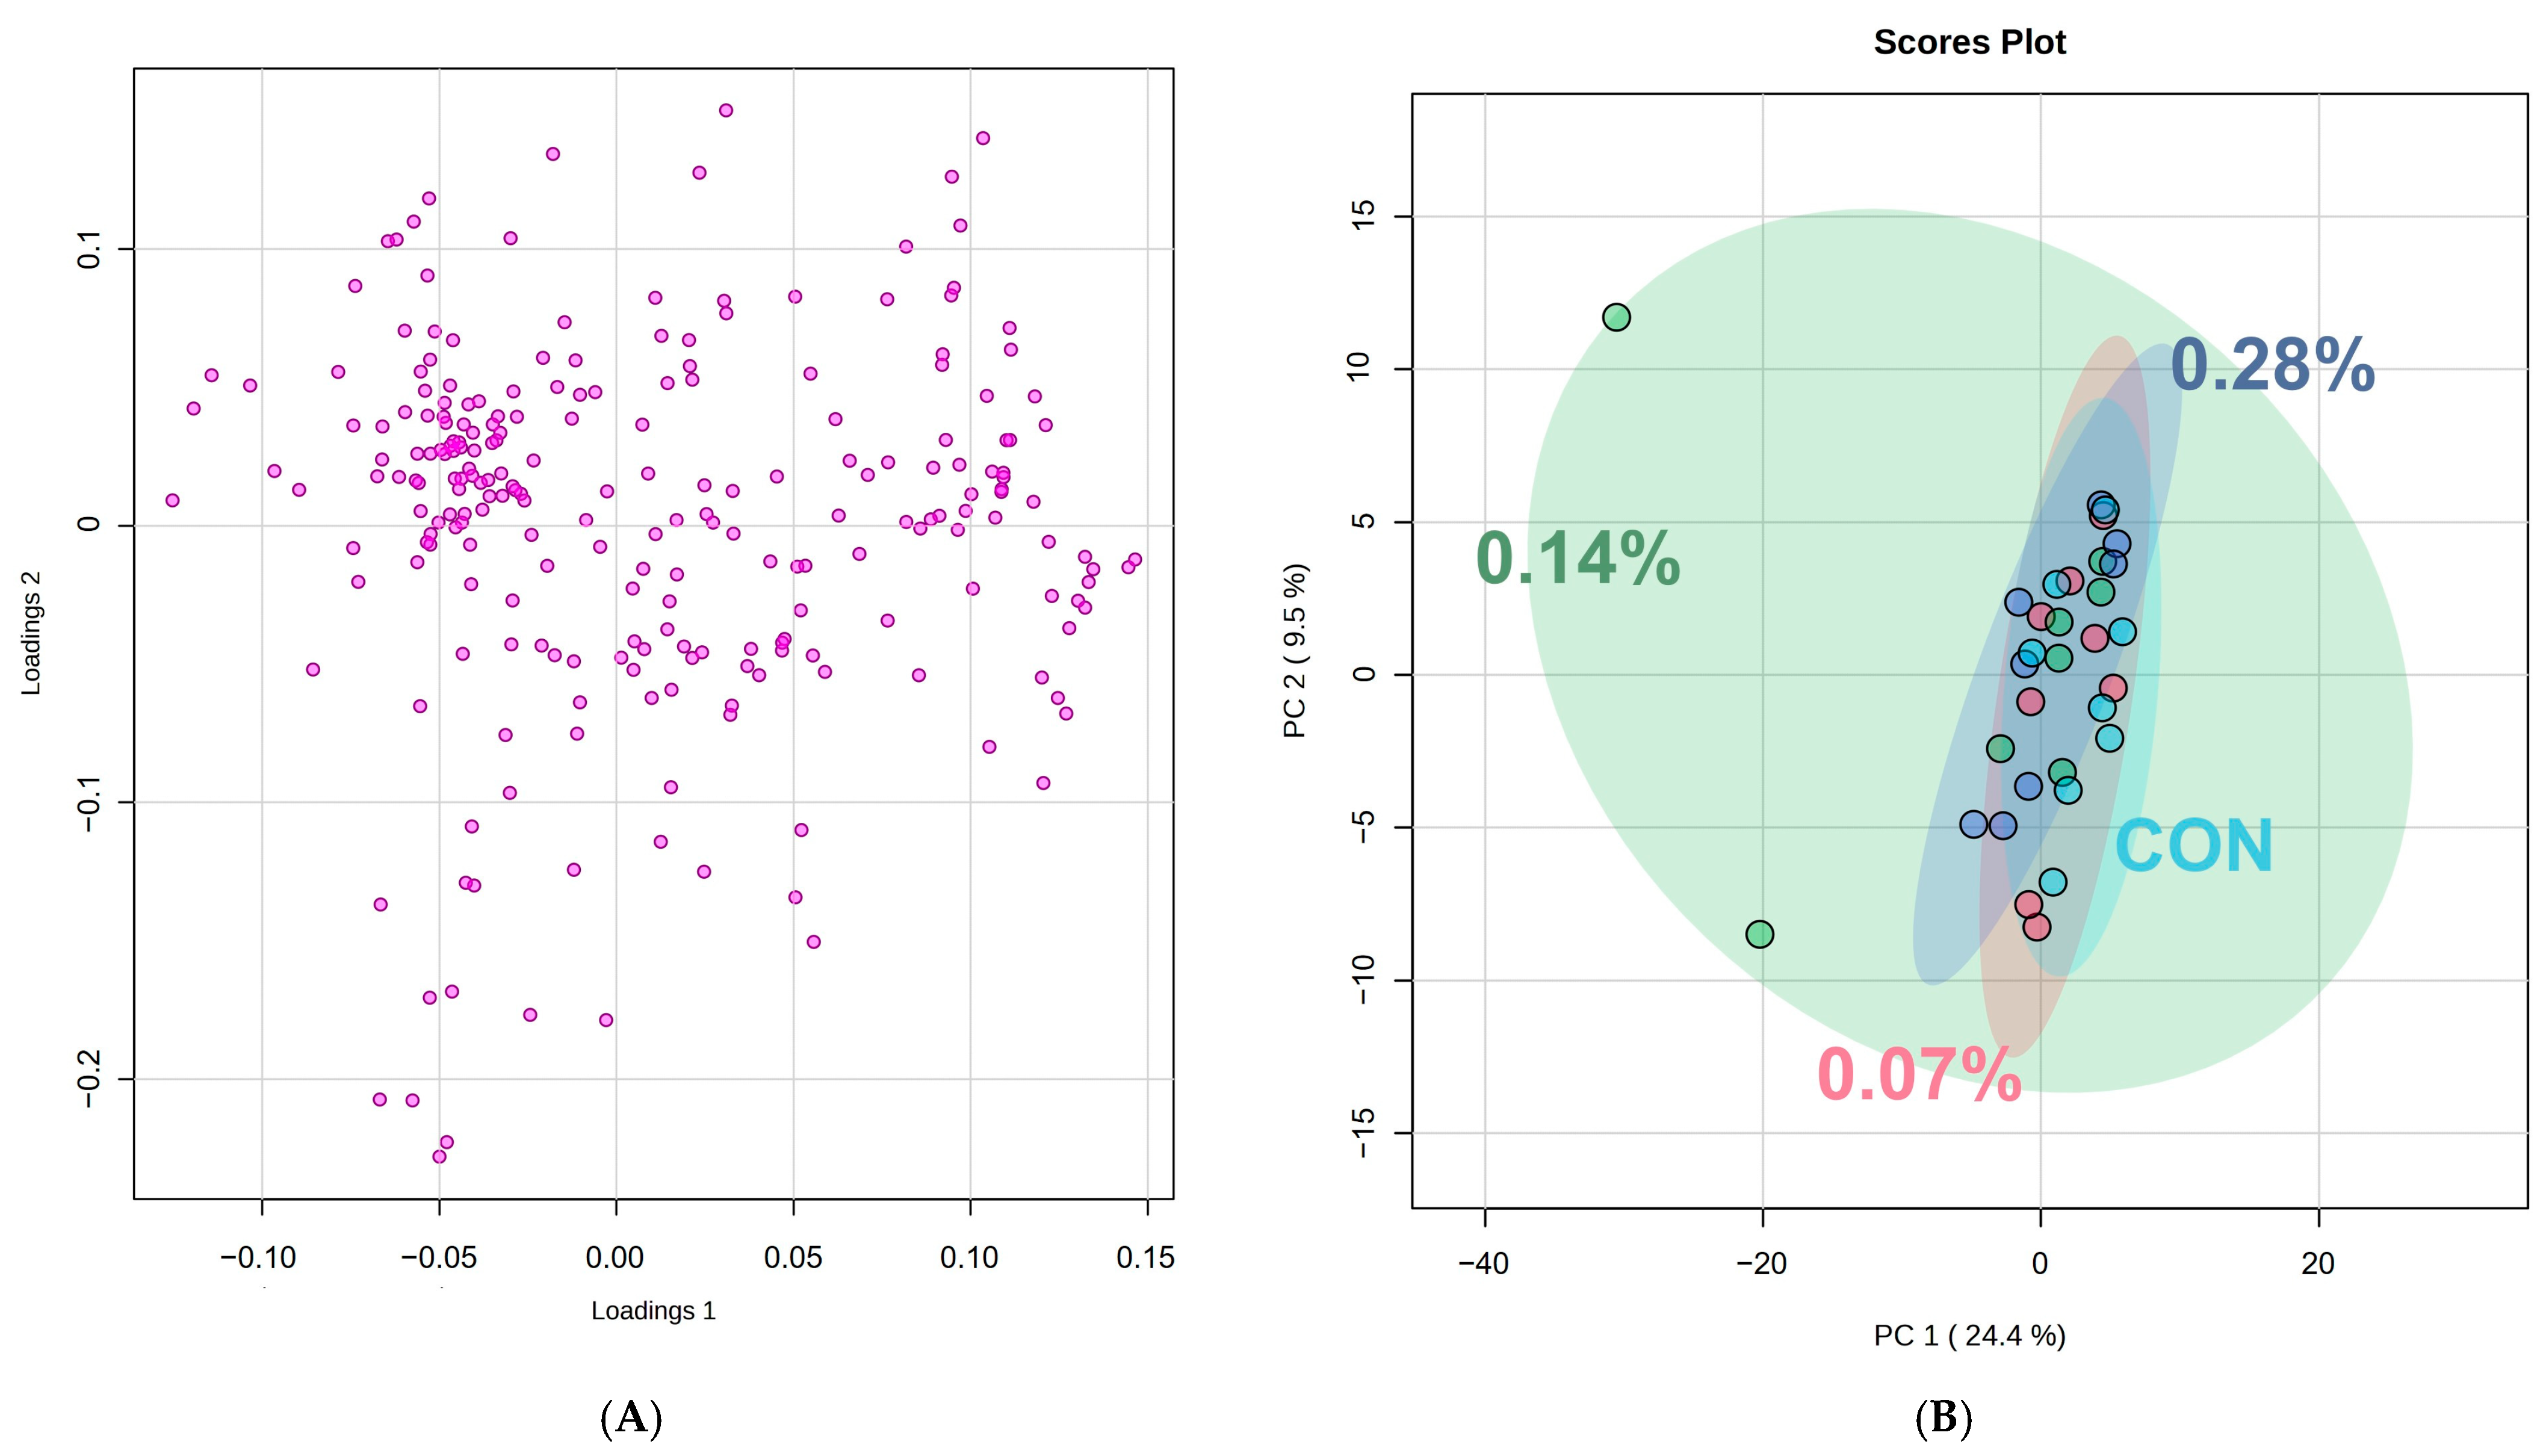
| PC1 | PC2 | ||||
|---|---|---|---|---|---|
| Spectral ppm Range | Compound | Score | Spectral ppm Range | Compound | Score |
| 5.92–5.96 | Lipids | 0.121 | 0.24–0.28 | Lipids | 0.150 |
| 5.96–6.00 | Lipids | 0.118 | 0.52–0.56 | Cholesterol | −0.129 |
| 6.00–6.04 | Lipids | 0.118 | 0.92–0.96 | Valine | −0.177 |
| 6.04–6.08 | Lipids | 0.111 | 1.16–1.20 | Lipids | −0.208 |
| 6.08–6.12 | Lipids | 0.111 | 1.32–1.36 | Lactate | −0.223 |
| 8.12–8.16 | Lipids | −0.125 | 1.48–1.52 | Alanine | 0.134 |
| 8.16–8.20 | Lipids | −0.119 | 2.00–2.04 | N-acetyl glycoproteins | −0.228 |
| 8.24–8.28 | Lipids | −0.114 | 2.04–2.08 | Glutamine | −0.168 |
| 8.36–8.40 | Lipids | 0.122 | 2.52–2.56 | Citrate | −0.127 |
| 8.40–8.44 | Lipids | 0.132 | 2.60–2.64 | Creatinine | −0.124 |
| 9.56–9.60 | Lipids | 0.106 | 3.20–3.24 | o-acetylcarnitine | −0.137 |
| 9.60–9.64 | Lipids | 0.111 | 4.48–4.52 | Lipids | −0.130 |
| 9.64–9.68 | Lipids | 0.109 | 5.36–5.40 | Glucose | −0.179 |
| 9.68–9.72 | Lipids | 0.109 | 7.12–7.16 | Phenylalanine | −0.125 |
| 9.92–9.96 | Lipids | 0.110 | 7.92–7.96 | Histidine | 0.118 |
| Pathway Name | Match Status | Raw p | −log(p) | Impact |
|---|---|---|---|---|
| Alanine, aspartate, and glutamate metabolism | 2/28 | 0.010 | 1.993 | 0.114 |
| Glyoxylate and dicarboxylate metabolism | 2/32 | 0.013 | 1.880 | 0.032 |
| Phenylalanine, tyrosine, and tryptophan biosynthesis | 1/4 | 0.023 | 1.644 | 0.500 |
| Phenylalanine metabolism | 1/8 | 0.045 | 1.348 | 0.357 |
| Histidine metabolism | 1/16 | 0.088 | 1.055 | 0.221 |
| Starch and sucrose metabolism | 1/18 | 0.099 | 1.007 | 0.421 |
Disclaimer/Publisher’s Note: The statements, opinions and data contained in all publications are solely those of the individual author(s) and contributor(s) and not of MDPI and/or the editor(s). MDPI and/or the editor(s) disclaim responsibility for any injury to people or property resulting from any ideas, methods, instructions or products referred to in the content. |
© 2025 by the authors. Licensee MDPI, Basel, Switzerland. This article is an open access article distributed under the terms and conditions of the Creative Commons Attribution (CC BY) license (https://creativecommons.org/licenses/by/4.0/).
Share and Cite
Marchi, P.H.; Príncipe, L.d.A.; Trindade, F.S.; Santos, L.D.d.; Finardi, G.L.F.; Fernandes, E.L.; Putarov, T.C.; Ribeiro, G.H.; Colnago, L.A.; Balieiro, J.C.d.C.; et al. Serum Metabolomic Profiling in Healthy Dogs Supplemented with Increasing Levels of Purified Beta-1,3/1,6-Glucans. Animals 2025, 15, 1211. https://doi.org/10.3390/ani15091211
Marchi PH, Príncipe LdA, Trindade FS, Santos LDd, Finardi GLF, Fernandes EL, Putarov TC, Ribeiro GH, Colnago LA, Balieiro JCdC, et al. Serum Metabolomic Profiling in Healthy Dogs Supplemented with Increasing Levels of Purified Beta-1,3/1,6-Glucans. Animals. 2025; 15(9):1211. https://doi.org/10.3390/ani15091211
Chicago/Turabian StyleMarchi, Pedro Henrique, Leonardo de Andrade Príncipe, Felipe Sesti Trindade, Luana Dias dos Santos, Gabriela Luiza Fagundes Finardi, Eduarda Lorena Fernandes, Thaila Cristina Putarov, Gabriel Henrique Ribeiro, Luiz Alberto Colnago, Júlio Cesar de Carvalho Balieiro, and et al. 2025. "Serum Metabolomic Profiling in Healthy Dogs Supplemented with Increasing Levels of Purified Beta-1,3/1,6-Glucans" Animals 15, no. 9: 1211. https://doi.org/10.3390/ani15091211
APA StyleMarchi, P. H., Príncipe, L. d. A., Trindade, F. S., Santos, L. D. d., Finardi, G. L. F., Fernandes, E. L., Putarov, T. C., Ribeiro, G. H., Colnago, L. A., Balieiro, J. C. d. C., & Vendramini, T. H. A. (2025). Serum Metabolomic Profiling in Healthy Dogs Supplemented with Increasing Levels of Purified Beta-1,3/1,6-Glucans. Animals, 15(9), 1211. https://doi.org/10.3390/ani15091211