Simple Summary
After calving, dairy cows face the risk of negative energy balance, inflammation, and immunosuppression, which may result in bacterial infection and disruption of the normal microbiota, thus encouraging the development of metritis and endometritis. This study characterized uterine, fecal, bedding, and airborne dust microbiota from postpartum dairy cows and their environment during summer and winter. The results clarify the importance of microbiota in cowshed environments, i.e., bedding and airborne dust, in understanding the postpartum uterine microbiota of dairy cows.
Abstract
The aim of this study was to characterize uterine, fecal, bedding, and airborne dust microbiota from postpartum dairy cows and their environment. The cows were managed by the free-stall housing system, and samples for microbiota and serum metabolite assessment were collected during summer and winter when the cows were at one and two months postpartum. Uterine microbiota varied between seasons; the five most prevalent taxa were Enterobacteriaceae, Moraxellaceae, Ruminococcaceae, Staphylococcaceae, and Lactobacillaceae during summer, and Ruminococcaceae, Lachnospiraceae, Bacteroidaceae, Moraxellaceae, and Clostridiaceae during winter. Although Actinomycetaceae and Mycoplasmataceae were detected at high abundance in several uterine samples, the relationship between the uterine microbiota and serum metabolite concentrations was unclear. The fecal microbiota was stable regardless of the season, whereas bedding and airborne dust microbiota varied between summer and winter. With regards to uterine, bedding, and airborne dust microbiota, Enterobacteriaceae, Moraxellaceae, Staphylococcaceae, and Lactobacillaceae were more abundant during summer, and Ruminococcaceae, Lachnospiraceae, Bacteroidaceae, and Clostridiaceae were more abundant during winter. Canonical analysis of principal coordinates confirmed the relationship between uterine and cowshed microbiota. These results indicated that the uterine microbiota may vary when the microbiota in cowshed environments changes.
1. Introduction
The postpartum uterus of dairy cows has been shown to be contaminated with diverse bacterial species, including pathogens associated with uterine disease [1,2]. Although one-third to two-thirds of cows remain healthy, others may develop metritis and endometritis; this reduces their food intake and milk production ability and renders them less likely to become pregnant [3,4]. Escherichia coli, Trueperella pyogenes, Fusobacterium necrophorum, and Bacteroides spp. (e.g., Prevotella melaninogenica) are representative pathogens determined by isolation from the uteri of cows with postpartum uterine disease using the plate-culture method [1]. The understanding of these pathogens has been expanded by employing culture-independent microbiota analyses; several bacterial families, e.g., Porphyromonadaceae, Mycoplasmataceae, Bacteroidaceae, and Leptotrichiaceae, have been recently considered as pathogens associated with uterine disease [5,6,7].
Restoration of the cervix diameter and regeneration of the uterine epithelium requires three to four weeks [4,8,9]; hence, even in cows with no uterine disease, diverse bacterial species including anaerobes and facultative anaerobes can be detected after parturition. The bacteria contaminating the uteri of postpartum dairy cows are thus considered to originate from feces and the environment. However, data for microbiota in cows from dairy farm environments are limited, and evidence showing the relationship between uterine, fecal, and cowshed microbiota is lacking. Because both Trueperella spp. and Fusobacterium spp. can be found in the uteri of virgin heifers and pregnant cows [10,11], the belief that the pregnant uterus is sterile until contamination with the environmental bacteria at calving, and that metritis-causing bacteria gain access to the uterus when cows calve should be reconsidered. Regardless, factors affecting uterine microbiota need to be clarified to help prevent uterine disease, improve fertility, and ensure high milk production from the dairy cows.
In this study, a total of 98 samples of uterine mucus, feces, bedding, and airborne dust collected in a dairy farm were analyzed by high-throughput amplicon sequencing. The cows were managed by the free-stall housing system, and samples for microbiota assessment were collected during summer and winter when the cows were at one and two months postpartum. Blood samples were also collected to determine the serum levels of haptoglobin (Hp) and biochemical components. The objective was to characterize the uterine microbiota of postpartum dairy cows during different seasons, and examine if the uterine microbiota was related with the fecal, bedding, and airborne dust microbiota.
2. Materials and Methods
2.1. Sampling
A total of 98 samples were collected from cows at the Okayama Prefecture Livestock Research Institute (Okayama, Japan). The cows were housed in a free stall barn and fed total mixed ration silage, which was formulated to contain 500–600 g/kg of dry matter (DM), 160–180 g/kg DM of crude protein (N × 6.25), and 720–740 g/kg DM of total digestible nutrients. The sampling was performed from 6 June to 22 August and from 17 November to 2 March in 2018; hereafter, the former series is referred to as the sampling during summer and the latter, as the sampling during winter. No cows showed symptoms of dystocia and retained placenta, and no visible pus discharge was detected, by the external inspection of the perineum, around the sampling days.
Uterine mucus, blood, and feces samples were collected from nine cows during summer and from eight cows during winter, with two sampling times each at both one (31.0 ± 2.50 days in milk) and two (55.7 ± 5.12 days in milk) months after calving. Uterine and fecal sampling from cows at one and two months postpartum was conducted occasionally on the same day. Accordingly, samples of bedding and airborne dust were collected six times during summer and nine times during winter.
Uterine mucus was collected by using a cytobrush (Fujihira Industry Co. Ltd., Tokyo, Japan). The cow was restrained, the tail was held, and the perineum area, especially the vulva, was cleaned by wiping with 70% ethanol. The cytobrush instrument was covered with a sanitary plastic sheath and then inserted into the cervix. Inside the cervix, the plastic sheath was ruptured, and the instrument was further passed through the cervix toward the base of the larger horn, at which point the stainless-steel tube was retracted to expose the cytobrush. Uterine mucus was collected by rotating the cytobrush while in contact with the uterine wall [12]; then, the cytobrush was pulled back into the stainless-steel tube to avoid bacterial contamination from the vagina, vulva, and feces. The cytobrush was cut and placed into an Eppendorf tube and stored.
Fecal samples were collected from the rectum and blood samples were taken from the caudal vein. Airborne dust samples were collected by placing three petri dishes approximately 1.0 m above the ground for five minutes; they were then gathered into a tube using sterile physiological saline. Bedding samples were collected from three separate places in a cowshed. In the free stall system, cows could move and rest freely, and determining their resting place was difficult. Thus, a composite sample prepared from three separate samples was regarded as a representative means of assessing the bedding and airborne dust microbiota at the time of sampling. All the samples were kept on ice during their transportation to the laboratory and stored at −20 °C until further analyses. Procedures and protocols for the animal experiments were approved by the Animal Care and Use Committee (OKU-2016290), Okayama University, Japan.
2.2. Blood Analyses
The levels of serum albumin (Alb), urea nitrogen (BUN), total cholesterol (T-Cho), non-esterified fatty acids (NEFA), aspartate aminotransferase (AST), alanine aminotransferase (ALT), calcium (Ca), and phosphate were determined by using the respective commercial kits (FUJIFILM Wako Pure Chemicals Co., Tokyo, Japan). The concentration of serum haptoglobin (Hp) was determined by the quantitative sandwich enzyme-linked immunoassay technique using the bovine Hp ELISA kit (Life Diagnostics, Inc., West Chester, PA, USA). The intra- and inter-assay coefficients of variation for these determinations were <10% and <15%, respectively.
2.3. DNA Extraction
For uterine samples, the thawed cytobrush was soaked in 1 mL of sterile physiological saline for 30 min to release the uterine microbiota. Bacterial pellets were obtained by centrifugation at 16,000 g for 2 min, and then washed with 500 µL of solution I containing 0.05 M D-glucose, 0.025 M Tris-HCl (pH 8.0), and 0.01 M sodium EDTA (pH 8.0). After further centrifugation at 16,000 g for 2 min, the bacterial cells were lysed with 180 µL of lysozyme solution (20 g/L lysozyme, 0.02 M Tris-HCl [pH 8.0], 0.002 M sodium EDTA [pH 8.0], and 1.2 g/L Triton X-100) at 37 °C for 1 h. Airborne dust samples dissolved in sterile physiological saline were processed in the same way. Bacterial DNA was purified by using the DNeasy blood and tissue kit (Qiagen, Germantown, MD, USA), according to the manufacturer’s instructions. In case of the fecal and bedding samples, bacterial DNA was extracted following the procedure for the repeated bead beating plus column method [13] and purified using the mini DNeasy stool kit (Qiagen, Germantown, MD, USA).
2.4. Illumina MiSeq Sequencing
Bacterial DNA was amplified by two-step polymerase chain reaction (PCR) to generate amplicon libraries for next-generation sequencing. The primers targeting the V4 region of 16S ribosomal RNA (rRNA) genes (forward: 5′-ACACTCTTTCCCTACACGACGCTCTTCCGATCTGTGCCAGCMGCCGCGGTAA-3′; reverse: 5′-GTGACTGGAGTTCAGACGTGTGCTCTTCCGATCTGGACTACHVGGGTWTCTAAT-3′; tail sequences are underlined) [14] were used for the first round of PCR, with the following protocol: initial denaturation at 94 °C for 2 min, followed by 35 cycles of denaturation at 94 °C for 30 s, annealing at 50 °C for 30 s, elongation at 72 °C for 30 s, and an elongation step at 72 °C for 5 min. The PCR products were purified by electrophoretic separation on a 2.0% agarose gel using a Fast Gene Gel/PCR Extraction Kit (NIPPON Genetics Co., LTD., Tokyo, Japan). The second round of PCR, with adapter-attached primers, followed the protocol of initial denaturation at 94 °C for 2 min, 10 cycles of denaturation at 94 °C for 30 s, annealing at 59 °C for 30 s, elongation at 72 °C for 30 s, and an elongation step at 72 °C for 5 min. The second-round PCR products were purified in the same way as that in case of the first-round PCR products.
The purified amplicons were pair-end sequenced (2 × 250 bp) on an Illumina MiSeq platform at FASMAC Co., Ltd. (Kanagawa, Japan). Raw sequence data were analyzed using the Quantitative Insights Into Microbial Ecology (QIIME version 1.9.0). The 250-bp reads were truncated at any site receiving an average quality score under 20. Truncated reads that were shorter than 225 bp were discarded. In primer matching, sequences showing overlaps longer than 200 bp were assembled. The final reads obtained after pair-end joining were grouped into operational taxonomic units (OTUs) using a 97% similarity threshold. The sequence data were analyzed and categorized from the phylum to the family level using the default settings of the Ribosomal Database Project classifier. The results of the sequence analysis are available in the DDBJ Sequence Read Archive under project identification number PRJDB8863.
2.5. Statistical Analysis
Data for milk yield, blood metabolites, and the relative abundances of the major bacterial families (for families present at >1.0% in at least one sample) were subjected to the non-parametric Mann–Whitney U test to examine the effect of season and months after calving. Bacterial abundance data were also subjected to canonical analysis of principal coordinates (CAP) to define the assignment and clustering that explained variations in the microbiota. Discriminant vectors with a Pearson correlation >0.7 were considered significant. Two-way ANOVA and a t-test were performed using JMP (version 11; SAS Institute, Tokyo, Japan) and CAP was carried out using Primer version 7 with the Permanova+ add-on (Primer-E, Plymouth Marine Laboratory, Plymouth, UK).
3. Results
The parity of the cows examined during summer and winter were 2.0 ± 0.7 and 2.3 ± 1.3, respectively. Milk yield of the cows was 35–40 kg, and no differences were seen between two seasons and between one and two months after the calving (Table 1). The level of serum Alb was higher during summer than during winter. Numerical differences were also seen for the levels of serum NEFA (summer > winter), AST (summer < winter), and ALT (summer < winter). Likewise, the level of serum T-Cho was higher at two months than at one month postpartum.

Table 1.
Milk yield and blood metabolites concentration of dairy cows examined at one and two months postpartum during the two seasons.
The Illumina MiSeq sequencing revealed that the microbiota showed a huge taxonomic diversity, including 34 phyla and 213 families, of which 10 phyla and 41 families were shared among all samples (Figure 1). Firmicutes, Proteobacteria, and Bacteroidetes were the three major phyla, and accounted for >90% of the total abundance regardless of the sampling time. The abundance of Proteobacteria was higher and those of Firmicutes and Bacteroidetes were lower during summer than during winter.
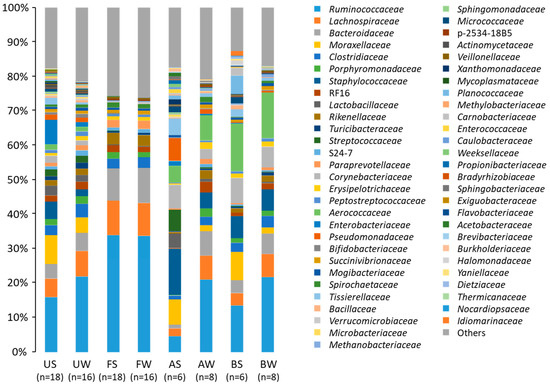
Figure 1.
Uterine, fecal, bedding, and airborne dust microbiota in the dairy farm examined during two seasons. AS, AW, BS, BW, FS, FW, US, and UW indicate airborne dust during summer, airborne dust during winter, bedding during summer, bedding during winter, feces during summer, feces during winter, uterine mucus during summer, and uterine mucus during winter, respectively.
Differences owing to sample collection at one and two months postpartum were not found in any families of the uterine microbiota (Table 2). The five most abundant taxa of the uterine microbiota during summer were Enterobacteriaceae (12.4%), Moraxellaceae (12.1%), Ruminococcaceae (11.0%), Staphylococcaceae (7.6%), and Lactobacillaceae (3.9%), and those during winter were Ruminococcaceae (22.3%), Lachnospiraceae (7.3%), Bacteroidaceae (5.5%), Moraxellaceae (4.5%), and Clostridiaceae (3.9%). Season-to-season differences were seen for these families; relative abundances of Enterobacteriaceae, Moraxellaceae, Staphylococcaceae, and Lactobacillaceae were greater and those of Ruminococcaceae, Lachnospiraceae, Bacteroidaceae, and Clostridiaceae were lower during summer than during winter. The abundances of Actinomycetaceae and Mycoplasmataceae were low, except that the abundance of Actinomycetaceae in one cow was 19.2%, and that of Mycoplasmataceae in another cow was 11.6% during summer. The relative abundance of Fusobacteriaceae was substantially low (0.00–0.43%) in the uterine samples in this study.
Table 2.
Relative abundance (%) of uterine microbiota of the dairy cows examined at one and two months postpartum during the two seasons.
The five most prevalent taxa of the fecal microbiota during summer were Ruminococcaceae (33.9%), Bacteroidaceae (11.3%), Lachnospiraceae (9.2%), Rikenellaceae (3.2%), and Clostridiaceae (3.2%), and those during winter were Ruminococcaceae (34.5%), Lachnospiraceae (10.1%), Bacteroidaceae (9.2%), Rikenellaceae (3.4%), and Clostridiaceae (3.0%) (Table 3). Differences due to season were not observed for the five most prevalent taxa. The relative abundance of Mycoplasmataceae was 0.01% and those of Actinomycetaceae and Fusobacteriaceae were both <0.005% in the fecal microbiota.
Table 3.
Relative abundance (%) of fecal microbiota of the dairy cows examined at one and two months postpartum during the two seasons.
The five most abundant taxa of the bedding microbiota during summer were Aerococcaceae (13.8%), Ruminococcaceae (10.8%), Moraxellaceae (8.3%), Corynebacteriaceae (7.3%), and Staphylococcaceae (6.6%), and those during winter were Ruminococcaceae (17.0%), Aerococcaceae (13.3%), Lachnospiraceae (6.6%), Staphylococcaceae (6.3%), and Corynebacteriaceae (6.0%) (Table 4). The relative abundance of Moraxellaceae was higher during summer than during winter, and the abundances of Ruminococcaceae and Lachnospiraceae were lower during summer than during winter. The abundances of Actinomycetaceae (0.17%), Fusobacteriaceae (0.02%), and Mycoplasmataceae (0.02%) were low in the bedding microbiota.
Table 4.
Relative abundance (%) of bedding microbiota of the dairy farm cowshed examined at two seasons.
The five most abundant taxa of the airborne dust microbiota during summer were Staphylococcaceae (13.4%), Moraxellaceae (7.2%), Corynebacteriaceae (7.0%), Pseudomonadaceae (6.7%), and Streptococcaceae (6.1%), and those during winter were Ruminococcaceae (17.4%), Aerococcaceae (7.3%), Bacteroidaceae (7.1%), Lachnospiraceae (6.8%), and Staphylococcaceae (4.7%) (Table 5). Season-to-season differences were found for the relative abundances of these families, except for Aerococcaceae. The abundances of Actinomycetaceae (0.20%), Fusobacteriaceae (0.12%), and Mycoplasmataceae (0.02%) were also low in the airborne dust microbiota.
Table 5.
Relative abundance (%) of air-borne dust microbiota of the dairy farm cowshed examined at two seasons.
Based on the CAP analysis, during summer, the uterine microbiota was grouped with the airborne dust microbiota, whereas bedding and fecal microbiota formed two other (separate) groups (Figure 2). During winter, most of the uterine microbiota was grouped with the airborne dust and bedding microbiota, whereas some of the uterine microbiota formed the same group with the fecal microbiota.
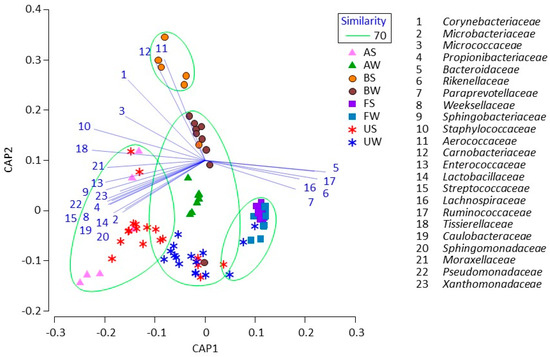
Figure 2.
Canonical analysis of principal coordinates plot characterizing the uterine, fecal, bedding, and airborne dust microbiota in the dairy farm. Samples enclosed in a green circle are regarded to be in the same group at a 70% similarity level. Lines indicate discriminant vectors, with a Pearson correlation > 0.7, and the bacterial families in the groupings.
4. Discussion
It has been demonstrated that the level of blood metabolites can help describe postpartum uterine health and the resumption of postpartum cyclicity. Cows with high milk-producing ability may face a severe negative energy balance after calving, and cows with uterine disease may show lower levels of serum Alb, T-Cho, and Ca, and higher levels of serum NEFA, BUN, and AST [15,16,17]. In this study, although the results revealed that the cows showed lower serum Alb and higher serum ALT levels, suggesting a greater risk of uterine disease during winter, they may have had an appropriate protein-energy balance during both seasons, because the level of serum T-Cho was sufficiently high and those of serum BUN and NEFA were acceptably low. The finding that there were no differences between samples collected during different seasons in terms of the serum concentrations of Hp, an acute-phase protein that reflects the severity of inflammatory responses, including metritis [18,19,20], also could support this.
In this study, 24 out of 34 cow samples showed a baseline level (<20 μg/L) of serum Hp. Four out of 10 other samples showed a high Hp level, at >130 μg/L, which was indicated as an upper cut-off value to differentiate between healthy and metritis-affected cows [18]. Regardless, the cows with elevated Hp concentration were indicated to have a normal liver function, i.e., their serum AST and ALT levels were similar to those of others. Likewise, the cows with high Hp levels apparently showed normal uterine microbiota, i.e., low abundances of typical pathogens such as members of Actinomycetaceae, Fusobacteriaceae, and Mycoplasmataceae.
In the uterine microbiota examined in this study, Firmicutes was the most abundant phylum, followed by Proteobacteria and Bacteroidetes. Machado et al. [6] and Wang et al. [21] also found that Firmicutes was the most abundant phylum, showing abundances of 52.3 and 76.7%, respectively, in the uterine microbiota of healthy cows at around one month postpartum. The predominant taxa of Firmicutes in the healthy uterine microbiota, however, is yet to be defined; Geobacillus spp. (Bacillaceae, Machado et al. [6]), Lactococcus spp. (Streptococcaceae, Wang et al. [21]), and Ruminococcaceae [7] were reported as the most abundant components of healthy uterine microbiota.
Santos et al. [5] and Wang et al. [21] reported that Proteobacteria was the most abundant phylum in the uterine microbiota of healthy cows; however, in this study, Proteobacteria was the second and third most abundant phylum in the samples obtained during summer and winter, respectively. The predominant taxa of Proteobacteria in the healthy uterine microbiota are also unclear; Santos et al. [5] have indicated Pasteurella spp., and Bicalho et al. [22] have demonstrated Escherichia spp. (Enterobacteriaceae), Shigella spp. (Enterobacteriaceae), and Pseudomonas spp. (Pseudomonadaceae) as the major taxa of Proteobacteria. Our results stated that Enterobacteriaceae and Moraxellaceae were the two major taxa, which is, in part, similar to the results of the study by Bicalho et al. [22].
The abundance of Bacteroidetes, particularly with regards to the families Bacteroidaceae and Porphyromonadaceae, has been shown to increase in cows with metritis [6,22]. Meanwhile, the standard prevalence of Bacteroidetes among the healthy uterine microbiota is yet to be defined. Machado et al. [6] found an increase in the abundance of Bacteroidetes from 12.7% in cows without metritis to 18.9% in those with metritis, whereas Bicalho et al. [22] reported an increase in the abundance of Bacteroidetes from 20% in healthy cows to 29% in cows showing purulent vaginal discharge. The relative abundance of Bacteroidetes in samples obtained during winter (about 20%) in this study could be regarded as both a healthy- and metritis-level abundance. Greater abundance of Bacteroidetes during winter was probably because of the greater abundance of this phylum in airborne dust and bedding microbiota during this season.
Even in healthy cows, Fusobacteria have been found as a prevalent phylum at one week, and have shown >5% abundance at one month after calving [5,6]. In this study, in all uterine samples, Fusobacteria showed a relative abundance of <0.5%, and thus, the data are not shown in Table 2. At two months postpartum during summer, Moraxellaceae was found as the most abundant family in the uterine microbiota. Although members of Acinetobacter, a genus belonging to the family Moraxellaceae, have been reported to be associated with sub-clinical endometritis [21] and repeat breeder [23], Acinetobacter spp. can be found in diverse environments and their pathogenicity is regarded to be low. Similar to the finding for Bacteroidetes, differences in the prevalence of Moraxellaceae at different sampling times could be due to the different abundances of this family in the bedding and airborne dust microbiota during the two seasons.
The average abundance of Actinomycetaceae was 2.3% in cows at two months postpartum during summer, because one cow showed an extremely high abundance (19.4%) of this family compared with the other cows (<0.4%). Likewise, the same cow showed a substantially high abundance (3.1%) of Actinomycetaceae at one month postpartum. Even in cows with metritis, the prevalence of T. pyogenes in the uterine microbiota was as high as 5% at one month postpartum [6,22,24]. The cow with a high abundance of Actinomycetaceae may have had uterine infection; however, the levels of serum Hp and other metabolites were normal in this cow.
One cow showed a high abundance (11.6%) of Mycoplasmataceae at one month postpartum during summer, and thus, the average abundance value of this family became 1.3%. Although members of Mycoplasmataceae, particularly Ureaplasma spp., have been considered as metritis-associated pathogens [6,7], a greater abundance (13%) of this family has been detected in healthy cows [7] than was detected in our study, and serum metabolite levels in these cows were normal.
Although researchers have recognized the importance of cowshed microbiota, studies reporting the microbiota in airborne dust on dairy farms are limited. Dutkiewicz et al. [25] examined cowshed microbiota by plate culture and isolated several species, including those belonging to the families Micrococcaceae, Staphylococcaceae, Bacillaceae, Corynebacteriaceae, Microbacteriaceae, Streptomycetaceae, Moraxellaceae, Enterobacteriaceae, and Pseudomonadaceae. However, Bacillaceae, Microbacteriaceae, and Streptomycetaceae were not detected at >1.0% in this study. Likewise, Tsapko et al. [26] found that the genera Staphylococcus (Staphylococcaceae), Streptococcus (Streptococcaceae), Escherichia (Enterobacteriaceae), Klebsiella (Enterobacteriaceae), Pseudomonas (Pseudomonadaceae), Citrobacter (Enterobacteriaceae), and Acinetobacter (Moraxellaceae) were increased in the spring/summer period, which was agreement with our results showing that the relative abundances of these families were greater during the summer than during the winter. However, their studies were aimed to evaluate the potentially harmful effects on the health of exposed workers; hence, it is difficult to interpret their results in relation to the effects on the health of exposed animals.
The CAP analysis clarified that uterine microbiota was related with fecal, bedding, and airborne dust microbiota, and that their relationships may vary between seasons. According to the conventional statistics (Mann–Whitney U test), the fecal microbiota was shown to be stable regardless of the season, whereas uterine, bedding, and airborne dust microbiota were shown to be different in the two seasons. Thus, the conventional statistics did not suggest a significant association between the uterine and fecal microbiota. Meanwhile, the CAP analysis clearly demonstrated the relationship between uterine, bedding, and airborne dust microbiota. During summer, the dairy farm used fans with a mist of water to cool the bodies of the cows; hence, this enforcing ventilation may have caused a difference in the association between the uterine, bedding, and airborne dust microbiota during the two seasons.
5. Conclusions
This study indicated the importance of microbiota in cowshed environments in understanding the postpartum uterine microbiota of dairy cows, which might help account for differences between the bacterial taxa among healthy uterine microbiota in previously published studies. Although airborne dust and bedding microbiota can be associated with uterine microbiota, the abundances of Actinomycetaceae (0.07–0.45% for airborne dust and 0.03–0.38% for bedding), Fusobacteriaceae (0.00–0.42% for airborne dust and 0.00–0.08% for bedding), and Mycoplasmataceae (0.00–0.07% for airborne dust and 0.00–0.06% for bedding) in the cowshed were too low to exert large variations of the uterine microbiota. Further research is necessary to understand the complex interactions within and between uterine and cowshed environment microbiota, and differences between the susceptibilities of cows housed in the same environment to uterine infection.
Author Contributions
Conceptualization, T.T.N., T.T.M.T., and N.N.; methodology, T.T.N., T.T.M.T., A.M., and N.N.; software, T.T.N. and N.N.; validation, T.T. and N.N.; formal analysis, T.T.N.; investigation, T.T.N. and A.M.; resources, N.N.; data curation, T.T. and N.N.; writing—original draft preparation, T.T.N.; writing—review and editing, N.N.; visualization, T.T.N.; supervision, T.T. and N.N.; project administration, N.N.; funding acquisition, N.N.
Funding
This study was financially supported in part by JSPS KAKENHI Grant Number JP19H0310611.
Conflicts of Interest
The authors declare no conflict of interest. The funders had no role in the design of the study; in the collection, analyses, or interpretation of data; in the writing of the manuscript, or in the decision to publish the results.
References
- Sheldon, I.M.; Lewis, G.; LeBlanc, S.; Gilbert, R. Defining postpartum uterine disease in dairy cattle. Theriogenology 2006, 65, 1516–1530. [Google Scholar] [CrossRef] [PubMed]
- Ghanem, M.E.; Tezuka, E.; Devkota, B.; Izaike, Y.; Osawa, T. Persistence of uterine bacterial infection, and its associations with endometritis and ovarian function in postpartum dairy cows. J. Reprod. Dev. 2015, 61, 54–60. [Google Scholar] [CrossRef] [PubMed]
- Lewis, G.S. Uterine health and disorders. J. Dairy Sci. 1997, 80, 984–994. [Google Scholar] [CrossRef]
- LeBlanc, S.J.; Duffield, T.F.; Leslie, K.E.; Bateman, K.G.; Keefe, G.P.; Walton, J.S.; Johnson, W.H. Defining and diagnosing postpartum clinical endometritis and its impact on reproductive performance in dairy cows. J. Dairy Sci. 2002, 85, 2223–2236. [Google Scholar] [CrossRef]
- Santos, T.M.; Gilbert, R.O.; Bicalho, R.C. Metagenomic analysis of the uterine bacterial microbiota in healthy and metritic postpartum dairy cows. J. Dairy Sci. 2011, 94, 291–302. [Google Scholar] [CrossRef] [PubMed]
- Machado, V.S.; Oikonomou, G.; Bicalho, M.L.; Knauer, W.A.; Gilbert, R.; Bicalho, R.C. Investigation of postpartum dairy cows’ uterine microbial diversity using metagenomic pyrosequencing of the 16S rRNA gene. Vet. Microbiol. 2012, 159, 460–469. [Google Scholar] [CrossRef]
- Knudsen, L.R.; Karstrup, C.C.; Pedersen, H.G.; Angen, Ø.; Agerholm, J.S.; Rasmussen, E.L.; Jensen, T.K.; Klitgaard, K. An investigation of the microbiota in uterine flush samples and endometrial biopsies from dairy cows during the first 7 weeks postpartum. Theriogenology 2016, 86, 642–650. [Google Scholar] [CrossRef]
- Sheldon, I.M.; Williams, E.J.; Miller, A.N.A.; Nash, D.M.; Herath, S. Uterine diseases in cattle after parturition. Vet. J. 2008, 176, 115–121. [Google Scholar] [CrossRef]
- Gautam, G.; Nakao, T.; Yusuf, M.; Koike, K. Prevalence of endometritis during the postpartum period and its impact on subsequent reproductive performance in two Japanese dairy herds. Anim. Reprod. Sci. 2009, 116, 175–187. [Google Scholar] [CrossRef]
- Moore, S.G.; Ericsson, A.C.; Poock, S.E.; Melendez, P.; Lucy, M.C. 16S rRNA gene sequencing reveals the microbiome of the virgin and pregnant bovine uterus. J. Dairy Sci. 2017, 100, 4953–4960. [Google Scholar] [CrossRef]
- Karstrup, C.C.; Klitgaard, K.; Jensen, T.K.; Agerholm, J.S.; Pedersen, H.G. Presence of bacteria in the endometrium and placentomes of pregnant cows. Theriogenology 2017, 99, 41–47. [Google Scholar] [CrossRef] [PubMed]
- Jeon, S.J.; Vieira-Neto, A.; Gobikrushanth, M.; Daetz, R.; Mingoti, R.D.; Parize, A.C.; de Freitas, S.L.; da Costa, A.N.; Bicalho, R.C.; Lima, S.; et al. Uterine microbiota progression from calving until establishment of metritis in dairy cows. Appl. Environ. Microbiol. 2015, 81, 6324–6332. [Google Scholar] [CrossRef] [PubMed]
- Yu, Z.; Morrison, M. Improved extraction of PCR-quality community DNA from digesta and fecal samples. Biotechniques 2004, 36, 808–812. [Google Scholar] [CrossRef] [PubMed]
- Tang, M.T.; Han, H.; Yu, Z.; Tsuruta, T.; Nishino, N. Variability, stability, and resilience of fecal microbiota in dairy cows fed whole crop corn silage. Appl. Microbiol. Biotechnol. 2017, 101, 6355–6364. [Google Scholar] [CrossRef]
- LeBlanc, S.J.; Osawa, T.; Dubuc, J. Reproductive tract defense and disease in postpartum dairy cows. Theriogenology 2011, 76, 1610–1618. [Google Scholar] [CrossRef]
- Shin, D.H.; Jeong, J.K.; Choi, I.S.; Moon, S.H.; Lee, S.C.; Kang, H.G.; Park, S.B.; Kim, I.H. Associations between serum haptoglobin concentration and peri- and postpartum disorders, milk yield, and reproductive performance in dairy cows. Livest. Sci. 2018, 213, 14–18. [Google Scholar] [CrossRef]
- Kawashima, C.; Suwanai, M.; Honda, T.; Teramura, M.; Kida, K.; Hanada, M.; Miyamoto, A.; Matsui, M. Relationship of vaginal discharge characteristics evaluated by Metricheck device to metabolic status in postpartum dairy cows. Reprod. Dom. Anim. 2018, 53, 1396–1404. [Google Scholar] [CrossRef]
- Chan, J.P.W.; Chang, C.C.; Hsu, W.H.; Liu, W.B.; Chen, T.H. Association of increased serum acute-phase protein concentrations with reproductive performance in dairy cows with postpartum metritis. Vet. Clin. Pathol. 2010, 39, 72–78. [Google Scholar] [CrossRef]
- Nightingale, C.R.; Sellers, M.D.; Ballou, M.A. Elevated plasma haptoglobin concentrations following parturition are associated with elevated leukocyte responses and decreased subsequent reproductive efficiency in multiparous Holstein dairy cows. Vet. Immunol. Immunopathol. 2015, 164, 16–23. [Google Scholar] [CrossRef]
- Pohl, A.; Burfeind, O.; Heuwieser, W. The associations between postpartum serum haptoglobin concentration and metabolic status, calving difficulties, retained fetal membranes, and metritis. J. Dairy Sci. 2015, 98, 4544–4551. [Google Scholar] [CrossRef]
- Wang, M.L.; Liu, M.C.; Xu, J.; An, L.G.; Wang, J.F.; Zhu, Y.H. Uterine microbiota of dairy cows with clinical and subclinical. Front. Microbiol. 2018, 9, 2691. [Google Scholar] [CrossRef] [PubMed]
- Bicalho, M.L.S.; Lima, S.; Higgins, C.H.; Machado, V.S.; Lima, F.S.; Bicalho, R.C. Genetic and functional analysis of the bovine uterine microbiota. Part I: Metritis versus healthy cows. J. Dairy Sci. 2017, 100, 3850–3862. [Google Scholar] [CrossRef] [PubMed]
- Pothmann, H.; Prunner, I.; Wagener, K.; Jaureguiberry, M.; de la Sota, R.L.; Erber, R.; Aurich, C.; Ehling-Schulz, M.; Drillich, M. The prevalence of subclinical endometritis and intrauterine infections in repeat breeder cows. Theriogenology 2015, 83, 1249–1253. [Google Scholar] [CrossRef] [PubMed]
- Wagener, K.; Prunner, I.; Pothmann, H.; Drillich, M.; Ehling-Schulz, M. Diversity and health status specific fluctuations of intrauterine microbial communities in postpartum dairy cows. Vet. Microbiol. 2015, 175, 286–293. [Google Scholar] [CrossRef] [PubMed]
- Dutkiewicz, J.; Pomorski, Z.J.H.; Sitkowska, J.; Krysinska-Traczyk, E.; Skorska, C.; Prazmo, Z.; Cholewa, G.; Wojtowicz, H. Airborne microorganisms and endotoxicin in animal houses. Grana 1994, 33, 85–90. [Google Scholar] [CrossRef]
- Tsapko, V.G.; Chudnovets, A.J.; Sterenbogen, M.J.; Papach, V.V.; Dutkiewicz, J.; Skorska, C.; Krysinska-Traczyk, E.; Golec, M. Exposure to bioaerosols in the selected agricultural facilities of the Ukraine and Poland–A review. Ann. Agric. Environ. Med. 2011, 18, 19–27. [Google Scholar] [PubMed]


© 2019 by the authors. Licensee MDPI, Basel, Switzerland. This article is an open access article distributed under the terms and conditions of the Creative Commons Attribution (CC BY) license (http://creativecommons.org/licenses/by/4.0/).