Characterization of the Normal Portal and Hepatic Blood Flow of Adult Holstein-Friesian Cows

 ,
,  ,
, 
Abstract
Simple summary
Abstract
1. Introduction
2. Materials and Methods
2.1. Animals
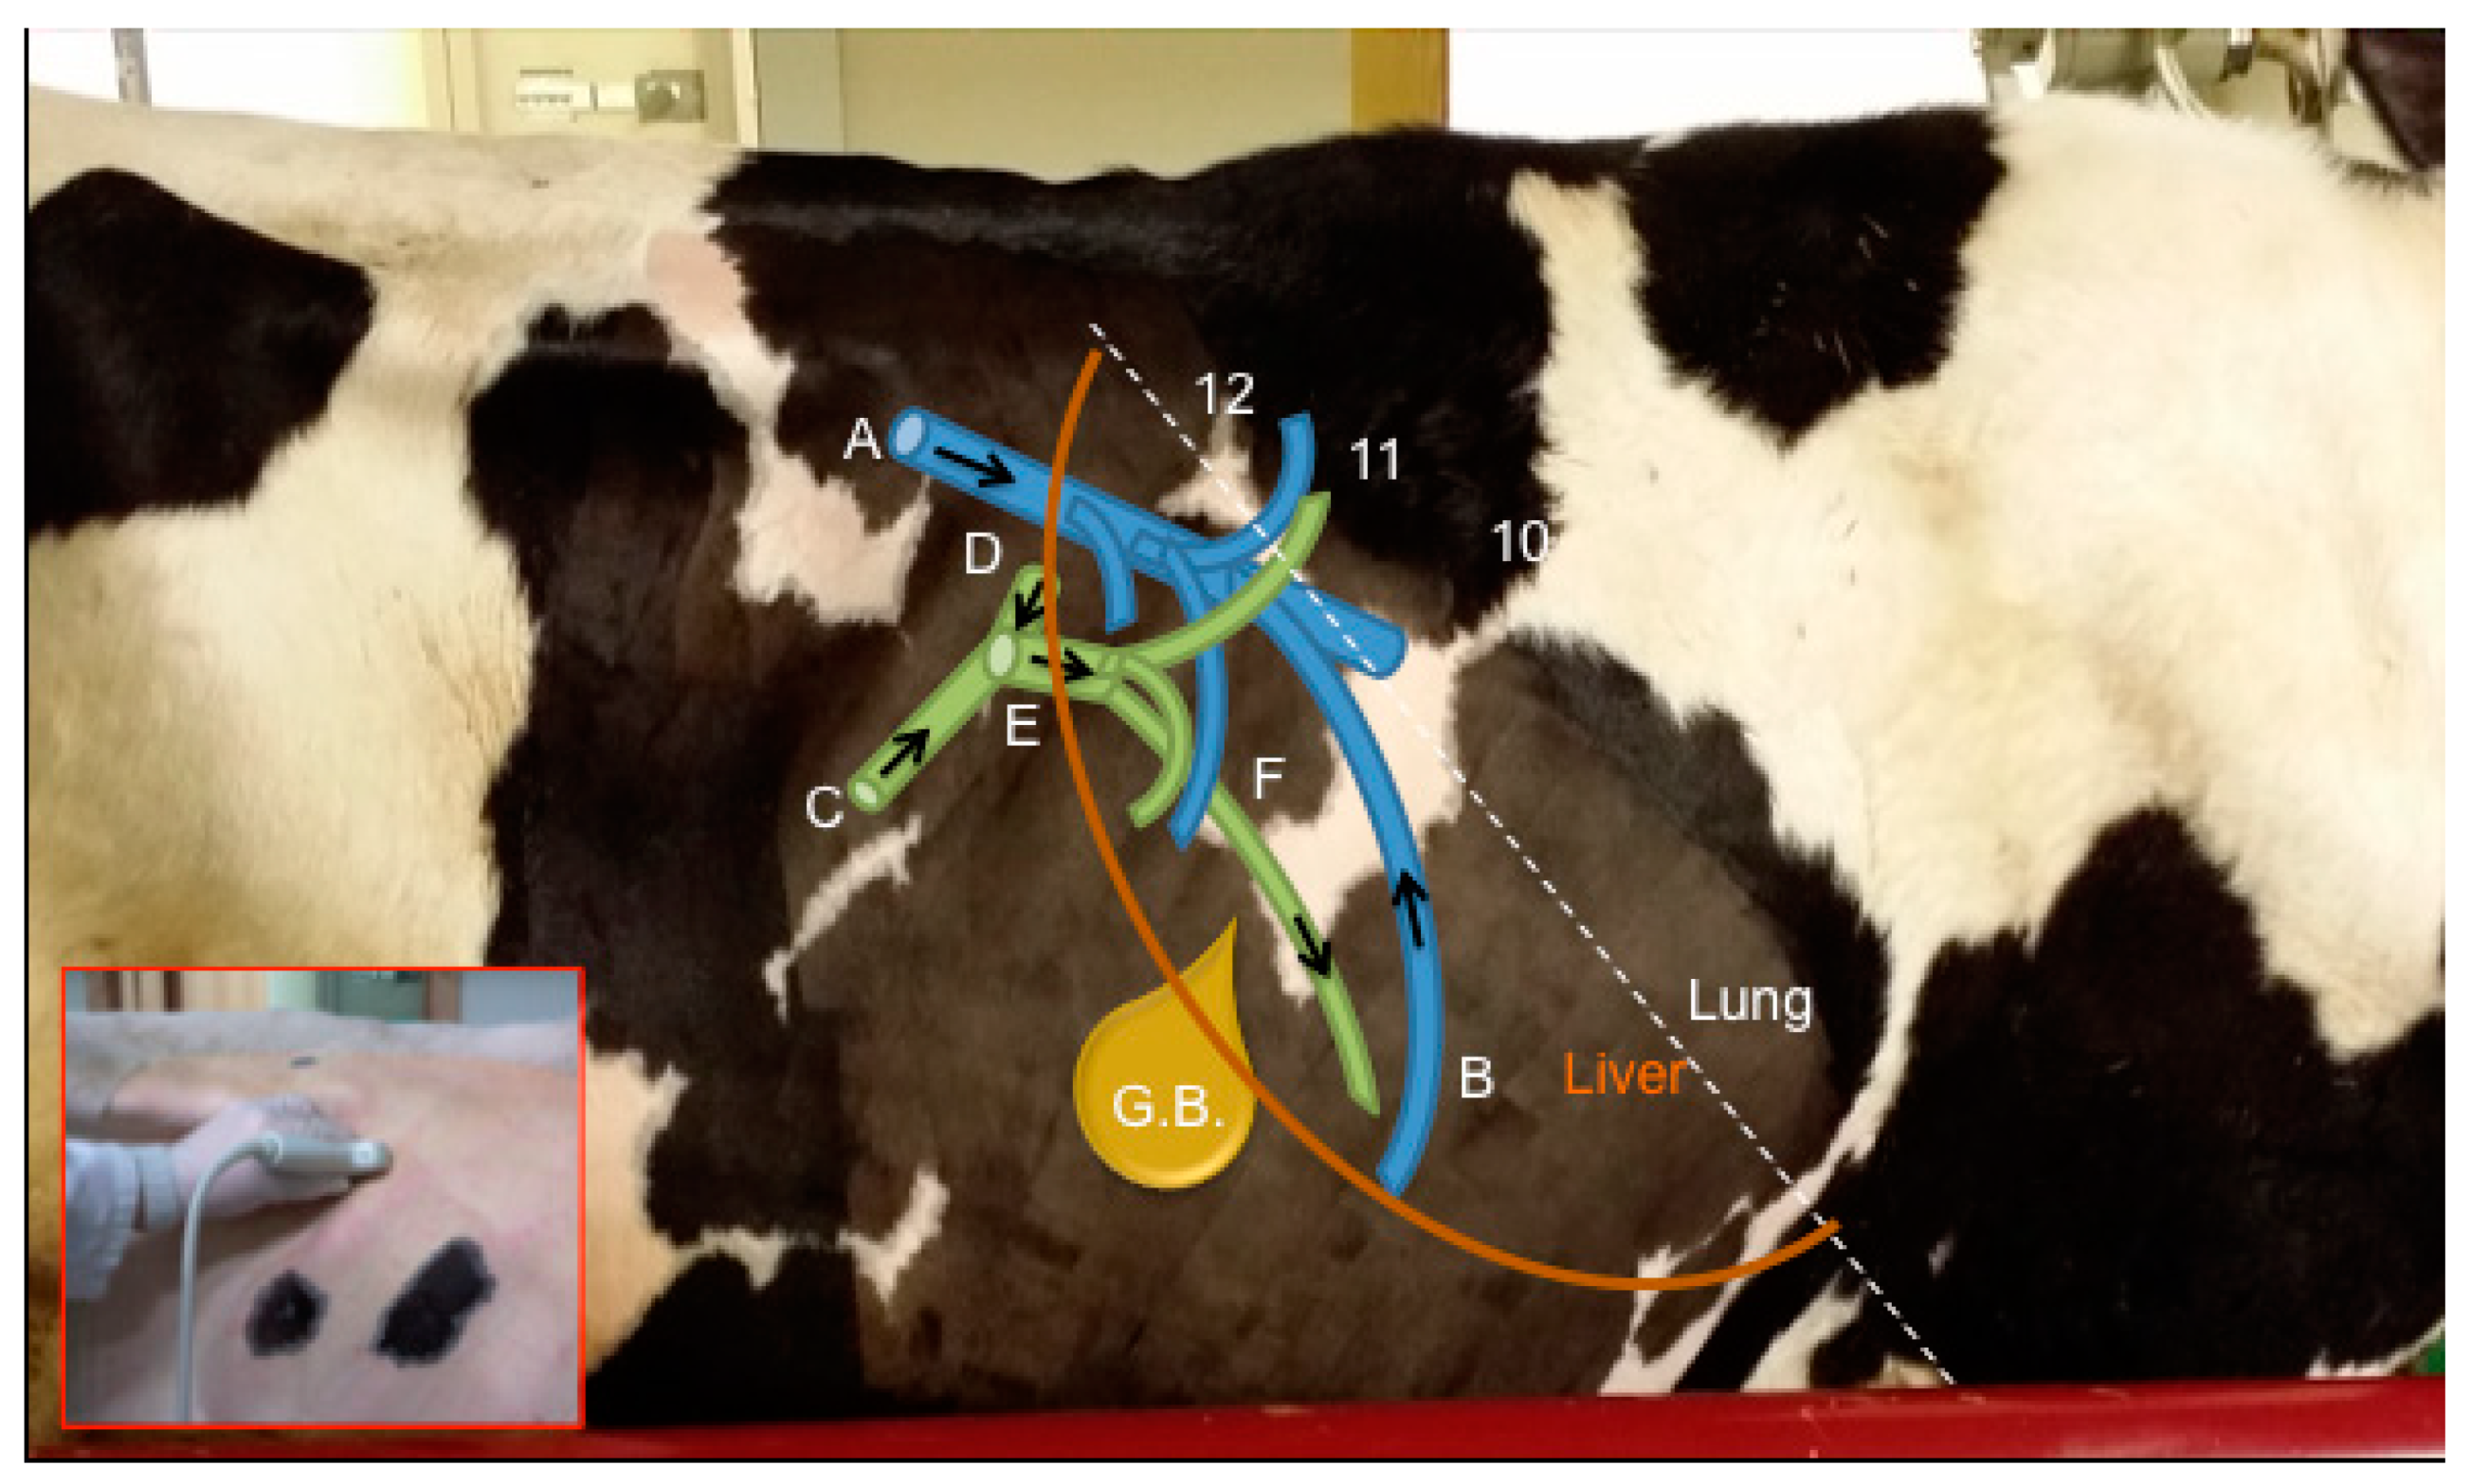
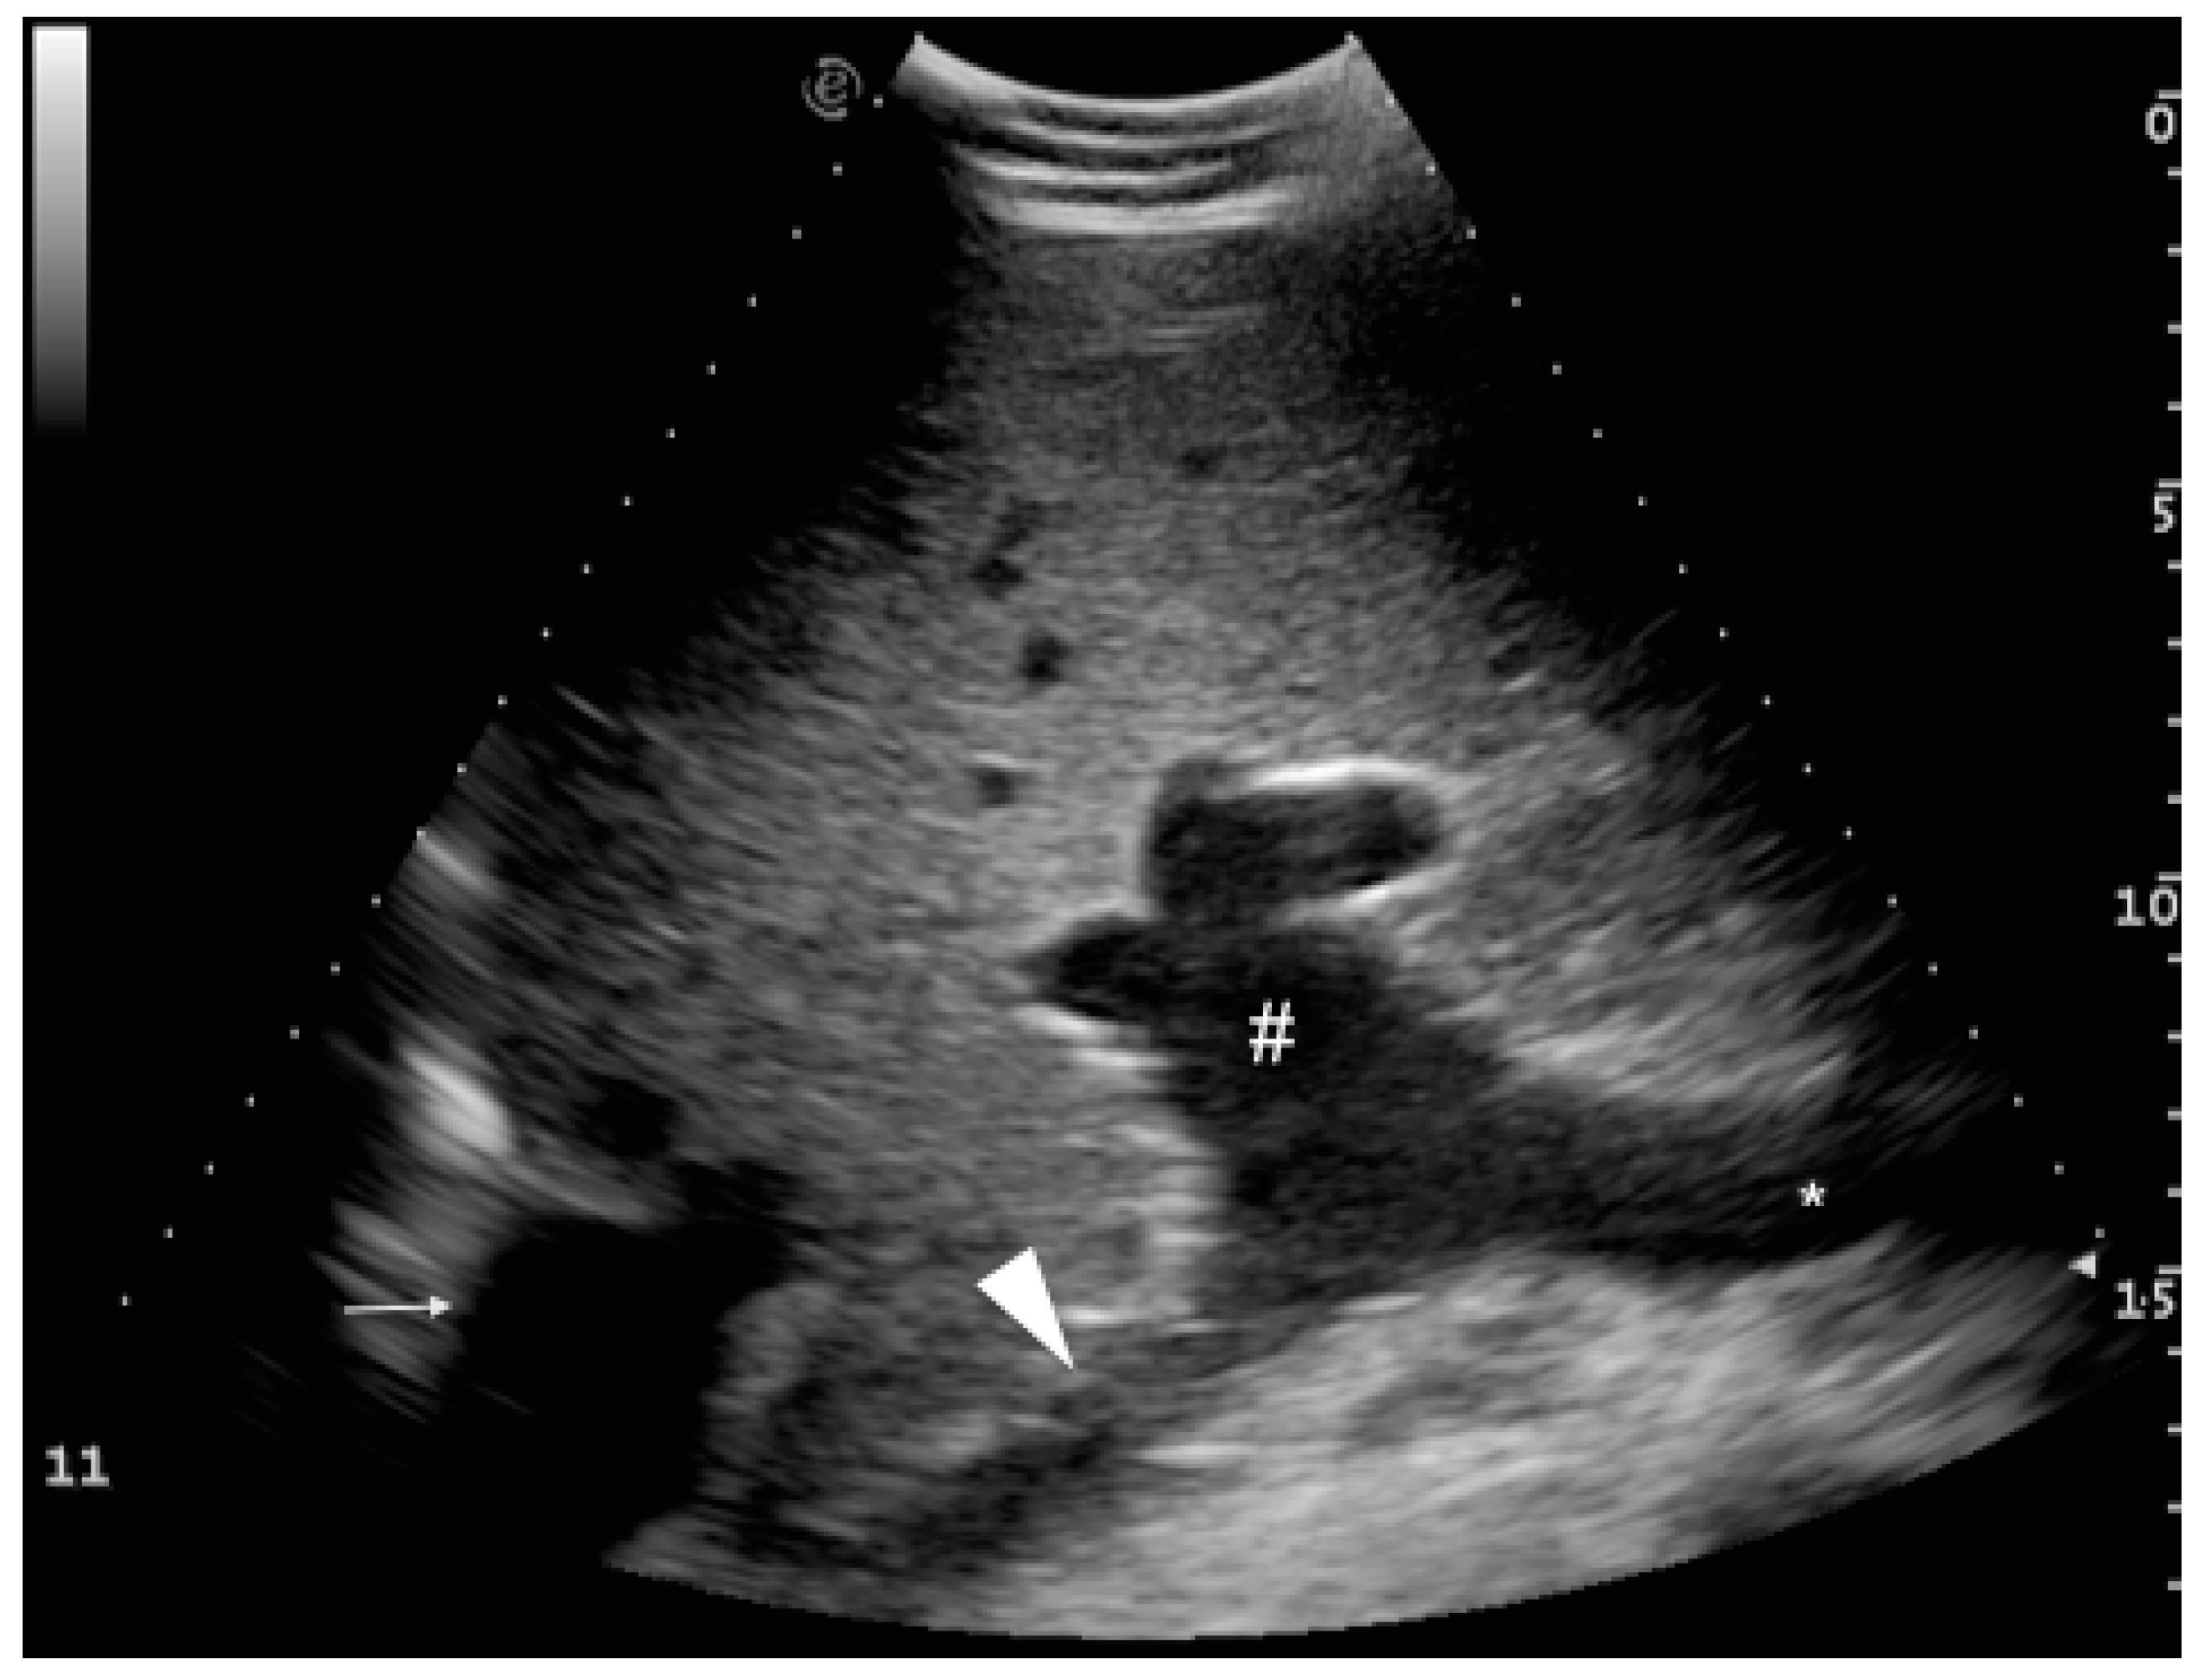
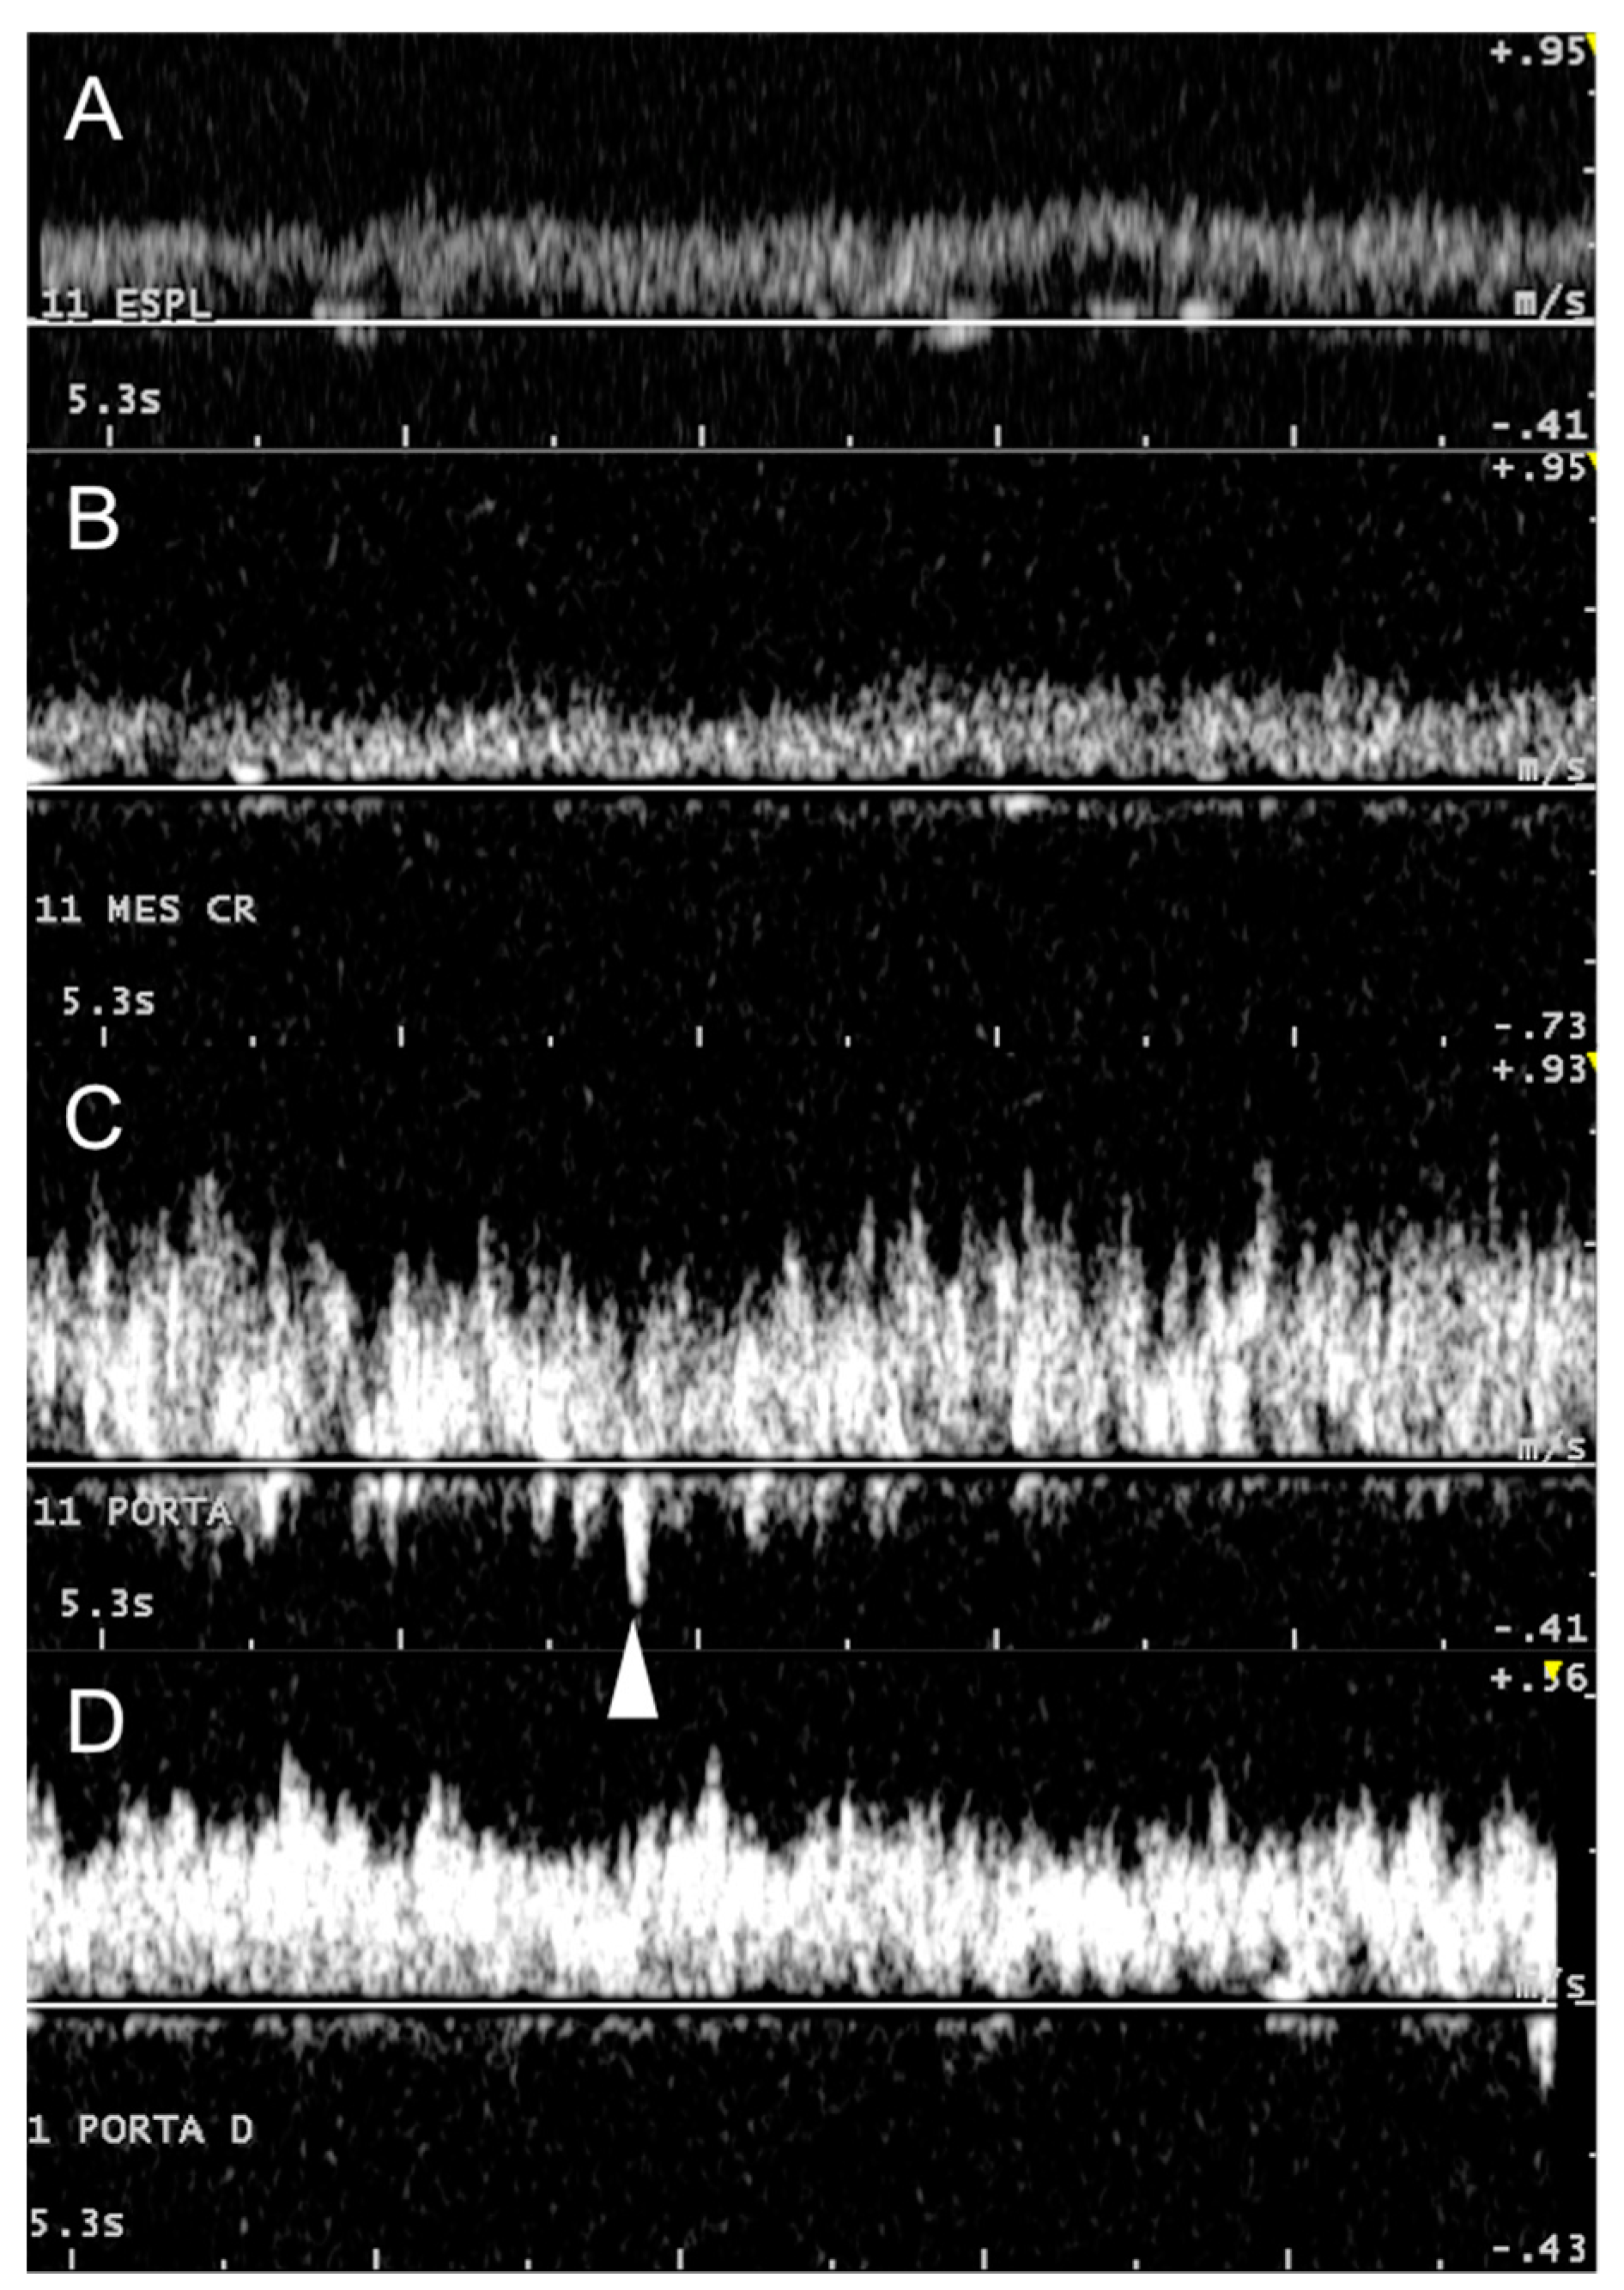
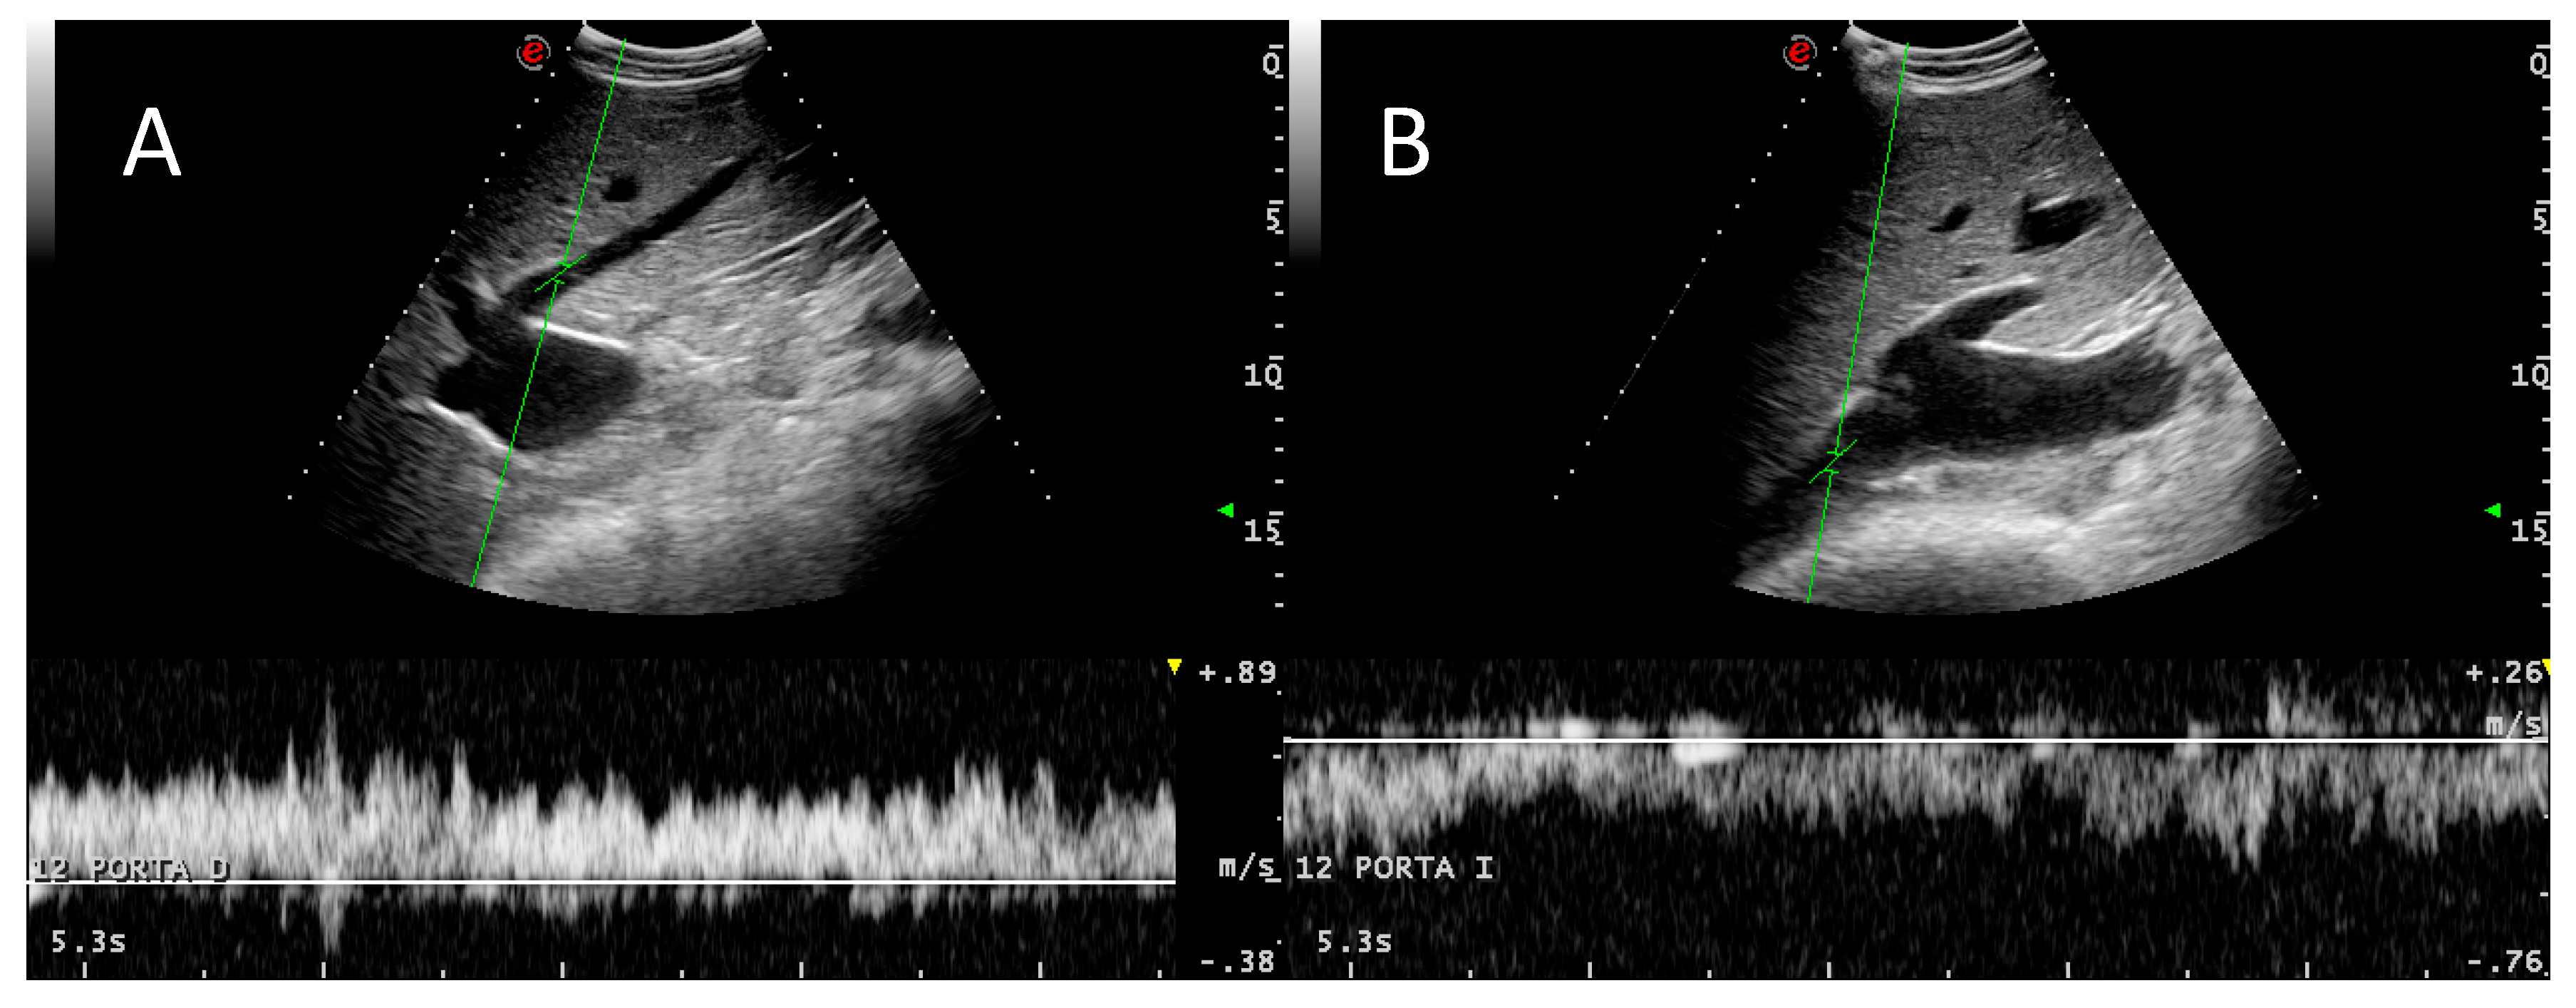
2.2. B-Mode and Color Doppler Ultrasonography
2.3. Statistical Analysis
3. Results and Discussion
3.1. General
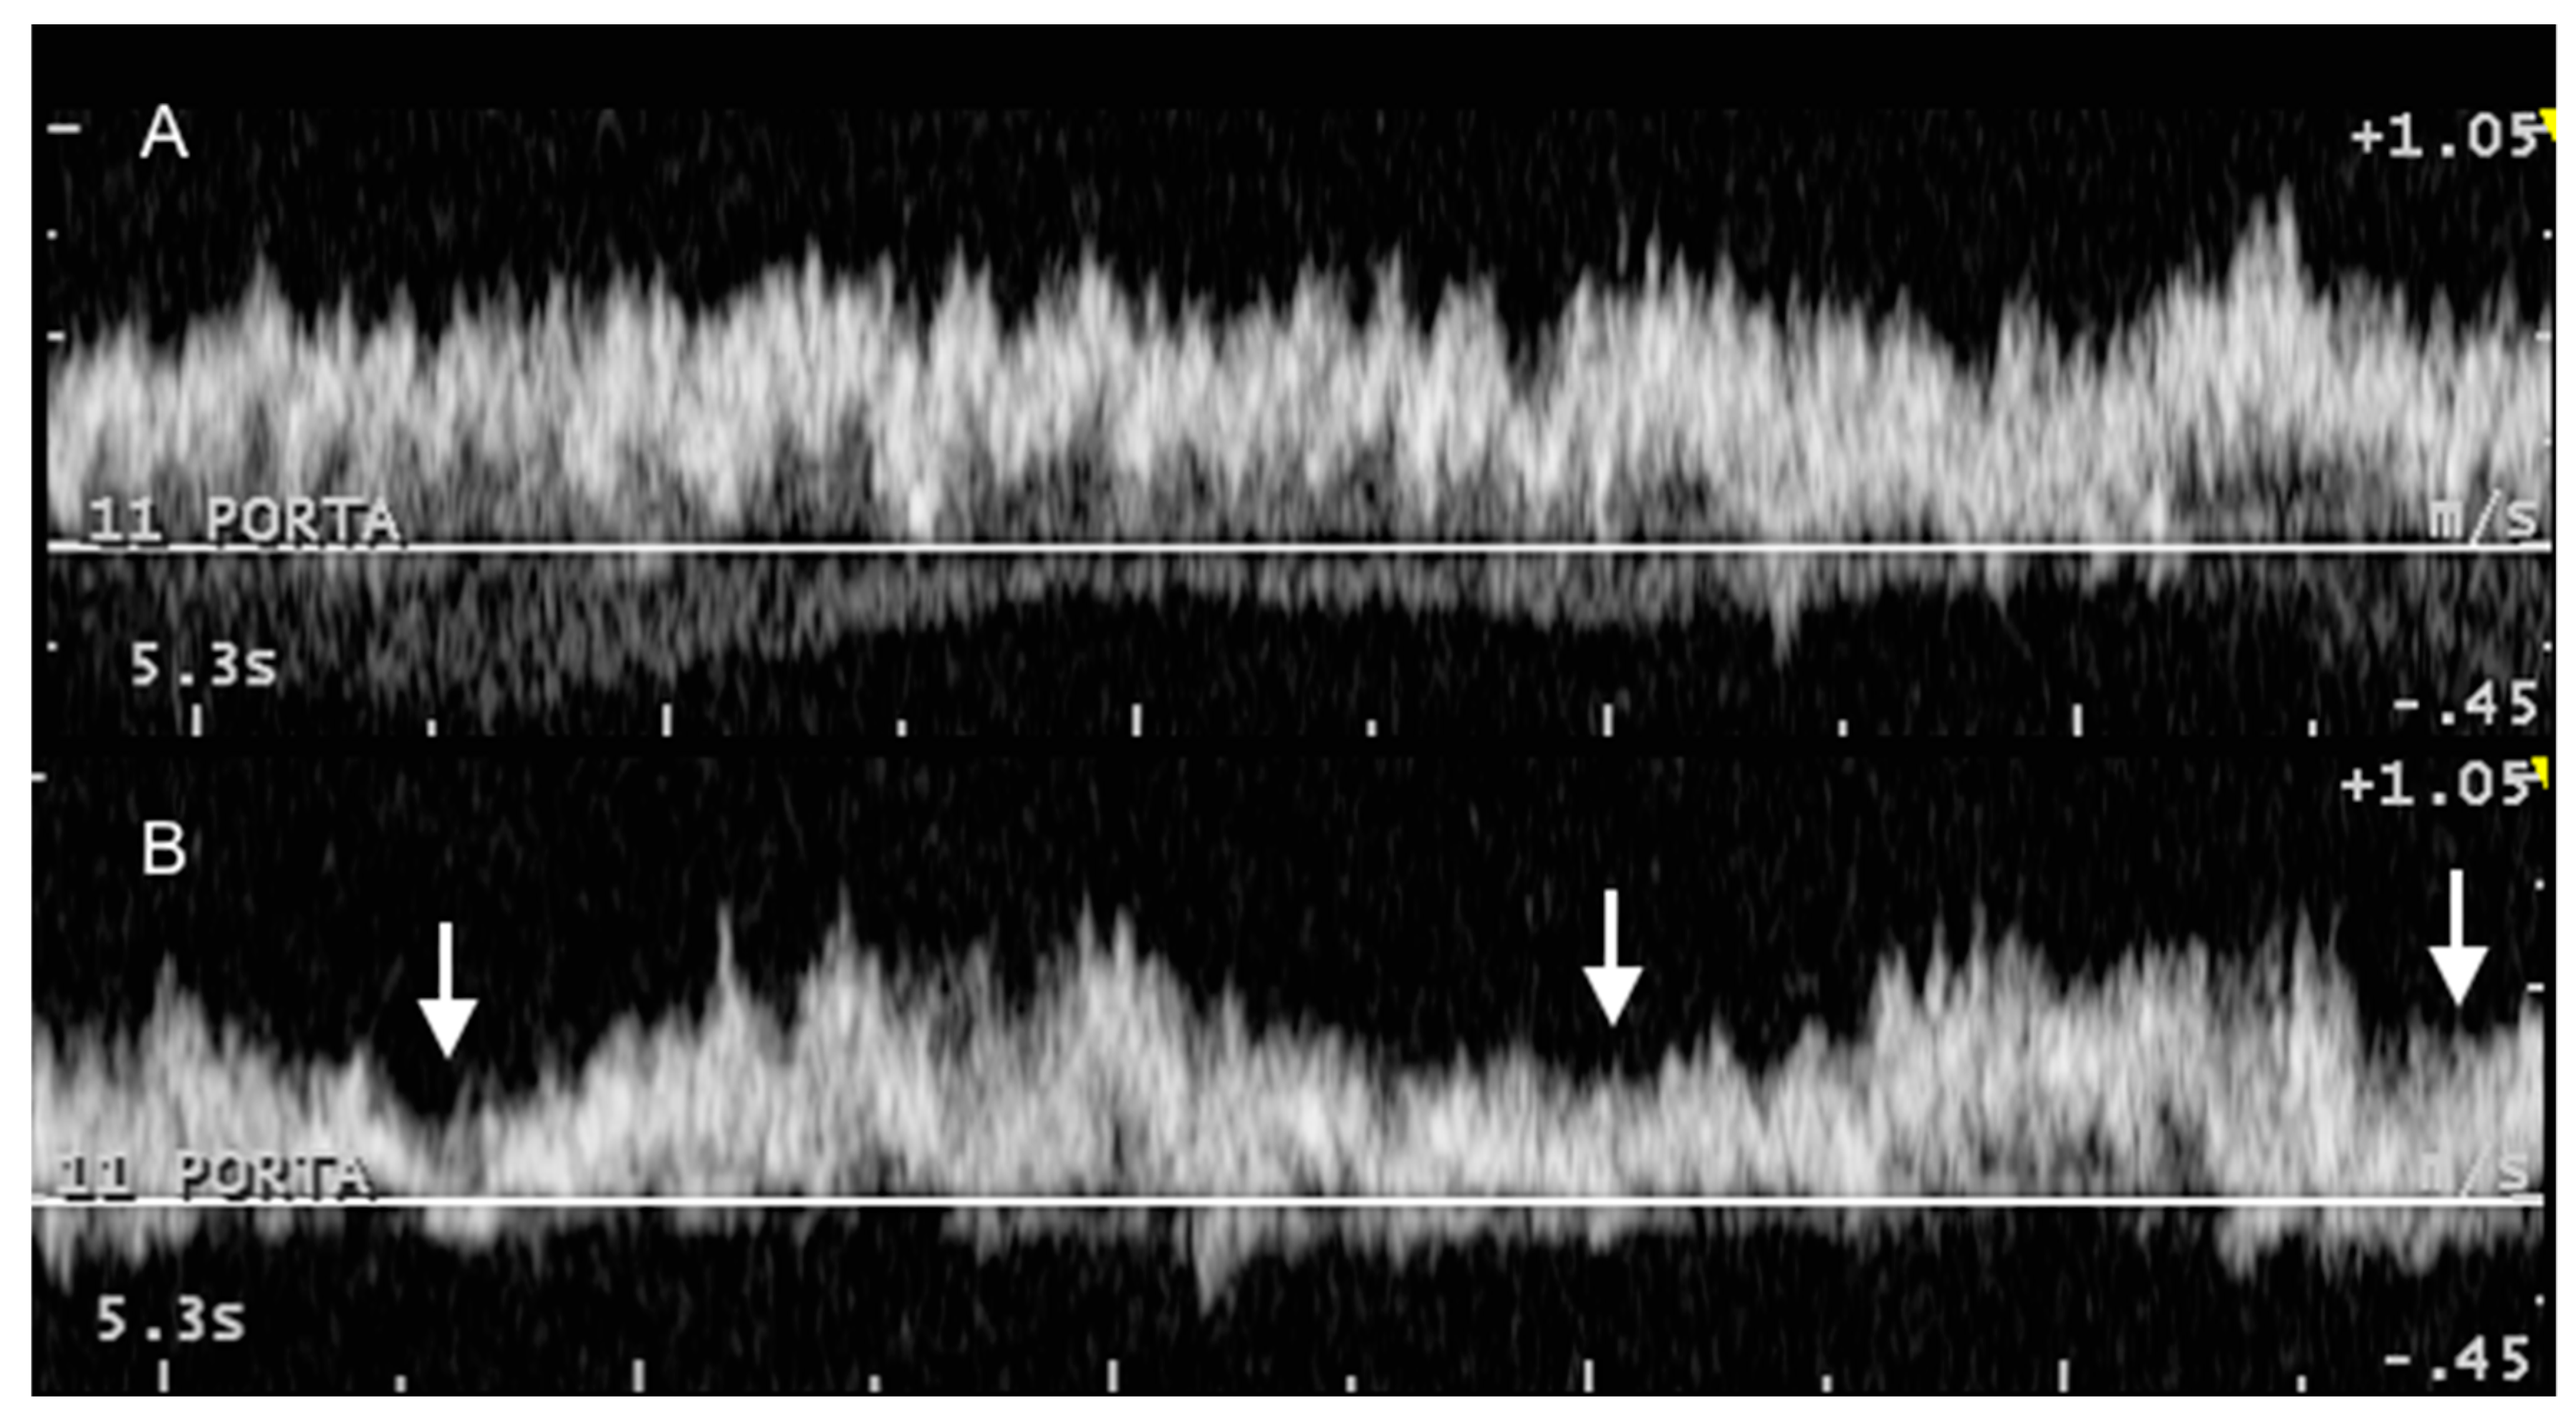
3.2. Portal System
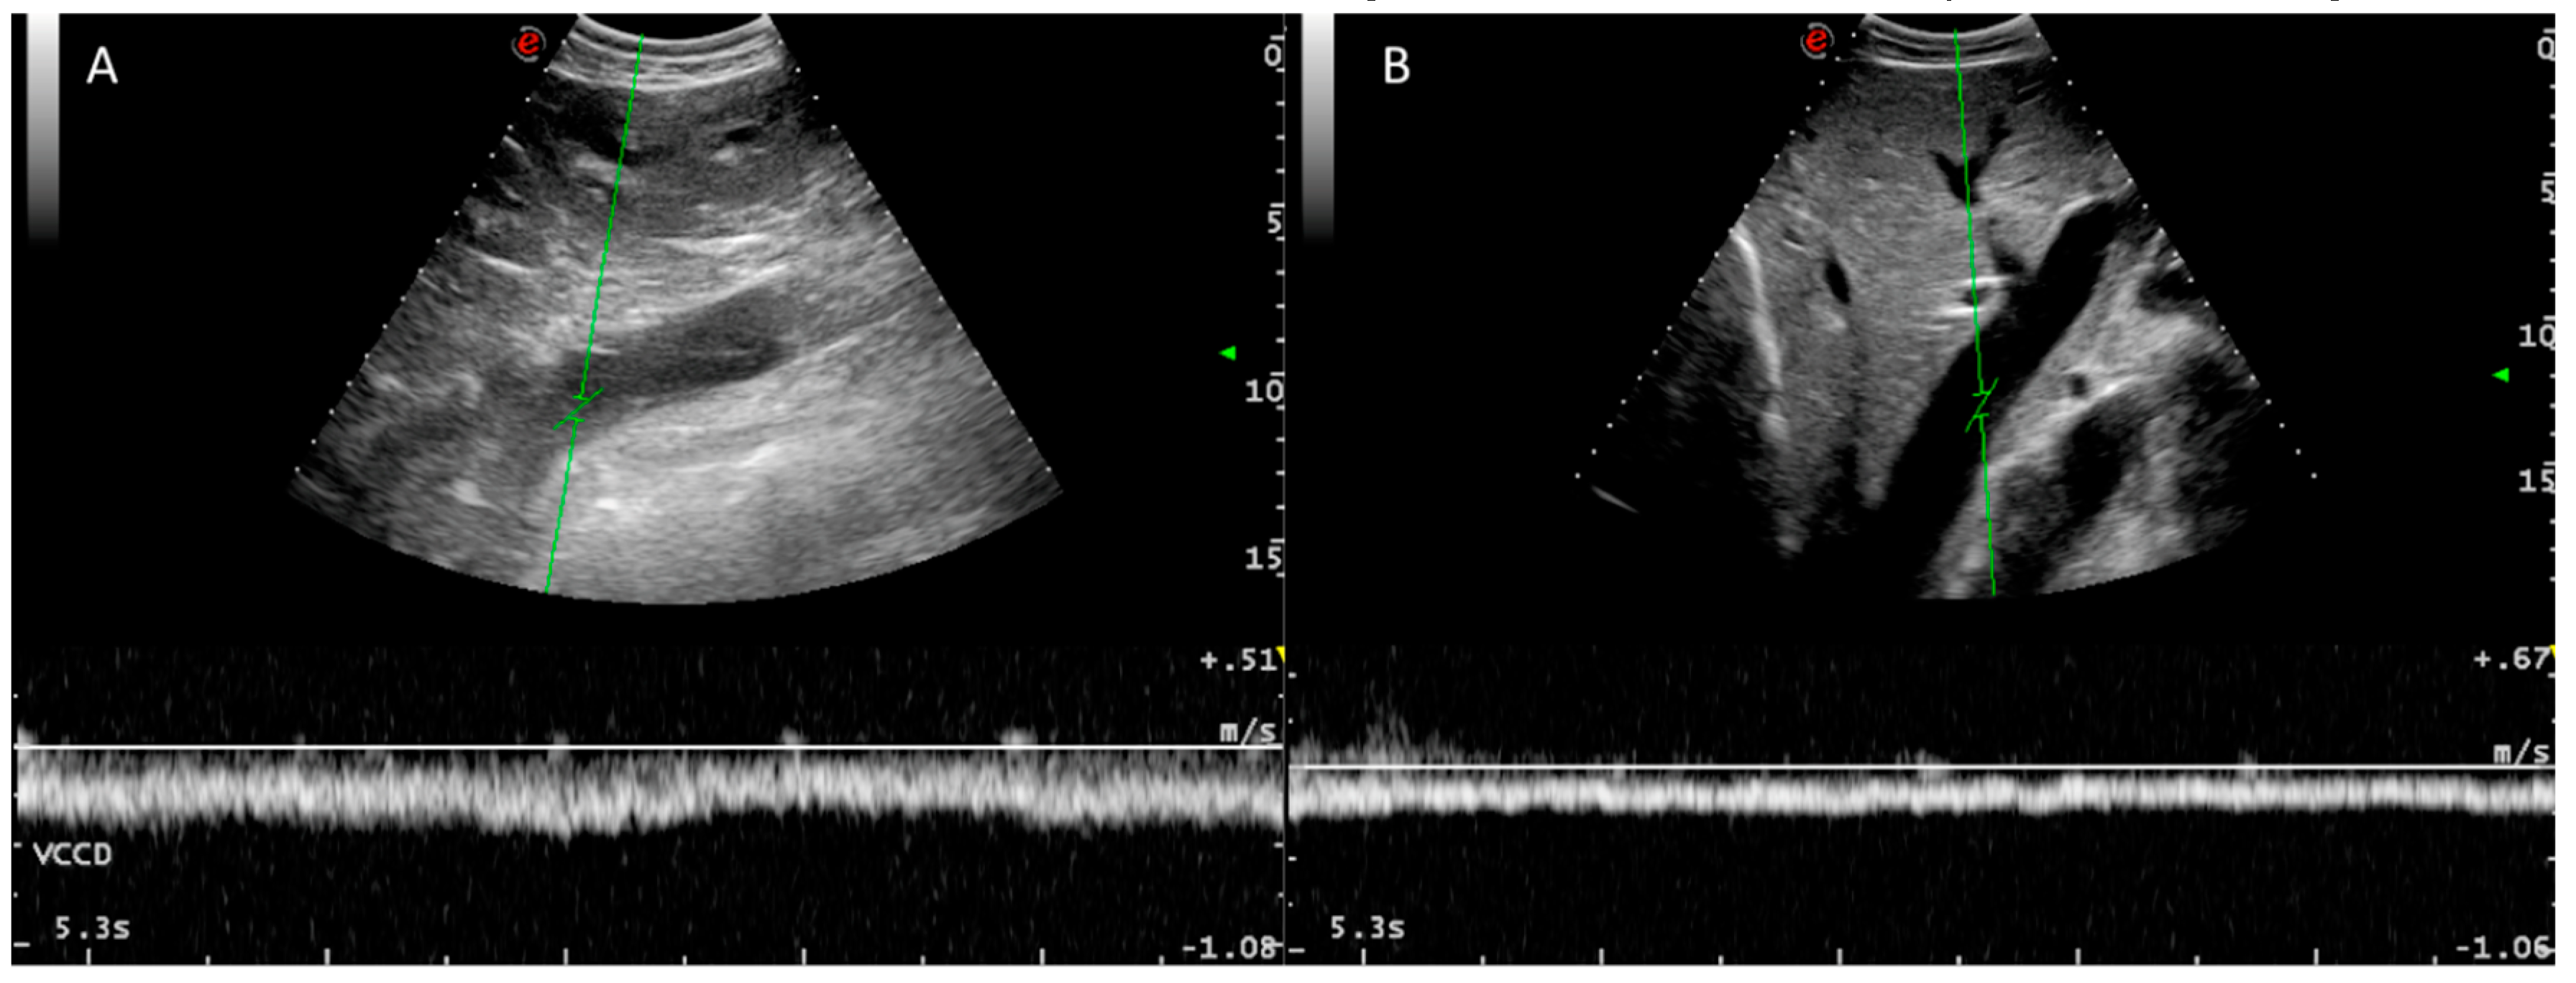
3.3. Caudal Vena Cava and Hepatic Veins
4. Conclusions
Author Contributions
Funding
Conflicts of Interest
References
- Braun, U. Ultrasonography of the liver in cattle. Vet. Clin. N. Am. Food Anim. Pract. 2009, 25, 591–609. [Google Scholar] [CrossRef] [PubMed]
- Starke, A.; Schmidt, S.; Haudum, A.; Scholbach, T.; Wohlsein, P.; Beyerbach, M.; Rehage, J. Evaluation of portal blood flow using transcutaneous and intraoperative Doppler ultrasonography in dairy cows with fatty liver. J. Dairy Sci. 2011, 94, 2964–2971. [Google Scholar] [CrossRef] [PubMed]
- Starke, A.; Wussow, K.; Matthies, L.; Kusenda, M.; Busche, R.; Haudum, A.; Beineke, A.; Pfarrer, C.; Rehage, J. Minimally-invasive catheterization of the portal, hepatic and cranial mesenteric veins and the abdominal aorta for quantitative determination of hepatic metabolism in dairy cows. Vet. J. 2012, 192, 403–411. [Google Scholar] [CrossRef] [PubMed]
- Carr, S.B.; Jacobson, D.R. Method for measurement of gastrointestinal absorption in normal animals, combining portal-carotid differences and telemetered portal flow by Doppler shift. J. Dairy Sci. 1968, 51, 721–729. [Google Scholar] [CrossRef]
- Wangsness, P.J.; McGilliard, A.D. Measurement of portal blood flow in calves by dye-dilution. J. Dairy Sci. 1972, 55, 1439–1446. [Google Scholar] [CrossRef]
- Klotz, J.L.; Heitmann, R.N. Changes in net portal nutrient flux in response to weaning transition and ionophore supplementation in dairy calves. J. Dairy Sci. 2007, 90, 1326–1339. [Google Scholar] [CrossRef]
- Hart, C.G.; Voelz, B.E.; Brockus, K.E.; Lemley, C.O. Hepatic steroid inactivating enzymes, hepatic portal blood flow and corpus luteum blood perfusion in cattle. Reprod. Domest. Anim. 2018, 53, 751–758. [Google Scholar] [CrossRef] [PubMed]
- McNaughton, D.A.; Abu-Yousef, M.M. Doppler US of the liver made simple. RadioGraphics 2011, 31, 161–188. [Google Scholar] [CrossRef]
- D’Anjou, M.A.; Penninck, D. Liver. In Atlas of Small Animal Ultrasonography; Penninck, D., D’Anjou, M., Eds.; Wiley-Blackwell: Oxford, UK, 2015; pp. 187–192. [Google Scholar]
- Nyland, T.G.; Larson, M.M.; Mattoon, J. Liver. In Small Animal Diagnostic Ultrasound; Mattoon, J.S., Nyland, T., Eds.; Elsevier Ltd.: St. Louis, MO, USA, 2015; pp. 332–340. [Google Scholar]
- Braun, U.; Hoegger, R. B-mode and colour Doppler ultrasonography of the milk vein in 29 healthy Swiss braunvieh cows. Vet. Rec. 2008, 163, 47–49. [Google Scholar] [CrossRef]
- Braun, U.; Hoegger, R.; Hässig, M. Colour-Doppler sonography of the musculophrenic vein in cows. Vet. J. 2008, 179, 451–454. [Google Scholar] [CrossRef][Green Version]
- Braun, U.; Forster, E. B-mode and colour Doppler sonographic examination of the milk vein and musculophrenic vein in dry cows and cows with a milk yield of 10 and 20 kg. Acta Vet. Scand. 2012, 54, 15. [Google Scholar] [CrossRef] [PubMed]
- Braun, U.; Forster, E.; Bleul, U.; Hässig, M.; Schwarzwald, C. B-mode and colour Doppler ultrasonography of the milk vein and musculophrenic vein in eight cows during lactation. Res. Vet. Sci. 2013, 94, 138–143. [Google Scholar] [CrossRef] [PubMed][Green Version]
- Braun, U.; Föhn, J. Duplex ultrasonography of the common carotid artery and external jugular vein of cows. Am. J. Vet. Res. 2005, 66, 962–965. [Google Scholar] [CrossRef] [PubMed]
- Kaneko, J.J.; Harvey, J.W.; Bruss, M.L. Clinical Biochemistry of Domestic Animals; Academic Press: New York, NY, USA, 2008; ISBN 0123963052. [Google Scholar]
- Lamb, C.R.; Mahoney, P.N. Comparison of three methods for calculating portal blood flow velocity in dogs using duplex-Doppler ultrasonography. Vet. Radiol. Ultrasound 1994, 35, 190–194. [Google Scholar] [CrossRef]
- Shirai, W.; Sato, T.; Shibuya, H.; Naito, K.; Tsukise, A. Three-dimensional vasculature of the bovine liver. Anat. Histol. Embryol. 2005, 34, 354–363. [Google Scholar] [CrossRef] [PubMed]
- Taylor, K.J.W.; Burns, P.N.; Wells, P. Clinical Applications of Doppler Ultrasound, 2nd ed.; Lippincott-Raven Publishers, Inc.: Philadelphia, PA, USA, 1995. [Google Scholar]
- Erdogmus, B.; Tamer, A.; Buyukkaya, R.; Yazici, B.; Buyukkaya, A.; Korkut, E.; Alcelik, A.; Korkmaz, U. Portal vein hemodynamics in patients with non-alcoholic fatty liver disease. Tohoku J. Exp. Med. 2008, 215, 89–93. [Google Scholar] [CrossRef] [PubMed]
- Barone, R. Angiologie. In Anatomie Comparée des Mammiféres Domestiques; Vigot: Paris, France, 1996; pp. 668–679. [Google Scholar]
- Abu-Yousef, M.M. Normal and respiratory variations of the hepatic and portal venous duplex Doppler waveforms with simultaneous electrocardiographic correlation. J. Ultrasound Med. 1992, 11, 263–268. [Google Scholar] [CrossRef]
- Belotta, A.F.; Santarosa, B.P.; Ferreira, D.O.L.; Carvalho, S.M.F.; Gonçalves, R.C.; Padovani, C.R.; Mamprim, M.J.; Belotta, A.F.; Santarosa, B.P.; Ferreira, D.O.L.; et al. Portal Vein Dopplerflowmetry in healthy sheep according to age. Pesqui. Veterinária Bras. 2017, 37, 1172–1176. [Google Scholar] [CrossRef]
- Lomax, M.A.; Baird, G.D. Blood flow and nutrient exchange across the liver and gut of the dairy cow. Br. J. Nutr. 1983, 49, 481–496. [Google Scholar] [CrossRef]
- Braun, U.; Gerber, D. Influence of age, breed, and stage of pregnancy on hepatic ultrasonographic findings in cows. Am. J. Vet. Res. 1994, 55, 1201–1205. [Google Scholar] [PubMed]


| Location | Flank | 12 ICS | 11 ICS | 10 ICS | 9 ICS | |
|---|---|---|---|---|---|---|
| No. of observations (no. cows) | ||||||
| General | 10 (3) | 34 (8) | 30 (7) | 3 (1) | NA | |
| Reverse maximum velocity | 4 (1) | 17 (5) | 17 (6) | 3 (1) | NA | |
| Mean velocity (cm/s) | ||||||
| Mean (95% CI) | 15.0 (12.8–17.3) | 16.0 (15.0–17.1) | 13.8 (13.1–14.6) | 17.5 (7.2–27.7) | NA | |
| Median (min-max) | 13.7 (11.4–20.5) | 15.7 (10.8–21.7) | 14.2 (9.7–17.1) | 15.4 (14.8–22.2) | ||
| Maximum velocity (cm/s) | ||||||
| Mean (95% CI) | 37.8 (32.9–42.7) | 39.1 (35.7–42.4) | 34.3 (32.4–36.3) | 41.0 (10.8–71.2) | NA | |
| Median (min–max) | 37.0 (29.0–51.0) | 36.0 (28.0–60.0) | 34.5 (24.0–47.0) | 35.0 (33.0–55.0) | ||
| Reverse maximum velocity (cm/s) | ||||||
| Mean (95% CI) | 23.0 (9.8–36.2) | 19.9 (16.1–23.7) | 16 (13–19) | 21.7 (16.5–26.8) | NA | |
| Median (min–max) | 25.5 (11.0–30.0) | 19.0 (9.0–34.0) | 17.0 (8.0–26.0) | 21.0 (20.0-24.0) | ||
| Blood flow (F) | ||||||
| L/min | Mean (95% CI) | 3.44 (2.37–4.51) | 3.93 (3.37–4.48) | 2.98 (2.66–3.31) | 4.35 (3.05–5.65) | NA |
| Median (min–max) | 2.78 (1.08–6.01) | 3.57 (1.93–7.78) | 3.14 (1.01–4.06) | 4.19 (3.92–4.93) | NA | |
| ml/min/kg | Mean (95% CI) | 6.88 (4.41–9.35) | 7.42 (6.5–8.34) | 5.86 (5.11–6.61) | 8.14 (5.71–10.6) | NA |
| Median (min–max) | 5.2 (3.25–12.8) | 7.4 (3.63–13.1) | 6.05 (1.81–9.16) | 7.85 (7.34–9.24) | NA | |
| Location | Flank | 12 ICS | 11 ICS | 10 ICS | 9 ICS | |
|---|---|---|---|---|---|---|
| No. of observations (no. cows) | ||||||
| General | 3 (1) | 35 (10) | 40 (12) | 9 (3) | NA | |
| Reverse maximum velocity | 3 (1) | 19 (6) | 8 (3) | 2 (1) | NA | |
| Mean velocity (cm/s) | ||||||
| Mean (95% CI) | 27.2 (12.2–42.2) | 24 (22.5–25.4) | 24 (22.7–25.2) | 20 (18.5–21.5) | NA | |
| Median (min–max) | 26.2 (21.7–33.6) | 23.9 (17.7–33.9) | 23.4 (16.5–31.9) | 19.9 (17.7–23.4) | NA | |
| Maximum velocity (cm/s) | ||||||
| Mean (95% CI) | 68.3 (36.4–99.9) | 56.8 (53.3–60.2) | 55.1 (52.5–57.7) | 47 (42.5–51.5) | NA | |
| Median (min–max) | 63 (59–83) | 56 (39–79) | 55 (41–78) | 45 (42–57) | NA | |
| Reverse maximum velocity (cm/s) | ||||||
| Mean (95% CI) | 19.3 (9.9–28.7) | 19.2 (16.1–22.3) | 19.4 (15.6–23.2) | 13.5 (7.1–19.8) | NA | |
| Median (min–max) | 21.0 (15.0–22.0) | 18.0 (10.0–31.0) | 18.5 (13.0–26.0) | 13.5 (13.0–14.0) | NA | |
| Blood flow (F) | ||||||
| L/min | Mean (95% CI) | 4.17 (1.42–6.92) | 3.95 (3.48–4.43) | 3.58 (3.04–4.13) | 2.37 (1.94–2.8) | NA |
| Median (min–max) | 3.63 (3.44–5.44) | 3.73 (1.71–7.44) | 3.17 (1.78–9.62) | 2.24 (2–3.78) | NA | |
| ml/min/kg | Mean (95% CI) | 7.99 (2.71–13.3) | 7.5 (6.56–8.43) | 6.74 (5.82–7.67) | 4.3 (3.65–4.95) | NA |
| Median (min–max) | 6.95 (6.58–10.4) | 7.03 (3.37–13.4) | 5.62 (3.5–16.2) | 4.07 (3.38–6.36) | NA | |
| Location | Flank | 12 ICS | 11 ICS | 10 ICS | 9 ICS | |
|---|---|---|---|---|---|---|
| N° of observations (n° cows) | ||||||
| General | NA | 16 (4) | 48 (12) | 25 (7) | NA | |
| Reverse maximum velocity | NA | 16 (4) | 48 (12) | 21 (6) | NA | |
| Mean velocity (cm/s) | ||||||
| Mean (95% CI) | NA | 26.6 (22.4–30.8) | 23.4 (21.8–25) | 25.5 (23–28) | NA | |
| Median (min–max) | NA | 23.9 (17.1–39.9) | 24.2 (10.8–33.1) | 23.9 (16.5–41.6) | NA | |
| Maximum velocity (cm/s) | ||||||
| Mean (95% CI) | NA | 71.7 (59.2–84.3) | 64.8 (60.3–69.2) | 65.3 (58.9–71.7) | NA | |
| Median (min–max) | NA | 60 (46–111) | 68.5 (29–93) | 62 (46–113) | NA | |
| Reverse maximum velocity (cm/s) | ||||||
| Mean (95% IC) | NA | 38.2 (31.5–44.9) | 24.9 (22.2–27.5) | 22.5 (17.5–27.4) | NA | |
| Median (min–max) | NA | 41 (16–57) | 25.5 (8–43) | 20 (9–54) | NA | |
| Blood flow (F) | ||||||
| L/min | Mean (95% CI) | NA | 13.3 (9.75–16.9) | 13.1 (11.7–14.5) | 12.4 (11.5–13.3) | NA |
| Median (min–max) | NA | 12.2 (3.78–23.6) | 13.5 (3.04–21.0) | 12.1 (9.31–17.0) | NA | |
| ml/min/kg | Mean (95% CI) | NA | 26.5 (18.9–34.2) | 25.5 (23–28.1) | 22.5 (21– 23.9) | NA |
| Median (min–max) | NA | 23.1 (8.05–50.3) | 27 (5.82–40.8) | 21.8 (16.4–29.3) | NA | |
| Location | Flank | 12 ICS | 11 ICS | 10 ICS | 9 ICS | |
|---|---|---|---|---|---|---|
| N° of observations (n° cows) | ||||||
| General | NA | 43 (9) | 77 (15) | 43 (12) | 15 (4) | |
| Reverse maximum velocity | NA | 30 (7) | 55 (14) | 29 (9) | 10 (2) | |
| Mean velocity (cm/s) | ||||||
| Mean (95% CI) | NA | 16.4 (15.0–17.8) | 18.3 (17.3–19.2) | 16 (14.5–17.5) | 13.1 (10.5–15.7) | |
| Median (min–max) | NA | 16.0 (9.1–29.1) | 17.7 (8.0–28.5) | 16.0 (5.1–25.9) | 10.3 (8.0–20.5) | |
| Maximum velocity (cm/s) | ||||||
| Mean (95% CI) | NA | 44.5 (40.3–48.8) | 50.9 (47.4–54.4) | 42.3 (38.6–45.9) | 34.3 (29.8–38.8) | |
| Median (min–max) | NA | 42 (26–80) | 46 (30–94) | 42 (12–67.6) | 33 (20.2–46) | |
| Reverse maximum velocity (cm/s) | ||||||
| Mean (95% CI) | NA | 22.2 (19.3–25) | 21.6 (19.2–24) | 18.1 (16.1–20.1) | 18.2 (15.1–21.3) | |
| Median (min–max) | NA | 24 (8–37) | 19.2 (9–46) | 19 (6–29) | 18 (11–26) | |
| Blood flow (F) | ||||||
| L/min | Mean (95% CI) | NA | 1.94 (1.47–2.4) | 2.63 (2.25–3) | 2.02 (1.52–2.51) | 1.26 (0.92–1.6) |
| Median (min–max) | NA | 1.84 (0.07–6.69) | 2.31 (0.22–9.44) | 1.79 (0.04–6.99) | 1.18 (0.47–2.62) | |
| ml/min/kg | Mean (95% CI) | NA | 3.81 (2.84–4.77) | 4.89 (4.22–5.57) | 3.87 (2.97–4.77) | 2.65 (1.79–3.51) |
| Median (min–max) | NA | 3.62 (0.14–14.2) | 4.26 (0.42–16.3) | 3.68 (0.07–12) | 2.47 (0.81–5.97) | |
| Location | Flank | 12 ICS | 11 ICS | 10 ICS | 9 ICS | |
|---|---|---|---|---|---|---|
| No. of observations (no. cows) | ||||||
| General | 56 (11) | 29 (8) | 16 (4) | NA | NA | |
| Reverse maximum velocity | 12 (3) | 0 (0) | 0 (0) | NA | NA | |
| Mean velocity (cm/s) | ||||||
| Mean (95% CI) | 19.9 (17.9–21.8) | 18.1 (16.6–19.7) | 16.5 (13.7–19.2) | NA | NA | |
| Median (min–max) | 18.6 (6.8–42.2) | 18.2 (9.1–24.4) | 15 (10–27) | NA | NA | |
| Maximum velocity (cm/s) | ||||||
| Mean (95% CI) | 50.3 (45.8–54.9) | 42.6 (39.3–46) | 39 (33.4–44.6) | NA | NA | |
| Median (min–max) | 49 (18–110) | 43 (17–57) | 37 (23–61) | NA | NA | |
| Reverse maximum velocity (cm/s) | ||||||
| Mean (95% CI) | 17.9 (13.1–22.7) | * | * | NA | NA | |
| Median (min–max) | 14.5 (8–30) | * | * | NA | NA | |
| Blood flow (F) | ||||||
| L/min | Mean (95% CI) | 4.58 (3.83–5.33) | 6.09 (5.24–6.93) | 3.94 (2.76–5.12) | NA | NA |
| Median (min–max) | 4.33 (0.47–12.40) | 5.51 (1.77–10.40) | 3.04 (1.60–8.81) | NA | NA | |
| ml/min/kg | Mean (95% CI) | 9.17 (7.51–10.80) | 11.30 (9.71– 12.80) | 7.17 (4.93– 9.41) | NA | NA |
| Median (min–max) | 8.38 (1.08–30.10) | 10.90 (3.05– 19.20) | 5.52 (2.85– 16.90) | NA | NA | |
| Location | Flank | 12 ICS | 11 ICS | 10 ICS | 9 ICS | |
|---|---|---|---|---|---|---|
| No. of observations (no. cows) | ||||||
| General | 12 (4) | 52 (11) | 43 (12) | 42 (11) | 26 (8) | |
| Reverse maximum velocity | 3 (1) | 2 (1) | 4 (1) | 2 (1) | 4 (1) | |
| Mean velocity (cm/s) | ||||||
| Mean (95% CI) | 12.9 (9.9–16.0) | 14.9 (13.7–16.2) | 12.8 (11.9–13.8) | 8.83 (7.98–9.69) | 9.27 (8.33–10.2) | |
| Median (min–max) | 11.7 (7.4–21.7) | 13.7 (7.4–26.8) | 12.5 (7.4–19.4) | 8.55 (5.1–17.1) | 9.4 (5.7–13.9) | |
| Maximum velocity (cm/s) | ||||||
| Mean (95% CI) | 31.4 (24.0–38.8) | 35.2 (32.1–38.2) | 31.1 (28.7–33.5) | 21.9 (19.8–24) | 23.3 (20.9–25.6) | |
| Median (min–max) | 35 (18–53) | 33 (19–71) | 31 (18–52) | 21 (11–38) | 23 (15–36) | |
| Reverse maximum velocity (cm/s) | ||||||
| Mean (95% CI) | 17.7 (8.94–26.4) | 25.5 (19.1–31.8) | 19 (8.69–29.3) | 11 (–1.7–23.7) | 7 (4.75–9.25) | |
| Median (min–max) | 18 (14–21) | 26 (25–26) | 21 (10–25) | 11 (10–12) | 7 (5–8) | |
| Blood flow (F) | ||||||
| L/min | Mean (95% CI) | 1.84 (0.77–2.92) | 2.28 (1.86–2.7) | 1.35 (1.03–1.67) | 0.76 (0.63–0.9) | 0.95 (0.69–1.22) |
| Median (min–max) | 1.03 (0.19–4.92) | 1.73 (0.32–5.38) | 0.81 (0.3–3.71) | 0.62 (0.19–1.61) | 0.8 (0.09–2.72) | |
| ml/min/kg | Mean (95% CI) | 4.13 (1.51–6.74) | 4.43 (3.58–5.28) | 2.65 (1.94–3.35) | 1.47 (1.2–1.73) | 1.86 (1.27–2.45) |
| Median (min–max) | 2.2 (0.32–11.9) | 3.61 (0.55–10.8) | 1.6 (0.56–8.98) | 1.21 (0.35–3.68) | 1.47 (0.14–6.22) | |
© 2019 by the authors. Licensee MDPI, Basel, Switzerland. This article is an open access article distributed under the terms and conditions of the Creative Commons Attribution (CC BY) license (http://creativecommons.org/licenses/by/4.0/).
Share and Cite
Barreiro-Vázquez, J.D.; Miranda, M.; Barreiro-Vilanova, M.I.; Diéguez, F.J.; Barreiro-Lois, A. Characterization of the Normal Portal and Hepatic Blood Flow of Adult Holstein-Friesian Cows. Animals 2019, 9, 386. https://doi.org/10.3390/ani9060386
Barreiro-Vázquez JD, Miranda M, Barreiro-Vilanova MI, Diéguez FJ, Barreiro-Lois A. Characterization of the Normal Portal and Hepatic Blood Flow of Adult Holstein-Friesian Cows. Animals. 2019; 9(6):386. https://doi.org/10.3390/ani9060386
Chicago/Turabian StyleBarreiro-Vázquez, J. Daniel, Marta Miranda, M. Isabel Barreiro-Vilanova, F. Javier Diéguez, and Andrés Barreiro-Lois. 2019. "Characterization of the Normal Portal and Hepatic Blood Flow of Adult Holstein-Friesian Cows" Animals 9, no. 6: 386. https://doi.org/10.3390/ani9060386
APA StyleBarreiro-Vázquez, J. D., Miranda, M., Barreiro-Vilanova, M. I., Diéguez, F. J., & Barreiro-Lois, A. (2019). Characterization of the Normal Portal and Hepatic Blood Flow of Adult Holstein-Friesian Cows. Animals, 9(6), 386. https://doi.org/10.3390/ani9060386