Article

Nano- to Millimeter Scale Morphology of Connected and Isolated Porosity in the Permo-Triassic Khuff Formation of Oman

1
Geological Institute, RWTH Aachen University, 52062 Aachen, Germany
2
Division of Geology, KU Leuven, 3001 Heverlee, Belgium
3
Institute of Geosciences, CAU Kiel, 24118 Kiel, Germany
4
Leibniz Institute for Applied Geophysics, 30655 Hannover, Germany
5
Institute for Applied Geophysics and Geothermal Energy, 52074 Aachen, Germany
6
Department of Civil Engineering, Building Physics Section, KU Leuven, 3001 Heverlee, Belgium
*
Author to whom correspondence should be addressed.
Geosciences 2020, 10(1), 7; https://doi.org/10.3390/geosciences10010007
Submission received: 8 October 2019 / Accepted: 16 October 2019 / Published: 23 December 2019
(This article belongs to the Special Issue Characterization and Simulation of Carbonate Reservoirs)

Abstract

:
Carbonate reservoirs form important exploration targets for the oil and gas industry in many parts of the world. This study aims to differentiate and quantify pore types and their relation to petrophysical properties in the Permo-Triassic Khuff Formation, a major carbonate reservoir in Oman. For that purpose, we have employed a number of laboratory techniques to test their applicability for the characterization of respective rock types. Consequently, a workflow has been established utilizing a combined analysis of petrographic and petrophysical methods which provide the best results for pore-system characterization. Micro-computed tomography (µCT) analysis allows a representative 3D assessment of total porosity, pore connectivity, and effective porosity of the ooid-shoal facies but it cannot resolve the full pore-size spectrum of the highly microporous mud-/wackestone facies. In order to resolve the smallest pores, combined mercury injection capillary pressure (MICP), nuclear magnetic resonance (NMR), and BIB (broad ion beam)-SEM analyses allow covering a large pore size range from millimeter to nanometer scale. Combining these techniques, three different rock types with clearly discernible pore networks can be defined. Moldic porosity in combination with intercrystalline porosity results in the highest effective porosities and permeabilities in shoal facies. In back-shoal facies, dolomitization leads to low total porosity but well-connected and heterogeneously distributed vuggy and intercrystalline pores which improves permeability. Micro- and nanopores are present in all analyzed samples but their contribution to effective porosity depends on the textural context. Our results confirm that each individual rock type requires the application of appropriate laboratory techniques. Additionally, we observe a strong correlation between the inverse formation resistivity factor and permeability suggesting that pore connectivity is the dominating factor for permeability but not pore size. In the future, this relationship should be further investigated as it could potentially be used to predict permeability from wireline resistivity measured in the flushed zone close to the borehole wall.

1. Introduction

Carbonates account for the majority of oil and gas reservoirs [1] and are also well known for their extremely heterogeneous pore networks with pore sizes spanning many orders of magnitude. The estimation of flow behavior in reservoirs often suffers from uncertainties associated with pore types and pore distributions. Contributions of the micro (>1 µm, ≤20 µm) and nano-pores (≤1 µm) can significantly impact fluid flow and solute transport and affect petrophysical log measurements resulting in erroneous reserve estimation, production and recovery rates, which encourages the morphological and topological pore system characterization at a submicron level [2,3]. For example, Baechle et al. [4] describe a strong softening effect of microporosity on the sonic velocity of carbonate rocks leading to overestimations of porosity and consequent permeability. Therefore, microporosity is one of the major areas of concern with respect to carbonate reservoirs expressed by industry representatives [1]. Major issues are the characterization and quantification of the pore shape, size, and connectivity of the macro- to nano-pore network and their role for reservoir performance and recovery efficiency [1,3,5,6]. In some of the largest carbonate and specifically dolostone hosted hydrocarbon reservoirs, a significant percentage of the total porosity and potential fluid and gas storage capacity is found as microporosity between the faces of (replaced) micrite crystals [5,7]. To obtain a complete characterization of a pore system a multi-scale approach with high resolution analyses incorporating micro- and nanoporosity is required (e.g., Knackstedt et al. [8] and Smodej et al. [9]).
Mercury injection capillary pressure (MICP) is a technique which determines petrophysical parameters such as porosity and pore-throat size-distribution through measuring of the intruded mercury under increasing pressures [10,11]. The advantage of MICP is its large resolution of 400 µm down to 3 nm but cannot provide any information about isolated pores. Especially the relationships of connected versus unconnected pores are of prime importance for quantitative reservoir models. For this reason, high resolution petrographic techniques are required to sufficiently characterize a pore system. Transmission electron microscopy (TEM) a method that is now being used in Earth Sciences to detect pores down to few nanometers and which allows building three-dimensional models of a microns-sized sample volume [12]. Due to the sample size, this method cannot display the pore system heterogeneity. Broad ion beam (BIB) milling coupled with SEM imaging has proven its value for shale and tight sandstone reservoir rock characterization [13,14]. This technology was recently applied to investigate micro-pore geometries and types in carbonate reservoirs of the Ara-Group in Oman [9]. It allows the qualitative and quantitative analysis of porosity and microstructures from highly polished sample surfaces with a wide range of detection spanning from several hundred micrometers to a few nanometers. In the Khuff Formation, it has been applied to analyze the petrographic framework with the additional aim to establish a workflow for advanced analysis of pore networks in general. In addition, micro-computed tomography (µCT), allows the construction of a 3D digital model of the porous network in a non-desctructive way [15,16]. Petropgraphic observations are supported by petrophysical measurements such as nuclear magnetic resonance (NMR) and electric resistivity measurements as they provide information about pore connectivity, porosity, pore-size distribution and permeability [16,17,18].
Due to heterogeneous pore networks in the Khuff carbonates, the complex relationship between porosity and permeability makes estimations of flow behavior complicated. Even though permeability slightly increases with porosity, permeabilities of samples with similar porosities span over up to three orders of magnitude (Figure 1). Thus, a porosity-based permeability prediction yields a large uncertainty. Here, we study the influence of facies, texture, and diagenesis on the permeability of the Khuff Formation carbonates using an integrated approach. Hereby, we do not characterize the entire reservoir but introduce the presented methods and their respective workflow for more general applicability in carbonate reservoir studies and in order to formulate testable hypotheses for further studies.

Geological Setting

Sediments of the studied Khuff Formation in Oman (Figure 2) were deposited during the fragmentation of the supercontinent Pangaea during the syn- to post-rift phase of the Neo-Tethys Ocean in the Middle Permian to Early Triassic [19,20]. The deposition started in the Middle to Late Wordian (approximately 267 Ma ago) and terminated in the Late Induan (approximately 250 Ma ago) [21]. The Khuff Formation extends over 2500 km SE-NW strike-direction from Oman to Iraq and more than 1500 km in the SW-NE dip direction between Saudi Arabia and the Persian Gulf [22]. The thickness of the Khuff Formation varies from nearly zero in central Saudi Arabia to 800 m in Qatar and more than 1000 m in the eastern United Arab Emirates [23]. Khuff lithologies range from siliciclastics to limestones and dolomites, anhydrides and shales. In general, the Khuff features a westwards increasing amount in clastic components. The facies ranges from deeper and shallow subtidal low energy mudstone/packstone to shallow subtidal high energy grainstone/packstone and inter– to supratidal low energy mudstone/wackestone [24]. In Oman, the Khuff Formation can be split into seven different depositional sequences (K1–K7). In this study, samples from the upper two sequences are analyzed. The aim is to test the proposed workflow and methods on their capability to differentiate and quantify pore types in samples from two different depositional environments (back shoal and shoal facies). The back shoal represents a depositional environment characterized by low energy, shallow water and semi-restricted circulation of marine water. The associated sample is massive to bioturbated mudstone/wackestone. The shoal facies, in contrast, represents a depositional environment characterized by the open circulation of fully marine water and comprise well sorted oolitic grainstones. The investigated samples further allow the determination of the diagenetic influence on the reservoir properties. According to Esrafili-Dizaji and Rahimpour-Bonab [25], a strong influence of the diagenetic overprint on the porosity-permeability relationship is expected. Remeysen and Swennen [26] observed the trend that dolomitic shoal samples feature higher permeabilities compared to the calcite samples in the Khuff Formation. They proposed that the increased permeability in dolomite-rich zones is a result of well-connected intercrystalline pores. In contrast, calcite dominated zones are characterized by isolated moldic porosities leading to low permeabilities.

2. Methods and Materials

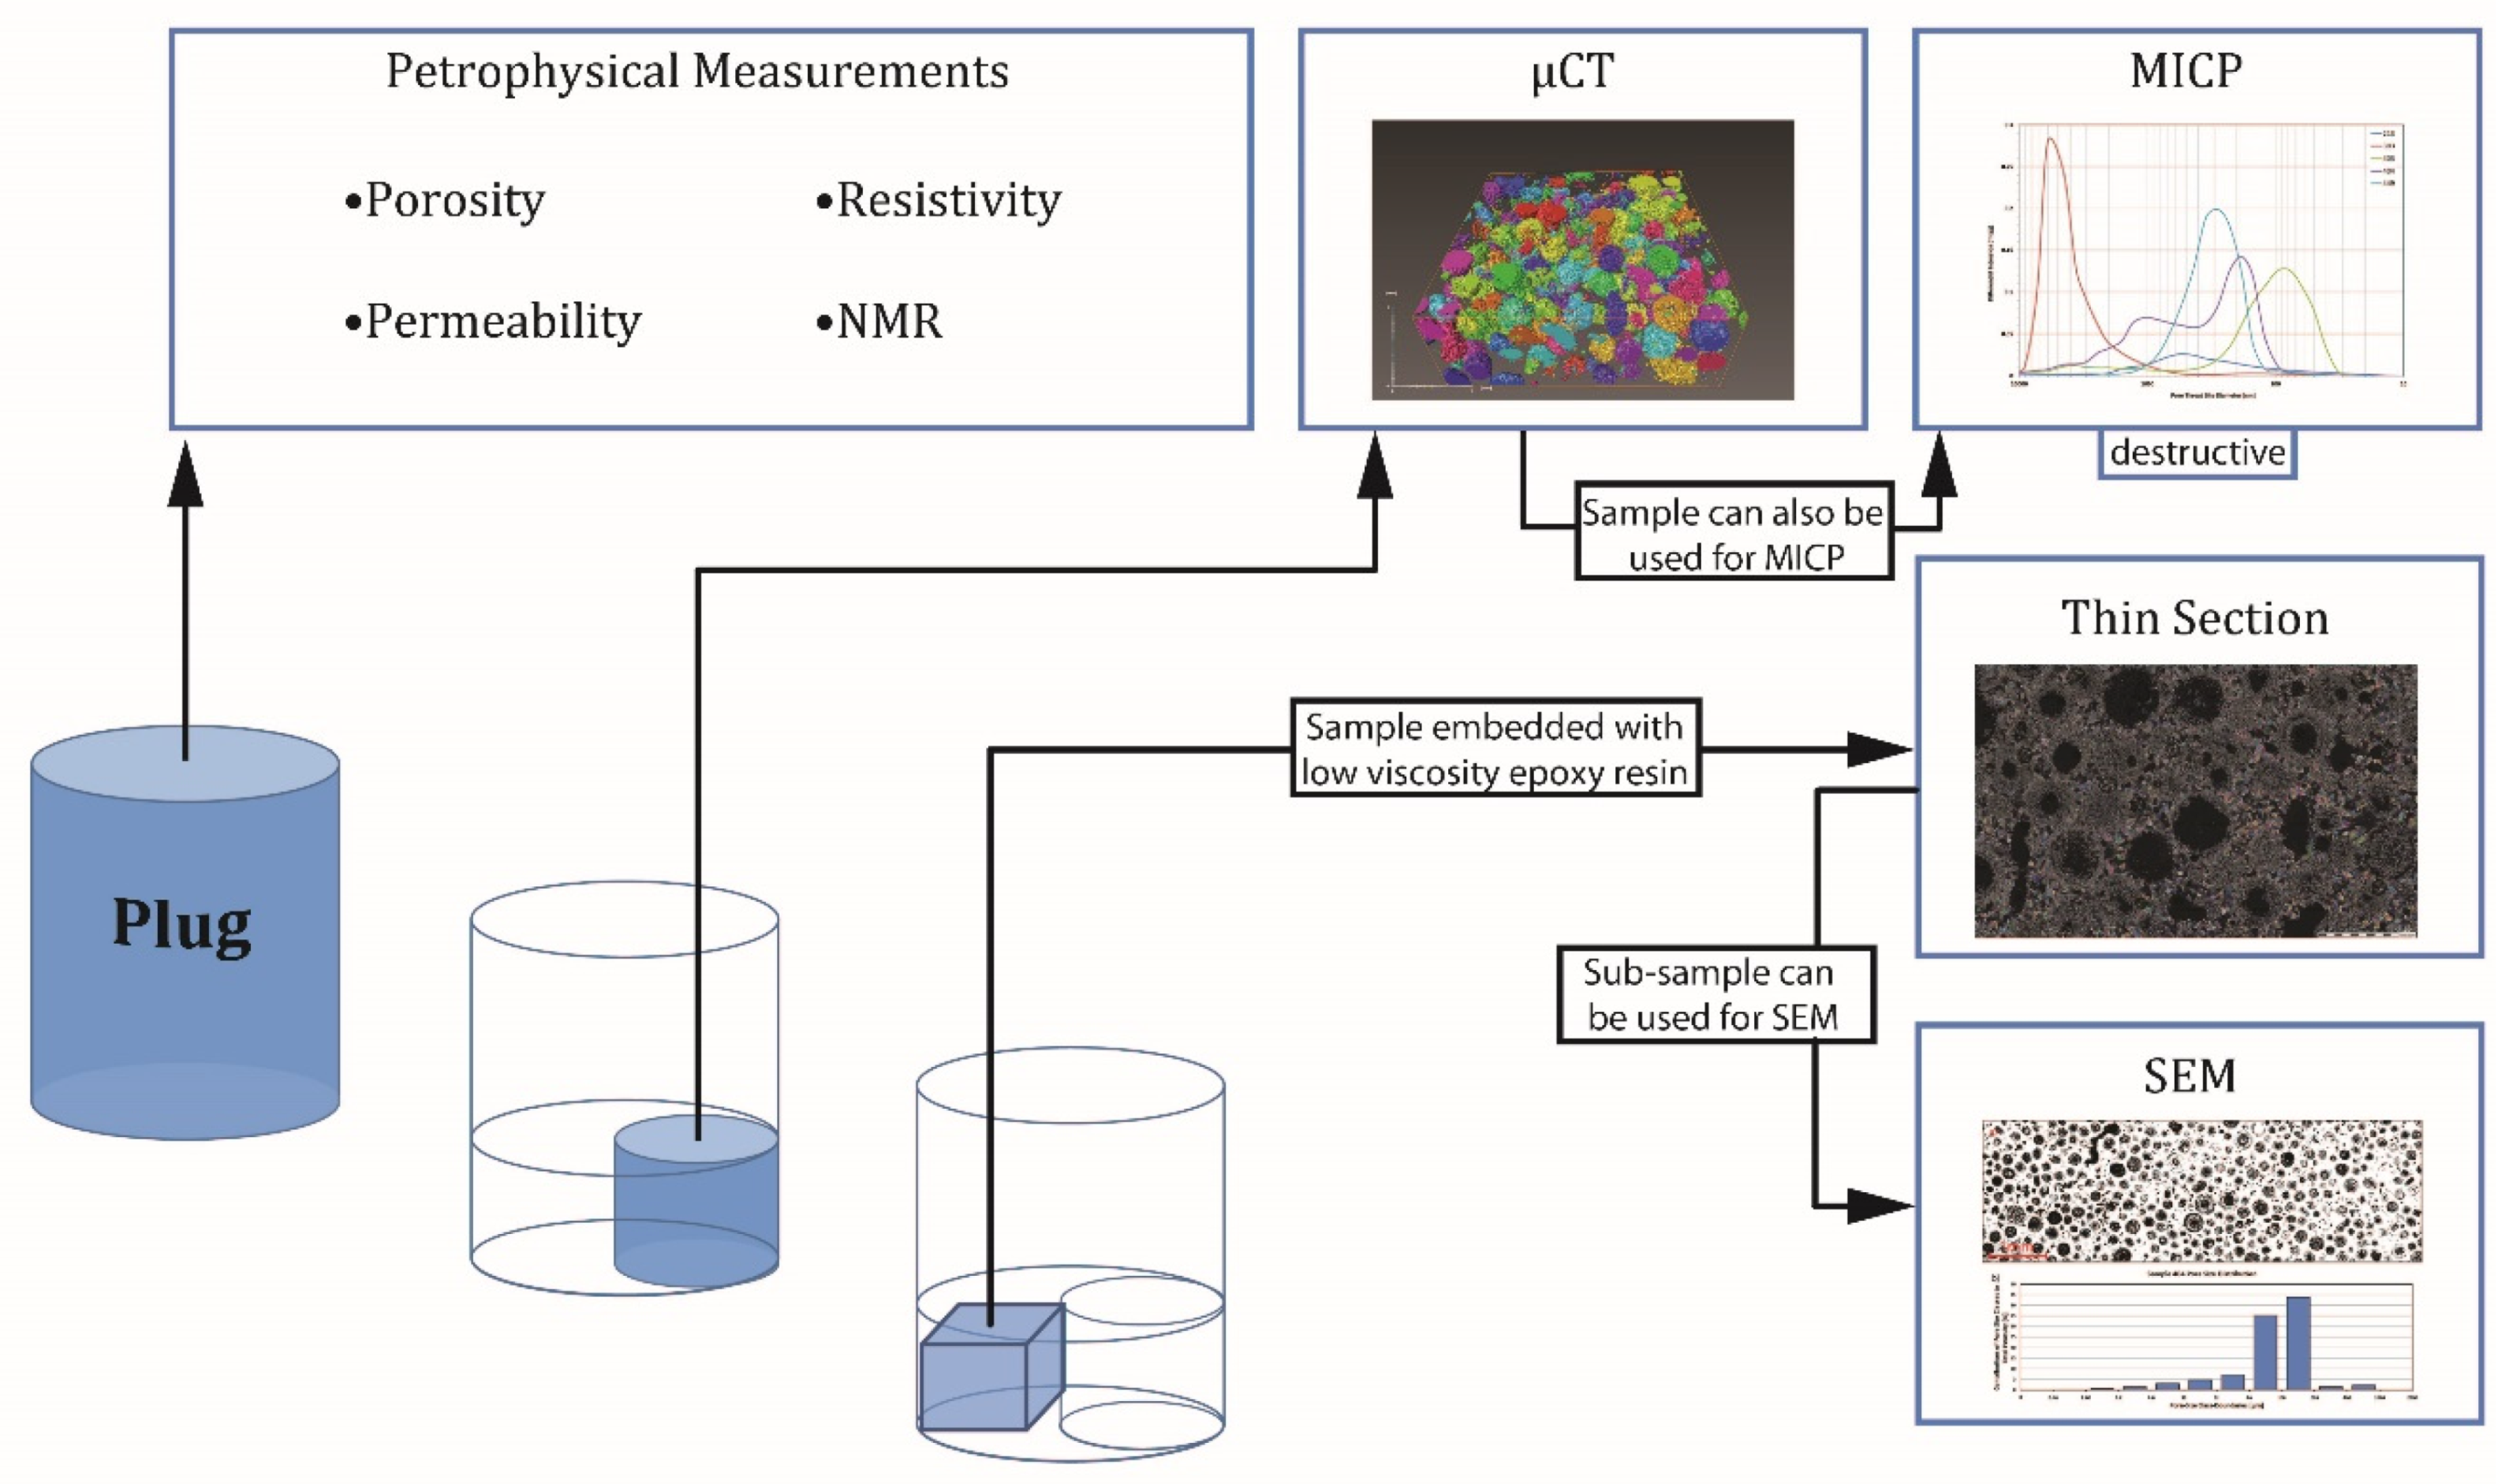
2.1. Samples and Workflow

Five core plug samples (Figure 3) from two different facies have been used for this study. One lithofacies is a cross-bedded oolitic grainstone that has been deposited in proximal incipient to fully developed shoal or bar complexes within the high-energy inner to mid-ramp environment (samples 383, 403, 404, and 449) (Table 1). It is moderately well sorted and contains a high diversity in fauna comprising gastropods, thick-shelled bivalves, bryozoans, and corals. The second lithofacies is a massive to burrowed or bioturbated pel-skel-intraclast mud-/wackestone lithofacies which has been deposited in a low to moderate-energy shallow subtidal protected inner ramp setting and may have experienced exposure, reduced circulation and/or low sedimentation rates (sample 213) (Table 1). The lithofacies is moderately to poorly sorted and features peloids, intraclasts, oncoids, gastropods, and bivalves.
Initially, core plugs (3.8 cm diameter) were prepared for NMR and resistivity measurements. These plugs were subsequently subsampled for µCt and MICP on smaller cylinders (1.5 × 1.5 cm) and cuboids (~3 × 1.5 × 0.5 cm) for petrographic analysis (SEM, thin-section). Helium porosity and permeability values from the reservoir were provided by Petroleum Development Oman (PDO). The workflow introduced in this study requires specimens in the form of core plugs and offers a time-efficient sample-preparation and measuring procedure (Figure 3).

2.2. 2D Imaging

SEM analysis was performed at RWTH Aachen University. Subsample blocks of the initial plugs were separated and vacuum-saturated with low viscosity epoxy resin (Ultra Bed Low Viscosity Epoxy Kit, Electron Microscopy Sciences) in order to produce thin-sections for transmitted-light analysis. These were stained with Alizarin red S for distinguishing between carbonate minerals. For SEM-analysis, subsamples of the thin-section blocks were cut, pre-polished using silicon carbide (SiC) sandpaper and further BIB-argon-polished in a JEOL SM-09010 cross-section polisher (3 h, 10−4–10−3 Pa, 6 kV, 150 μA) to produce a smooth and planar cross-section surface. The BIB polished samples were Au-coated and imaged in a Zeiss Supra 55 SEM with a back scatter detector (BSE) for phase contrast imaging and a secondary electron detector (SE2) for topography investigation. From BIB cross-sections, large areas were selected to be imaged (BSE) at magnifications of 2000× for overview images, of 10,000× for NMR pore-size calibration and correlation with µCT-derived pore-size distributions and of 20,000× for high-resolution image analysis corresponding to a pixel size of 15 nm. Hundreds of single images were stitched together with a bicubic interpolation algorithm in Autopano 2 using an overlap of 10% to create a large representative mosaic, which enables the pore-space analysis down to the resolution of SEM with focus on image analysis. Energy-Dispersive X-ray spectroscopy (EDS) detector was used for semi-quantitative chemical analysis. The stitched BSE-mosaics from SEM show a sufficient density contrast to separate the dark epoxy resin (i.e., porespace) from lighter mineral phases. Therefore, the porespace could be segmented semi-automatically applying simple threshold binarization and was quantified for pore areas using the image analysis software JMicrovision [30]. The quality of the binarized image was improved by manual removal of artifacts and application of slight noise removal accompanied by validation of this procedure by visual comparison with the original image. Data from pore area quantification were used to calculate pore size distributions of the investigated sample surfaces.

2.3. Mercury Injection Capillary Pressure (MICP)

Mercury Intrusion Capillary Pressure measurements (MICP) were performed with a MicroActive AutoPore V 9600 from Micromeritics, Norcross, USA. Mercury intrusion and extrusion analysis was executed at pressures from 689 Pa up to 436 MPa corresponding to a pore throat diameters of 360 to 0.003 µm (Hg surface tension = 485 dynes/cm, contact angle = 130°). Pore throat radius distribution calculations are based on the Washburn equation [10]. After the measurements, data were corrected for conformance and blank errors as introduced by Sigal [31].

2.4. Electric Resistivity Measurement

The cylindrical plugs to be analyzed (d = 3.8 mm, h = 2.5 mm) were cut out of the carbonate plugs and ground and polished with silicon carbide sandpaper. After cleaning in an ultrasonic bath, the sample was saturated with saline water equivalent to the formation water (0.016 Ωm, 115 °C, 180 kppm NaCl equivalent).
The electric resistivity measurement is another method investigating the pore space and was carried out at RWTH Aachen University. We used a two-electrode setup for measuring the sample resistivity in the frequency range from 1 Hz to 10 MHz. The instrument used for the impedance spectroscopy measurements consists of a PSM1735 frequency response analyzer and an Impedance Analysis Interface, both manufactured by Newtons4th Ltd (N4L). For more details of the two-electrode resistivity measurement, which, e.g., compensates stray impedance effects, see Volkmann and Klitzsch [18].
The measured resistivity equals the sum of the sample resistivity and of an additional impedance at both sample-electrode-interfaces also known as contact impedance. As the latter is strongly frequency dependent, the sample resistivity can be inferred by fitting the measured frequency depended data. For this, we assume, that the frequency dependence of the sample resistivity can be neglected but consider the influence of the sample permittivity. More information regarding the influence of the contact impedance on such measurements can be found, e.g., in Spagnoli et al. [32].
Archie [33] discovered an empirical relationship between the resistivity of the formation fluid (Rw) and the resistivity of a sample (R0), where all the pores are filled by this formation fluid. F is called the formation resistivity factor. Plotting the various F values against the porosities φ of the samples, Archie [33] observed a power law trend and derived an empirical relationship with m as the cementation factor representing the slope of the observed power law trend in the porosity-formation factor log-log-plot. The cementation factor is related to the tortuosity of the sample which yields information about the connectivity of the pores. By assuming a simple capillary pore model, the formation resistivity factor F can be shown being proportional to tortuosity T:
F = T Ø e f f
Hence, it can be also related to permeability, e.g., using the Kozeny-Carman equation [34,35]
k = r h 2 2 F
It relates permeability k to the formation resistivity factor F, which depends on tortuosity T and effective porosity Øeff and to the hydraulic (effective) radius rh. Consequently, for a known permeability and formation resistivity factor, this radius can be calculated from Equation (2).

2.5. Micro-Computed Tomography (µCT)

The µCT images have been acquired at KU Leuven (Division of Geology) using the tomograph “GE Nanotom” (180 kV, 15 W) utilizing a Hamamatsu detector with a resolution of 2304 × 2304 pixels. Subsequent to computer tomography measurements the resulting slides (n = 1000), providing a resolution of 7.1 µm per voxel, were processed with correction for beam hardening and ring artifacts. Blocks with a size of 1000 × 1000 × 1000 pixels were used for analysis. The images were reconstructed using Phoenix datosx 2.0 reconstruction software. Noise was removed applying an anisotropic diffusion filter introduced by Perona and Malik [36]. The threshold value applied in this study is 0.1. Further, three segmentation types are tested: single thresholding uses a single threshold determined by the choice of the interpreter. Grey levels, smaller than the threshold, are defined as pores, whereas values above the threshold are defined as a matrix. The second method, Otsu thresholding, splits the grey level histogram into different classes. Thereby, the algorithm determines the threshold value that maximizes the variance between the different classes, while minimizing the variance inside the classes [37]. The third method, double thresholding, also known as L1-hysteresis, uses two thresholds to segment an image. Initially, all voxels with a grey level above the higher threshold are binned as matrix and voxels with a grey level smaller than the lower threshold are binned as pores. Voxel having grey values between the two thresholds are binned depending on their neighboring voxels. If the undefined voxel touches both, a pore and a matrix voxel, it will always be defined as a pore [38].

2.6. Nuclear Magnetic Resonance (NMR)

We measured NMR relaxometry as the method provides information about both the pore-size distribution and the total porosity of the sample under investigation. NMR measurements were carried out at RWTH Aachen University (Institute of Applied Geophysics and Geothermal Energy). The samples were saturated according to the treatment described in the resistivity section. The principles of the NMR method are, e.g., described by Coates et al. [39] and Kenyon [40]. In this study, NMR relaxometry data of hydrogen nuclei (1H) were measured on the five samples using a Halbach magnet setup, generating a 0.0918Tesla static field, that corresponds to a Larmor frequency of 3.91 MHz. In this study, longitudinal (T1) and transversal (T2), relaxation times were measured. The resulting NMR signals carry information about water content and pore space. Longitudinal and transverse magnetization are described by Coates et al. [39] and Kenyon [40].
M ( t ) = M 0 × ( 1 e 1 T 1 )
M ( t ) = M 0 × e 1 T 2
with M0 the initial magnitude and T1,2 the corresponding relaxation time. At full saturation, M0 is directly proportional to the total amount of hydrogen protons in the sample volume and hence relates magnetization to the water content of the saturated sample. The characteristic relaxation times T1,2 on the other hand, carry information about the pore space through the relationship 1/T1,2S/V, where S/V is the surface to volume ratio of the porous medium [39]. Here, it is important to note that T1,2 are not scalar values, but rather relaxation time distributions (RTD), where short relaxation times correspond to smaller pores and long relaxation times to larger pores, respectively.
In this study, relaxation times are transformed into pore sizes assuming a model of sphere-shaped pores. The surface relaxivity is determined by calibrating the inverted T1 spectrum with other physical methods used to derive pore size distributions [39]. In this case, a combination of SEM- and µCT-derived pore-size distributions are used. Marschall et al. [41] proposed a workflow to determine the surface relaxivity ρ.
The NMR porosity (Equation (3)) is calculated based on the ratio of the recorded initial amplitude of the rock sample (M(0,s)) and the initial amplitude of a water sample (M(0,w)), with a volume equivalent to that of the rock sample:
Ø = M ( 0 , s ) / M ( 0 , w )
Permeability can be predicted from NMR experiments by using the Schlumberger-Doll research model [39,42] for sandstones with intergranular pores. In the empirical KSDR model, the permeability is predicted from the sample porosity and the T-logmean (Equation (6)):
K S D R = Ø 4 T l g m 2
where Tlgm is the logarithmic mean time of the T2 relaxation time distribution. However, as carbonate rocks tend to have a more complex pore system, Chang et al. [43] proposed that the intergranular pore volume can be approximated by ignoring the relaxation time distribution above a specific threshold relaxation time. This means that both the pore volume and logarithmic mean are calculated from the fraction of the relaxation time distribution below the cut-off value. The best results were obtained using a cut–off of 0.75 s. Both the complete measured NMR signal and the cut signal approach will be tested in this study. In order to determine the surface relaxivity ρ, a combination of SEM and µCT derived pore size distribution curves have been found to be applicable. NMR measurement parameters can be found in Table 2.

3. Results

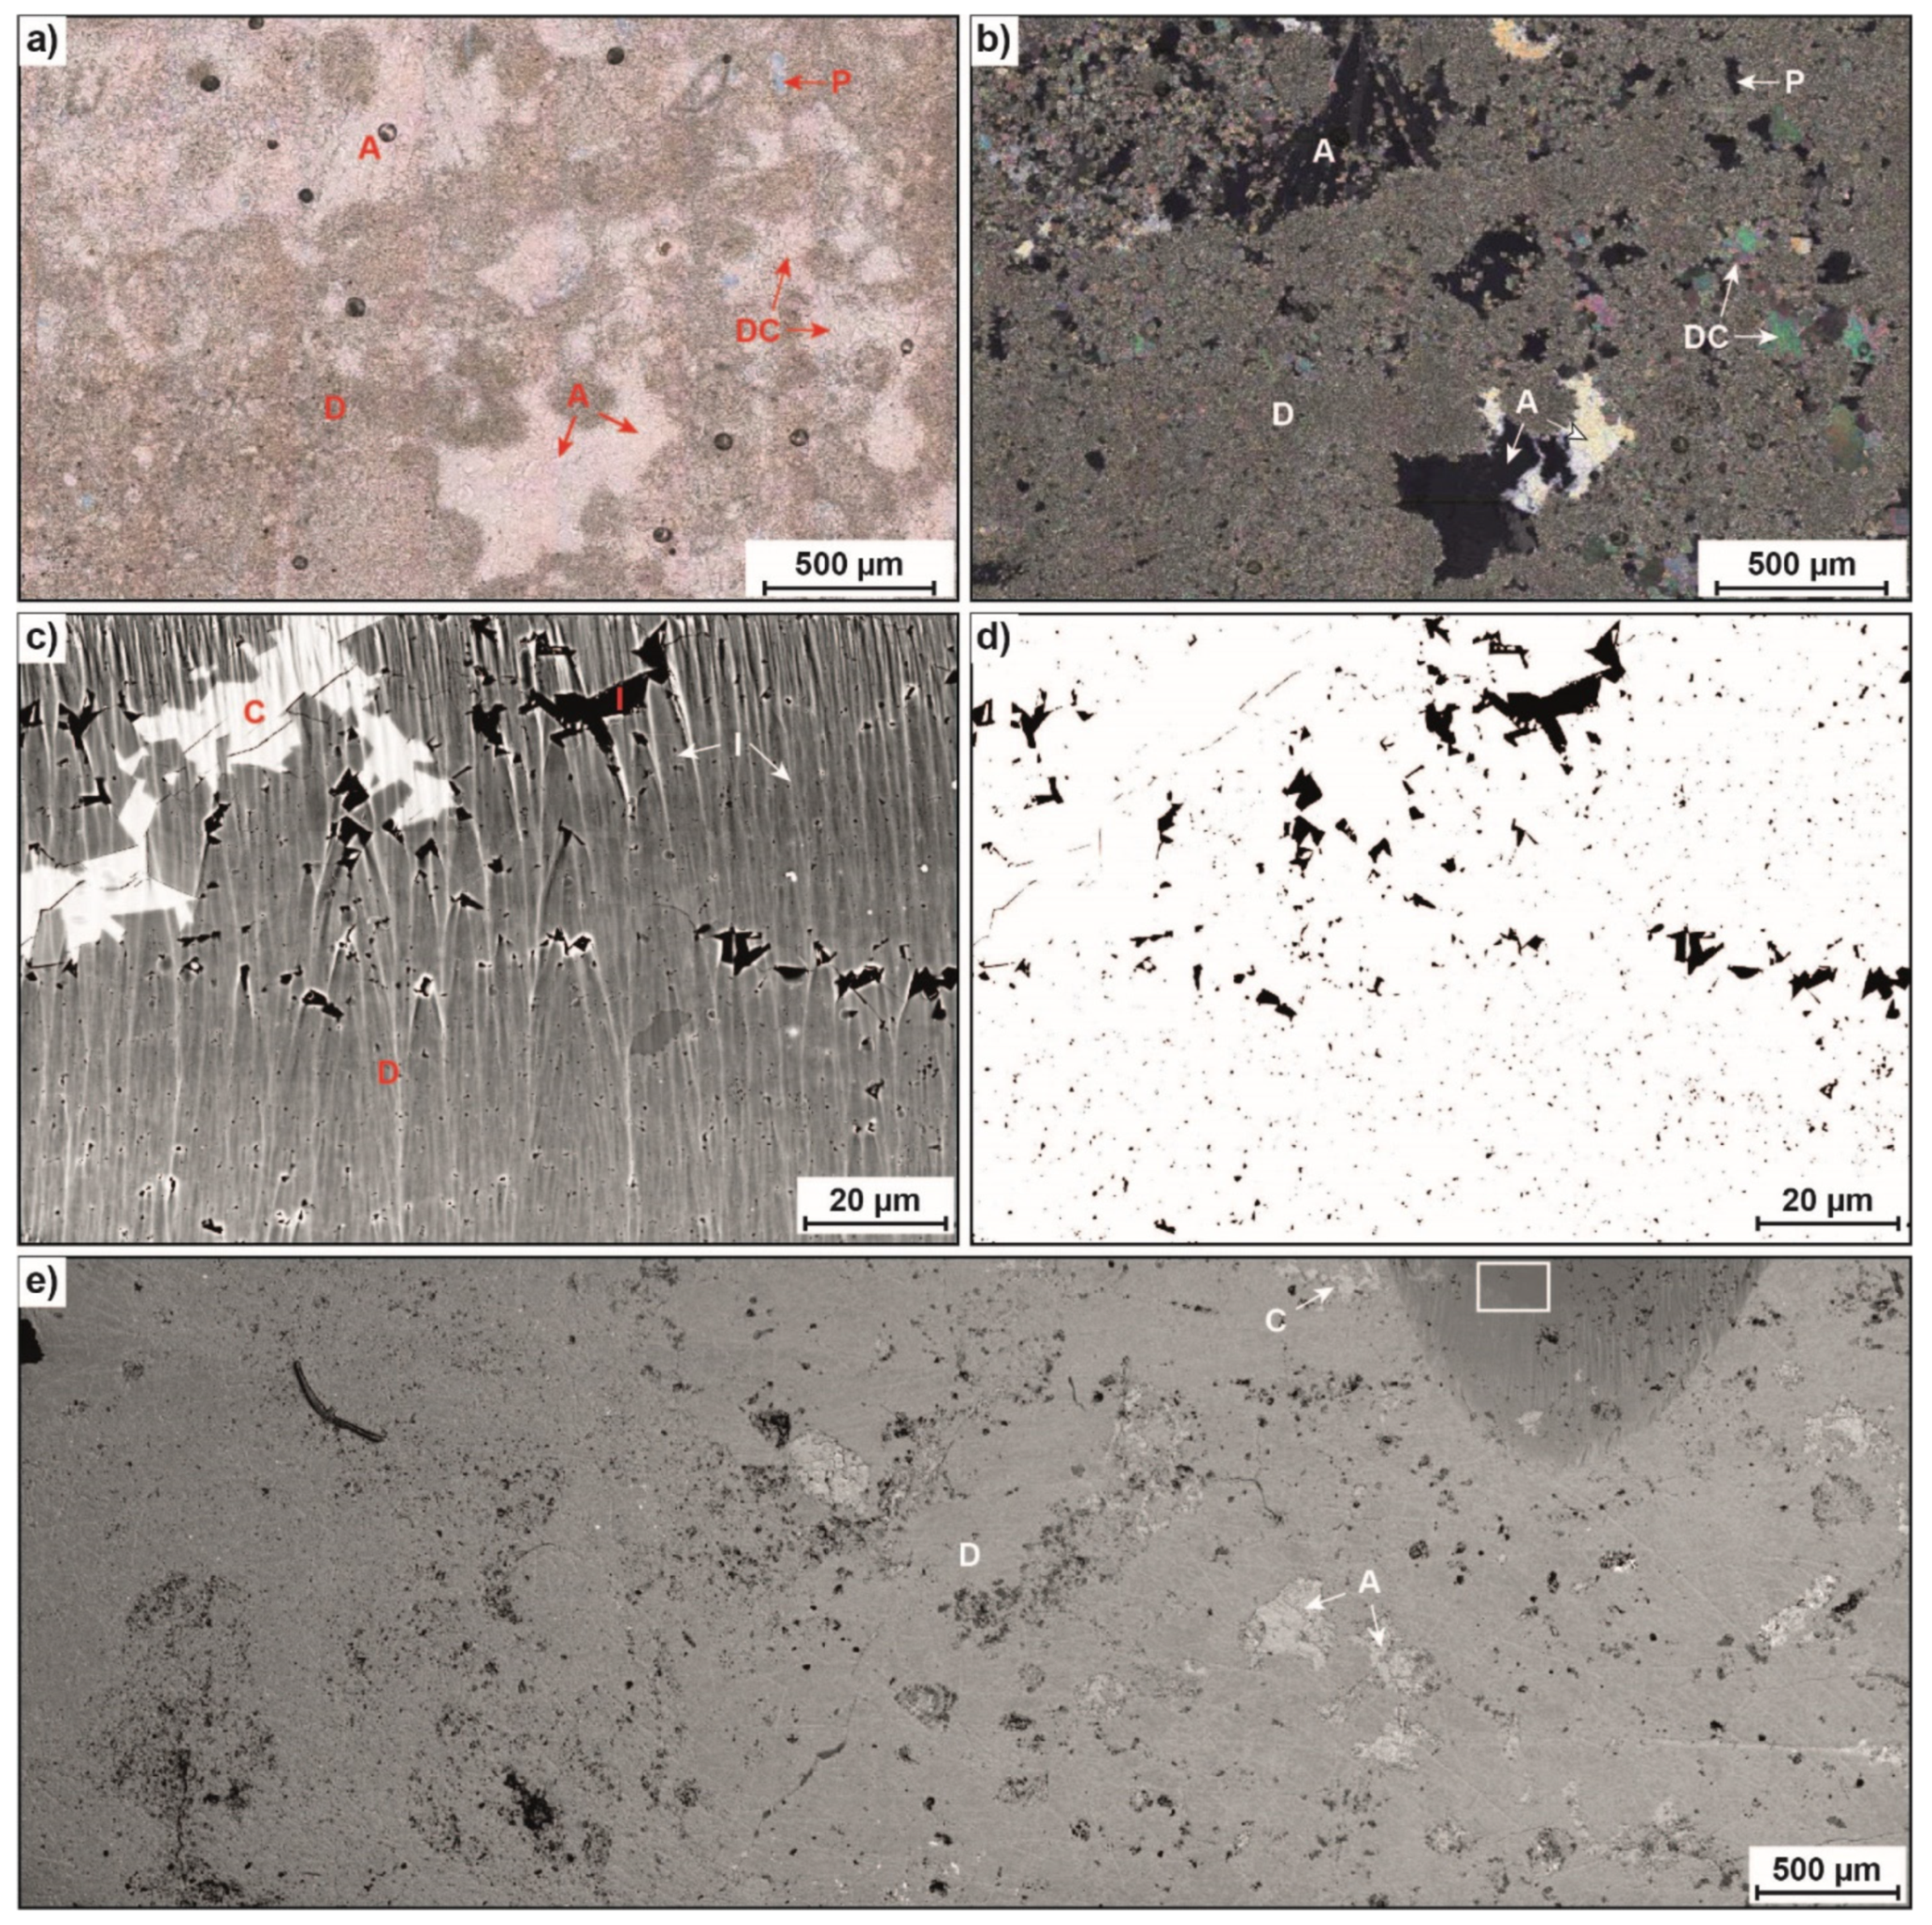
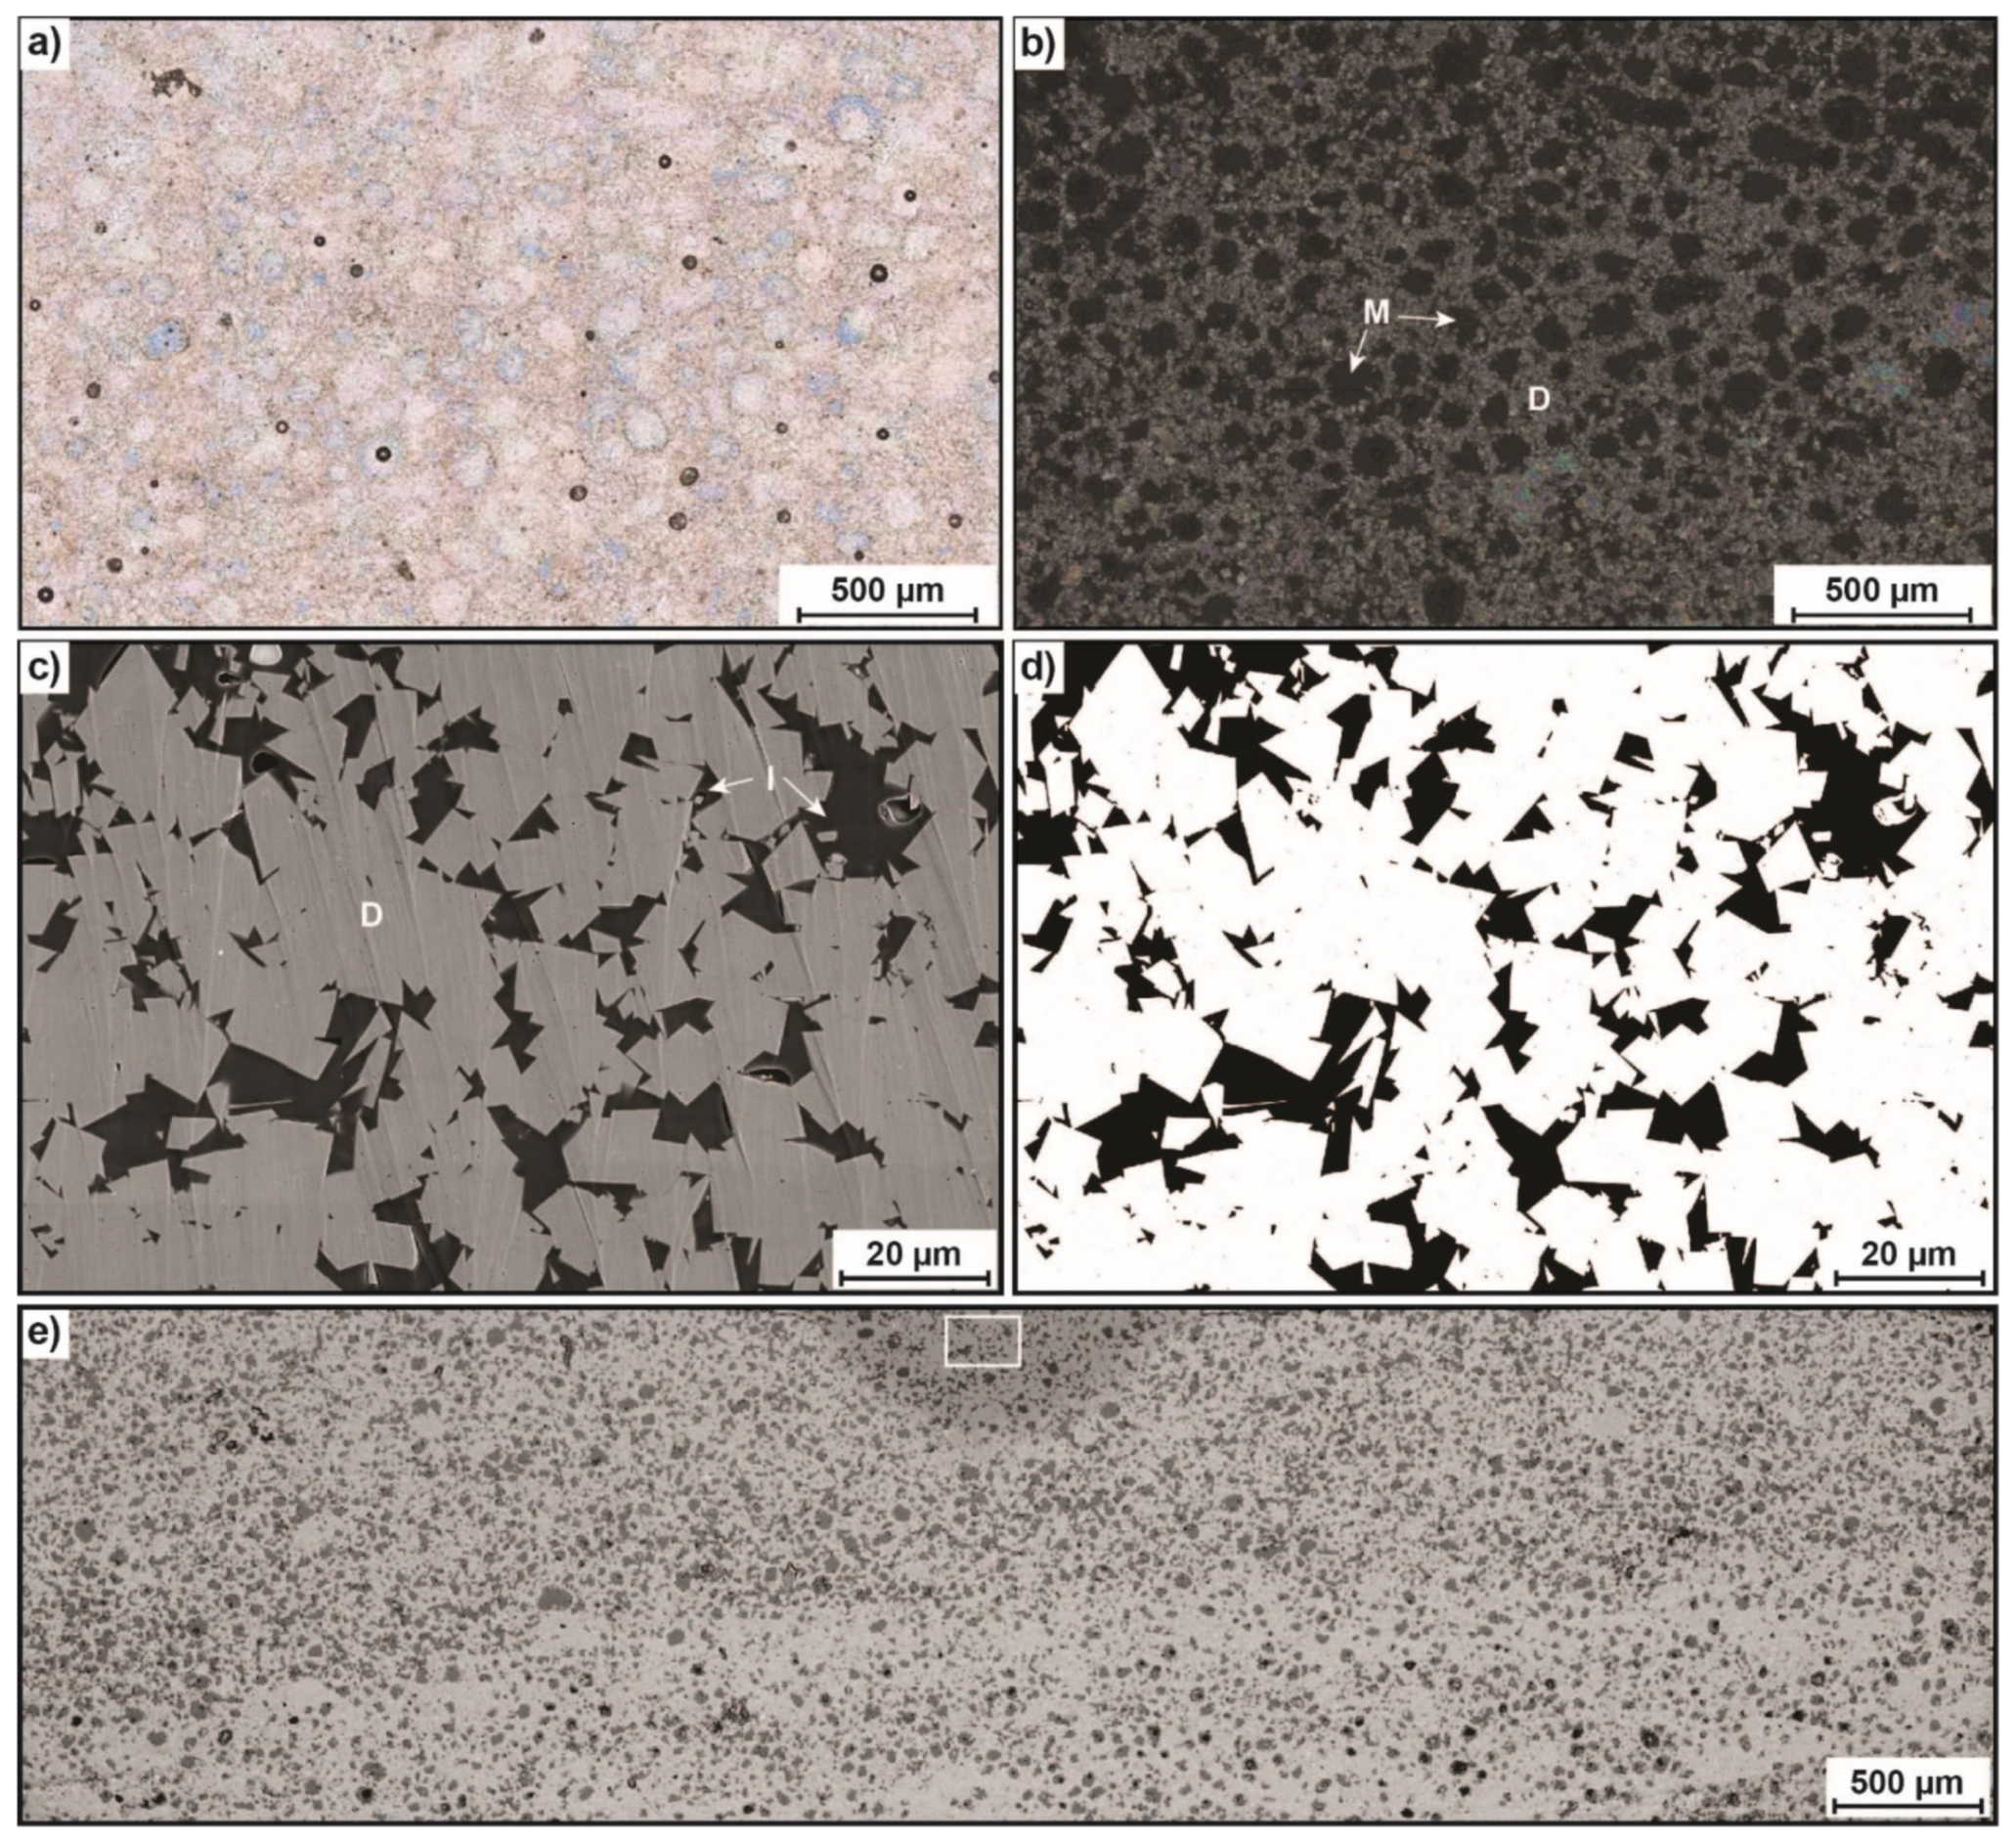
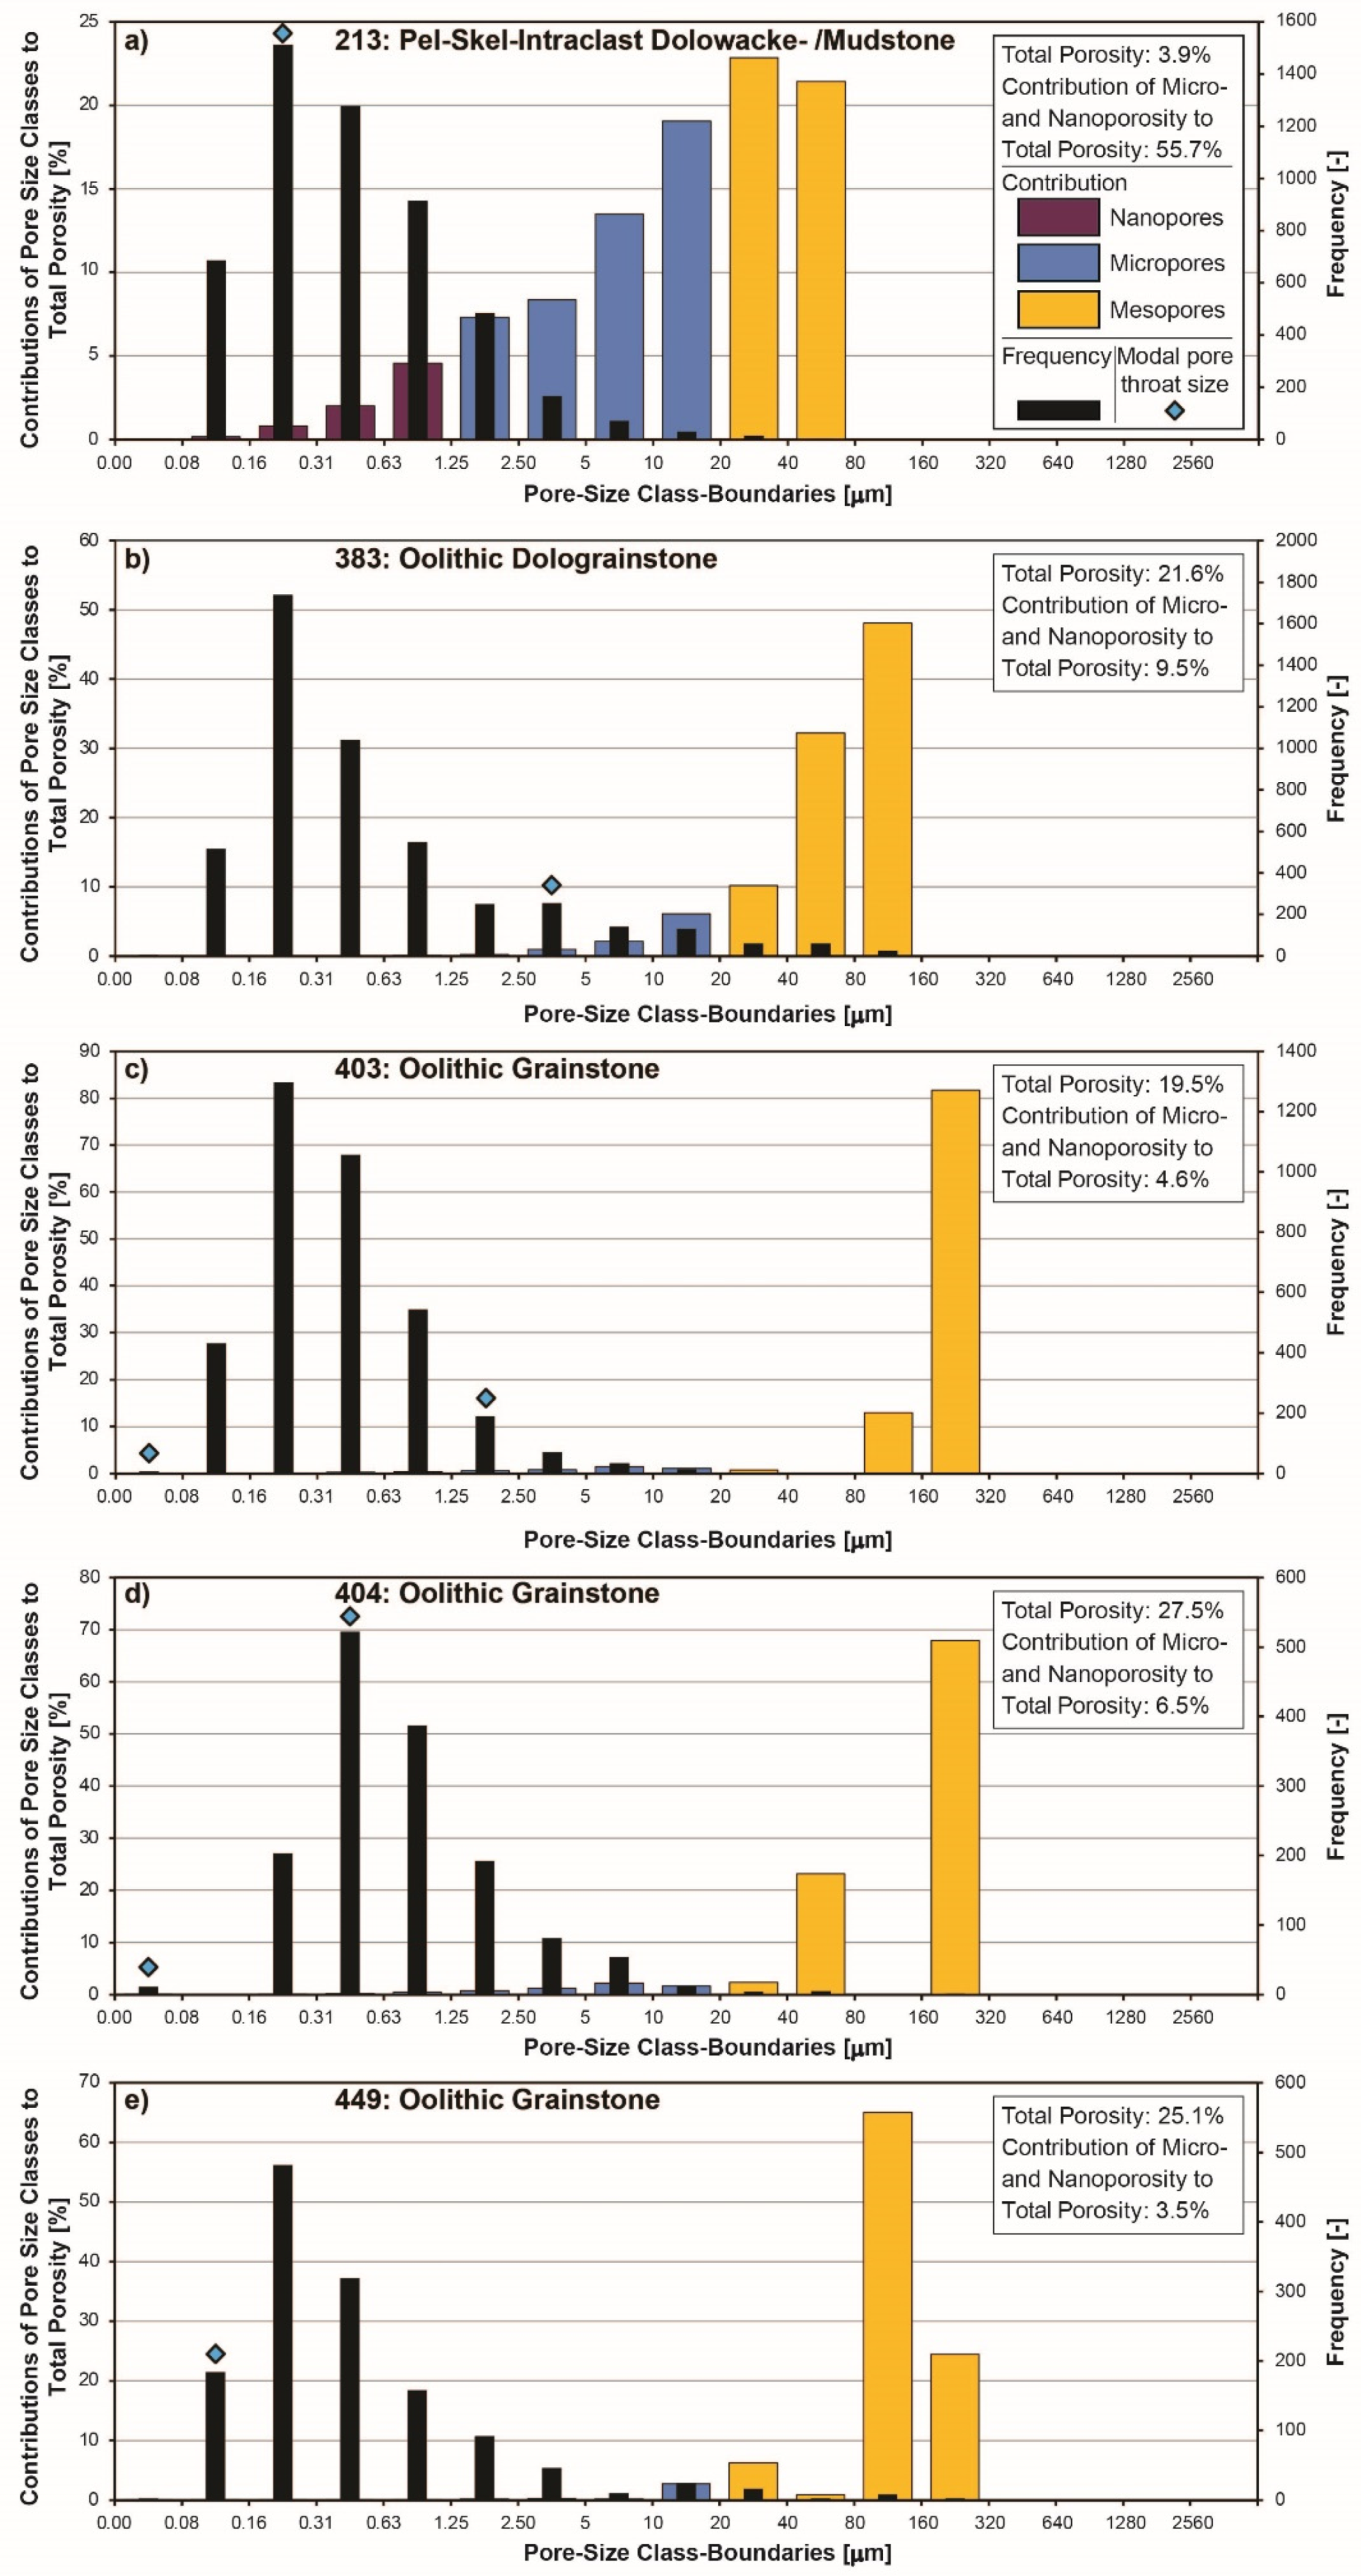
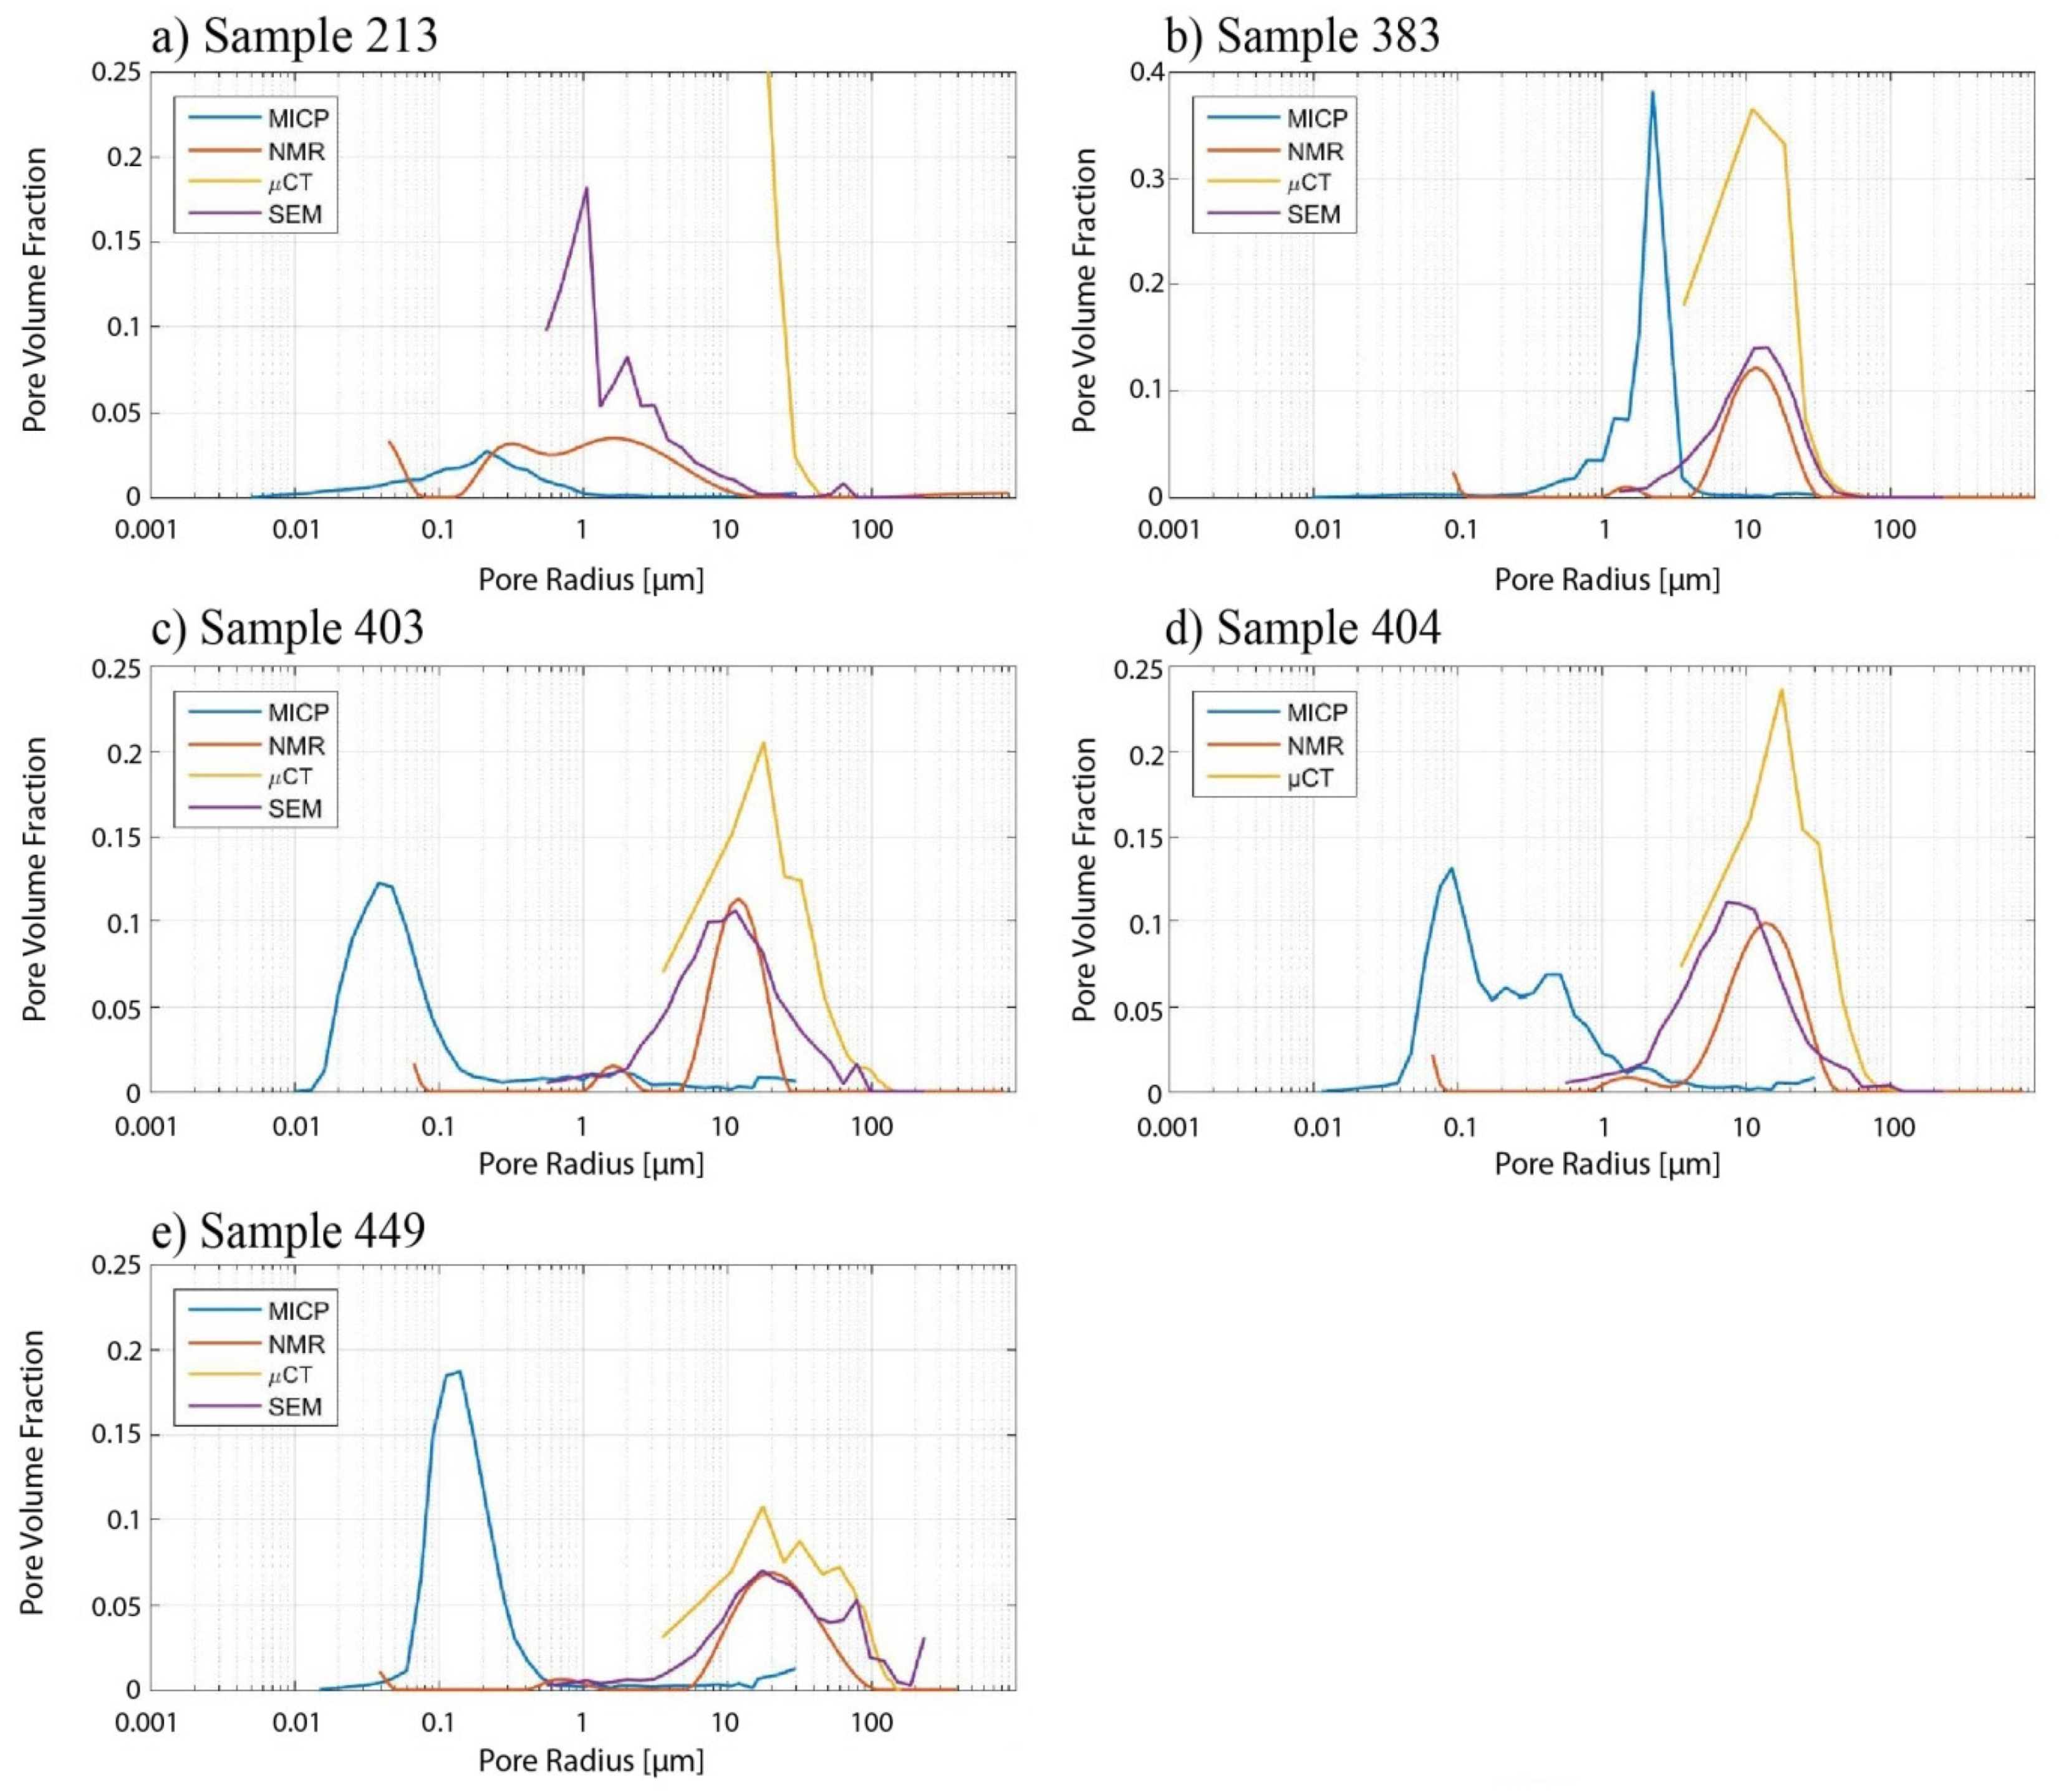
3.1. Petrographic Observations and Pore-Size Distributions

Thin-section and SEM observations illustrate the relationship between textures and pore types in the samples (Figure 4, Figure 5 and Figure 6). The thin-section of dolowackestone backshoal sample 213 reveals macropores apparent as vuggy pores, mainly caused by partial dissolution of patchy and heterogeneously distributed displacive anhydrite (Figure 4a,b). Further, SEM images (Figure 4c,d) indicate intercrystalline micro- and nanopores, hosted by aphanocrystalline matrix dolomite. This is consistent with the overall highest contribution of micro- and nanopores (~56%) to the overall lowest total porosity of ~4% based on SEM image analysis (Figure 7a, Table 3). Oolitic dolograinstone shoal sample 383 is characterized by oomoldic pores (Figure 5a,b). These are well connected by intercrystalline micro- and nanopores which are hosted by aphanocrystalline to medium-crystalline dolomite (Figure 5c,d). The total porosity of ~22% consists of ~10% micro- and nanopores and ~90% larger pores (Figure 7b, Table 3). Compared to shoal sample 383, the similar grainstone shoal samples 403, 404 and 449 are also characterized by ooids, which however are bigger in size and only partly dissolved for the most part (Figure 6a,b). Most of the moldic pores show remains of the ooid lamination. The high-resolution SEM images (Figure 6c,d) reveal mostly tight calcite-cement mosaics with only minor amounts of intercrystalline pores which restrict the connectivity between the moldic pores. Pore sizes show bimodal distributions as their pore classes can be divided into micropores inside partially dissolved molds (≤20 µm) and interparticle as well as moldic pores (>20 µm). Their frequency distributions reveal a low contribution of very small but most abundant micro- and nanopores (~3–7%) to high total porosities (~19–27%) (Figure 7c–e, Table 3).

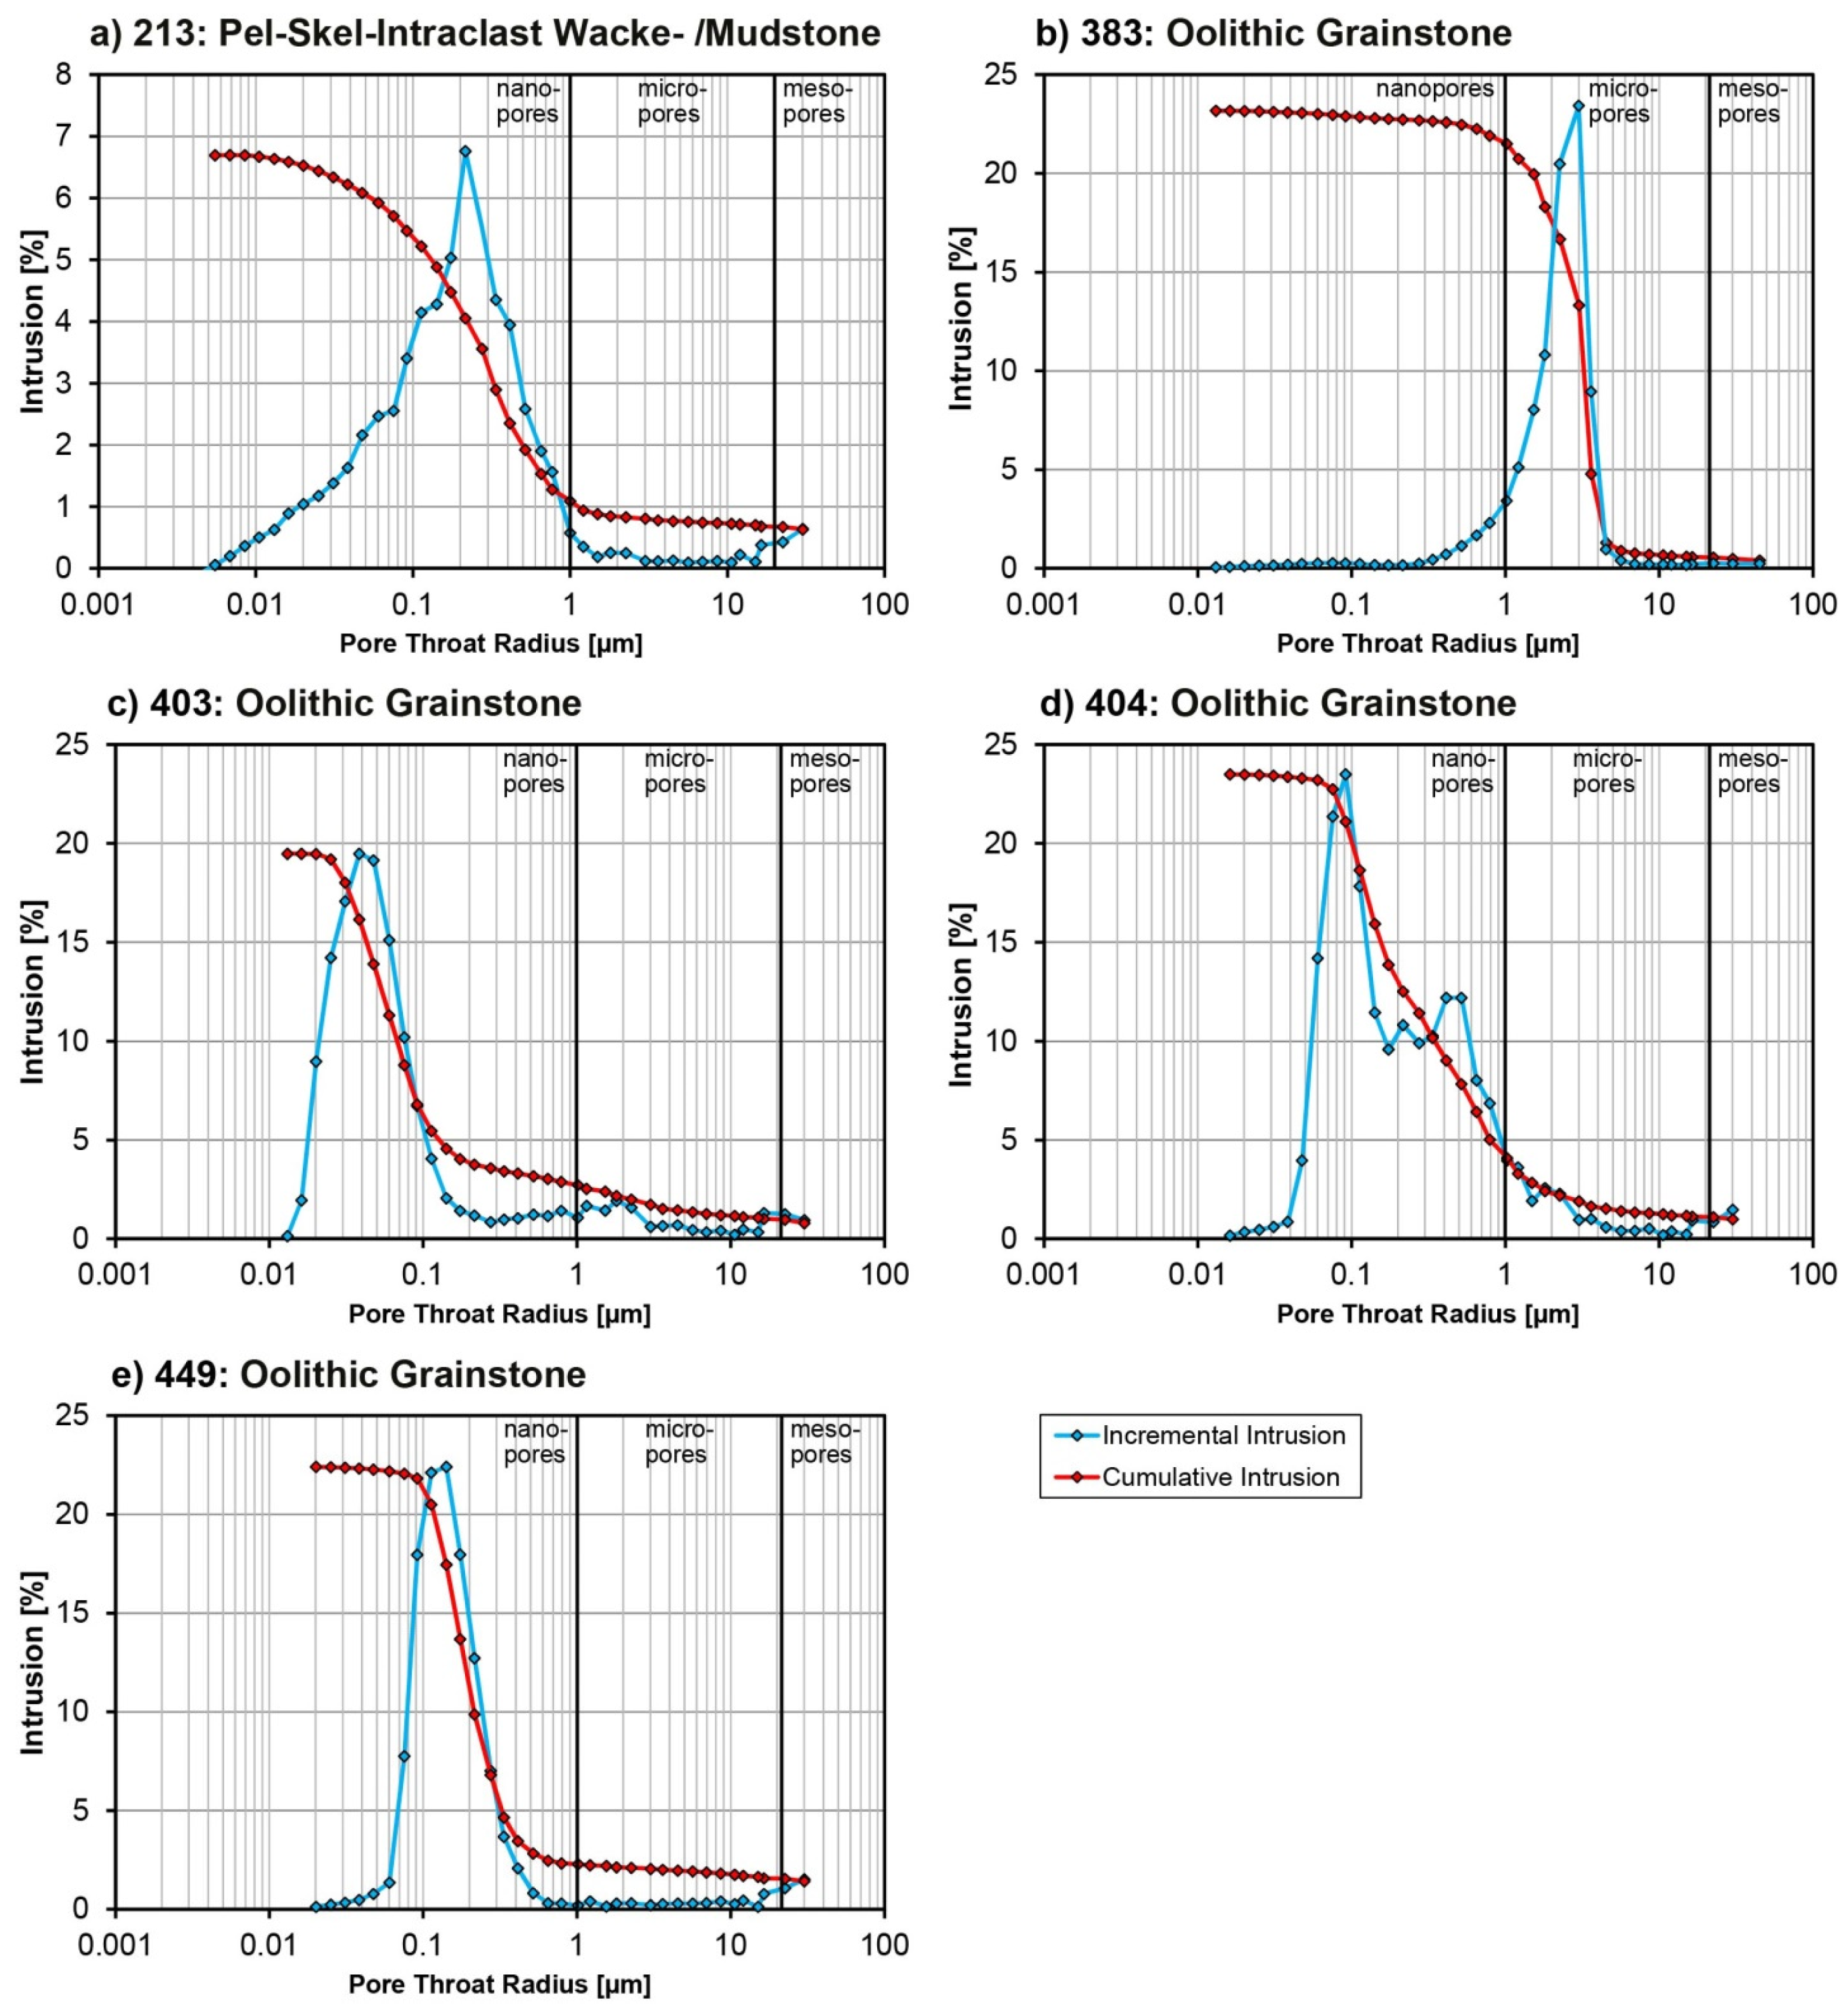
3.2. Pore-Throat Size-Distribution

Mercury intrusion in wackestone backshoal sample 213 indicates the unimodal and comparatively broad pore-throat distribution of the intercrystalline pores with its peak at 200 nm (Figure 8a) which is in accordance with the comparably low permeability (Table 3). The low cumulative intrusion is consistent with the interpreted porosity of 3.9% from SEM image-analysis (Figure 7a). Further, the modal pore-throat size is consistent with the most abundant of pore-size classes (Figure 7a).
The differential intrusion in dolograinstone shoal sample 383 indicates a narrow pore-throat distribution with its peak at 3 µm, which is the largest pore-throat size of all analyzed samples (Figure 8b, Table 3). This correlates with the diameter of intercrystalline pores hosted by up to medium-crystalline dolomite crystals (Figure 5a,b), which connect the high porous moldic pores and therefore explains the comparatively high permeability of 25.6 mD (Table 3). The high cumulative intrusion is consistent with the interpreted porosity from SEM image-analysis (Figure 7). It is also the only sample where the modal pore-throat size is higher than the highest frequency of pore sizes (Figure 7b). The differential intrusion of grainstone shoal samples 403, 404, and 449 indicates pore-throat size distributions with main peaks between 0.04 and 0.13 µm (Table 3). These low diameters of interparticle pores hosted by the almost tight calcite cements strongly limits fluid flow between the highly porous moldic pores, which prevents them from contributing to effective porosity. Another indicator for this, are modal pore-throat sizes which are in the range or smaller than the most abundant pore-sizes. The high cumulative intrusion is consistent with the interpreted porosity from SEM image-analysis.

3.3. Electric Resistivity Measurement

The cementation exponent (1.8) of the backshoal sample 213, derived from the resistivity data, is notably smaller than the cementation exponents of the shoal samples which vary around 3 (Table 4). Further, despite the low, often patchy and heterogeneously distributed porosity, dolomite sample 213 (backshoal facies) shows the lowest cementation exponent of the five samples due to its well-connected intercrystalline porosity. Micro- and nanopores form part of this intercrystalline porosity and therefore most likely contribute to effective porosity. While analyzing the tortuosity, again, smaller values for the dolomite samples and larger values for the calcite samples can be recognized (Table 4). This suggests that the dolomitic samples have shorter and better-connected conducting channels than the calcitic samples. Plotting the observed permeabilities against the inverse formation factor, a power-law behavior with an R2 value of 0.9674 can be observed (Figure 9). This suggests that pore connectivity and effective porosity, as they determine the formation factor (Equation (1)), are the major influencing factors on permeability and that, according to equation 1, the studied samples have similar hydraulic radii (Table 1). If this is valid for the whole Khuff formation, resistivity could be used to predict permeability.
Correlating resistivity derived hydraulic radii with MICP-derived pore-throat radii, both are similar for samples 213 and 449 (Table 3). Pore-throat sizes of samples 403 and 404 are characterized by a bimodal distribution that cannot be depicted by hydraulic radii. However, hydraulic radii of both samples are in the range of their respective pore-throat sizes (Table 3). The hydraulic radius of sample 383 is somewhat smaller than its modal pore-throat size (Table 3). This can be explained by the pore-throat distribution being skewed towards large radii. Thus, the modal pore-throat size does not take smaller but relevant pore-throat sizes into account (Figure 8b). Overall, the resistivity derived hydraulic (effective) radius provides a good estimate for the pore-throat sizes contributing to fluid flow in the observed samples.

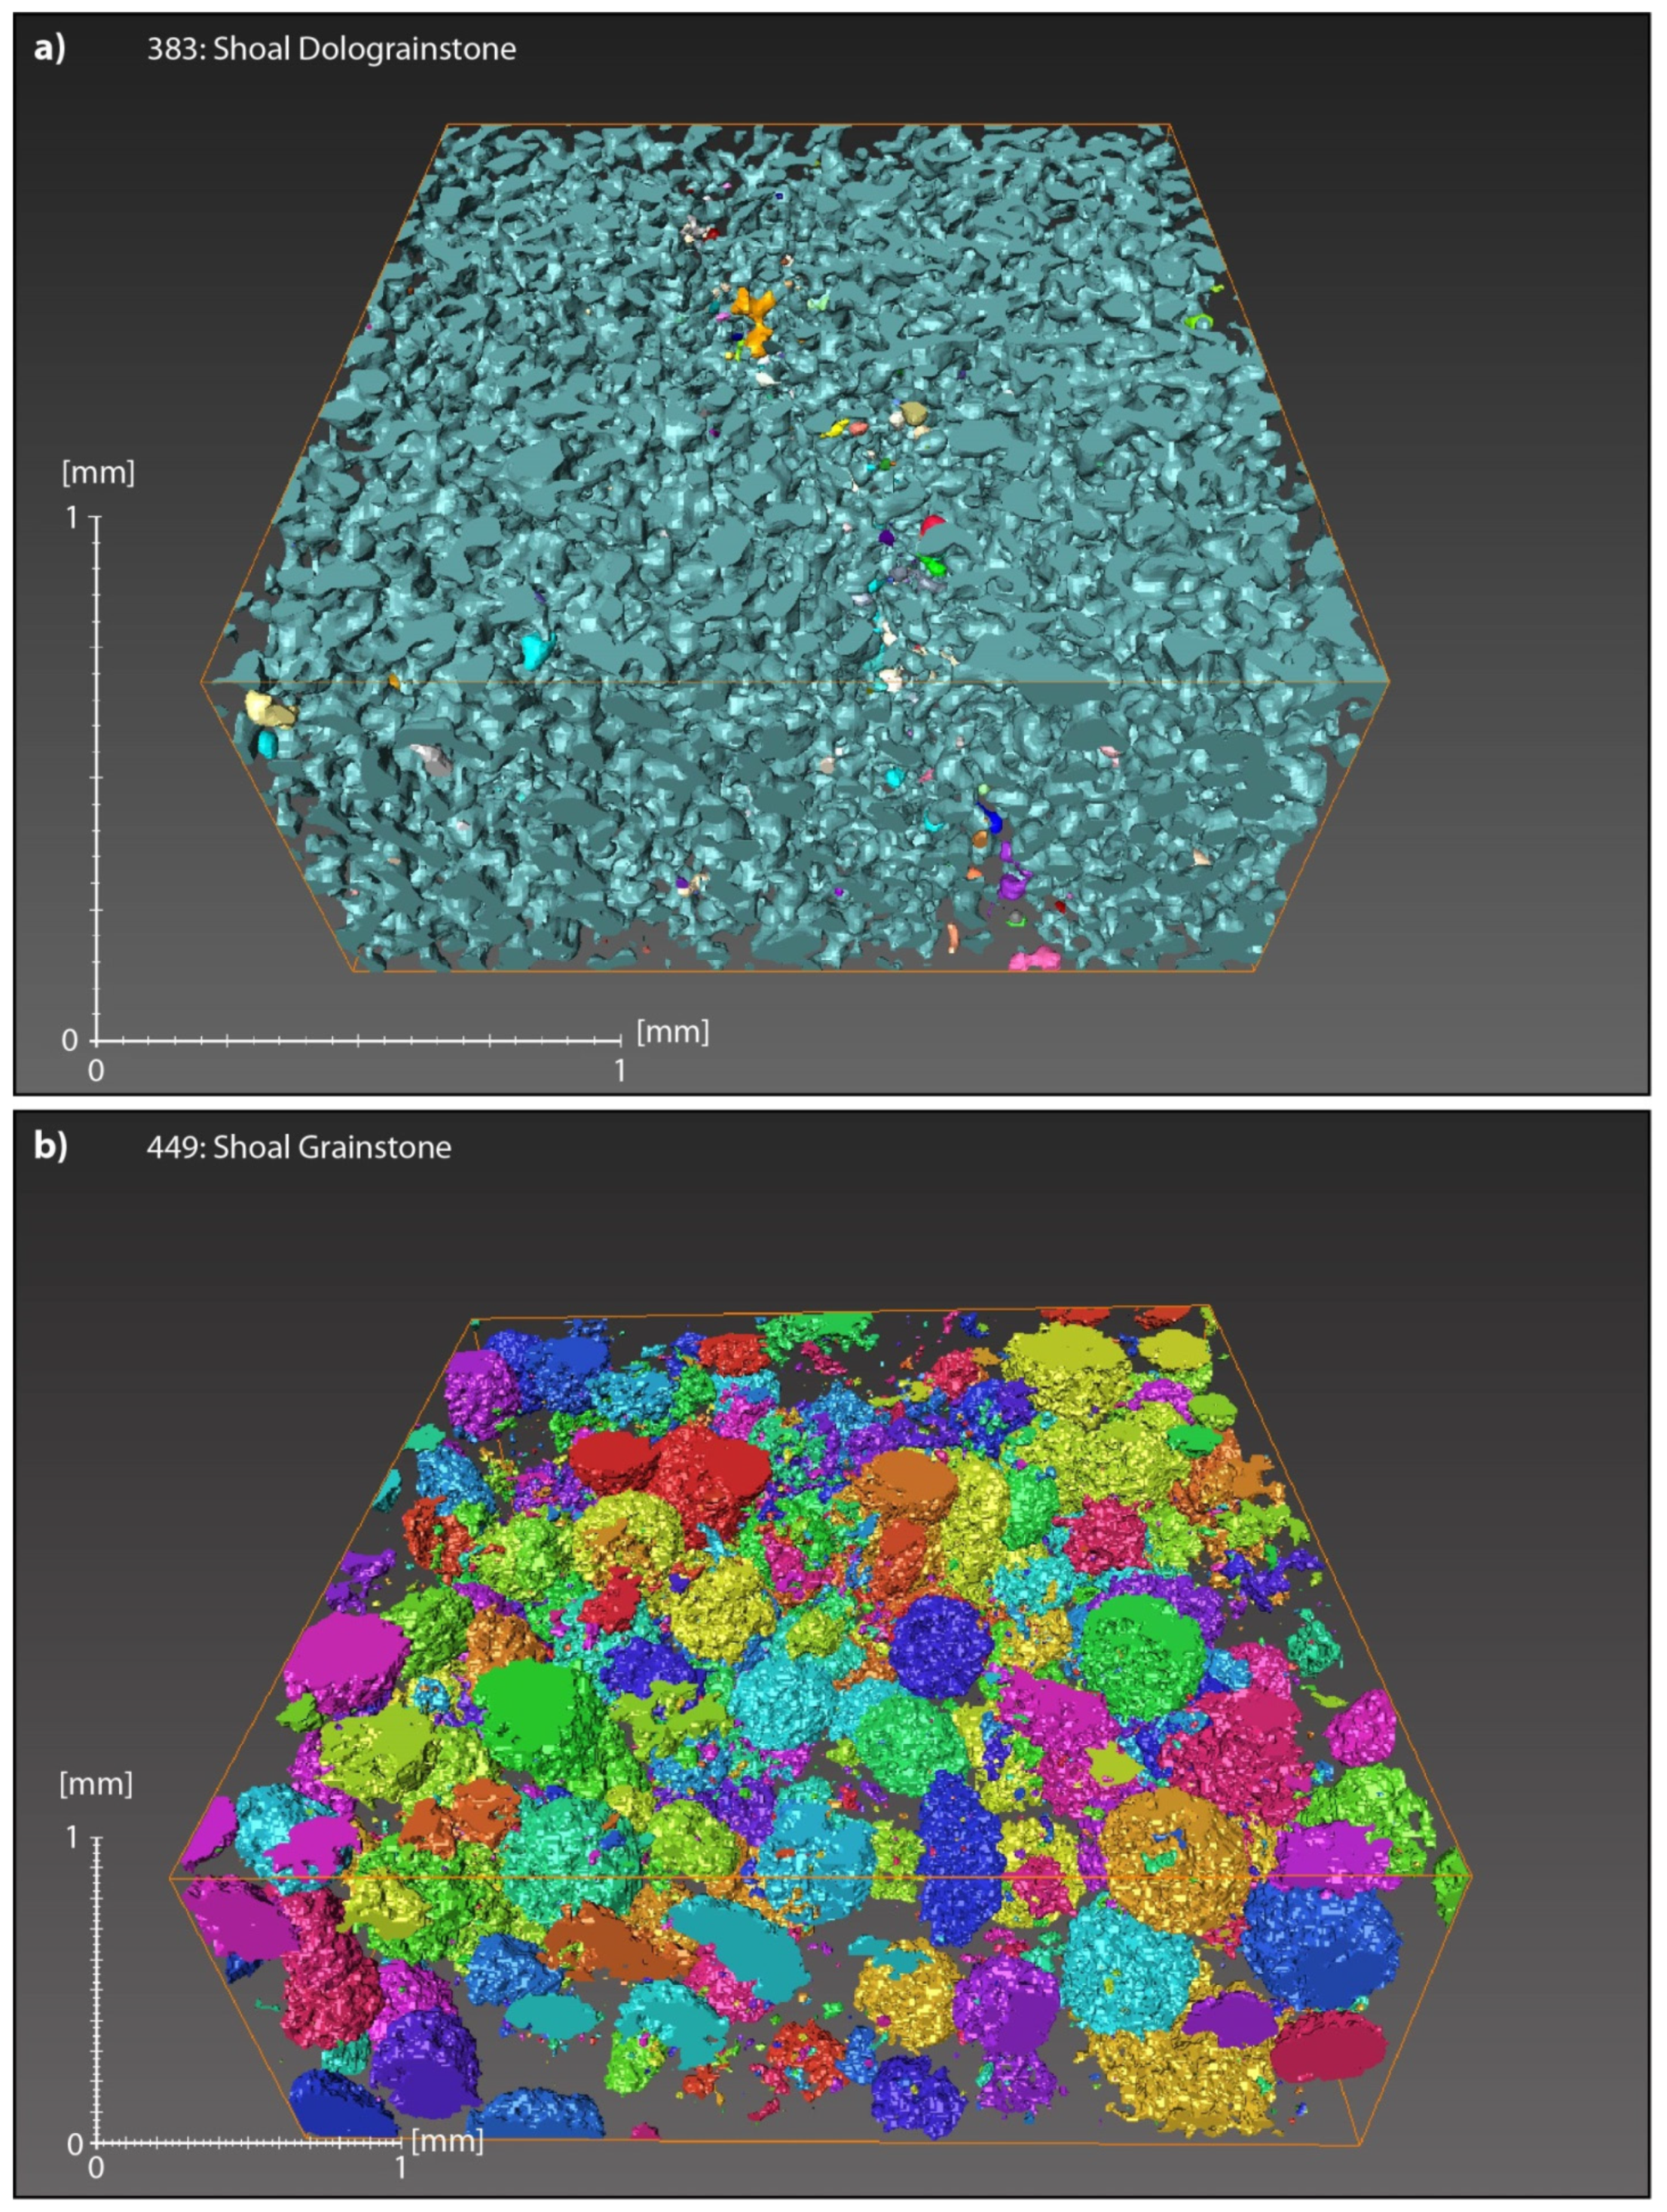
3.4. Micro-Computed Tomography (µCT)
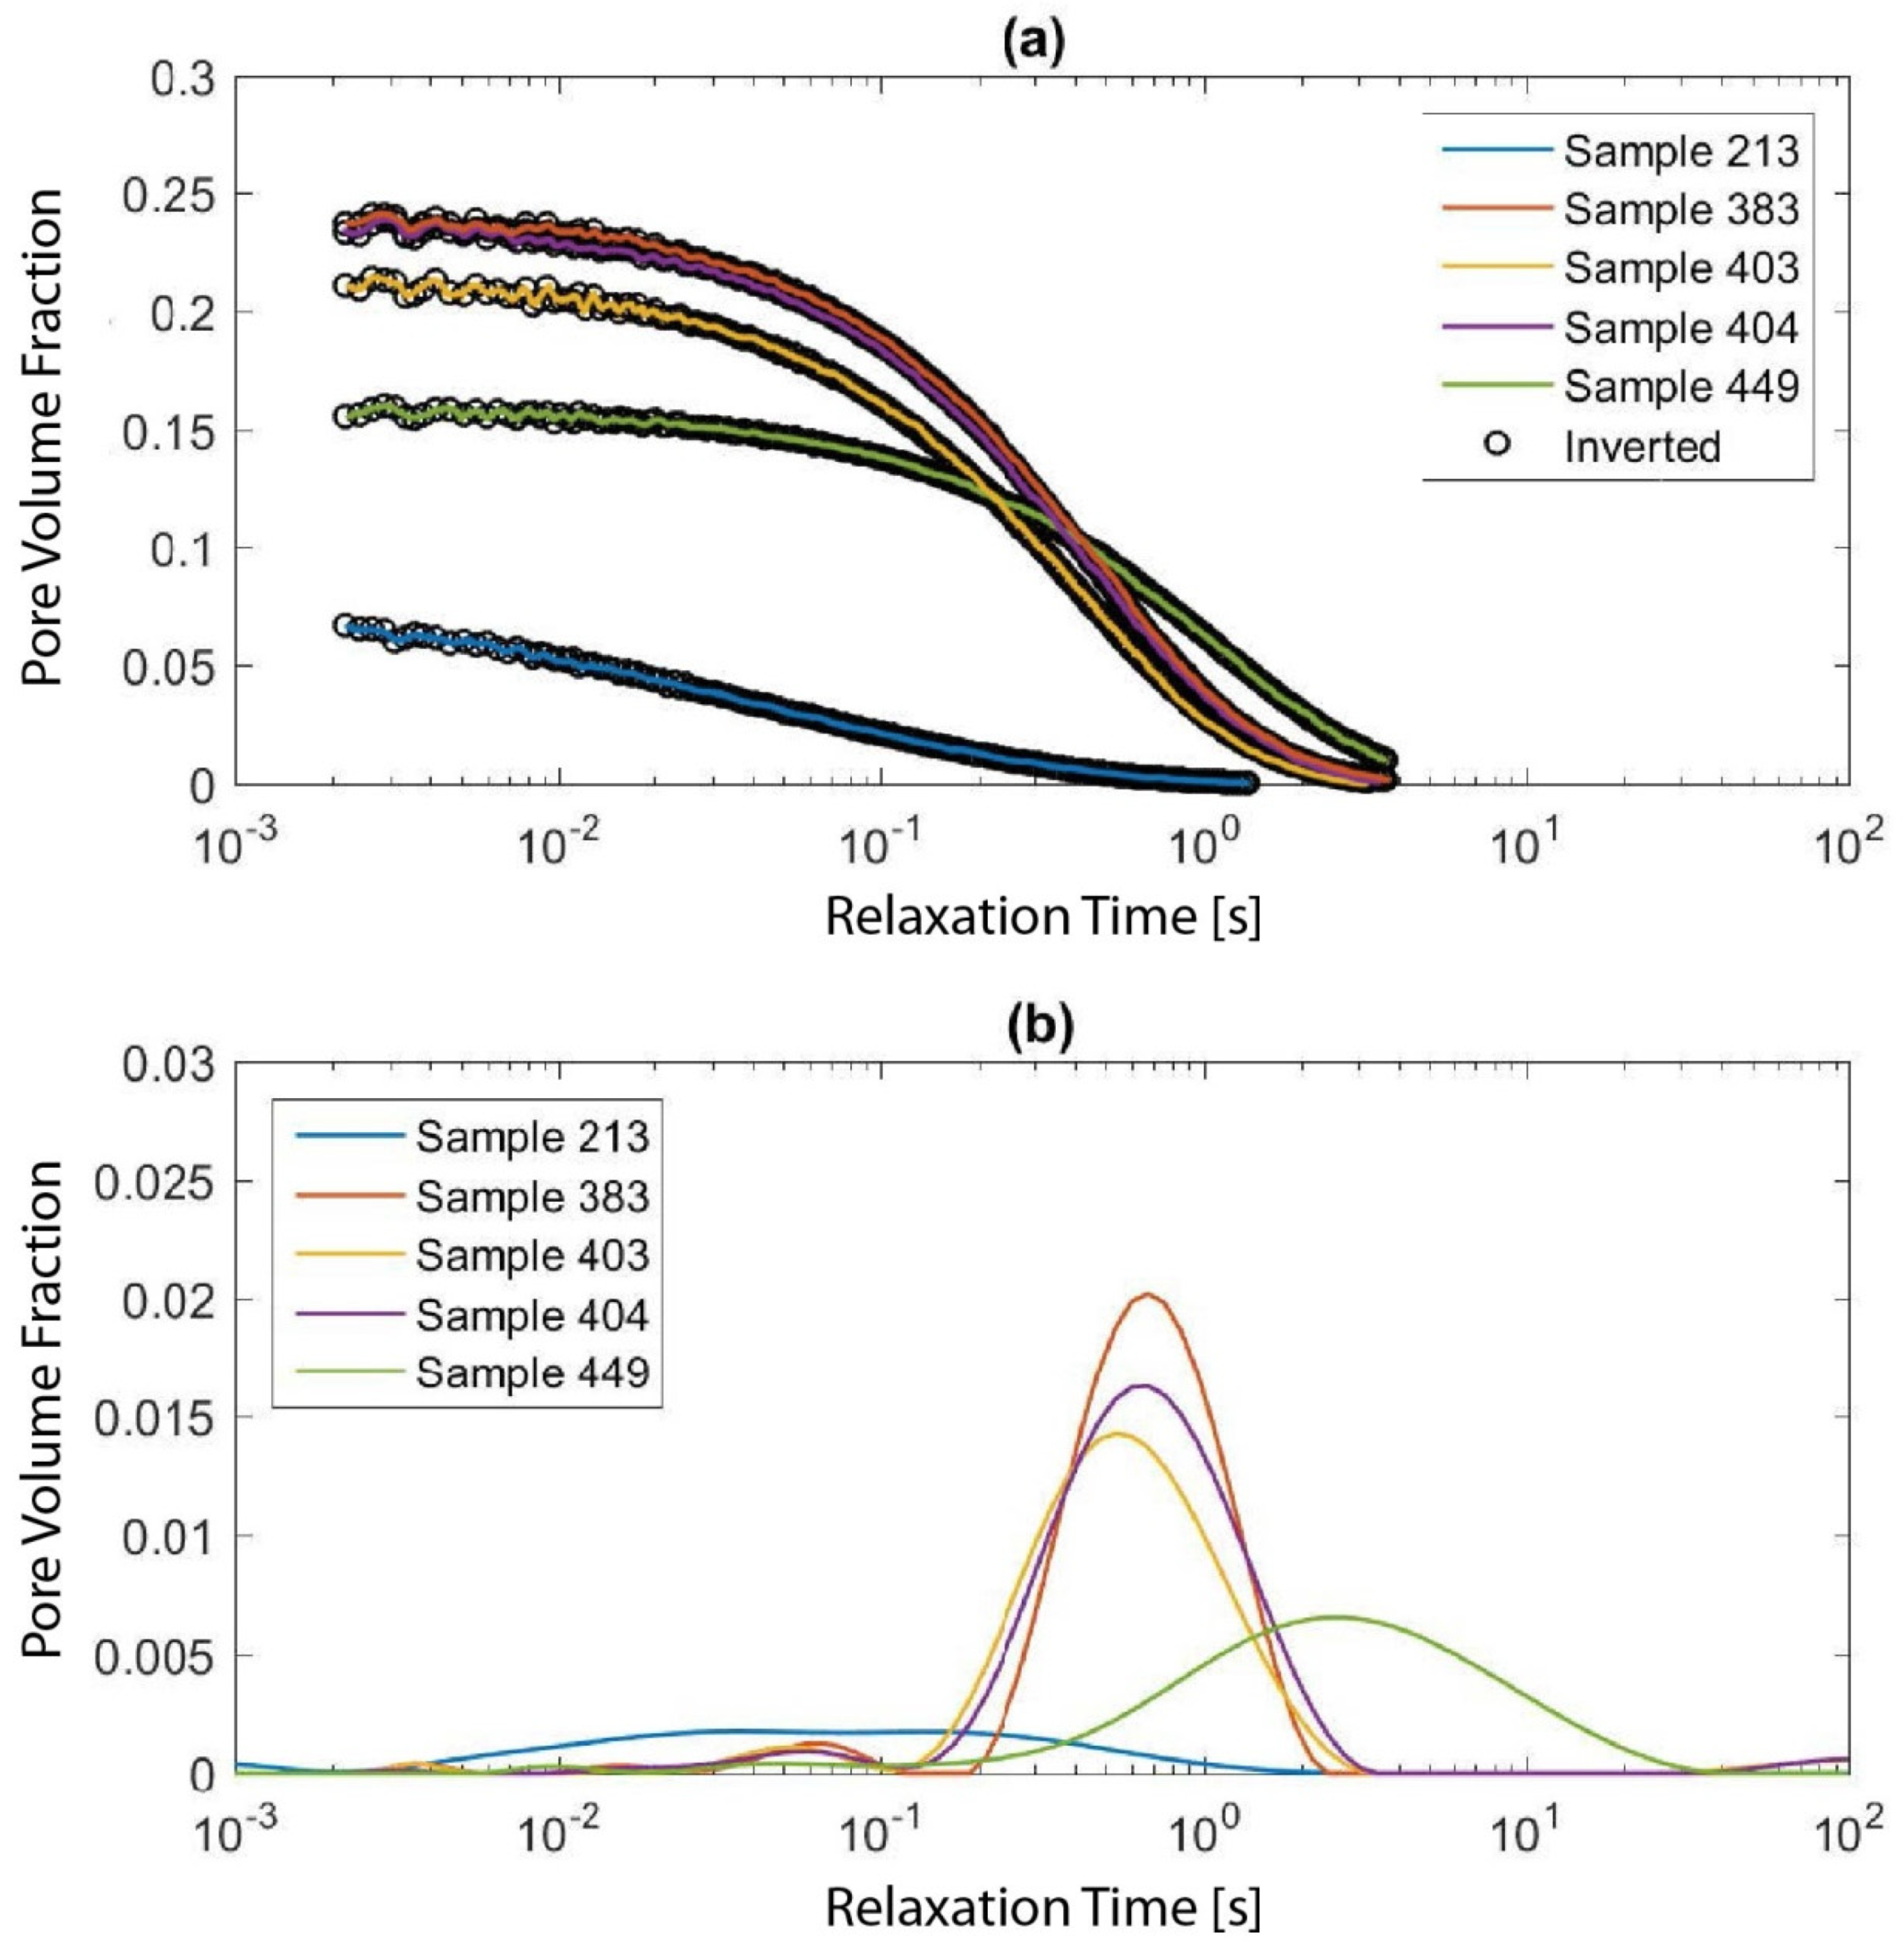
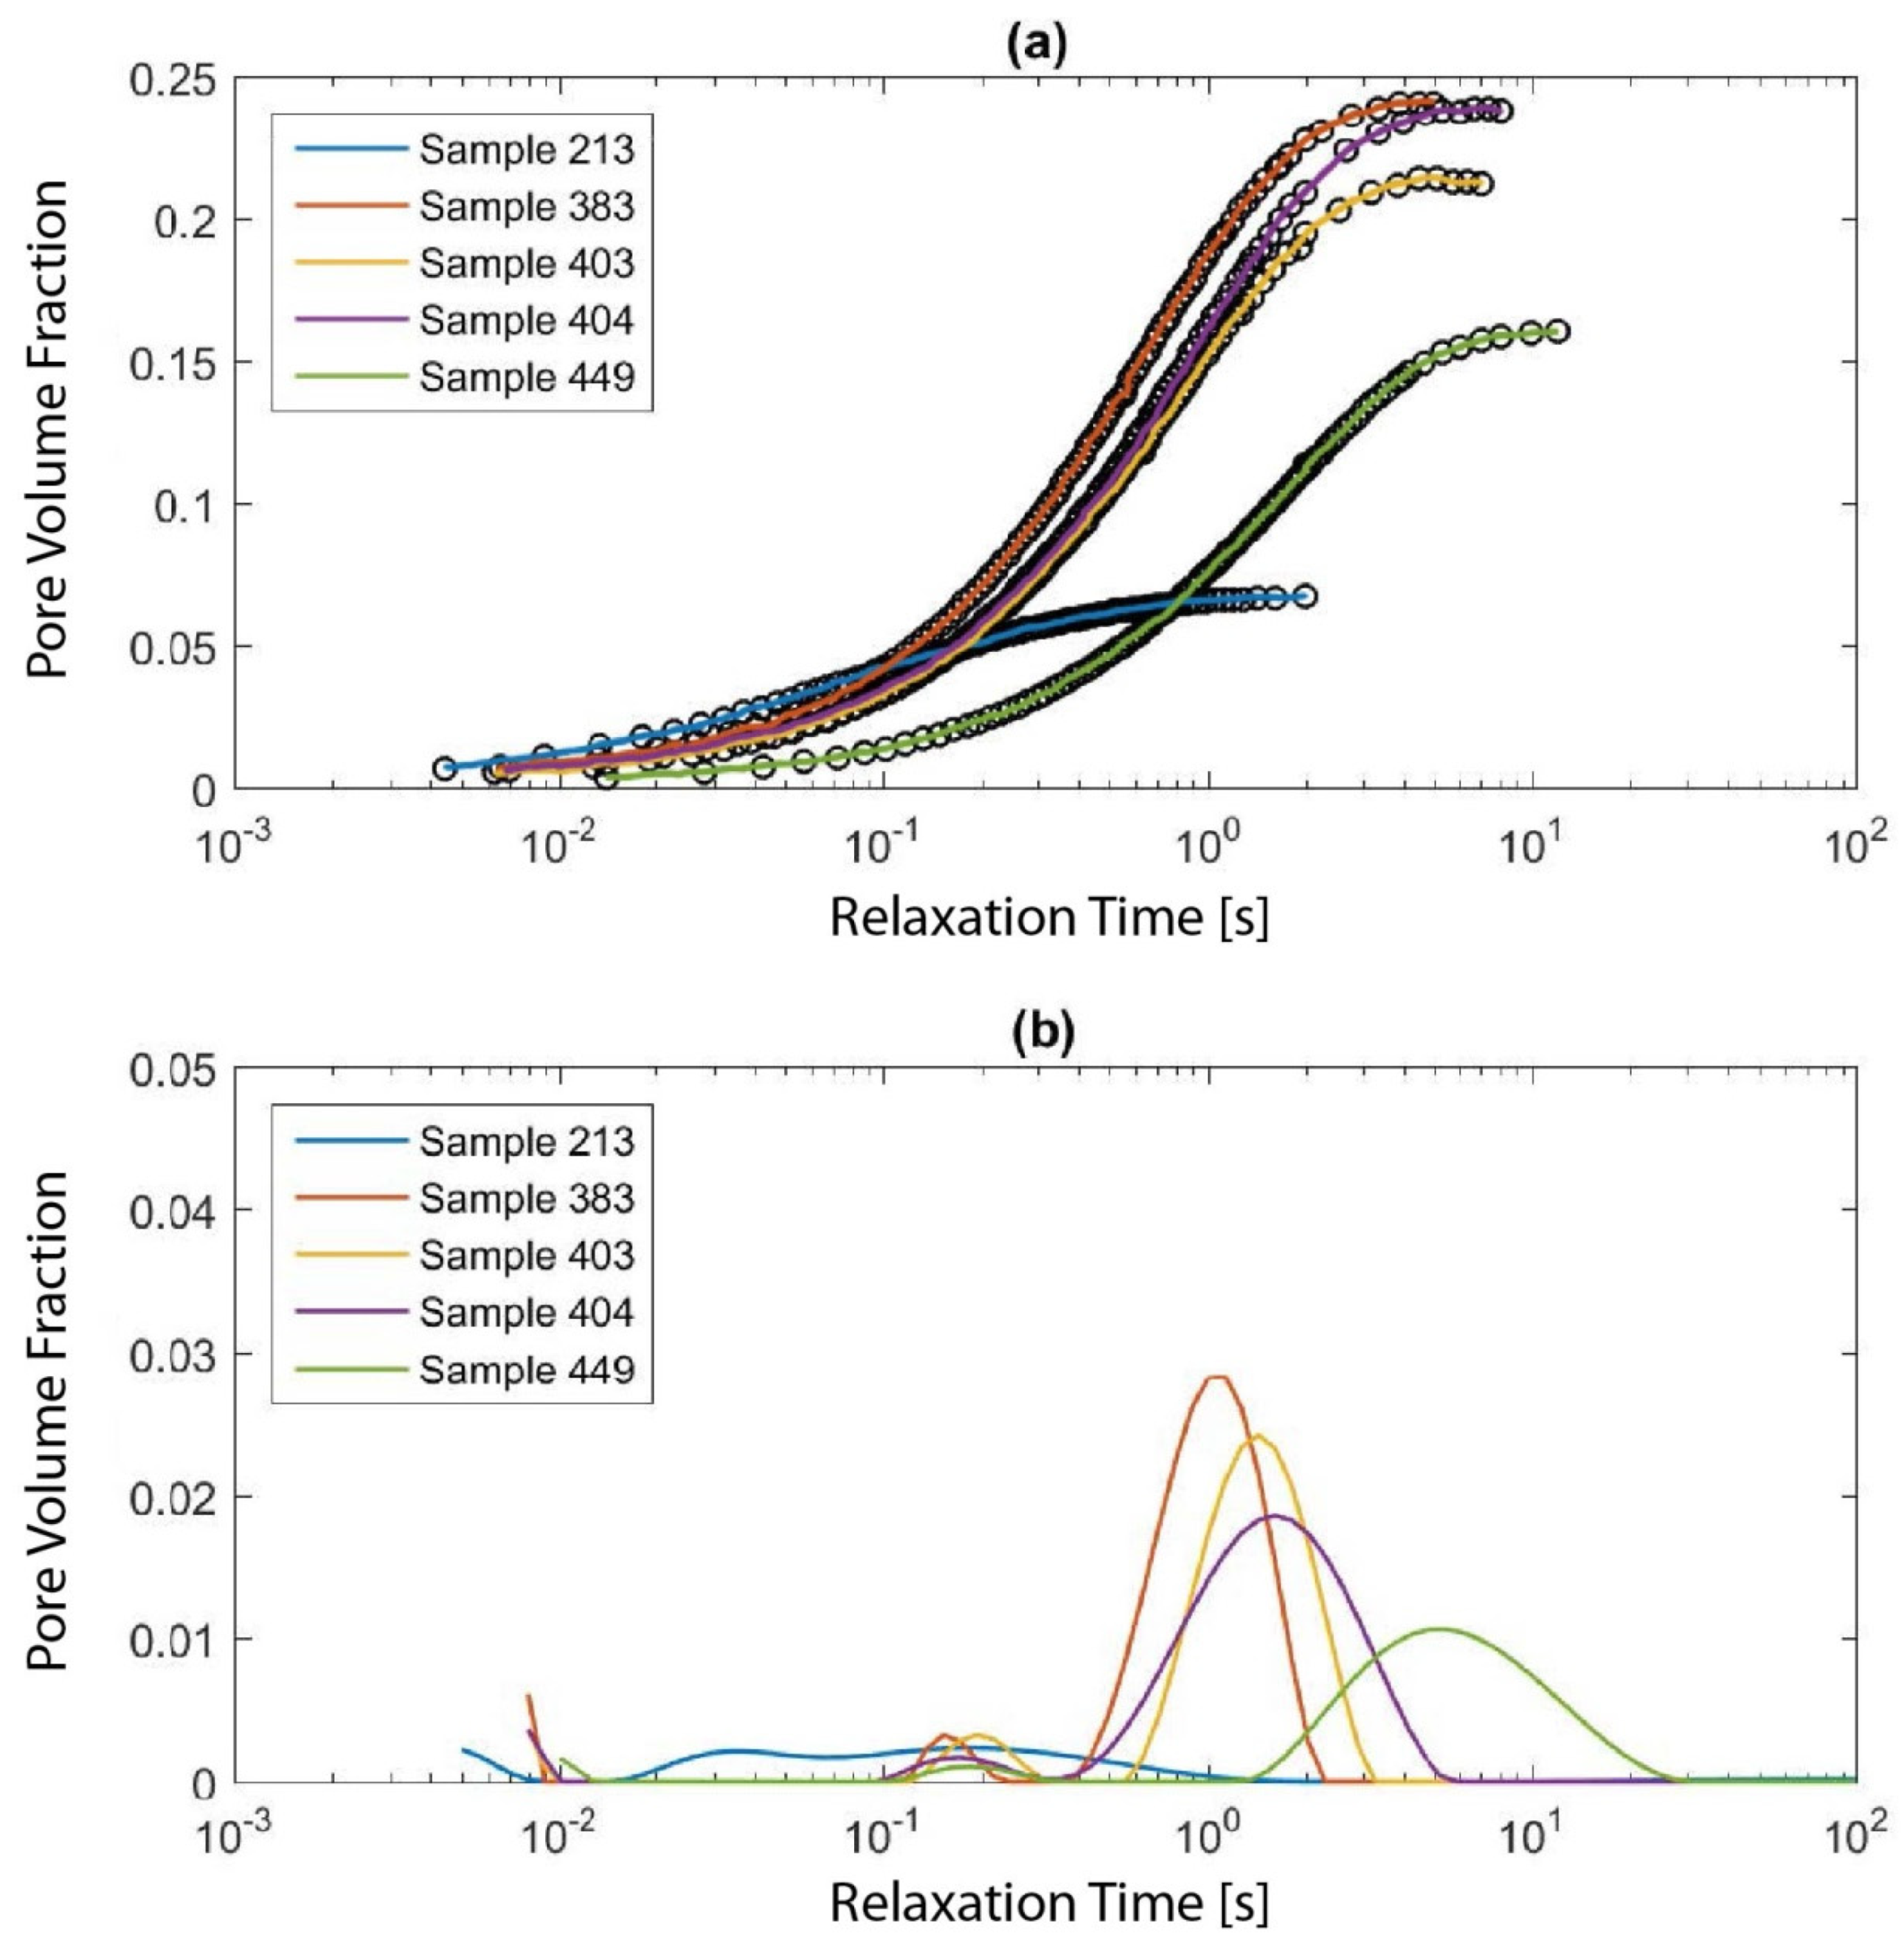
In the processed µCT images, wackestone backshoal sample 213 is characterized by a heterogeneous distribution of porosity (black regions in Figure 10a). In the upper right corner of the figure, where the brighter circular structures are found, fewer pores occur. The brighter structures indicate higher densities and are interpreted as anhydrite. Therefore, we suppose that anhydrite reduced the porosity within the sample. Dolograinstone shoal sample 383 (Figure 10b), in contrast, shows a homogeneous porosity distribution. The observable pores in shoal grainstone sample 403 (Figure 10c) seems to be a good example for the partial volume effect where one CT voxel encompasses small pores and carbonate crystals with highly divergent densities. This mixture of pores and solid material within one CT voxel results in an averaging of the imaged grey values for this voxel. The complete volume of the voxel might, therefore, be interpreted as porespace if the averaged grey value is below the threshold used for the separation between pores and rock matrix. SEM images (Figure 6c,d) show moldic pores which are not fully dissolved for the most part in grainstone shoal samples 403 and 404. µCT only shows pores above the resolution limit and the derived porosities should, therefore, be lower than He-, NMR-, MICP-, and SEM-porosities. However, the remaining calcite crystals inside the moldic pores of grainstone shoal samples 403, 404 and 449 are below the resolution of the µCT and are detected as pore space due to the partial volume effect. Therefore, pore-size distributions derived from µCT will overestimate pore sizes for this facies. In this study an anisotropic diffusion filter was used to remove noise. Comparably, moldic pores in grainstone shoal sample 449 (Figure 10d) show less calcite remains, which leads to a more homogeneous background after diffusion processing (Figure 10d). CT-porosity (Table 3) is derived from calculations after single threshold diffusion processing.
Compared to SEM-derived pore-size distributions, the distribution curves based on diffusion processing show larger pores (Figure 11a). In contrast, the ring processed distributions show comparable results (Figure 11b). This suggests a greater influence of the partial volume effect on the inhomogeneous behavior of the µCT slices rather than noise. Even though double-thresholding removed parts of the small pores, the pore-size distribution curves do not differ significantly. This is due to the limited amounts of pores which are removed from the image. Further, a comparison of the Otsu and the single-threshold reveals that distributions are less sensitive to changes in the global threshold as for example to porosity (Figure 11) as the number of pore voxels is directly proportional to porosity but only proportional to the cubic root of the radius.
Volume reconstruction (Figure 12), processed using the Aviso software, shows well connected moldic and intercrystalline pores with only minor isolated pores in dolograinstone shoal sample 383. However, the resolution of the µCT images cannot resolve the smallest pores in the low micro- to nanopore range (Figure 12a). The measured narrow pore-throat sizes and the hydraulic radius (Figure 8b, Table 3) correlate with the intercrystalline pores hosted by euhedral dolomite crystals, which connect the high porous moldic pores. This would explain the comparatively high permeability of 30.6 mD (Table 3). Considering µCT resolution, the moldic pores of grainstone sample 449 seem to be only poorly connected (Figure 12b), which is consistent with the exceptionally high cementation exponent of 3.29 (Table 4) and low permeability of 0.04 mD (Table 3).

3.5. NMR

The measured raw data (Figure 13a and Figure 14a) feature a clear distinction between the back shoal sample (blue) and the shoal samples in the T2 curves. Backshoal sample 213 features smaller relaxation times, indicating smaller pores sizes. Shoal samples 383 to 404 show almost the same curve shape, whilst much larger relaxation times have been measured in grainstone shoal sample 449. The T1 relaxation time curves (Figure 14a) feature the same trend as the T2 curves, which was to be expected.
Following the T2 relaxation time distribution, grainstone shoal sample 449 has the largest relaxation times and hence the largest pores of the shoal samples (Figure 14). The peak of sample 449 occurs at five times larger relaxation times compared to the other shoal samples. Compared to samples 403 and 404, dolograinstone shoal sample 383 shows a narrower distribution. It is the only sample where a signal strength of 0 (Table 2) is observed between the two clusters. Sample 213 differs from the other samples as the relaxation time peak is one magnitude smaller. For T1 relaxation time derived distributions (Figure 14b), all samples show a unimodal behavior. Small magnitudes at short relaxation times might be explained by noise or inversion artifacts. For the shoal samples, it can be observed that although the positions of the major peaks differ the secondary peaks occur for all samples at a time of 0.2 s. Comparing the relaxation time distributions of the T1 and T2 experiments, narrower relaxation distributions for T1 can be observed. Additionally, the T2 relaxation time peaks occur at smaller times which might be explained by pore coupling. The key assumption of the NMR pore size distribution determination, that molecules exploring the solid surface by diffusion are not mixed with other molecules from nearby compartments, does not hold [44]. The T1 curves, however, do not show pore coupling, as in this measurement, the magnetization increases to its equilibrium value and is, therefore, easier to interpret. In this study a combination of the SEM- and µCT- derived pore-size distributions were used to determine the surface relaxivity ρ as they provide the pore volume as well. The surface relaxivity was determined while shifting the relaxation time curves over those curves (Figure 15). The determined surface relaxivities (Table 4) are in the range of ρ values presented in literature [41,44,45]. The dolomite samples are characterized by higher surface relaxation than the calcitic samples, which is consistent with the observations by Marschall et al. [41].
We try to predict permeability from T1 relaxation time distributions using the common Schlumberger-Doll research model [42]. While calibrating the calculated NMR permeabilities using measured water permeabilities the best match was obtained using a proportionality constant of 3.06 × 10⁻¹³ m2/s. However, by using the mathematically best proportionality constant, a negative R2 was determined. The predicted permeabilities for the calcitic samples were always overestimated, while the permeabilities of the dolomite samples were underestimated (Figure 16a). Subsequently, permeabilities were predicted using a cut-off value as suggested by Chang et al. [43]. The study recommended a value of 0.75 s, which provides a better fit (R2 = 0.993) but overestimates the permeability of sample 213. For our specimen, the best cut-off value was found to be 0.85 s. Calibrating the predicted permeability values with the measured values, the best calibration factor was found to be 1.41 × 10⁻⁹ m2/s resulting in an R2 of 0.9998. In Figure 16b, the NMR predicted and measured water permeabilities fit nicely with the exception of grainstone shoal sample 449, where permeability is underestimated significantly. A reason for this might be the complete cut-off of the moldic pores for this sample.

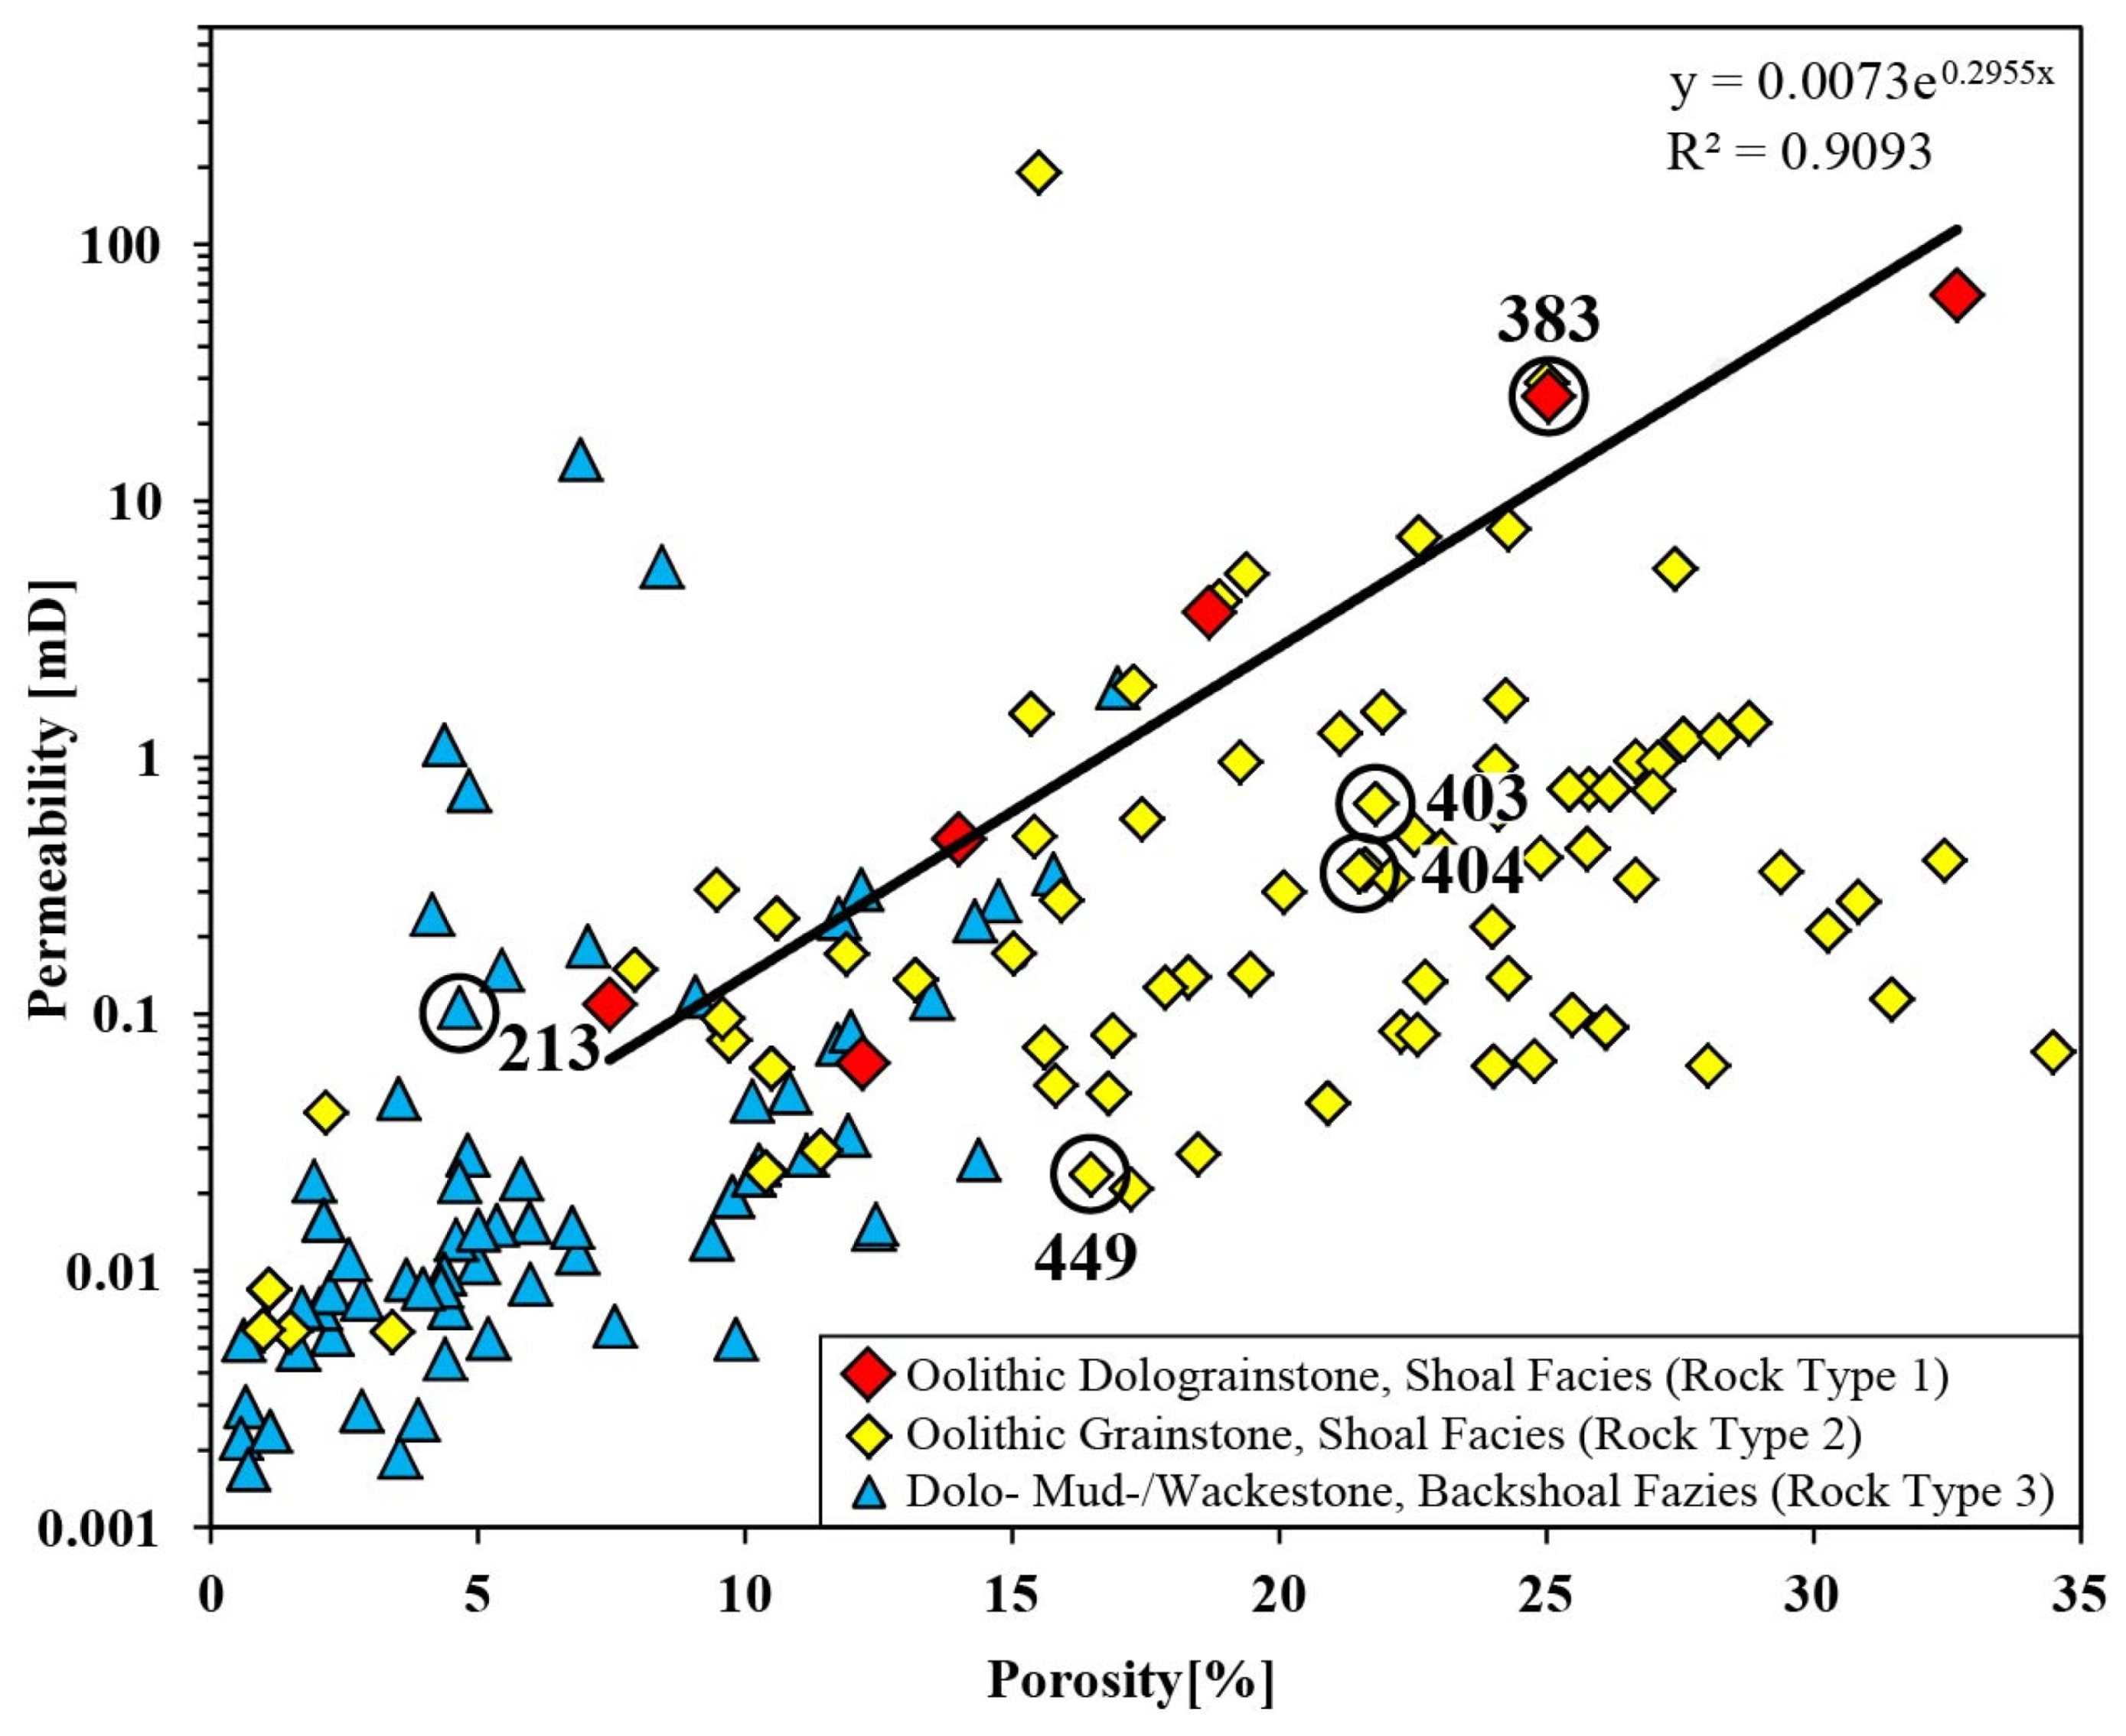
3.6. Porosity vs. Permeability

Porosity-permeability relationships in correlation with lithofacies indicate a strong depositional and early diagenetic control on reservoir quality, with pack/grainstones being associated with particularly high porosities while mud-/wackestones display comparatively lower porosities. We use grain density as a measure for lithology or dolomitization, as the density of calcite (ρ = 2.7 g/cm3) differs from the density of dolomite (ρ = 2.88 g/cm3). In the porosity-permeability plot (Figure 16) the dolomite and calcite-based facies are shown in different colors.

3.7. Rock Typing

Amongst the five samples analyzed, we can assign three rock types with significantly differing pore networks. Notably, the mineralogy in combination with lithofacies is needed for the appropriate characterization of reservoir properties.
Rock type 1 comprises calcareous-dolostone shoal facies represented by dolograinstone shoal sample 383 (Figure 5). It is characterized by highly porous ooid molds, well connected by intercrystalline porosity, which is hosted by euhedral dolomite crystals. This results in high permeability (Table 3). Figure 17 shows a good correlation between porosity and permeability for this rock type which allows permeability prediction for a given porosity. However, the correlation is based on only six samples.
Rock type 2 comprises dolomitic-limestone shoal facies represented by samples 403, 404, and 449 (Figure 6). It is characterized by abundant ooid moldic pores, which are separated by tight calcite cements. This results in high porosity but predominantly low permeability (Table 3). Figure 17 shows the variability of permeability for a given porosity, which is not influenced by the degree of dolomitization.
Rock type 3 comprises the dolomitic backshoal facies represented by sample 213 (Figure 4). It is characterized by low total porosity and permeability (Table 3) but also a strong increase in permeability with porosity (Figure 17). This results from intercrystalline and vuggy pores which are well connected, despite their patchy and heterogeneous distribution. There is no distinct correlation between porosity-permeability with lithology (Figure 17) indicating that the degree of dolomitization does not control the pore network but the porosity, which is mostly below 15% for backshoal facies and ranges between 1 and 35% for the shoal facies.

4. Discussion

Considering the relationship between rock types and their poroperm distributions with the integration of texture and pore types indicate that the reservoir quality in this Permo-Triassic Khuff succession is controlled mainly by diagenesis [25,46]. For a quantitative characterization of the reservoir properties in such a heterogeneous carbonate reservoir, the integration of sedimentary and diagenetic features are essential [25]. Petrographic observations confirm that dissolution is the most important factor in porosity creation in the studied area (e.g., Figure 4, Figure 5 and Figure 6). This process has been recognized as a key factor in generating reservoir quality in all Khuff reservoirs [21,25]. Dissolution occurs in the form of partial dissolution, molds, and vugs, and is likely the result of intensive circulation of meteoric water undersaturated with respect to aragonite and/or calcite [46]. As a result, the oolitic grainstone underwent ooid dissolution and blocky calcite cementation. It is considerable, that the meteoric water infiltrating in the ooid beds dissolved the grains and became saturated with respect to Mg-calcite. While infiltrating downwards it precipitated the blocky calcite cements. These processes most likely occurred simultaneously with the ooids possessing an original aragonitic mineralogy [46]. However, Khuff strata are predominantly characterized by dolostone, with limestone intervals mainly confined to the grain shoal facies [47]. Sedimentological, petrographic and geochemical data indicate that sabkha and reflux models are the two main mechanisms for dolomitization in the dolostones of the Khuff formation [47], although there is evidence of dolomite recrystallization and cementation during burial [21,48]. Petrographic examinations indicate that the reservoir rocks have been affected by compaction. Most depositional fabrics show little evidence for compaction prior to dolomitization, suggesting that this process pre-dates compaction [25]. As a result of increasing compaction (chemical compaction), solution seams and stylolites have developed (Figure 6e). However, ooids have not undergone physical compaction, since neither plastic nor brittle deformation features have been observed (Figure 5 and Figure 6). This is attributed to framework stabilization during early cementation [46].
Carbonate reservoirs often contain heterogeneous pore systems (nano-, micro-, meso- and macro-pores) that span several orders of magnitude in scale, from nanometers to meters [3]. Rocks with a higher proportion of nano- and microporosity have systematically lower negative capillary pressure (Pc) and lower relative permeability (Kr) than rocks with a lower proportion of nano- and micropores [49]. The latter leads to more favorable pore fluid movement in rocks with heterogeneous pore systems due to higher absolute permeability. Especially the dolomitic backshoal facies shows a wide range of pore- and, especially, pore-throat sizes (Figure 7a and Figure 8a), which are heterogeneously distributed throughout the samples leading to a wide range of measured permeabilities (Figure 16). Accordingly, the range of permeabilities measured on dolomitic shoal facies is somewhat narrower following the narrow pore-throat size (Figure 7b and Figure 8b). Therefore, while the mostly poor permeability is controlled by nano- and micropore-dominated dolomitic intervals, variable permeability in heterogeneous multi-scale pore-systems is largely controlled by mesopores [49]. However, the dolograinstone shoal sample 383 shows that extensive dolomitization might lead to a high permeability since intercrystalline porosity forms a well-connected pore network [26]. Calcite based intervals observed in this study show no distinct relationship between porosity and permeability. The observed calcite-dominated samples have been leached after being cemented by calcite around the ooids. Calcite cements might be relatively tight with only minor intercrystalline pores (Figure 6) and small pore-throat sizes (Figure 8c–e), which is accordance with observations made by Remeysen and Swennen [26] and Adam et al. [46]. They are often characterized by meso-and macropores but flow properties strongly depend on their connectivity. The comparison of the resistivity, i.e., of the formation factor, with permeability suggests that the major control for the permeability of the studied carbonate samples is pore connectivity (tortuosity) but not pore size.
In order to determine the surface relaxivity from NMR relaxation time distributions, Marschall et al. [41] proposed an algorithm comprising the use of MICP derived pore-throat size-distributions (e.g., Boever et al., [16]). However, since the modal peaks of NMR-derived distributions are represented by long relaxation times and thus, compared to MICP-derived distributions, larger radii, the surface relaxivities are too low compared to observations from Talabi et al. [44], Marschall et al. [41] and Vincent et al. [45]. Finally, a combination of the SEM- and µCT- derived pore-size distributions was used to determine the surface relaxivity as they provide the pore volume as well. The determined surface relaxivities (Table 4) are in the range of ρ values presented in the literature [41,44,45]. The dolomite samples are characterized by a higher surface relaxation than the calcitic samples which is in accordance with Marschall et al. [41]. Comparing MICP and NMR signals, larger pores in all samples are not detected by MICP. Following this observation, it might be deduced that large pores do not touch each other and are only connected by intercrystalline pores. For the samples 213 and 403 to 449, the smaller clusters within the NMR relaxation curves mark the starting point of the mercury intrusion (Figure 17a–e). Therefore, pores connected to the secondary clusters might determine the flow properties. Mercury intrusion of dolograinstone shoal sample 383 (Figure 17b) starts at radii above the second observed NMR peak. This suggests that pores are well connected and that pores represented by secondary NMR peaks are not the flow limiting factor. The secondary NMR peak of grainstone shoal sample 449 occurs at smaller radii compared to the other shoal samples (Figure 17f). This might be an indication of comparably smaller intercrystalline pores matching with the lowest permeability of all samples studied in detail (Table 3). Radii of secondary pores of shoal samples 383, 403, and 404 are similar. This might be related to the fact that those samples have the same primary intercrystalline pore size. Compared to SEM and µCT, NMR pore-size distributions show narrower peaks while peak positions are similar. Increased pore sizes of the µCT spectra can be explained by the partial volume effect. µCT derived pore-size distribution of sample 213 (Figure 15b) does not fit the other distributions because most of the pores are below the resolution of the µCT of 7.1 µm.
Although an NMR derived permeability prediction was possible in this study, it is likely that the results cannot be applied to NMR logging data as only T2 measurements are acquired in borehole logging due to time issues, which might be affected by pore coupling. If this potential pore coupling is not corrected for, the signal of the moldic pores overlays the signal of the intercrystalline pores. For this reason, the simple cut-off would not be able to separate the two classes and consequently, the intercrystalline pore sizes, the volume fraction and, hence, the permeabilities would be overestimated.
Combining the introduced methods, it was possible to identify the number of intercrystalline pores and their size as the limiting factor for the flow within the shoal samples. Variations between the samples are most likely associated with their various diagenetic histories. For further facies, other factors as the ones observed might gain increased importance. Therefore, applying the proposed workflow to further depositional environments would test and further improve the pore characterization capabilities in carbonate reservoirs. As the five samples provided do not represent all rock types in the Khuff Formation, a much larger dataset would be needed to statistically cover the entire spectrum of pore network heterogeneity. This would allow constraining the relationship between pore systems and reservoir properties to improve the predictive capability of rock typing.

5. Conclusions

Our integrated petrographic and petrophysical approach combines classical petrographic methods with techniques such as mercury intrusion capillary pressure (MICP), resistivity, nuclear magnetic resonance (NMR), as well as µCT and BIB-SEM imaging with the aim to differentiate and quantify pore types. With this, we provide a quantitative assessment of pore systems and the controlling factors for fluid flow in carbonates. BIB-SEM mosaics are used to effectively characterize pores as well as mineral phases and to quantify pore-size distributions from nanometers to several hundred micrometers. MICP and electric resistivity add information about the sizes of fluid pathways and pore connectivity. Therefore, they aid the understanding of measured permeability. In addition, the use of µCT provides fast and non-destructive pore quantification as well as the observation of the 3D spatial distribution of pores and mineral phases. However, smallest micro- and nanopores cannot be resolved. Both SEM and µCT derived pore-size distributions are used to determine the NMR surface relaxivity and, subsequently, the NMR derived pore-size distribution. Further, applying a cut-off value of 0.85 s, predicted permeabilities from T1 spectra correlate well with measured permeabilities for the most part. The strong correlation between measured electric resistivity and permeability could potentially be used to estimate permeability from wireline resistivity measured in the flushed zone close to the borehole wall. A combined analysis utilizing the introduced petrographic and petrophysical methods provides the best results with respect to pore system characterization.
The workflow applied in our Khuff Formation case study resulted in the discrimination of three different carbonate rock types with clearly discernible pore networks. Notably, the mineralogy in combination with lithofacies is needed for the appropriate characterization of the reservoir properties of these rock types. This confirms that the highest total porosity is hosted by moldic porosity in shoal facies where dolomitization leads to well-connected intercrystalline pores and effective porosity. Different degrees of ooid dissolution results in variable permeability for a given porosity. In back-shoal facies, dolomitization leads to low total porosity but well-connected and heterogeneously distributed vuggy and intercrystalline pores, which improves permeability. Micro- and nanoporosity (<20 µm) is present in all analyzed samples and its contribution to effective porosity depends on the textural context. Micro-and nanopores as intercrystalline porosity significantly increase effective porosity and permeability while they have no effect on permeability inside partially dissolved moldic pores. Rare microporosity observed between otherwise tight calcite cements does not significantly increase permeability. Based on this study we suggest an integrated laboratory analysis workflow for improved rock typing and pore-network imaging.

Author Contributions

This research was carried out as part of J.S.’s PhD project and L.L.’s MSc thesis. The thesis work was supervised by L.R., P.A.K., T.H. and N.K. S.C. carried out the µCT analysis and L.L. measured NMR. All other analyses were conducted by J.S. The original draft of this publication was written and illustrated by J.S. with contributions by L.L. All co-authors reviewed and edited the original draft and contributed to the discussion. Project administration and funding acquisition was handled by P.A.K and L.R. All authors have read and agreed to the published version of the manuscript.

Funding

This research was funded by Petroleum Development Oman (PDO).

Acknowledgments

We are grateful to Petroleum Development Oman (PDO) for funding this project and the data support. The Ministry of Oil and Gas of the Sultanate of Oman is thanked for granting permission to publish the results of this study. Uwe Wollenberg is acknowledged for conducting scanning-electron microscopy and Werner Kraus for thin-section preparation. We gratefully thank Miroslaw Słowakiewicz and two anonymous reviewers for their constructive comments which considerably improved an earlier version of this manuscript.

Conflicts of Interest

The authors declare no conflict of interest.

References

  1. Burchette, T.P. Carbonate Rocks and Petroleum Reservoirs: A Geological Perspective from the Industry. Geol. Soc. Lond. Spec. Publ. 2012, 370, 17–37. [Google Scholar] [CrossRef]
  2. Ghous, A.; Senden, T.J.; Sok, R.M.; Sheppard, A.P.; Pinczewski, V.W.; Knackstedt, M.A. 3D Characterisation of Microporosity in Carbonate Cores. In SPWLA Middle East Regional Symposium; Society of Petrophysicists and Well-Log Analysts: Houston, TX, USA, 2007; SPWLA-MERS-2007-E. [Google Scholar]
  3. Geiger, S. Quantifying the Dynamic Behavior of Multi-Porosity Systems in Carbonates—Challenges, Perspectives and Opportunities. Presented at the Mountjoy Carbonate Research Conference, Austin, TX, USA, 25–29 June 2017. [Google Scholar]
  4. Baechle, G.T.; Colpaert, A.; Eberli, G.P.; Weger, R.J. Effects of Microporosity on Sonic Velocity in Carbonate Rocks. Lead. Edge 2008, 27, 1012–1018. [Google Scholar] [CrossRef]
  5. Harland, S.R.; Wood, R.A.; Curtis, A.; van Dijke, M.; Stratford, K.; Jiang, Z.; Kallel, W.; Sorbie, K. Understanding the Role of Micropores in Fluid Flow within Carbonate Reservoirs. Geol. Soc. Am. 2016, 48. [Google Scholar] [CrossRef]
  6. Hollis, C.; Al Hajri, A.; Archilha, N.L.; Ceia, M.; Lacey, M.; Lee, P.; McDonald, S.; Missagia, R. Pore Topology and Rock Physical Properties of Microporosity in Lower Cretaceous Carbonate Sediments: Insights from X-Ray Ct Imaging. Presented at the Mountjoy Carbonate Research Conference, Austin, TX, USA, 25–29 June 2017. [Google Scholar]
  7. Choquette, P.W.; Cox, A.; Meyers, W.J. Characteristics, Distribution and Origin of Porosity in Shelf Dolostones: Burlington-Keokuk Formation (Mississippian), U.S. Mid-Continent. SEPM J. Sediment. Res. 1992, 62, 167–189. [Google Scholar] [CrossRef]
  8. Knackstedt, M.A.; Latham, S.; Madadi, M.; Sheppard, A.; Varslot, T.; Arns, C. Digital Rock Physics: 3D Imaging of Core Material and Correlations to Acoustic and Flow Properties. Lead. Edge 2009, 28, 28–33. [Google Scholar] [CrossRef]
  9. Smodej, J.; Reuning, L.; Becker, S.; Kukla, P.A. Micro- and Nano-Pores in Intrasalt, Microbialite-Dominated Carbonate Reservoirs, Ara Group, South-Oman Salt Basin. Mar. Pet. Geol. 2019, 104, 389–403. [Google Scholar] [CrossRef]
  10. Washburn, E.W. The Dynamics of Capillary Flow. Phys. Rev. 1921, 17, 273–283. [Google Scholar] [CrossRef]
  11. Słowakiewicz, M.; Perri, E.; Tucker, M.E. Micro- and Nanopores in Tight Zechstein 2 Carbonate Facies from the Southern Permian Basin, Nw Europe. J. Pet. Geol. 2016, 39, 149–168. [Google Scholar] [CrossRef]
  12. Borrelli, M.; Campilongo, G.; Critelli, S.; Ida, D.P.; Perri, E. 3D Nanopores Modeling Using Tem-Tomography (Dolostones—Upper Triassic). Mar. Pet. Geol. 2019, 99, 443–452. [Google Scholar] [CrossRef]
  13. Desbois, G.; Urai, J.L.; Kukla, P.A. Morphology of the Pore Space in Claystones—Evidence from Bib/Fib Ion Beam Sectioning and Cryo-Sem Observations. eEarth 2009, 4, 15–22. [Google Scholar] [CrossRef]
  14. Desbois, G.; Urai, J.L.; Kukla, P.A.; Konstanty, J.; Baerle, C. High-Resolution 3D Fabric and Porosity Model in a Tight Gas Sandstone Reservoir: A New Approach to Investigate Microstructures from mm- to nm-Scale Combining Argon Beam Cross-Sectioning and SEM Imaging. J. Pet. Sci. Eng. 2011, 78, 243–257. [Google Scholar] [CrossRef]
  15. Nader, F.H.; De Boever, E.; Gasparrini, M.; Liberati, M.; Dumont, C.; Ceriani, A.; Morad, S.; Lerat, O.; Doligez, B. Quantification of Diagenesis Impact on the Reservoir Properties of the Jurassic Arab D and C Members (Offshore, U.A.E.). Geofluids 2013, 13, 204–220. [Google Scholar] [CrossRef]
  16. De Boever, E.; Foubert, A.; Oligschlaeger, D.; Claes, S.; Soete, J.; Bertier, P.; Özkul, M.; Virgone, A.; Swennen, R. Multiscale Approach to (Micro)Porosity Quantification in Continental Spring Carbonate Facies: Case Study from the Cakmak Quarry (Denizli, Turkey). Geochem. Geophys. Geosyst. 2016, 17, 2922–2939. [Google Scholar] [CrossRef] [Green Version]
  17. Da Silva, G.P., Jr.; Franco, D.R.; Stael, G.C.; de Oliveira Lima, M.D.; Martins, R.S.; de Moraes França, O.; Azeredo, R.B. Petrophysical Studies of North American Carbonate Rock Samples and Evaluation of Pore-Volume Compressibility Models. J. Appl. Geophys. 2015, 123, 256–266. [Google Scholar] [CrossRef]
  18. Volkmann, J.; Klitzsch, N. Wideband Impedance Spectroscopy from 1Mhz to 10Mhz by Combination of Four- and Two-Electrode Methods. J. Appl. Geophys. 2015, 114, 191–201. [Google Scholar] [CrossRef] [Green Version]
  19. Pillevuit, A. Les Blocs Exotiques Du Sultanat D’oman: Évolution Paléogéographique D’une Marge Passive Flexurale, Mèmoires De Géologie; Université de Lausanne, Faculté des sciences, Institut de géologie et de paléontologie: Lausanne, Switzerland, 1993. [Google Scholar]
  20. Konert, G.; Afifi, A.M.; Al-Hajri, S.I.; De Groot, K.; Al Naim, A.A.; Droste, H.J. Paleozoic Stratigraphy and Hydrocarbon Habitat of the Arabian Plate 1. In Petroleum Provinces of the Twenty-First Century; Marlan, W., Downey, J., Threet, C., William, A., Eds.; American Association of Petroleum Geologists: Morgan, LA, USA, 2001. [Google Scholar] [CrossRef]
  21. Ehrenberg, S.N.; Nadeau, P.H.; Aqrawi, A.A. A Comparison of Khuff and Arab Reservoir Potential Throughout the Middle East. AAPG Bull. 2007, 91, 275–286. [Google Scholar] [CrossRef]
  22. Koehrer, B.; Zeller, M.; Aigner, T.; Poeppelreiter, M.; Milroy, P.; Forke, H.; Al-Kindi, S. Facies and Stratigraphic Framework of a Khuff Outcrop Equivalent: Saiq and Mahil Formations, Al Jabal Al-Akhdar, Sultanate of Oman. GeoArabia 2010, 15, 91–156. [Google Scholar]
  23. Sharland, P.R.; Archer, R.; Casey, D.M.; Davies, R.B.; Hall, S.H.; Heward, A.P.; Horbury, A.D.; Simmons, M.D. Arabian Plate Sequence Stratigraphy. GeoArabia 2013, 18, 371. [Google Scholar]
  24. Alway, R.H.; Broomhall, R.W.; Hulstrand, R.F.; Al-Mansoori, A.; Abdalla, A.A.; Al-Aidarous, A. Sequence Stratigraphy of the Khuff Formation Comparing Subsurface and Outcrop Data (Arabian Plate, U.A.E.). In Proceedings of the Abu Dhabi International Petroleum Exhibition and Conference, Abu Dhabi, UAE, 13–16 October 2002; Society of Petroleum Engineers: Richardson, TX, USA, 2002. [Google Scholar] [CrossRef]
  25. Esrafili-Dizaji, B.; Rahimpour-Bonab, H. Effects of Depositional and Diagenetic Characteristics on Carbonate Reservoir Quality: A Case Study from the South Pars Gas Field in the Persian Gulf. Pet. Geosci. 2009, 15, 325–344. [Google Scholar] [CrossRef]
  26. Remeysen, K.; Swennen, R. Application of Microfocus Computed Tomography in Carbonate Reservoir Characterization: Possibilities and Limitations. Mar. Pet. Geol. 2008, 25, 486–499. [Google Scholar] [CrossRef]
  27. Maurer, F.; Martini, R.; Rettori, R.; Hillgärtner, H.; Cirilli, S. The Geology of Khuff Outcrop Analogues in the Musandam Peninsula, United Arab Emirates and Oman. GeoArabia 2009, 14, 125–158. [Google Scholar]
  28. Martin, A.Z. Late Permian to Holocene Paleofacies Evolution of the Arabian Plate and Its Hydrocarbon Occurrences. GeoArabia 2001, 6, 445–504. [Google Scholar]
  29. Koehrer, B.; Aigner, T.; Forke, H.; Pöppelreiter, M. Middle to Upper Khuff (Sequences KS1 to KS4) Outcrop-Equivalents in the Oman Mountains: Grainstone Architecture on a Subregional Scale. GeoArabia 2012, 17, 59–104. [Google Scholar]
  30. Roduit, N. Jmicrovision: Image Analysis Toolbox for Measuring and Quantifying Components of High-Definition Images. Available online: http://www.jmicrovision.com (accessed on 2 June 2015).
  31. Sigal, R.F. A Methodology for Blank and Conformance Corrections for High Pressure Mercury Porosimetry. Meas. Sci. Technol. 2009, 20, 045108. [Google Scholar] [CrossRef]
  32. Spagnoli, G.; Klitzsch, N.; Fernandez-Steeger, T.; Feinendegen, M.; Rey, A.R.; Stanjek, H.; Azzam, R. Application of Electro-Osmosis to Reduce the Adhesion of Clay During Mechanical Tunnel Driving. Environ. Eng. Geosci. 2011, 17, 417–426. [Google Scholar] [CrossRef]
  33. Archie, G.E. The Electrical Resistivity Log as an Aid in Determining Some Reservoir Characteristics. Trans. AIME 1942, 146, 54–62. [Google Scholar] [CrossRef]
  34. Kozeny, J. Ueber Kapillare Leitung Des Wassers. Boden. Sitz. Wien. Akad. 1927, 136, 271–306. [Google Scholar]
  35. Carman, P.C. Fluid Flow through Granular Beds. Chem. Eng. Res. Des. 1997, 75, S32–S48. [Google Scholar] [CrossRef]
  36. Perona, P.; Malik, J. Scale-Space and Edge Detection Using Anisotropic Diffusion. IEEE Trans. Pattern Anal. Mach. Intell. 1990, 12, 629–639. [Google Scholar] [CrossRef] [Green Version]
  37. Otsu, N.A. Threshold Selection Method from Gray-Level Histograms. IEEE Trans. Syst. Man Cybern. 1979, 9, 62–66. [Google Scholar] [CrossRef] [Green Version]
  38. Canny, J. A Computational Approach to Edge Detection. In Readings in Computer Vision; Elsevier: Amsterdam, The Netherlands, 1987; pp. 184–203. [Google Scholar] [CrossRef]
  39. Coates, G.R.; Xiao, L.; Prammer, M.G. NMR Logging Principles and Applications; Haliburton Energy Services: Houston, TX, USA, 2001. [Google Scholar]
  40. Kenyon, W.E. Petrophysical Principles of Applications of NMR Logging. Log Anal. 1997, 38, 23. [Google Scholar]
  41. Marschall, D.; Gardner, J.; Mardon, D.; Coates, G. Method for Correlating NMR Relaxometry and Mercury Injection Data. Available online: http://www.jgmaas.com/SCA/1995/SCA1995-11.pdf (accessed on 17 October 2019).
  42. Kenyon, W.E.; Day, P.I.; Straley, C.; Willemsen, J.F. A Three-Part Study of Nmr Longitudinal Relaxation Properties of Water-Saturated Sandstones. SPE Form. Eval. 1988, 3, 622–636. [Google Scholar] [CrossRef]
  43. Chang, D.; Vinegar, H.J.; Morriss, C.; Straley, C. Effective Porosity, Producible Fluid and Permeability in Carbonates from NMR Logging; Society of Petrophysicists and Well-Log Analysts: Houston, TX, USA, 1994. [Google Scholar]
  44. Vincent, B.; Fleury, M.; Santerre, Y.; Brigaud, B. NMR Relaxation of Neritic Carbonates: An Integrated Petrophysical and Petrographical Approach. J. Appl. Geophys. 2011, 74, 38–58. [Google Scholar] [CrossRef]
  45. Talabi, O.; Alsayari, S.; Fernø, M.A.; Riskedal, H.; Graue, A.; Blunt, M.J. Pore-Scale Simulation of NMR Response in Carbonates. In Proceedings of the International Symposium of the Society of Core Analysis, Abu Dhabi, UAE, 29 October–2 November 2008. [Google Scholar]
  46. Adam, A.; Swennen, R.; Abdulghani, W.; Abdlmutalib, A.; Hariri, M.; Abdulraheem, A. Reservoir Heterogeneity and Quality of Khuff Carbonates in Outcrops of Central Saudi Arabia. Mar. Pet. Geol. 2018, 89, 721–751. [Google Scholar] [CrossRef]
  47. Ehrenberg, S.N. Porosity Destruction in Carbonate Platforms. J. Pet. Geol. 2006, 29, 41–52. [Google Scholar] [CrossRef]
  48. Videtich, P.E. Dolomitization and H2S Generation in the Permian Khuff Formation, Offshore Dubai, U.A.E. Carbonates Evaporites 1994, 9, 42–57. [Google Scholar] [CrossRef]
  49. Alqassab, H.; Fullmer, S.M.; Alharbi, M.; Moore, P.J.; Kelly, B. Pore System Heterogeneity: Impact on Reservoir Modeling and Field Development. In Proceedings of the Mountjoy Carbonate Research Conference, Austin, TX, USA, 25–29 June 2017. [Google Scholar]
Figure 1. Porosity–permeability-crossplot of 149 carbonate samples from the Khuff-Formation.
Geosciences 10 00007 g001
Figure 2. Paleogeographic map of the Arabian Gulf area during the Late Permian showing the location of the study area in Oman and major hydrocarbon fields (red) within the Khuff reservoirs (blue and green) (modified from Maurer et al., [27], after Ziegler, [28] and Koehrer et al., [29]).
Geosciences 10 00007 g002
Figure 3. Integrated laboratory analysis workflow for improved rock typing and pore network imaging.
Geosciences 10 00007 g003
Figure 4. Petrographic observations of dolowackestone backshoal sample 213. Thin-section images (a) (plane-polarized) and (b) (cross-polarized) show pores (P), mainly caused by dissolution of patchy and heterogeneously distributed displacive anhydrite (A), which are partly closed by dolomite cements (DC). Allochems are recognizable but cannot be distinguished due to dolomitization as a diagenetic overprint. (c) High resolution BSE-SEM image stitched from 255 single images. Compared to the thin-section images, not only macro- and mesopores but also (intercrystalline (I)) micro- and nanopores, hosted by aphanocrystalline matrix dolomite (D), and calcite cements (C) are visible. Further, intracrystalline pores, probably fluid inclusions, are apparent inside the fine to medium crystalline dolomites. (d) Binarized version of high-resolution image (c) used for image analysis (Figure 7a). (e) Large scale mosaic stitched from 243 images. The position of detailed images (c) and (d) is indicated within the broad ion beam (BIB)-polished area.
Geosciences 10 00007 g004
Figure 5. Petrographic observations of shoal oolitic dolograinstone sample 383. Thin-section images (a) (plane-polarized) and (b) (cross-polarized) show dissolved or partly dissolved ooids, i.e., moldic porosity (M), which are major contributors to total porosity. (c) High resolution mosaic within the BIB-polished area stitched from 271 images. Compared to the thin-section images, not only macro- and mesopores (molds) but also (intercrystalline (I)) micro- and nanopores, hosted by aphanocrystalline to medium-crystalline dolomite (D), are visible. (d) Binarized version of high-resolution image (c) used for image analysis (Figure 7b). (e) Large scale mosaic stitched from 185 images. The position of detail images (c) and (d) is indicated within the BIB-polished area.
Geosciences 10 00007 g005
Figure 6. Petrographic observations of dolomitic-limestone oolitic-grainstone shoal samples 403 and 404. Thin-section images (a) (plane-polarized) and (b) (cross-polarized) of sample 403 show dissolved or partly dissolved ooids, i.e., moldic porosity (M), which are major contributors to total porosity. (c) High resolution mosaic within the BIB-polished area of sample 404 stitched from 467 images. Mostly tight calcite-cement mosaics (C) with only minor amounts of intercrystalline pores restrict the connectivity between moldic pores. (d) Binarized version of high-resolution image (c) used for image analysis (Figure 7d). (e) Large scale mosaic of sample 404 stitched from 190 images. The positions of detailed images (c) and (d) (black square) as well as a dissolution seam (black dashed line) are shown.
Geosciences 10 00007 g006
Figure 7. Pore size distributions with equivalent pore-diameter classes versus contribution to total porosity and frequency of samples 213 (a), 383 (b), 403 (c), 404 (d) and 449 (e) resulting from SEM-image analysis (exemplarily shown in Figure 4d, Figure 5d and Figure 6d). Modal pore-throat sizes obtained from mercury injection capillary pressure (MICP) are indicated by blue diamonds in the respective pore-size classes.
Geosciences 10 00007 g007
Figure 8. Incremental and cumulative mercury intrusion versus pore-throat size-distribution of samples 213 (a), 383 (b), 403 (c), 404 (d) and 449 (e) based on MICP analysis. The y-axis accounts for both incremental as well as cumulative intrusion as both are normalized to their highest respective intrusions.
Geosciences 10 00007 g008
Figure 9. Permeability as a function of 1/F. The data suggest a clear power correlation with an R2 value of 0.9674.
Geosciences 10 00007 g009
Figure 10. Exemplary slices of the computed tomography (CT)-3D-stack after ring and diffusion processing. While dark areas represent pores, mineral phases are indicated in grey (dolomite in (a,b), calcite in (cf)). Anhydrite cemented areas are shown in light grey (a).
Geosciences 10 00007 g010
Figure 11. Comparison of SEM and CT-derived pore-size distributions for grainstone shoal sample 403 as a function of processing. (a) Diffusion processing (b) Ring processing.
Geosciences 10 00007 g011
Figure 12. Volume reconstruction of moldic and intercrystalline pores in dolgrainstone shoal sample 383 and grainstone sample 449. The image is displayed using a cyclic colormap so that unconnected pores in close proximity are likely to be shown in a different color. This enables distinguishing between separated and connected pores. The displayed scale bars account for the bounding-box center. (a) The color distribution indicates that the moldic and intercrystalline pores of sample 383 are well connected (turquoise) with only minor isolated pores (all other colors). (b) Sample 449 showing poorly connected moldic pores. For details see text.
Geosciences 10 00007 g012
Figure 13. Inverted T2 relaxation time distribution. In (a) the raw and the inverted data are compared. In (b) the inverted relaxation time distributions are presented. The presented curves are normalized in such a way, that the area below the individual curves is proportional to the measured porosity.
Geosciences 10 00007 g013
Figure 14. Inverted T1 relaxation time distributions. In (a) the raw and the inverted data are compared. In (b) the inverted relaxation time distributions are presented. The presented curves are normalized in such a way, that the area below the individual curves is proportional to the measured porosity.
Geosciences 10 00007 g014
Figure 15. Surface relaxivity determination of samples 213 (a), 383 (b), 403 (c), 404 (d) and 449 (e) based on T1 relaxation times. The surface relaxivity was determined through shifting the NMR curve on top of the SEM and the CT.
Geosciences 10 00007 g015
Figure 16. NMR derived permeabilities. In (a) the complete NMR signals were used to predict the permeabilities using equation 6. In (b) the permeabilities were predicted from the NMR signal using a cut–off value of 0.85 s.
Geosciences 10 00007 g016
Figure 17. Porosity-permeability-crossplot of 149 carbonate samples from the Khuff-Formation. Lithofacies oolitic dolograinstone, oolitic grainstone, and mud-/wackestone are shown in red, yellow and blue, respectively. Analyzed samples are indicated by their numbers. The regression and its coefficient of determination (R2) of dolograinstone shoal samples (Rock Type 1) are indicated.
Geosciences 10 00007 g017
Table 1. Description of lithofacies associated with the studied samples derived from Koehrer et al. [22] and observations of this study. For the explanation of rock types, see Section 3.7.
Lithofacies TypesMassive to Burrowed to Bioturbated Pel-Skel-Intraclast Mud-/WackestoneCross-Bedded Oolitic Grainstone
Samples213383, 403, 404 and 449
PetrographyFigure 4Figure 5 and Figure 6
ComponentsHeterolithics, peloids, intraclasts and oncoids, mudstone intraclasts, abundant gastropods, thin-shelled bivalves, ostracods, and miliolids; may include subtidal evaporatesOoids, peloids, high diversity fauna of gastropods, thick-shelled bivalves, bryozoans, corals, shell debris highly abraded
Sedimentary structuresModerate to poorly sorted mud-/wackestone, peloids, intraclasts and oncoids, variably bioturbated, normal grading, clay drapesModerately well sorted, peloidal and oolitic grainstones, well developed trough and planar cross stratified
Major diagenetic processesCementation, dissolution and fracturingDominated by dissolution, cementation, stylolitization, fractures, and dolomitization
Pore typesIncludes fracture, intercrystalline, and vuggy poresDominantly moldic pores, intragranular and intercrystalline pores
Depositional environmentLow-energy, shallow water, with semi-restricted circulation of marine waters associated with backshoal to intershoal lagoons frequently influenced by storm washoversProximal incipient to fully developed shoal or bar complexes within the high-energy inner to mid-ramp environment
Rock types31 and 2
Table 2. Nuclear magnetic resonance (NMR) measurement parameters.
Sample213383403404449
Lithofacies associationback shoalshoalshoalshoalshoal
Dominant mineralogydolomiticdolomiticlimestonelimestonelimestone
Dunham classwackestonegrainstonegrainstonegrainstonegrainstone
T2 Inter echo time [µs]231231231231231
No. of echoes600014,00014,00016,0001600
Table 3. Sample porosities, permeabilities, and pore sizes.
Sample213383403404449
Lithofacies associationback shoalshoalshoalshoalshoal
Dominant mineralogydolomiticdolomiticlimestonelimestonelimestone
He porosity [%]52521.621.817.2
SEM porosity [%]3.921.619.527.525.1
SEM micro- and nanoporosity [% of total porosity]55.79.54.66.53.5
MICP porosity [%]6.823.319.523.522.4
NMR total porosity [%]6.724.121.423.816
NMR intercrystalline porosity [%]6.41045.10.9
NMR moldic porosity [%]0.314.117.418.70.15
CT porosity [%]1.716.520.422.722.5
He permeability [mD]0.2430.60.560.980.04
MICP modal pore-throat radius [µm]0.230.04, 20.08, 0.460.13
Hydraulic radius [µm] (Equation (2))0.231.390.260.320.12
Table 4. Resistivity and NMR derived sample properties.
Sample213383403404449
Lithofacies associationback shoalshoalshoalshoalshoal
Dominant mineralogydolomiticdolomiticlimestonelimestonelimestone
Water resistivity [Ohm m]0.05380.05320.05320.05380.0532
DC resistivity [Ohm m]9.87525.0074.19317.175
Formation factor [-]183.737.694.178.0322.9
Cementation exponent [-]1.792.622.9652.863.29
Tortuosity [-]3.153.074.514.137.45
Surface relaxivity [m/s]3 × 10−63.9 × 10−62.8 × 10−62.8 × 10−61.3 × 10⁻⁶

