Abstract
Fire scar detection through orbital data can be done using specific techniques, such as the use of spectral indices like the normalized burn ratio (NBR), which are designed to help identify burnt areas as they have typical spectral responses. This paper aims to characterize burn severity and regrowth in areas hit by three fires in the Chapada Diamantina National Park (Bahia, Brazil) and its surrounding area through the differenced normalized burn ratio (dNBR) and relative differenced normalized burn ratio (RdNBR) spectral indices. The data acquired were pretreated and prepared adequately to calculate the indices. We conclude that for the study area, considering the limitations of fieldwork, the multitemporal index dNBR and the relative index RdNBR are important tools for classifying burnt areas and can be used to assess the regrowth of vegetation.
1. Introduction
In 2015, the Chapada Diamantina National Park (Bahia, Brazil) was ravaged by several fires that lasted four months from September to December, a typical fire period in the region, as demonstrated by previous studies [1,2,3]. To manage such an environment, we need to look at the impact of fires therein since their increase in frequency and intensity has been documented in several ecosystems and represents a significant impact on global warming, given that fires often entail a great loss of biomass and release of carbon, which can contribute to changes in local climate [4,5,6,7,8,9].
In this sense, the terms fire intensity and severity are often used to globally define the degree of environmental change caused by fire immediately thereafter [9,10,11,12]. The intensity therefore describes the rate at which a fire produces thermal energy [13], that is, the release of energy, which is influenced, among other factors, by the amount of combustible material available for burning.
Fire severity, on the other hand, can be defined as the magnitude of change caused in the ecosystem by a fire, and its relation with the impacts on the environment is in part determined by the thermal gradient felt in the soil [9,10,14,15]. Therefore, from a broad perspective, fire severity can be defined as the degree of changes in soil and vegetation caused by the fire [16], as it quantifies the short term effects of the fire [12].
The term most often used in Brazil as a synonym for fire severity is that of the severity of burnt areas, which represents both the short and long term effects, for example, postfire recovery [9,10,12]. Thus, the severity of the fire defines how the ecosystems respond to a fire and can be used to describe the effects of the fire on the soil, water system, flora and fauna of ecosystems, the environment, and society [13]. However, the relation between fire intensity and severity is still largely uncertain because of the difficulties found in relating intensity to the impacts observed [13,17]. The concept of burn severity proposed by Keeley [18] implies that fire intensity describes the physical combustion process of energy release from organic matter.
Therefore, fire severity is correlated with fire intensity once fire severity refers to the loss or decomposition of organic matter aboveground and belowground. Metrics for this parameter vary with the ecosystem. Including mortality is consistent with the definition of fire severity as a loss of organic matter; however, it is only advisable when dealing with forest trees that lack any resprouting capacity [18].
After a fire, several changes occur as it burns up vegetation, leaving the soil partially or completely bare and, among other effects, changes the humidity thereof. Remote sensing provides feasible approaches to describe fire patterns in various ecosystems, given that satellite images are often used to limit fire boundaries and characterize the mosaics burn severity [8,9,10,12,19].
The detection of forest fires using orbital data, such as satellite images, can be done using specific techniques, such as the calculation of the fire rating through the normalized burn ratio (NBR), which is designed to help identify burnt areas as they have typical spectral responses. Data from the Landsat satellite TM sensor are widely used to calculate the NBR radiometric index and its variations, a fact that has contributed to the development of studies with the application in operational land imager (OLI) sensor data since this is the continuance of the TM sensor [10]. Thus, in Landsat series data the near infrared reflectance (NIR) band is sensitive to the amount of chlorophyll in leafy vegetation and the short-wave infrared reflectance (SWIR) band is suitable for the detection of moisture content, both in vegetation and in soils [8].
The application of the NBR index is appropriate for detecting changes in the landscape affected by the fire and is said to be effective to identify burnt areas. This is because changes in the NIR reflectance generally indicate changes in the photosynthetically active vegetation, which is susceptible to be reduced by fire, while changes in the SWIR reflectance are associated with the reduction of photosynthetically active vegetation, moisture content, ash deposition, and increased soil exposure [9,10,18,20,21].
The removal of vegetation and the deposit of charcoal by the action of the fire normally result in a drop in the postfire NIR and high postfire SWIR [10]. The multitemporal difference of the NBR is the differenced normalized burn ratio (dNBR), which aims to assess the extent and severity of the burnt area through the relation between the prefire and postfire NBR, which can help with understanding the severity level [22]. It was assumed to be directly proportionate to the intensity of the fire and widely used to map out the severity thereof [10,23].
The relative differenced normalized burn ratio (RdNBR), in another way, is the relative index of the dNBR, which considers that the classifications of the dNBR relative data can be more precise, on average, for the category of high burn severity than that of the classifications of dNBR derived from a universal set of thresholds applied to multiple fires [24]. The use of the relative index should be considered when seeking to map fires for which we have no severity data, based on field surveys, to assist and validate the classification thereof [24].
For all these reasons, the analysis of satellite images is a valuable tool for the mapping of burnt areas and assessing the severity of fires as it offers an adequate spectrum and spatial resolution [16]. Determining the perimeter of the fire and identifying the levels of severity within it facilitates the decision-making process aimed at restoring the affected areas. It also allows for the analysis of the fire impact on the postfire vegetation. In this sense, this work aims to characterize the degree of severity and regrowth following the three fires that occurred in the Chapada Diamantina National Park (PNCD) and its surrounding area in 2015, using the dNBR and RdNBR spectral indices calculated in Landsat 8 images.
2. Materials and Methods
2.1. Study Areas
This paper focuses on three areas hit by fires in 2015 in the Chapada Diamantina National Park (Figure 1) that correspond to three fires that occurred in the 2015 season [2,3]. The first two of which occurred within the boundaries of the Chapada Diamantina National Park and the third one in its surrounding area.
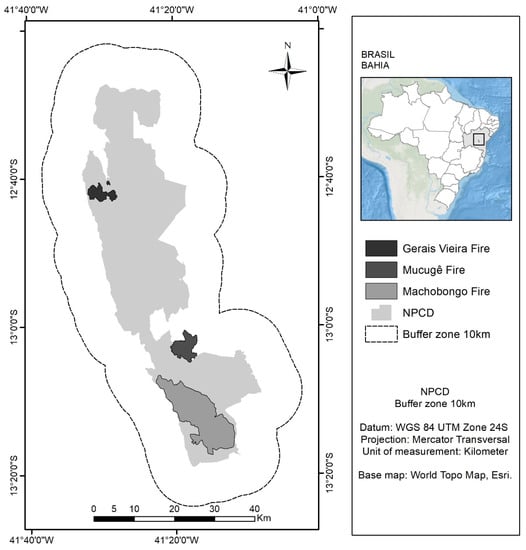
Figure 1.
Location of the study areas. The Chapada Diamantina National Park (PNCD) is represented in light gray. The dashed line corresponds to the 10-kilometre buffer (surrounding area). The study areas correspond to polygons with black outlines (the scars of the fires identified from the application of the normalized burn ratio (NBR) spectral index).
The region where the Chapada Diamantina National Park (PNCD) is located corresponds to the prolongation, in the Bahia State, of the Espinhaço Orographic System that starts in Minas Gerais and enters Bahia. The conservation unit is situated in the plateau geographically known as the Sincorá Mountain, with an altitude ranging from 400 to 1700 m [25]. The diverse altitude and relief influence the occurrence of various climates (Köppen climate classification) in the area under study: caatinga (a type of desert vegetation, and an ecoregion characterized by this vegetation in interior northeastern Brazil [1]) warm climate—BSwh; altitude tropical climate—Cwb; and subhumid tropical climate—Am’ (SEI, 1998). According to the Lençóis weather station (12°33′ S, 41°22′ O, 400 m), part of the National Meteorological Department (DNMET) situated near the PNCD, the mean annual temperature in 2015 was 31 °C and the total annual precipitation was only 47.1 mm [3].
The natural vegetation of the study area is generally called mosaic because of its great diversity. Different types of vegetation coexist in small areas, conditioned by small lithological, topographical, hydrological, and microclimate variations. In general, the main vegetation formations found in Chapada Diamantina are: “campo limpo” (clean fields), “campos rupestres” (rocky fields), “campos gerais” (grassland fields), “cerrado”-type vegetation (savannah-like vegetation), and “matas or Floresta estacional” (forests or bush or deciduous forest) (Figure 2). There are also transition zones with their own characteristics where species of two or more ecosystems coexist [25,26,27].
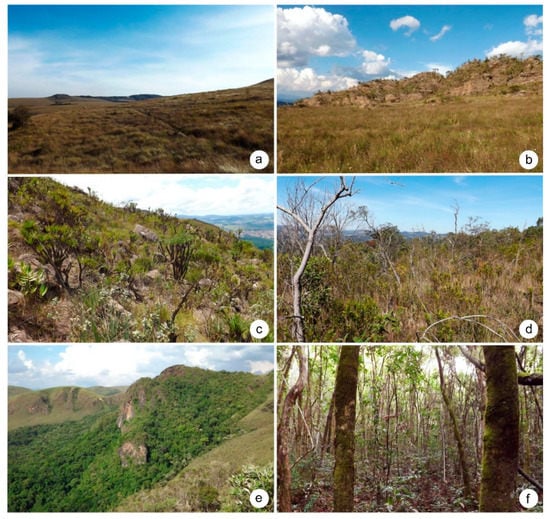
Figure 2.
Main phytophysiognomies found in study area: (a) general view of the clean field; (b) clean field in the foreground and rocky outcrop in the rocky field in the background; (c) rocky field; (d) cerrados; (e) a view of the semideciduous forest (FES) on the northern slope of the mountain; and (f) inside the FES. Photos: T.L. Vieira [32].
The “campo limpo” and the “campo rupestre” are cerrado-type rocky formations. The presence of shrubs and subshrubs in the “campo limpo” is insignificant. The structure of some of the sections of the “campo rupestre” are similar to those of the “campo sujo” (shrubs and some small trees) or of the “campo limpo”, differentiated by both the substrate, formed by rocky outcrops, and the variety of flora, which includes many endemic plants [28].
“Campos rupestres” (rocky fields) are formed by open vegetation growing on rocky outcrops at more than 800 m, characterized by the combination of altitude, bedrock, low water availability, and wide temperature variations. Specific species can grow on bare rock, for example, some orchids, cacti, and bromeliads. Some species like the canelas-de-ema (Vellozia genus) are well adapted to withstand fire, which is rather frequent in these regions [26].
The “campos gerais” (grassland) are characterized by grass-type of vegetation on deep soil, flat, and sandy terrain above 1000 meters in altitude. In general, the species are of the lowland type, up to 30 cm high. Trees and shrubs are usually nonexistent. The soils in these regions are acidic and hardly fertile, providing very few nutrients to plants. Although these “campos gerais” resemble grassland or pastures, a closer look reveals species with stiff leaves coated with silica, being unfit for cattle grazing. The most common species in this environment are monocotyledons, with Gramineae, Cyperaceae, and Eriocaulaceae (sempre vivas) prevailing.
The “floresta estacional” (deciduous forest) is an ecosystem found in the Atlantic Forest, characterized especially by a climate with two well-marked seasons: a dry season and a rainy season. Both present high tree density and are home to various animals and smaller plants [29]. The forest cover of the PNCD is linked to the presence of watercourses and higher altitude environments, as well as to developed soils. Forests are thus found in valleys and on some mountain tops. There is also an extensive forest area along the eastern edge of the Sincorá Mountain, taking up 13.1% of the Park area [26,27].
The National Park was established in an area of time-immemorial occupation and use that today is under protection and conservation. The main activities carried out over the centuries by the populations living on the Sincorá Mountain are mining, the use of native pastures, farming activities, the picking of natural flowers, the hunting of native animals, and the removal of rocks [26]. However, some of these activities ceased when the PNCD was established.
In Brazil, little is known about the dynamics of fires in regions such as Chapada Diamantina, where the “campos rupestres” predominate, given that the outburst of fires in this ecosystem can be a natural disturbance, and human activity tends to increase the repetitiveness and extension of this phenomenon [30]. In the case of the PNCD, some studies point to the fact that, although the conservation area has experienced wildfires after it was established, some of the park regions have not been affected by fires for many years [31].
2.2. Data Acquisition and Processing
Images from the operational land imager (OLI) sensor onboard the Landsat-8 satellite (Table 1) were used to assess burn severity and postfire regrowth. The images were acquired from the catalog of images provided by the United States Geological Survey (USGS) (http://earthexplorer.usgs.gov/). The selected images corresponding to the orbit/point 217/069, the period corresponding to the fire season in the region, between the months of September to December [3], were determined as a temporal filter, then the images with the lowest cloud cover were selected for the study area, to facilitate the identification of burnt areas during the 2015 fire.

Table 1.
Characteristics of the operational land imager (OLI)/LANDSAT-8 images.
Accordingly, five images of the OLI sensor were chosen; the prefire image from 28 August 2015 and the postfire images from 25 September 2015, 14 December 2015, 30 December 2015, and the regrowth image from 30 November 2016 (see Table 1). For the georeferencing and recording phase, through the imagery–imagery method of the scenes, we first used the scene from 21 May 2001, georeferenced and orthorectified, available on the Global Land Cover Facility website of the University of Maryland (http://glcf.umiacs.umd.edu/) and obtained a root-mean-square error (RMS) less than 0.5 pixels. All images were recorded in UTM (Universal Transversal Mercator) zone 24 S, with WGS 84 (World Geodetic System 84) datum.
In the preprocessing phase, digital numbers (DN) were converted to radiance values (see Equation (1)), and after the conversion, the images were corrected atmospherically to reduce the spectral distortions caused by the scattering of electromagnetic radiation resulting from the interaction with the atmosphere. The method used for atmospheric correction was FLAASH (Fast Line of sight Atmospheric Analysis of Spectral Hypercubes), which is based on the MODTRAN (Moderate-Resolution Atmospheric Radiative Transfer Model) radiative transfer model to remove the effects of atmospheric scattering and absorption [20,33]. A mean altitude of 1.6 km was used, with a rural aerosols model, a visibility of 40 km, and a tropical atmospheric model.
where gain—gain for each band available on the image metadata [dimensionless]; offset—offset for each band available on the image metadata [dimensionless]; pixel value—image’s digital number values [dimensionless].
2.3. Spectral Indices
The spectral index of the fire using the normalized burn ratio serves to identify the perimeter of burnt areas. The NBR is a normalized difference index (see Equation (3)) that is based on the reflectance data for bands 5 and 7 of the OLI sensor, which pinpoints the burnt areas. Band 5, corresponding to the near infrared (NIR), has a spatial resolution of 30 m and is equivalent to the spectral range of 0.85 to 0.88 µm, band 8, corresponding to the shortwave infrared 2 (SWIR), has a spatial resolution of 30 m, which is equivalent to the spectral range of 2.11 to 2.29 µm.
To evaluate bitemporal change detection, we considered the bispectral SWIR–NIR space (see Figure 2) [10,16,21]. If a spectral index is appropriate for a physical change of interest, in this case, the reduction of fire-induced vegetation, there is a clear bispectral relation between the change and the direction of the offsets in space [21]. In an ideal scenario, the bitemporal trajectory of a pixel is perpendicular to the first bisector of the Cartesian coordinate system. This is illustrated in Figure 2 for the nonburnt offset (U) and for the optically (O) detected burnt area [16,21].
where NIR corresponds to band 5 of the Landsat-8 OLI sensor and SWIR corresponds to band 7 of the Landsat-8 OLI sensor.
Using the bitemporal difference of the preprocessed NBR images we calculated the dNBR (see Equation (3)) [10,23]. Teobaldo and Baptista [22] noted that the dNBR enhances the changes between the NBR scenes, highlighting the presence of fires; thus, an attempt was made to study the regrowth capacity based on this very index, that is, subtracting the postfire images from other subsequent dates called regrowth (see Equation (4)).
where NBRpre—prefire data; NBRpost—postfire data; NBRregrowth—regrowth data; dNBRs—dNBR severity; and dNBRr—dNBR regrowth.
The RdNBR (see Equation (5)), the relative index of the dNBR, usually uses the mathematical formulation of a relative variation index, which consists of dividing the value of change by the value of the predisturbance index. The absolute variation index is converted into a percentage, and the resulting relative variation index changes linearly with the variable of interest, which in our case is severity [24]. To this end, this study also uses the RdNBR (see Equation (5)) to evaluate regrowth, considering that Teobaldo and Baptista [22] suggest changing the RdNBR, as proposed by Miller and Thode [24], to verify the efficiency of the regrowth of vegetation in burnt areas in such a way as to relativize and quantify the regrowth in the affected areas. The RdNBR regrowth is presented in Equation (6).
where RdNBRs is RdNBR severity and RdNBR is RdNBR regrowth.
The severity levels proposed by Key and Benson [10] (Table 2) were used to classify the severity and regrowth indices. The user can decide on the width and number of levels depending on the application requirements. However, we commonly employ a seven-layer configuration, which has proved to be useful in a variety of ways [10]. The dNBR value intervals may change between paired scenes. Values of less than about −500 or greater than about +1300 may also occur. If they do, they will not be considered as burnt. Instead, they will be concealed as anomalies caused by the lack of recording, clouds, or other factors not related to real differences in land cover [10].
Table 2.
Severity levels and dNBR×103 and RdNBR×103 interval.
The two first severity levels (see Table 2) reflect areas where productivity increased after the fire. They occur almost exclusively in grass patches where the dNBR can be strongly negative, indicating areas of increased postfire productivity (the postfire NBR is much higher than that of the prefire). The typical nonburnt pixels are found close to zero on the scale. The last four levels include all other burnt areas where the dNBR is distinctively positive (the postfire NBR is much lower than that of the prefire); they cover what is normally recognized as recently burnt [10].
3. Results and Discussion
The NBR multitemporal difference, that is, the dNBR index and the RdNBR relative index, have recently become the standard fire severity measurements, using data from the Landsat satellite because of their ease of implementation, since they generally have a large spectral separation that can be achieved between the near-infrared and the short-wave infrared bands, and because of the unique combination of moderate spatial resolution data captured in these regions [6,9,10,12].
From the calculations of Equation (2), it was possible to observe the NBRpre, NBRpost, and NBRregrowth values for the images used. Key and Benson [10], who developed the NBR, compartmentalize the index based on data slicing and indicate that the theoretical range varies between −1.0 to 1.0. The pixels with a positive response represent productive vegetation. An NBR close to “0” indicates that clouds, grasses, exposed soil, or rocky outcrops may occur, and if pixels have a negative NBR, this suggests severe water stress on plants and the negative trace created within fires. Thus, it is important to consider that the results of recent fire normally vary from “0” to strongly negative [10].
The dNBR (Equations (3) and (4)) integrates the NBR’s multitemporal data sets in a single gradient or unidimensional scale, so the dNBR has a theoretical range from −2 to +2 or −2000 to +2000, scaled by 103 [10]. To calculate the RdNBR (Equations (5) and (6)), if the NBR prefire is scaled by 103, the index should be divided by 1000 in the RdNBR formula. Thus, the absolute value of the NBR prefire, in the denominator, allows the calculation of the square root without changing the sign of the original dNBR; the function of the absolute value in the denominator is necessary as the square root of a negative number necessarily results, in mathematical terms, in an imaginary number. The positive dNBR and RdNBR values represent a decrease in vegetation, while the negative values represent an increase in vegetation cover [10,24].
The analysis of the dNBR and RdNBR spectral indices is presented in the following sections.
3.1. The Fire in Gerais do Vieira
The altitude of the region called Gerais do Vieira ranges between 1200 and 1600 meters; it is situated north of the PNCD and its vegetation is of the “campo limpo” (clean field), “campo rupestre” (rocky field), and a small area of “floresta estacional” (deciduous forest) (Figure 3).
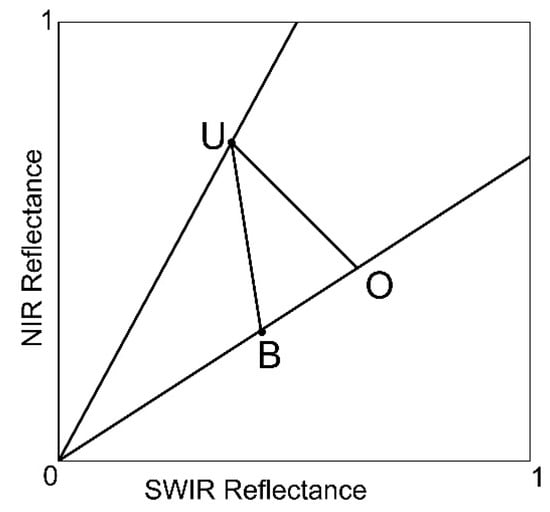
Figure 3.
Example of the pre/postfire trajectory of a pixel in the short-wave infrared reflectance–near infrared reflectance (SWIR–NIR) space. A pixel moves from nonburnt (U) to burnt (B). O resembles the position of an optically sensitive burnt pixel. The dNBR is sensitive to offsets | UO | and insensitive to offsets | OB | [16].
Table 3 presents the NBRpre, NBRpost, and NBRregrowth data obtained from the calculation done on the Landsat-8 image. As regards the NBRpre data, it was found that pixels varied between −0.774 and +0.799; the NBRpost data were found in the interval between −0.460 and +0.792, while the NBRregrowth data are between −0.149 and +0.803.
Table 3.
Theory and observed bands, considering the pixels corresponding to the NBR indices for the Gerais do Vieira fire.
The calculation of the NBRpre, NBRpost, and NBRregrowth enables the study of change detection by means of visual analysis through multitemporal visualization, that is, RGB composition figures were organized with the index images (see Figure 4b and Figure 5b).
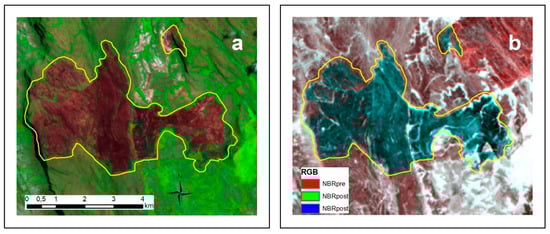
Figure 4.
Pictures of: (a) colored composition image corresponding to the postfire image for the Gerais do Vieira fire, data from the Landsat-8 7-5-4 RGB OLI sensor and (b) multitemporal visualization of the burnt area related to the Gerais do Vieira fire, RGB NBRpre, NBRpost, and NBRregrowth.
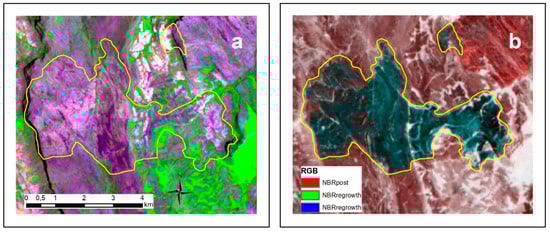
Figure 5.
Pictures of: (a) colored composition image corresponding to the regrowth image for the Gerais do Vieira fire, data from the Landsat-8 7-5-4 RGB OLI sensor and (b) multitemporal visualization of the regrowth area (2016) corresponding to the Gerais do Vieira fire, RGB NBRpre, NBRpost, and NBRregrowth.
In Figure 4b, the red channel was related to the NBRpre index and the green and blue channels to the NBRpost index. This technique proves to be efficient for detecting the burnt area. Thus, we were able to calculate the fire area, which corresponds to 1791.1 ha. Figure 4b corresponds to the multitemporal visualization of the regrowth change, with the red channel being related to the NBRpost index and the green and blue channels to the NBRregrowth index.
Using Equations (3) and (5), the dNBR and RdNBR indices for the severity classes were obtained. As such, Figure 6 presents the burn severity classes of the Gerais do Vieira fire obtained in the images used in this study. It is important to consider that the severity effects show variations within the same burnt area [23] and that the determination of the fire perimeter, as well as its distribution and the severity levels within it facilitate decision-making, as this type of information is useful for unit conservation managers seeking to understand the effects of fires in ecosystems, for example, the recovery of vegetation and its postfire sequence [10,16].
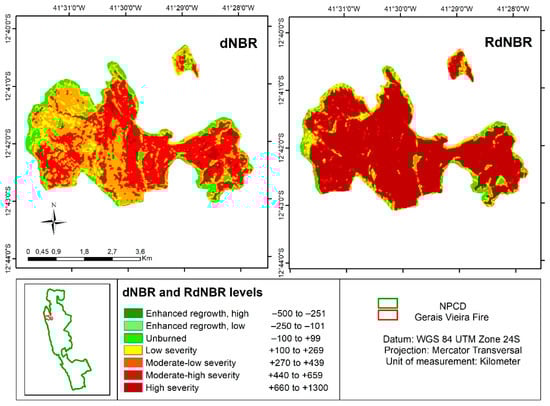
Figure 6.
The severity of the burnt area identified by the dNBR and RdNBR indices for the Gerais do Vieira fire (classification by Key and Benson [10]).
Is possible to see that the results obtained from the OLI sensor/Landsat-8 data prove to be efficient for delimiting the burnt area and for classifying the different severities (see Figure 6). The results of the analysis of the dNBR and RdNBR behavior, according to the severity level, demonstrate that the pre and postfire NBR indices are adequate t.o delimit between burnt and nonburnt pixels, while the dNBR and RdNBR indices add to this the breakdown of the degrees of severity experienced.
The continuous dNBR and RdNBR data sets can be stratified into ordinal classes or severity levels to simplify the description and comparison of fires. Therefore, the data obtained from the calculation of indices have identified areas from the nonburnt class to the high severity class for the Gerais do Vieira fire.
The regrowth data were obtained by calculating Equations (4) and (6). Parker et al. [9] analyzed the effects of vegetation regrowth from the calculation of the dNBR index, due to the latent period between fire ignition and the date on which the Landsat image was captured. This allowed the authors to understand that the Landsat postfire images, captured 68 days after the date of ignition, indicate that the spectral signature of fire severity was likely to have reduced, underestimating the severity of the fire, which can be attributed to the rapid regeneration of vegetation, thus indicating regrowth. In this sense, the analysis of the regrowth of vegetation in the Gerais do Vieira region hit by the fire in the Chapada Diamantina National Park (Figure 7) means that the regrowth capacity in the aftermath of the 2015 fire was quite high.
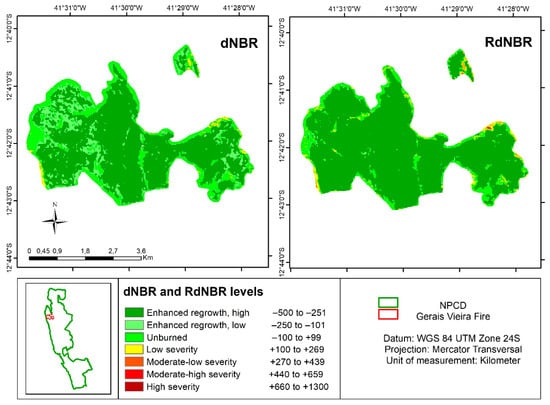
Figure 7.
Regrowth of the burnt area identified by the dNBR and RdNBR indices for the Gerais do Vieira fire (classification by Key and Benson [10]).
The dNBR overestimates the regrowth in the nonburnt area and low regrowth and underestimates the remaining classes, while the RdNBR index highlights the high regrowth class. When comparing them both however, we observe that in some areas the dNBR index identifies as low regrowth places, the RdNBR index identifies high regrowth in areas previously burnt.
3.2. Fire Close to Mucugê
The fire occurred east of the Mucugê municipality, in an area surrounding the central area of the PNCD, with altitudes ranging from 1000 and 1300 meters, that has a “clean field” and “rocky field” type of vegetation [32].
Table 4 presents the data obtained from the calculation done on the Landsat-8 image. As regards the NBRpre data, it was found that the pixels varied between −0.508 and +0.718; the NBRpost were between −0.616 and +0.708; as for the NBRregrowth data, the interval was between −0.181 and +0.732.
Table 4.
Theory and observed bands, considering the pixels corresponding to the NBR indices for the fire close to Mucugê.
Just as before, a change detection analysis was performed using visual analysis, through multitemporal visualization, that is, an RGB composition figure was organized with the index images (see Figure 8b and Figure 9b). We were thus able to calculate the fire area, which corresponds to 2837 ha.
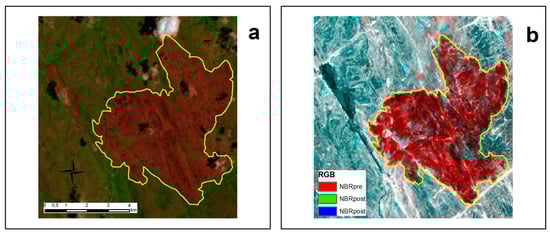
Figure 8.
Pictures of: (a) colored composition image corresponding to the postfire image for the fire near Mucugê, data from the Landsat-8 7-5-4 RGB OLI sensor. (b) multitemporal visualization of the burnt area in the fire near Mucugê, NBRpre/NBRpost/NBRpost RGB.
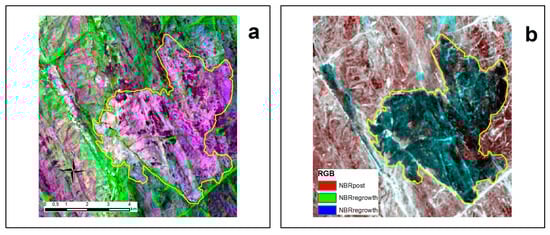
Figure 9.
Pictures of: (a) colored composition image corresponding to the regrowth area for the fire near Mucugê, data from the OLI Landsat-8 7-5-4 RGB OLI sensor and (b) multitemporal visualization of the regrowth area (2016) corresponding to the Mucugê fire, RGB NBRpre, NBRpost, and NBRregrowth.
Using Equations (3) and (5), we obtained the dNBR and RdNBR indices for the severity classes. Figure 10 presents the severity classes of the fire near Mucugê, obtained in the images used to develop this study. We found data in all the described classes in that area.
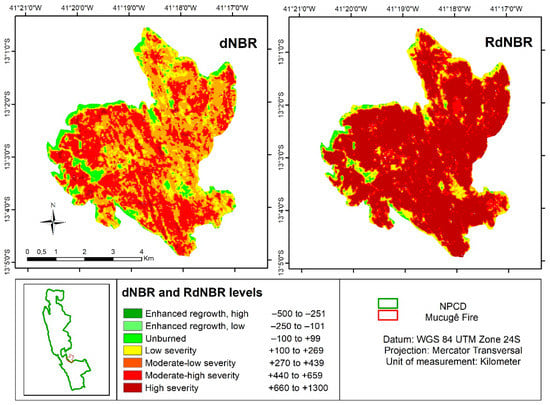
Figure 10.
The severity of the fire identified by the dNBR and RdNBR indices relating to the fire near Mucugê (classification by Key and Benson [10]).
The regrowth data were obtained by calculating Equations (4) and (6). The analysis of the area burnt by the fire near the Mucugê municipality is presented in Figure 11. The results of the data processing enabled us to quantify the areas of each class of regrowth for the dNBR and RdNBR indices.
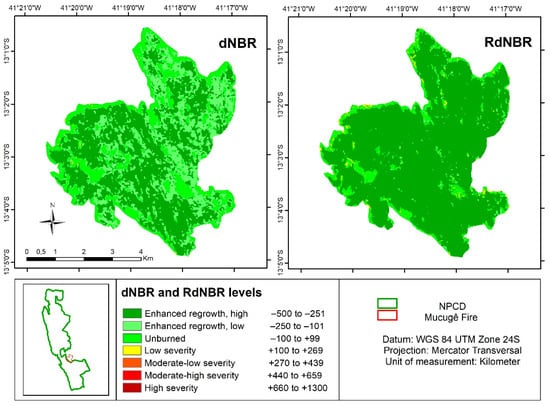
Figure 11.
Regrowth following the fire identified by the dNBR and RdNBR indices relating to the fire near Mucugê (classification by Key and Benson [10]).
As noted in the previous data, the dNBR overestimates the regrowth in the nonburnt area and low regrowth and underestimates the remaining classes, while the RdNBR index highlights the high regrowth class. When comparing them both however, we observe that in some areas the dNBR index identifies as low regrowth places, the RdNBR index identifies high regrowth in areas previously burnt.
3.3. The Fire in Gerais do Machobongo
The fire occurred in the Gerais do Machobongo region, which is situated in the southern part of the Chapada Diamantina National Park, with altitudes ranging from 700 to 1400 meters, and has a “clean field” and “rocky field” type of vegetation [32] and a small area of “deciduous forest” [28].
Table 5 presents the NBRpre data in which the pixels varied between −1.0 and +0.851; the NBRpost data were between −1.0 and +0.823; and as for the NBRregrowth data, the interval was between −1.0 and +0.885.
Table 5.
Theory and observed bands, considering the pixels corresponding to the NBR indices for the fire in Gerais do Machobongo.
Again, a change detection analysis was performed using visual analysis through multitemporal visualization, that is, RGB composition figures were organized with the index images (see Figure 12b and Figure 13b). We were thus able to calculate the fire area, which corresponds to 15,931 ha.
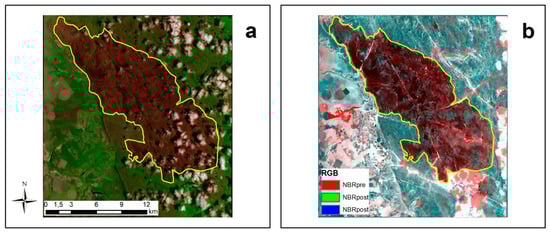
Figure 12.
Pictures of: (a) colored composition image corresponding to the postfire image for the Gerais do Machobongo fire, data from the Landsat-8 7-5-4 RGB OLI sensor and (b) multitemporal visualization of the burnt area in the Gerais do Machobongo fire, NBRpre/NBRpost/NBRpost RGB.
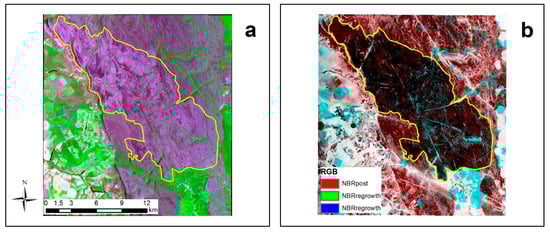
Figure 13.
Pictures of: (a) colored composition image corresponding to the regrowth image for the Gerais do Machobongo fire; data from the Landsat-8 7-5-4 RGB OLI sensor; and (b) multitemporal visualization of the regrowth area (2016) corresponding to the Gerais do Machobongo fire, NBRpost//NBRregrowth/NBRregrowth RGB.
To obtain the severity data, we used Equations (3) and (5) to calculate the dNBR and RdNBR indices. Figure 14 presents the severity classes of the fire in the Gerais do Machobongo region.
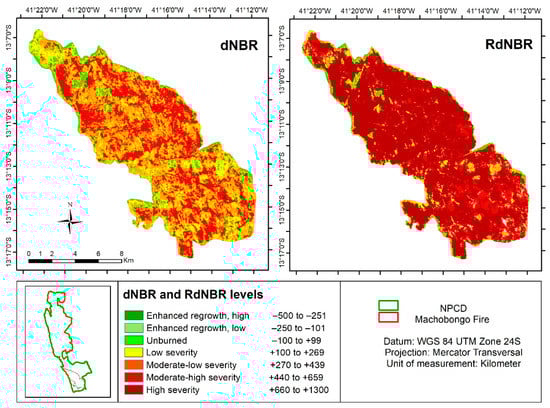
Figure 14.
The severity of the fire identified by the dNBR index relating to the Gerais do Machobongo fire (classification by Key and Benson [10]).
The regrowth data were obtained by calculating Equations (4) and (6). The analysis of the regrowth area in the Gerais do Machobongo fire is presented in Figure 15. The results of the data processing enabled us to quantify the areas of each class of regrowth for the dNBR and RdNBR indices.
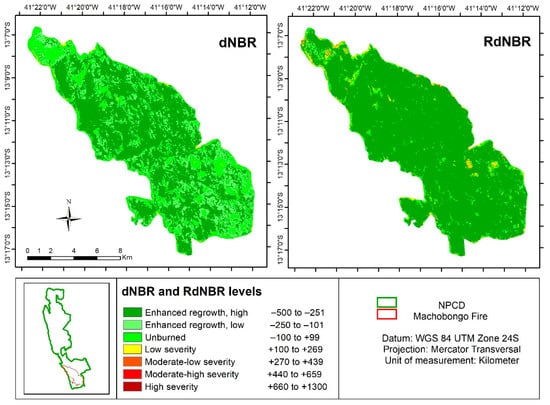
Figure 15.
Regrowth following the fire identified by the dNBR and RdNBR indices relating to the Gerais do Machobongo fire (classification by Key and Benson [10]).
As noted in the previous data, dNBR overestimates the regrowth in the nonburnt area and low regrowth and underestimates the remaining classes, while the RdNBR index highlights the high regrowth class. When comparing them both however, we observe that in some areas the dNBR index identifies as low regrowth places, the RdNBR index identifies high regrowth in areas previously burnt.
3.4. Discussion
In this work, the main objective was to characterize the degree of severity and regrowth after three fires occurred using the spectral indices dNBR and RdNBR. The dNBR method, or the change in bands 5 and 7 of Landsat 8, contrasts with the RdNBR index that measures the proportional change that occurs in the same bands with relative values.
Our hypothesis was that RdNBR would be a better estimator of the severity of fires and the regrowth of vegetation because it is a relative index [29]. Ours results indicate that dNBR is capable of separating severity and regrowth levels well concerning RdNBR. In a study developed by Miler and Thode in 2007 [24], the authors state that in homogeneous vegetation, the dNBR and RdNBR indices would produce similar estimated precision as also observed by Soveral and collaborators in 2010 [34].
In this study, vegetation is homogenous and predominant in the “fields” type, a fact that may have contributed to the results found and to the underestimation of the high severity class by the RdNBR index. In general, the regional models developed in this study were developed and applied to other areas of the globe with other vegetation contexts. For the studied area, there are still few studies on applications of remote sensing techniques to assess the severity of fire and regrowth of vegetation.
Historically, the indiscriminate use of fire in the Chapada Diamantina National Park is very common and it is so frequent that the reserve suffers from fires every year [26]. The use of fire has been at the root of almost all traditional activities in the region, economic or otherwise, even within the National Park boundaries. Fires occur mostly between August and March. Although the dry season occurs from August to November, the highest risk period is extended to March, as the environment needs to have had sufficient rain in order not to catch fire [27].
Based on the work of Mesquita et al. [31], using the satellite images between 1973 and 2010, the analysis focused on the extent of the areas affected by fires in the park and its surrounding area (10 km). The results show that in 37 years fires affected 61% of the park area and 37.6% of its surrounding area. A possible relation between the occurrence of the El Niño phenomenon and the most severe events in that park was also reported.
It should be noted that between 1985 and 2010 about 39.57% of the PNCD areas were not affected by fires [31], in some areas up to nine fire events were identified in the same area, and up to four fire events were reported in 59.41% of the conservation area. However, as noted above, it was only in 2008 that 41.93% of the Park area was struck by fires.
The areas studied historically have recorded recurrence of fires. For 2015, the burning severity obtained by the dNBR spectral index indicated that the fires studied were classified mainly as moderate to high severity, whereas the RdNBR spectral index identified, for the most part, the high severity class. For the results on vegetation regrowth, the dNBR indicated the low regrowth and high regrowth classes and the RdNBR index the high regrowth class.
The study developed for the three fires that occurred in 2015 shows results for the severity of the fires obtained through spectral indices, identifying that the fires were predominantly serious, with a low severity class confined in valleys, lower areas, areas close to roads, and limits of fire scars as previous studies point out [35].
Our study shows the possibility of monitoring areas affected by fire using remote sensing methods and indicates a high predictive capacity of the attributes of the fire regime to recover postfire vegetation after forest fires in fire-prone ecosystems. This information can help managers to predict the postfire recovery capacity of forests, according to their specific fire regime, so they can be used to adopt appropriate management strategies, focused on the prefire status in each scenario.
4. Conclusions
The NBR index proved to be sensitive to pre and postfire offsets of the pixels affected by the fires, within the SWIR–NIR space. Based on the methodology used in this work, the pre and postfire difference index (dNBR) is adequate for distinguishing between nonburnt pixels and pixels affected by the fire.
We can conclude that the use of the multitemporal dNBR index and the RdNBR relative index are important tools for classifying burnt areas in the area under study. It was found that by applying the indices to the areas burnt by the fires under study, the vegetation regrowth rate was quite significant one year after the fires.
It is noteworthy that for the study area, the months that show rainfall indexes do not show themselves as adequate periods for the analysis of vegetation regrowth, as it mixes with the resumption of vegetation vigor after the rains return and thereby masks which is regrowth of the burnt area concerning to the greenness of the vegetation [29].
The burning can have effects on the phytophysiognomic diversity in the area after the fire, since the efficiency of the grinding wheel is primarily due to the high rate of herbaceous regrowth and can affect the region’s biodiversity. The regrowth should be further studied in the field and with that, observe which species are favored by fire and if it is used for local diversity.
It is important to take into consideration that the historical information on fire severity and regrowth, obtained from the Landsat images, can provide valuable data for an effective management of natural resources. Studies should be encouraged to map the recurrence of fires in the area and to understand the landscape patterns created by the fire, as well as the monitoring of the regrowth of the affected areas and their relationship with severity [22]. This information will be highly valuable for forest managers to understand the consequences of even more acute fire regimes as observed for the area studied in 2008 and 2012 [3], as it will help in the implementation of effective restoration and environmental education actions [35].
Author Contributions
S.M.B.d.S. carried out the data inventory and analyzed the data; S.M.B.d.S. and A.B.-G. wrote the manuscript; and W.F.-R. and G.B. revised the data analysis and improved the manuscript. All authors have read and agreed to the published version of the manuscript.
Funding
This research was partially financed by FAPESB (Research Support Foundation of the State of Bahia) by granting a master’s scholarship (Nº BOL0141/2015), partially cofinanced by the Annual Land Cover and Use Mapping Project in Brazil (MapBiomas), and partially cofinanced by the European Regional Development Fund (ERDF) through the COMPETE 2020 Operational Programme Competitiveness and Internationalization (POCI) and national funds by FCT under the POCI-01-0145-FEDER-006891 project (FCT Ref: UID/GEO 04084/2019).
Acknowledgments
To the Graduate Program in Earth and Environmental Sciences (PPGM/UEFS). To the Chapada Diamantina Advanced Campus of the State University of Feira de Santana (UEFS) and to the Chico Mendes Institute for Biodiversity Conservation (ICMBio) for all their support.
Conflicts of Interest
The authors declare no conflict of interest.
References
- Silva, T.S.; Franca-Rocha, W.J.S.; Angelo, M.F. Quantificação E Análise Espacial Dos Focos De Calor No Parque Nacional Da Chapada Diamantina - BA. In Proceedings of the XVI Simpósio Brasileiro De Sensoriamento Remoto—SBSR, Foz Do Iguaçu, Brazil, 13–18 April 2013. [Google Scholar]
- Santos, S.M.B.; Franca-Rocha, W.; Bento-Gonçalves, A. Quantificação E Análise Dos Focos De Calor No Parque Nacional Da Chapada Diamantina E Sua Zona De Amortecimento. In Proceedings of the A Geografia Física E A Gestão De Territórios Resilientes E Sustentáveis, Guimarães, Portugal, 28–30 September 2016. [Google Scholar]
- Santos, S.M.B.; Franca-Rocha, W.J.S.; Bento-Gonçalves, A.J.; Baptista, G.M.M. Quantificação E Avaliação Dos Focos De Calor No Parque Nacional Da Chapada Diamantina E Entorno No Período De 2007 A 2016. Rev. Bras. Cartogr. 2017, 64, 701–712. [Google Scholar]
- Westerling, A.L. Warming and Earlier Spring Increase Western U.S. Forest Wildfire Activity. Science 2006, 313, 940–943. [Google Scholar] [CrossRef]
- Robichaud, P.R.; Lewis, S.A.; Laes, D.Y.M.; Hudak, A.T.; Kokaly, R.F.; Zamudio, J.A. Postfire Soil Burn Severity Mapping with Hyperspectral Image Unmixing. Remote Sens. Environ. 2007, 108, 467–480. [Google Scholar] [CrossRef]
- French, N.H.F.; Kasischke, E.S.; Hall, R.J.; Murphy, K.A.; Verbyla, D.L.; Hoy, E.E.; Allen, J.L. Using Landsat Data to Assess Fire and Burn Severity in the North American Boreal Forest Region: An Overview and Summary of Results. Int. J. Wildland Fire 2008, 17, 443. [Google Scholar] [CrossRef]
- Chuvieco, E.; Aguado, I.; Yebra, M.; Nieto, H.; Salas, J.; Martín, M.P.; Vilar, L.; Martínez, J.; Martín, S.; Ibarra, P.; et al. Development of a Framework for Fire Risk Assessment Using Remote Sensing and Geographic Information System Technologies. Ecol. Model. 2010, 221, 46–58. [Google Scholar] [CrossRef]
- Meng, Q.; Meentemeyer, R.K. Modeling of Multi-Strata Forest Fire Severity Using Landsat TM Data. Int. J. Appl. Earth Obs. Geoinformation 2011, 13, 120–126. [Google Scholar] [CrossRef]
- Parker, B.M.; Lewis, T.; Srivastava, S.K. Estimation and Evaluation of Multi-Decadal Fire Severity Patterns Using Landsat Sensors. Remote Sens. Environ. 2015, 170, 340–349. [Google Scholar] [CrossRef]
- Landscape Assessment (LA). In FIREMON: Fire Effects Monitoring and Inventory System. Available online: https://www.fs.usda.gov/treesearch/pubs/24066 (accessed on 17 March 2020).
- Veraverbeke, S.; Verstraeten, W.W.; Lhermitte, S.; Goossens, R. Evaluating Landsat Thematic Mapper Spectral Indices For Estimating Burn Severity Of The 2007 Peloponnese Wildfires In Greece. Int. J. Wildland Fire 2010, 19, 558. [Google Scholar] [CrossRef]
- Veraverbeke, S.; Stavros, E.N.; Hook, S.J. Assessing Fire Severity Using Imaging Spectroscopy Data from The Airborne Visible/Infrared Imaging Spectrometer (AVIRIS) And Comparison with Multispectral Capabilities. Remote Sens. Environ. 2014, 154, 153–163. [Google Scholar] [CrossRef]
- Bento-Gonçalves, A.; Vieira, A.; Úbeda, X.; Martin, D. Fire and Soils: Key Concepts and Recent Advances. Geoderma 2012, 191, 3–13. [Google Scholar] [CrossRef]
- de Bano, L.F.; Neary, D.G.; Ffolliott, P.F. Fire: Its Effect on Soil and Other Ecosystem Resources; John Wille: New York, NY, USA, 1998. [Google Scholar]
- Thomaz, E.L.; Antoneli, V.; Doerr, S.H. Effects of Fire on the Physicochemical Properties of Soil In A Slash-And-Burn Agriculture. CATENA 2014, 122, 209–215. [Google Scholar] [CrossRef]
- Escuin, S.; Navarro, R.; Fernández, P. Fire Severity Assessment by Using NBR (Normalized Burn Ratio) And NDVI (Normalized Difference Vegetation Index) Derived from LANDSAT TM/ETM Images. Int. J. Remote Sens. 2008, 29, 1053–1073. [Google Scholar] [CrossRef]
- Influence of Fire on Factors That Affect Site Productivity. Available online: https://forest.moscowfsl.wsu.edu/smp/solo/documents/GTRs/INT_280/Hungerford_INT-280.php (accessed on 17 March 2020).
- Keeley, J.E. Fire Intensity, Fire Severity and Burn Severity: A Brief Review and Suggested Usage. Int. J. Wildland Fire 2009, 18, 116. [Google Scholar] [CrossRef]
- Sunderman, S.O.; Weisberg, P.J. Remote Sensing Approaches for Reconstructing Fire Perimeters and Burn Severity Mosaics in Desert Spring Ecosystems. Remote Sens. Environ. 2011, 115, 2384–2389. [Google Scholar] [CrossRef]
- Atmospheric Correction Module: QUAC and FLAASH User’s Guide. Version 4.7. Available online: https://www.google.com.hk/url?sa=t&rct=j&q=&esrc=s&source=web&cd=1&cad=rja&uact=8&ved=2ahUKEwjd8aHN8aDoAhUuE6YKHRXDC4cQFjAAegQIARAB&url=https%3A%2F%2Fwww.harrisgeospatial.com%2Fportals%2F0%2Fpdfs%2Fenvi%2FFlaash_Module.pdf&usg=AOvVaw1--I6LB29ki7HctQ0l0CkP (accessed on 17 March 2020).
- Veraverbeke, S.; Lhermitte, S.; Verstraeten, W.W.; Goossens, R. The Temporal Dimension of Differenced Normalized Burn Ratio (Dnbr) Fire/Burn Severity Studies: The Case of the Large 2007 Peloponnese Wildfires in Greece. Remote Sens. Environ. 2010, 114, 2548–2563. [Google Scholar] [CrossRef]
- Teobaldo, D.; Baptista, G.M. DE M. Measurement of Severity of Fires and Loss of Carbon Forest Sink in The Conservation Units at Distrito Federal. Rev. Bras. Geogr. Física 2016, 9, 250–264. [Google Scholar] [CrossRef]
- Roy, D.P.; Boschetti, L.; Trigg, S.N. Remote Sensing of Fire Severity: Assessing The Performance of the Normalized Burn Ratio. IEEE Geosci. Remote Sens. Lett. 2006, 3, 112–116. [Google Scholar] [CrossRef]
- Miller, J.D.; Thode, A.E. Quantifying Burn Severity in A Heterogeneous Landscape with A Relative Version of the Delta Normalized Burn Ratio (Dnbr). Remote Sens. Environ. 2007, 109, 66–80. [Google Scholar] [CrossRef]
- CPRM Projeto Chapada Diamantina: Parque Nacional Da Chapada Diamantina—BA: Informações Básicas Para a Gestão Territorial: Diagnóstico Do Meio Físico E Da Vegetação 1994. Available online: http://rigeo.cprm.gov.br/xmlui/handle/doc/10196 (accessed on 17 March 2020).
- Funch, L.S.; Santana, R. Serra Do Sincorá: Parque Nacional Da Chapada Diamantina; Radami: Feira de Santana, Brasil, 2008. [Google Scholar]
- ICMBIO Plano De Manejo Para O Parque Nacional Da Chapada Diamantina 2007; ICMBIO: Brasília, Brazil, 2007.
- IBGE. Manual Técnico Da Vegetação Brasileira: Sistema Fitogeográfico, Inventário Das Formações Florestais E Campestres, Técnicas E Manejo De Coleções Botânicas, Procedimentos Para Mapeamentos. 2012. Available online: https://biblioteca.ibge.gov.br/index.php/biblioteca-catalogo?view=detalhes&id=263011 (accessed on 17 March 2020).
- da Silva, S.L.; Baptista, G.M.M. Análise do Grau de Severidade de Áreas Queimadas na Estação Ecológica de Águas Emendadas por Meio de Dados do Landsat 8. Rev. Bras. Geogr. Física 2015, 8, 431–438. [Google Scholar]
- Santos, J.F.; Soares, R.V.; Batista, A.C. Perfil Dos Incêndios Florestais No Brasil Em Áreas Protegidas No Período De 1998 A 2002. Floresta 2006, 36, 8. [Google Scholar] [CrossRef]
- Mesquita, F.W.; Lima, N.R.G.; Gonçalves, C.N.; Berlinck, C.N.; Lintomen, B.S. Histórico Dos Incêndios Na Vegetação Do Parque Nacional Da Chapada Diamantina, Entre 1973 E Abril De 2010. Com. Base Em. Imagens. Landsat. Biodivers. Bras. 2011, 2, 228–246. [Google Scholar]
- Ribeiro, J.F.; Walter, B.M.T. As Principais Fitofisionomias Do Bioma Cerrado. In Cerrado: Ecologia E Flora; Embrapa Cerrado: Brasília, Brazil, 2008; Volume 2, p. 876. [Google Scholar]
- Felde, G.W.; Anderson, G.P.; Adler-Golden, S.M. Analysis of Hyperion Data with The FLAASH Atmospheric Correction Algorithm. In Proceedings of the 2003 IEEE International Geoscience and Remote Sensing Symposium, Toulouse, France, 21–25 July 2003; pp. 90–92. [Google Scholar]
- Soverel, N.O.; Perrakis, D.D.B.; Coops, N.C. Estimating Burn Severity from Landsat Dnbr and Rdnbr Indices Across Western Canada. Remote Sens. Environ. 2010, 114, 1896–1909. [Google Scholar] [CrossRef]
- Fernández-García, V.; Quintano, C.; Taboada, A.; Marcos, E.; Calvo, L.; Fernández-Manso, A. Remote Sensing Applied to The Study of Fire Regime Attributes and Their Influence On Post-Fire Greenness Recovery in Pine Ecosystems. Remote Sens. 2018, 10, 733. [Google Scholar] [CrossRef]


© 2020 by the authors. Licensee MDPI, Basel, Switzerland. This article is an open access article distributed under the terms and conditions of the Creative Commons Attribution (CC BY) license (http://creativecommons.org/licenses/by/4.0/).