1. Introduction
Compound specific isotope analysis (CSIA) has profound impact on geological exploration of oil and gas. Ever since the laboratory-dedicated mass spectrometry-based CSIA became available [
1,
2], there has been a consensus that a field deployable CSIA (FD–CSIA) could find more applications in geological exploration and production [
3,
4,
5,
6], as well as many other environmental and biological applications.
The advances in optical absorption spectroscopy, in particular the transformational progress in cavity-enhanced absorption spectroscopy in the near infrared (NIR) during the past 24 years, have made such field deployable machines technically feasible. However, there are still many detailed technical difficulties that slow the progress of a gas chromatograph–infrared isotope ratio (GC–IR2) instrument that could conduct precise and fast measurements, and yet be free from interferences.
In 2007, Los Gatos Research introduced the first field deployable CSIA instrument [
7] based on a near-IR laser and cavity-enhanced absorption platform, i.e., the off-axis integrated cavity output spectrometer (OA-ICOS) [
8], and have been applied by Geoservices in mud logging for almost ten years, with methane isotope analysis only.
Geolog and Isotech integrated Picarro’s CO
2 isotope analyzer, based on cavity ring-down spectroscopy (CRDS) [
9], with a gas chromatograph and have deployed the system on drilling rigs since 2012 [
10,
11,
12]. The system could analyze methane, ethane and propane in five minutes. The system’s GC resolution is not high because the CO
2 isotope spectrometer’s dead volume is large, and each eluted compound has a peak lasting close to one minute, therefore compromising the GC’s ability to separate interferences from CO and olefins, which are often observed when the drill bit is overheated.
The dead volume of the OA-ICOS and CRDS are all much larger than 1 mL at standard temperature and pressure (STP). The dead volume is defined as the physical volume of the sample cell multiplied by its operating pressure and divided by its operating temperature and normalized to STP conditions. The response time of the sample cell is therefore the same or longer than the ratio of dead volume over the laminar flow rate of the samples. If the sample flow path into and out of the sample cell is not optimized to maintain only laminar flow through the system, then the response time is extended and determined by diffusion time, which is often the case for OA-ICOS and CRDS. For the hollow waveguide sample cell introduced in the GC–IR2 system here, the dead volume is minimized by orders of magnitude and is explained in detail later in the experimental section below.
Modern fast drilling capability also puts extra demand on the sampling speed for mud gas isotope sampling and logging. It is desirable to have a sampling speed for all methane, ethane and propane at every two minutes or even faster [
5], and with high GC separation capability so that interferences from CO and olefins can be separated from methane, ethane and propane analysis.
The coupling of a mid-infrared (MIR) absorption spectroscopy detector along with GC, i.e., GC–IR, is not a new concept, and in fact, GC–IR was introduced as the first GC coupled detector that could identify chemicals through its MIR spectra besides elution time, even ahead of GC–mass spectrometry (MS) [
13]. Today, GC–IR is also widely used in mud logging, taking a sizable market in mud gas logging during oil and gas explorations. The Bloodhound GC–IR system (iBall Instrument, Tulsa, OK) actually separated seven species, i.e., methane through pentanes, from mud gas in less than 120 s and detected them with MIR absorption detectors. The advantages [
14] of the Bloodhound GC–IR include the use of filtered open air as a carrier gas, thus eliminating consumable gas such as hydrogen, and also the need for calibration is reduced compared to a GC–FID detector because MIR absorption spectroscopy can eliminate much of the baseline drift compared to flame ionization-based detectors.
The first generation of GC–IR suffered from several limits, however, and is therefore witnessing a diminishing role as analytical instruments compared to GC–MS [
13]. The blackbody infrared sources could not propagate efficiently in a narrow bore waveguide, which also act as a sample cell. This limit, as detailed by Griffith, defined the following limitations. The large volume of the sample cell, i.e., 5 cc (cubic centimeter) at STP, which requires GC output that has a flow rate of well over 10 sccm, is often larger than mainstream GC instruments that use capillary columns. The high flow rate means that if the time resolution has to be maintained, an extra makeup flow is required, which dilutes the sample. Also, the optical pathlength of the sample cell is still limited to no more than 20 cm, which is often not enough for sensitive detection of picograms of sample. The scanning speed of the FTIR (Fourier Transform Infrared) spectrometer is also slow and resolution is poor, and cannot give enough averages and resolution to improve the detection limit.
The advent of quantum cascade (QC) lasers operating at room temperature [
15] enables the extension of the MIR sample cell in the second generation GC–IR system from common 10 to 100 cm, while reducing the inside diameter from 5 mm to well under 1 mm, i.e., 0.7 mm. The QC laser’s spectral resolution is much better than 0.001 cm
−1, thus enabling full spectral separation of the isotopomers in the mid-IR range while reducing the sample cell pressure down to 50 Torr, as compared to 1 bar for the first generation GC–IR. This translates into a reduction of the MIR sample cell dead volume to 1/100th of the first generation GC–IR, while increasing the sample path length 10 times. This translates into more than a 1000 fold increase in detection sensitivity and 10 times improvement in resolution or detection speed for the second generation GC–IR [
16], thus enabling the GC–IR
2 system as detailed here. In the near future, as comb QC lasers progress, the scan speed of the QC laser will be even faster, and particularly orders of magnitude wider spectrum at well over 100 cm
–1, with accuracy and resolution also orders of magnitude finer than FTIR; this could totally transform the GC–IR into the new second generation [
17], and what is described here is only the beginning of the second generation GC–IR based on QC lasers.
Here, we present the details of a FD–CSIA system for mud logging applications, the gas chromatograph–infrared isotope ratio (GC–IR2) system. The rig-site-deployed GC–IR2 could perform methane, ethane and propane CSIA for mud gases at a high speed, every two minutes per sample, with good separation of CO and olefins from methane, ethane and propane, and at accuracy the same as laboratory-dedicated CSIA instruments. These unique advantages cannot be realized with the old optical absorption spectroscopy techniques that are outlined above.
2. Materials and Methods
The GC–IR
2 incorporated several features as described below, in order to operate in the field at high precision and fast sampling speed. The schematic of the system is given in
Figure 1. The details are given in the subsections that follow.
2.1. Air as Carrier Gas
Air as a carrier gas is used to improve the duty cycle and availability of the system during high speed drilling. The use of air as a carrier also significantly reduces the cost of operation, and makes field operation with a high pressure cylinder a possibility. Currently, the system has been verified and field tested to be able to operate with a zero air generator with 300 sccm and 60 psi capability. In the field, a compressed zero air cylinder with 300 cubic feet (8.5 cubic meters) of air can last 24 h in operation for up to a month, which is quite easy to furnish in most rig operations.
To accommodate the air as carrier gas, the GC uses rugged packed columns with silica gel and carbo-pack B as the column stationary material in both normal separation GC columns as well as in precolumns, which are both safe to operate with air as carrier gas over long periods of time and elevated temperatures over 200 °C.
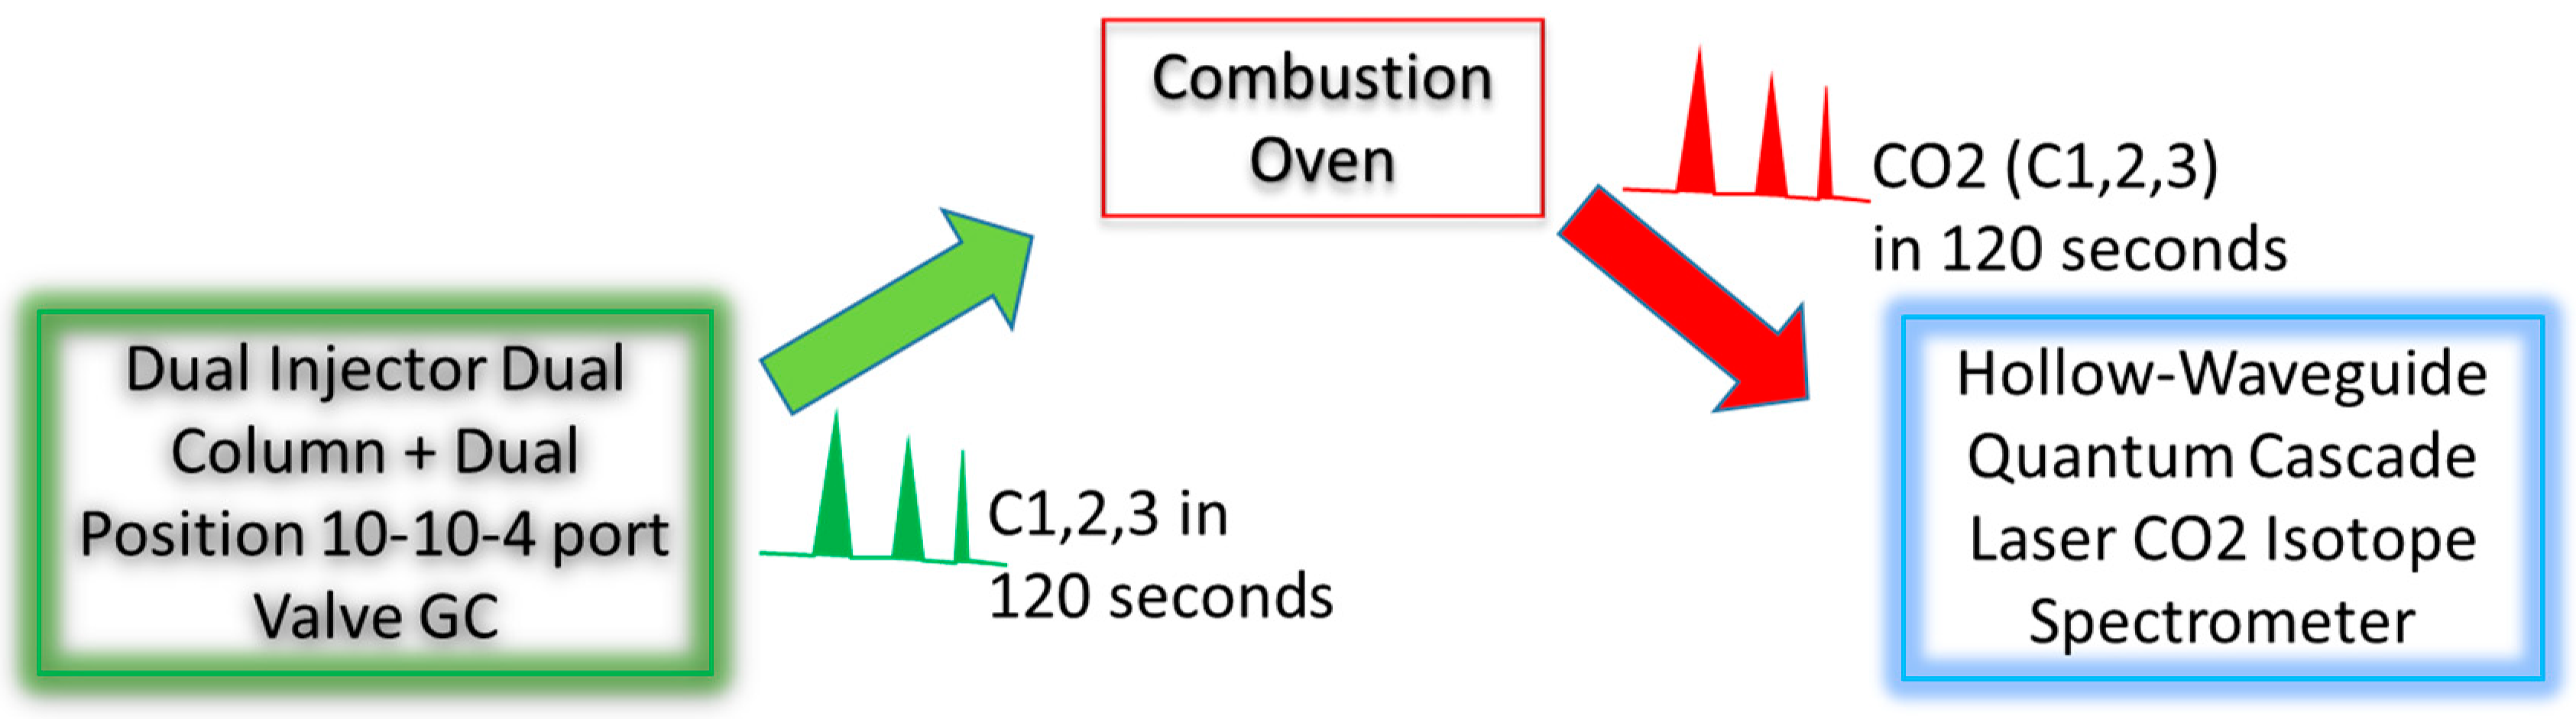
2.2. Combustion/Oxidation Module
The output from the GC is streamlined into a 1/8 inch OD and 1.8 mm ID ceramic combustion tube module, where the methane, ethane and propane are combusted completely into CO2 and water, resulting in output CO2 peaks corresponding to methane, ethane and propane.
The combustion module uses nickel–copper oxides as combustion catalysts, as have other CSIA carbon combustion modules described in past references [
1,
2]. The Ni–Cu oxide catalysts inside the ceramic tube operate at 1100 °C to guarantee complete combustion.
The complete combustion of methane is verified by the hollow-waveguide (HWG) spectrometer, with the CO2 isotope measurement laser inside being replaced with a laser that measures methane at 7.8 microns, and we verified that the residual methane is below 10 ppm level even for 20 times overloaded pure CH4 injections.
2.3. GC Automated Fast Cycle Sampling
The GC achieves automated fast cycle sampling with four unique features.
The first unique feature is that the GC (Model 8610-D, SRI Instrument, Torrance, CA, USA) has two injectors, two separate sample injection loops, two columns with two independent electronic pressure controls (EPC) and temperature controls. These two independent injectors are designed for independent analysis of methane only in the first column, and ethane and propane in the second column. This feature is important for mud gas sampling for several reasons. First, the mud gas usually has a much higher methane concentration than ethane and propane concentrations, while the spectrometer has limited dynamic range for analyte input. In order to have the optimal signal in the spectrometer, it is therefore desirable to have two independent injectors to inject different amounts of sample to accommodate the large differences in specific compound concentrations. Second, the use of two injectors and columns with independent EPC and temperature control allow much faster elution and analysis of the three compounds, while purging keeps the two columns free from contamination by higher hydrocarbons.
The second fast sampling cycle feature is achieved through automated control of three automated multiport valves, as depicted in
Figure 2. First, in the first 10-port, two position valve (VICI Valco, TX), the fastest eluting components such as carbon monoxide and methane are separated from carbon dioxide and C2+, i.e., ethane and heavier hydrocarbons, through precolumn 1, during column 1 injection stage. Then, the first 10-port valve is switched to sample loading mode; during this mode, the sample loop 1 is loaded with new mud gas samples while the fastest eluting carbon monoxide and methane move on and are separated in column 1, and at the same time, CO
2 and C2+ trapped in precolumn 1 are purged from the precolumn. Second, in the second 10-port two position valve’s injection mode, eluting components faster than C3 are allowed to pass through precolumn 2, while C4+ are trapped in precolumn 2. Then, in the sample loading mode, sample loop 2 is loaded with new mud gas samples, while the fastest C1~3 compounds elute through column 2, and the C4 and heavier compounds trapped in precolumn 2 are purged out. The third 4-port valve switches the output from the two columns 1 and 2, and allows methane from column 1 and C2 and C3 and ethylene from the column to pass and travel through the combustion tube, eventually to be analyzed. If only analyzing methane, ethane and propane, the cycle could be as short as 100 s, and if CO and CO
2 are also needed, the cycle is extended to 120 and 135 s, respectively.
As shown in
Figure 3, the temperature of the first column is held at constant 35 °C while the second column has temperature ramps from 70 to 120 °C to optimally separate C2, ethylene and C3, while cutting off CO and methane in the front. The pressures for column 1 and 2 are also varied over the cycle to push out the components that will not be analyzed, while extending the peak of the desired compound to optimal width and signal-to-noise ratios.
The third unique feature is the sample loops that accommodate automatic sampling, which also allow large change of dilution factors. The two sample loops, however, have fixed sample volumes. While they are connected in serial, each loop can be independently diluted, and the dilution ratio could be from 1:0 (only mud gas sample flow and no zero air flow) to 1:50 (zero air flow is 50 times the sample gas flow). This feature was not available in previous version of this instrument [
18].
The last unique feature is the software that reads the mud gas concentrations and then automatically adjusts the dilution ratios to prepare the sample concentrations in the optimal linear measurement range of the system. The input of mud gas flow speed is controlled through a mass flow controller, and the software calculates the actual flow of the mud gas at different concentrations of hydrocarbons, and then adjusts dilution zero air flow through another mass flow controller. The mud gas and dilution zero air are mixed together and fed to the two sample loops as described above for the two columns/injectors. Mud logging parameters, such as drill bit and lag depths, as well as hydrocarbon concentrations read from the WITS (Wellsite Information Transfer Specification) network, are logged along with isotope values measured, and also CO and ethylene concentrations if required by operators.
2.4. Spectrometer
The details of the spectrometer are described elsewhere [
16,
18,
19]. Here, briefly, the core of the spectrometer consists of a quantum cascade laser (QCL) and a hollow-waveguide (HWG) sample cell. The QCL operates at 4.3 microns at 35 °C or higher with output over 10 mW, enabling field deployment without water condensation worries. The availability of such high power lasers at above 35 °C is the light source enabler for this spectrometer, resulting from recent development of quantum cascade laser technologies. The HWG has high transmission over 30% after 3-pass and an optical absorption pathlength of 1.1 m. The HWG is maintained at constant temperature, so the Boltzmann distribution of rotational spectra lines are kept constant. Also, the detector operates under elevated 45 °C and together with the high power laser and efficient HWG, enable the spectrometer to have a single shot signal-to-noise ratio better than 300:1. The spectrometer is scanned over the
13CO
2 and
12CO
2 features at 2300 cm
−1 at 5 kHz rate or higher, up to 100 kHz, and the signal is acquired in a high speed an analog-to-digital converter data acquisition system that operates with 12 bit or higher resolution and speeds up to 125 MHz. The data are averaged up to 30,000 times and achieve a final sample waveform signal-to-noise ratio over 3000:1 at 4 Hz or faster, up to a 10 Hz data rate. The final sample waveform is used to fit with Voidt waveform to get accurate peak values for
13CO
2 and
12CO
2.
The current spectrometer consumes about 300–500 W power, mainly due to the power needed to stabilize the temperature of the QCLs and also the driver and spectrometer temperatures. Such power consumption requirement makes such a spectrometer field deployable but not practical to be battery powered.
The dead volume of the 3-pass hollow-waveguide sample cell is only 30 μL STP, and the cross section of the sample flow path is maintained constant. This minimizes the diffusion effect from extending the response time over the lower limit, i.e., the ratio of dead volume over sample flow rate. There is a conventional wisdom that HWG has a narrow inside bore diameter, i.e., 0.7 mm, and there is always a boundary layer which moves at slower speed than the laminar sample flow, and this boundary layer will effectively slow the response of the sample cell and compromise the inherent advantages of HWG, such as low dead volume and optimal flow path cross sections. This conventional wisdom did not consider diffusion which effectively mixes the normally flowing center flow and the boundary layer. The pressure of the sample cell is at 50 Torr with air as the carrier gas and CO2 as the analyte gas, and the diffusion constant is therefore ~240 mm2/sec for CO2 in air (the normal pressure diffusion constant is 16 mm2/sec), and with the inside bore diameter at 0.7 mm or radius of 0.35 mm, the diffusion time is only ~0.4 msec. Therefore, the boundary effect is negligible. This same diffusion effect also enables the capillary chromatograph, because if there is no such diffusion effect, the same boundary layer concern will render separation of capillary columns ineffective, i.e., peaks of analyte will be broadened completely. On the other hand, the larger cross sections in a cavity-enhanced sample cell usually have a diameter much larger than 7 mm, the diffusion constant from the wall of the sample cell to the center will be significantly larger by 2 orders of magnitude.
2.5. Coupling of Spectrometer and GC
The coupling of the spectrometer to the GC is relatively straightforward due to the much less demanding vacuum employed in the spectrometer, as compared to IRMS (Isotope Ratio Mass Spectrometer) or other optical detectors with larger sample cells. The current system is operating under open-air split (OAS) mode, i.e., the GC output has a flow speed higher than the spectrometer intake and is interfaced with the spectrometer by a 150 micron ID sniffing tube. The spectrometer operates at 50 Torr vacuum and the length of the 150 micron ID sniffing tube then determines the constant flow speed inside the spectrometer. The spectrometer flow speed is adjusted to guarantee a 4 Hz refresh rate for the HWG sample cell, usually ~6 sccm (standard cubic centimeter per minute). The GC with packed columns usually flows at rate higher than 12 sccm.
This leaves room for a later upgrade when we replace the OAS with closed low pressure operation, where we could couple the GC with the spectrometer in a closed line, and the signal will be further boosted and the detection limit will be further improved.
4. Discussion
The GC–IR2 has also recently incorporated the latest low temperature combustion–oxidation module which could completely oxidize methane at temperatures as low as 350 °C; the details of the module and the construction and verification will be presented later. The low operating temperature significantly lowered the power consumption for the combustion module, i.e. the power at a low temperature of 350 °C is only 15 W, i.e., one-tenth of the power operating at 1100 °C. The low temperature also reduces the fire/explosion hazard level in the mud logging operations, especially when the system is deployed in a crowded rig site, i.e., ocean rigs, where combustible gases pose hazardous threats. Operation maintenance is also expected to benefit greatly from lower temperature operation.
The current system operates under open-air split (OAS) mode, with the GC flowing at higher speed than required by the spectrometer. This OAS mode wastes the samples and requires higher carrier gas pressure and flow that dilute samples as well. The system performance could be further improved when the GC columns will be operating under subatmospheric low pressure mode [
20]. The low pressure operation is an inherent advantage given by the moderately high pumping speed of the HWG spectrometer, and when operating under low pressure, the sample dilution along with GC elution time are reduced, thus enabling improvements in sampling speed and sensitivity. We expect a reduction of elution time from 120 s to under 100 s while still maintaining the GC resolution and detection limit.
The current field deployable system is made possible due to the maturity of mid-IR QCL lasers, and as the mid-IR lasers continue to mature, the system performance will continue to improve. One noteworthy possible improvement will be the incorporation of more efficient interband cascade lasers (ICLs); ICLs could reduce the amount of power consumption significantly, thus reducing the size and footprint of the final system significantly, and an ultraportable battery powered system that fits in a shoe box will be possible in the near future.
Similar field deployable GC–IR2 HWG systems could be applied well beyond the oil and gas sector, especially for geological, environmental and biological analyses that require fast sampling speed and ultraportability. Work is underway to analyze liquid water and fatty acid with these systems and will be reported in separate work.
