Quantitative Analysis of Pore Space Structure in Dry and Wet Soil by Integral Geometry Methods
Abstract
:1. Introduction
2. Materials and Methods
2.1. Sample Preparation and Wetting Process
2.2. X-ray Computed Tomography and Image Analysis
3. Minkowski Functionals and Betti Numbers
3.1. Theory
3.2. Algorithms
3.3. Mathematical Morphology: Erosion, Dilatation, and Opening Operations
4. Results and Discussion
4.1. Topological Analysis of All Samples
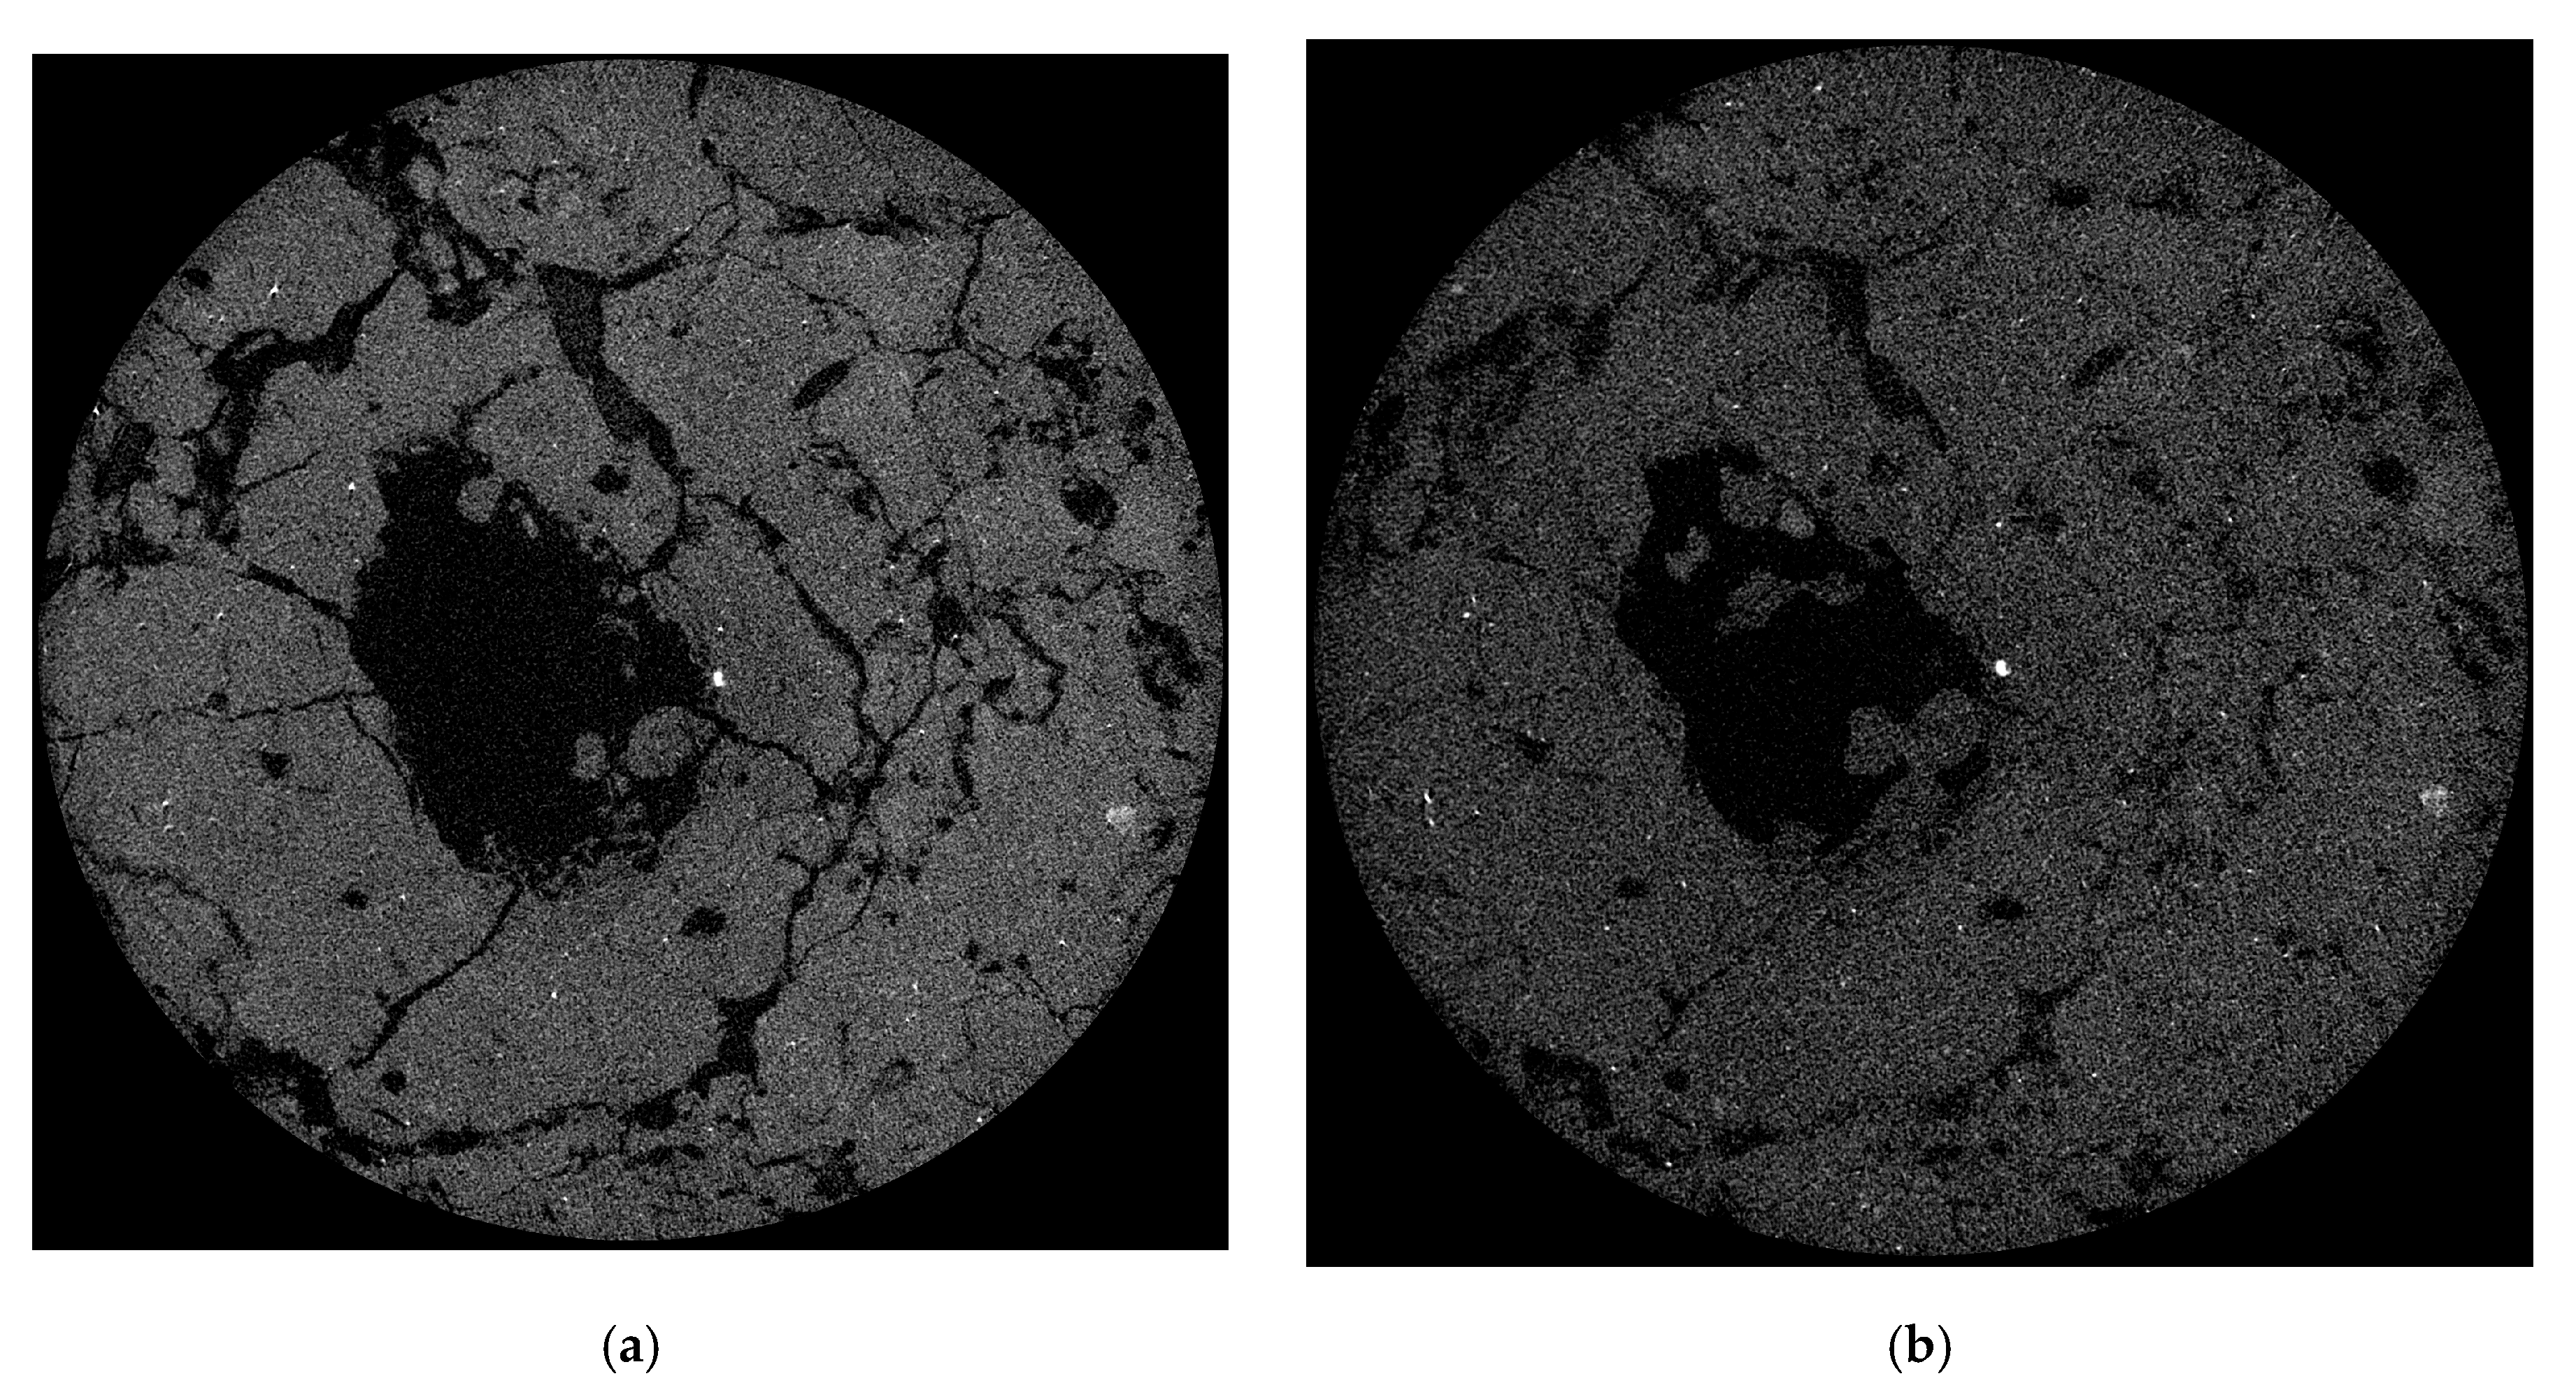
- Samples with a “normal” topology change (samples from 20–90 cm depth, horizons A2, AB, and B2). Both Betti numbers (number of connected clusters and number of tunnels) decreased during swelling. The Euler-Poincare characteristic change was determined by the correlation between closed pores and closed tunnels: In the samples from the above-mentioned horizons the number of closed pores was bigger than the number of closed tunnels: (), so the Euler-Poincare value decreased. These samples were taken from the horizons which had not been agriculturally exploited, so a denser (>1.3 g/cm3) and more stable structure was preserved. Upon wetting, some tunnels are closed, or at least partly closed, allowing them to be subsumed to the category of individual pores. In one of the samples taken from 20–30 cm depth from the A2 horizon (sample 6), the number of closed pores was smaller than the number of closed tunnels and the Euler-Poincare value increased. The correlation can be explained by the individual structural features of the samples, particularly by the large number of small tunnels which closed during wetting (Figure S17).
- Samples with an “irregular” changing topology (0–20 cm, arable horizon). In these samples, the (number of tunnels) decreased, but the (number of connected clusters) increased during the wetting process. In this case, an increase in the number of small pores was observed (this was also proved by the increasing integral mean curvature in that range). Apparently, during the swelling, some pores become smaller but not enough to close. Another explanation can be a mechanism whereby small pores do not close up because they are filled with an X-ray transparent substance, for example, clamped pendular water [53]. In samples from the arable horizon at a depth of 10–20 cm, a number of tunnels narrowed slightly, which can be explained by the presence of plant roots in most tunnels. For the majority of agricultural crops in a mild climate, about 50% of all plant roots are accumulated at a depth of 8–20 cm [54]. These roots can keep tunnels open during soil wetting. It should be noted that in one of the samples from the arable horizon at a depth of 0–10 cm (sample 2), the change in the topology of the pore space occurred in agreement with the “normal” change (Figure S13).
4.2. The Detailed Analysis of the Sample from the B2 Horizon
5. Conclusions
Supplementary Materials
Author Contributions
Funding
Acknowledgments
Conflicts of Interest
Appendix A
| Depth, cm | Horizons | Soil Texture Diameter, mm | Density, g/cm3 | FC, % vol. | Sat. Hydraulic Conductivity, cm/Days | ||
|---|---|---|---|---|---|---|---|
| <0.002 | 0.002–0.05 | >0.05 | |||||
| 0–5 | Arable | 17.39 | 80.66 | 1.95 | 1.1 | 37.3 | 60 |
| 0–10 | 17.35 | 80.21 | 2.44 | 1.16 | 37.2 | 58 | |
| 10–20 | 17.21 | 80 | 2.79 | 1.21 | 37 | 52 | |
| 20–30 | A2 | 17.03 | 81.62 | 1.75 | 1.33 | 38.6 | 26 |
| 30–40 | 16 | 82.43 | 1.57 | 1.36 | 38.2 | 32 | |
| 40–50 | AB | 17.35 | 81.76 | 0.89 | 1.33 | 37.4 | 35 |
| 50–60 | 17.32 | 82.09 | 0.59 | 1.39 | 35.3 | 35 | |
| 80–100 | B2 | 18.4 | 81.1 | 0.5 | 1.4 | 37.6 | 28.5 |


References
- Zhao, S.; Zhao, Y.; Wu, J. Quantitative analysis of soil pores under natural vegetation successions on the Loess Plateau. Sci. China Earth Sci. 2010, 53, 617–625. [Google Scholar] [CrossRef]
- Costanza-Robinson, M.S.; Estabrook, B.D.; Fouhey, D.F. Representative elementary volume estimation for porosity, moisture saturation, and air-water interfacial areas in unsaturated porous media: Data quality implications. Water Resour. Res. 2011, 47. [Google Scholar] [CrossRef]
- Rigby, S.P.; Chigada, P.I.; Wang, J.; Wilkinson, S.K.; Bateman, H.; Al-Duri, B.; Wood, J.; Bakalis, S.; Miri, T. Improving the interpretation of mercury porosimetry data using computerised X-ray tomography and mean-field DFT. Chem. Eng. Sci. 2011, 66, 2328–2339. [Google Scholar] [CrossRef] [Green Version]
- Karsanina, M.V.; Gerke, K.M.; Skvortsova, E.B.; Ivanov, A.L.; Mallants, D. Enhancing image resolution of soils by stochastic multiscale image fusion. Geoderma 2018, 314, 138–145. [Google Scholar] [CrossRef]
- Houston, A.N.; Otten, W.; Falconer, R.; Monga, O.; Baveye, P.C.; Hapca, S.M. Quantification of the pore size distribution of soils: Assessment of existing software using tomographic and synthetic 3D images. Geoderma 2017, 299, 73–82. [Google Scholar] [CrossRef] [Green Version]
- Leue, M.; Uteau-Puschmann, D.; Peth, S.; Nellesen, J.; Kodešová, R.; Gerke, H.H. Separation of Soil Macropore Types in Three-Dimensional X-Ray Computed Tomography Images Based on Pore Geometry Characteristics. Vadose Zone J. 2019, 18, 1–13. [Google Scholar] [CrossRef] [Green Version]
- Armstrong, R.T.; McClure, J.E.; Robins, V.; Liu, Z.; Arns, C.H.; Schlüter, S.; Berg, S. Porous Media Characterization Using Minkowski Functionals: Theories, Applications and Future Directions. Transp. Porous Media 2018. [Google Scholar] [CrossRef]
- Gregorová, E.; Uhlířová, T.; Pabst, W.; Diblíková, P.; Sedlářová, I. Microstructure characterization of mullite foam by image analysis, mercury porosimetry and X-ray computed microtomography. Ceram. Int. 2018, 44, 12315–12328. [Google Scholar] [CrossRef]
- Pabst, W.; Uhlířová, T.; Gregorová, E. Microstructure Characterization of Porous Ceramics Via Minkowski Functionals. In Ceramic Transactions Series; Singh, D., Fukushima, M., Kim, Y.-W., Shimamura, K., Imanaka, N., Ohji, T., Amoroso, J., Lanagan, M., Eds.; John Wiley & Sons, Inc.: Hoboken, NJ, USA, 2018; pp. 53–64. ISBN 978-1-119-49409-6. [Google Scholar]
- Tsukanov, A.; Ivonin, D.; Gotman, I.; Gutmanas, E.Y.; Grachev, E.; Pervikov, A.; Lerner, M. Lerner Effect of Cold-Sintering Parameters on Structure, Density, and Topology of Fe–Cu Nanocomposites. Materials 2020, 13, 541. [Google Scholar] [CrossRef] [PubMed] [Green Version]
- Mecke, K.R.; Wagner, H. Euler characteristic and related measures for random geometric sets. J Stat. Phys. 1991, 64, 843–850. [Google Scholar] [CrossRef]
- Arns, C.H.; Knackstedt, M.A.; Mecke, K.R. Characterisation of irregular spatial structures by parallel sets and integral geometric measures. Colloids Surf. A Physicochem. Eng. Asp. 2004, 241, 351–372. [Google Scholar] [CrossRef] [Green Version]
- Arns, C.; Knackstedt, M.; Martys, N. Cross-property correlations and permeability estimation in sandstone. Phys. Rev. E 2005, 72, 046304. [Google Scholar] [CrossRef] [PubMed] [Green Version]
- Feng, Y.; Wang, J.; Liu, T.; Bai, Z.; Reading, L. Using computed tomography images to characterize the effects of soil compaction resulting from large machinery on three-dimensional pore characteristics in an opencast coal mine dump. J. Soils Sediments 2019, 19, 1467–1478. [Google Scholar] [CrossRef]
- San José Martínez, F.; Martín, L.; García-Gutiérrez, C. Minkowski Functionals of Connected Soil Porosity as Indicators of Soil Tillage and Depth. Front. Environ. Sci. 2018, 6, 55. [Google Scholar] [CrossRef] [Green Version]
- San José Martínez, F.; Muñoz Ortega, F.J.; Caniego Monreal, F.J.; Kravchenko, A.N.; Wang, W. Soil aggregate geometry: Measurements and morphology. Geoderma 2015, 237–238, 36–48. [Google Scholar] [CrossRef]
- Çeçen, A.; Wargo, E.A.; Hanna, A.C.; Turner, D.M.; Kalidindi, S.R.; Kumbur, E.C. 3-D Microstructure Analysis of Fuel Cell Materials: Spatial Distributions of Tortuosity, Void Size and Diffusivity. J. Electrochem. Soc. 2012, 159, B299–B307. [Google Scholar] [CrossRef]
- Wyss, P.; Flisch, A.; Lehmann, E.; Vontobel, P.; Krafczyk, M.; Kaestner, A.; Beckmann, F.; Gygi, A.; Flühler, H. Tomographical Imaging and Mathematical Description of Porous Media Used for the Prediction of Fluid Distribution. Vadose Zone J. 2006, 5. [Google Scholar] [CrossRef] [Green Version]
- Wang, W.; Kravchenko, A.N.; Smucker, A.J.M.; Liang, W.; Rivers, M.L. Intra-aggregate Pore Characteristics: X-ray Computed Microtomography Analysis. Soil Sci. Soc. Am. J. 2012, 76, 1159–1171. [Google Scholar] [CrossRef] [Green Version]
- San José Martínez, F.; Muñoz-Ortega, F.; Caniego, J.; Peregrina, F. Morphological Functions to Quantify Three-Dimensional Tomograms of Macropore Structure in a Vineyard Soil with Two Different Management Regimes. Vadose Zone J. 2013, 12. [Google Scholar] [CrossRef] [Green Version]
- Berg, C.F. Permeability Description by Characteristic Length, Tortuosity, Constriction and Porosity. Transp. Porous Media 2014, 103, 381–400. [Google Scholar] [CrossRef] [Green Version]
- Akai, T.; Lin, Q.; Alhosani, A.; Bijeljic, B.; Blunt, M. Quantification of Uncertainty and Best Practice in Computing Interfacial Curvature from Complex Pore Space Images. Materials 2019, 12, 2138. [Google Scholar] [CrossRef] [Green Version]
- McClure, J.E.; Armstrong, R.T.; Berrill, M.A.; Schlüter, S.; Berg, S.; Gray, W.G.; Miller, C.T. A geometric state function for two-fluid flow in porous media. Phys. Rev. Fluids 2018, 3, 084306. [Google Scholar] [CrossRef]
- Vogel, H.-J. Topological Characterization of Porous Media. In Morphology of Condensed Matter; Mecke, K., Stoyan, D., Eds.; Springer: Berlin/Heidelberg, Germany, 2002; Volume 600, pp. 75–92. ISBN 978-3-540-44203-5. [Google Scholar]
- Falconer, R.E.; Houston, A.N.; Otten, W.; Baveye, P.C. Emergent Behavior of Soil Fungal Dynamics: Influence of Soil Architecture and Water Distribution. Soil Sci. 2012, 177, 111–119. [Google Scholar] [CrossRef] [Green Version]
- Khachkova, T.S.; Bazaikin, Y.V.; Lisitsa, V.V. Use of the computational topology to analyze the pore space changes during chemical dissolution. Numer. Methods Program. 2020, 21, 41–55. [Google Scholar] [CrossRef]
- Diel, J.; Vogel, H.-J.; Schlüter, S. Impact of wetting and drying cycles on soil structure dynamics. Geoderma 2019, 345, 63–71. [Google Scholar] [CrossRef]
- Weller, U.; Leuther, F.; Schlüter, S.; Vogel, H.-J. Quantitative Analysis of Water Infiltration in Soil Cores Using X-Ray. Vadose Zone J. 2018, 17. [Google Scholar] [CrossRef] [Green Version]
- Pires, L.F.; Auler, A.C.; Roque, W.L.; Mooney, S.J. X-ray microtomography analysis of soil pore structure dynamics under wetting and drying cycles. Geoderma 2020, 362, 114103. [Google Scholar] [CrossRef] [PubMed]
- Vogel, H.-J.; Roth, K. Quantitative morphology and network representation of soil pore structure. Adv. Water Resour. 2001, 24, 233–242. [Google Scholar] [CrossRef]
- Vogel, H.J. Morphological determination of pore connectivity as a function of pore size using serial sections. Eur. J. Soil Sci. 1997, 48, 365–377. [Google Scholar] [CrossRef]
- Vogel, H.J.; Kretzschmar, A. Topological characterization of pore space in soil—Sample preparation and digital image-processing. Geoderma 1996, 73, 23–38. [Google Scholar] [CrossRef]
- Vogel, H.-J.; Weller, U.; Schlüter, S. Quantification of soil structure based on Minkowski functions. Comput. Geosci. 2010, 36, 1236–1245. [Google Scholar] [CrossRef]
- Shein, E.V.; Troshina, O.A. Physical properties of soils and the simulation of the hydrothermal regime for the complex soil cover of the Vladimir Opol’e region. Eurasian Soil Sci. 2012, 45, 968–976. [Google Scholar] [CrossRef]
- Shein, E.V.; Kiryushin, V.I.; Korchagin, A.A.; Mazirov, M.A.; Dembovetskii, A.V.; Il’in, L.I. Assessment of agronomic homogeneity and compatibility of soils in the Vladimir Opolie region. Eurasian Soil Sci. 2017, 50, 1166–1172. [Google Scholar] [CrossRef]
- Feldkamp, L.A.; Davis, L.C.; Kress, J.W. Practical cone-beam algorithm. J. Opt. Soc. Am. 1984, 1, 612–619. [Google Scholar] [CrossRef] [Green Version]
- Schindelin, J.; Arganda-Carreras, I.; Frise, E.; Kaynig, V.; Longair, M.; Pietzsch, T.; Preibisch, S.; Rueden, C.; Saalfeld, S.; Schmid, B.; et al. Fiji: An open-source platform for biological-image analysis. Nat. Methods 2012, 9, 676–682. [Google Scholar] [CrossRef] [Green Version]
- Li, C.H.; Lee, C.K. Minimum cross entropy thresholding. Pattern Recognit. 1993, 26, 617–625. [Google Scholar] [CrossRef]
- Hadwiger, H. Vorlesungen Über Inhalt, Oberfläche und Isoperimetrie; Springer: Berlin/Heidelberg, Germany, 1957. [Google Scholar]
- Michielsen, K.; De Raedt, H. Integral-geometry morphological image analysis. Phys. Rep. 2001, 347, 461–538. [Google Scholar] [CrossRef] [Green Version]
- Bazaikin, Y.; Gurevich, B.; Iglauer, S.; Khachkova, T.; Kolyukhin, D.; Lebedev, M.; Lisitsa, V.; Reshetova, G. Effect of CT image size and resolution on the accuracy of rock property estimates: EFFECT OF CT IMAGE SCALE. J. Geophys. Res. Solid Earth 2017, 122, 3635–3647. [Google Scholar] [CrossRef]
- Rabot, E.; Wiesmeier, M.; Schlüter, S.; Vogel, H.-J. Soil structure as an indicator of soil functions: A review. Geoderma 2018, 314, 122–137. [Google Scholar] [CrossRef]
- Baveye, P.C.; Otten, W.; Kravchenko, A.; Balseiro-Romero, M.; Beckers, É.; Chalhoub, M.; Darnault, C.; Eickhorst, T.; Garnier, P.; Hapca, S.; et al. Emergent Properties of Microbial Activity in Heterogeneous Soil Microenvironments: Different Research Approaches Are Slowly Converging, Yet Major Challenges Remain. Front. Microbiol. 2018, 9. [Google Scholar] [CrossRef]
- Werman, M.; Wright, M.L. Intrinsic Volumes of Random Cubical Complexes. Discret. Comput. Geom. 2016, 56, 93–113. [Google Scholar] [CrossRef] [Green Version]
- Kaczynski, T.; Mischaikow, K.; Mrozek, M. Computational Homology; Applied Mathematical Sciences; Springer-Verlag: New York, NY, USA, 2004; ISBN 978-0-387-40853-8. [Google Scholar]
- Schladitz, K.; Ohser, J.; Nagel, W. Measuring Intrinsic Volumes in Digital 3d Images. In Discrete Geometry for Computer Imagery; Kuba, A., Nyúl, L.G., Palágyi, K., Eds.; Springer: Berlin/Heidelberg, Germany, 2006; Volume 4245, pp. 247–258. ISBN 978-3-540-47651-1. [Google Scholar]
- Legland, D.; Kiêu, K.; Devaux, M.-F. Computation of Minkowski measures on 2D and 3D binary images. Image Anal. Stereol. 2011, 26, 83. [Google Scholar] [CrossRef] [Green Version]
- 3-D Volumetric Image Processing—MATLAB & Simulink. Available online: https://www.mathworks.com/help/images/3d-volumetric-image-processing.html?s_tid=CRUX_lftnav (accessed on 18 August 2020).
- Schindelin, J.; Rueden, C.T.; Hiner, M.C.; Eliceiri, K.W. The ImageJ ecosystem: An open platform for biomedical image analysis. Mol. Reprod. Dev. 2015, 82, 518–529. [Google Scholar] [CrossRef] [PubMed] [Green Version]
- Serra, J. Image Analysis and Mathematical Morphology; Academic Press, Inc.: Orlando, FL, USA, 1983; ISBN 978-0-12-637240-3. [Google Scholar]
- San José Martínez, F.; Muñoz-Ortega, F.; Caniego, J.; Peregrina, F. Morphological Functions with Parallel Sets for the Pore Space of X-ray CT Images of Soil Columns. Pure Appl. Geophys. 2014. [Google Scholar] [CrossRef]
- Ohser, J.; Schladitz, K. 3D Images of Materials Structures: Processing and Analysis; Wiley-VCH Verlag GmbH & Co. KGaA: Weinheim, Germany, 2009; ISBN 978-3-527-62830-8. [Google Scholar]
- Faybishenko, B.A. Hydraulic Behavior of Quasi-Saturated Soils in the Presence of Entrapped Air: Laboratory Experiments. Water Resour. Res. 1995, 31, 2421–2435. [Google Scholar] [CrossRef]
- Fan, J.; McConkey, B.; Wang, H.; Janzen, H. Root distribution by depth for temperate agricultural crops. Field Crop. Res. 2016, 189, 68–74. [Google Scholar] [CrossRef] [Green Version]


| Sample | Depth, cm | Horizon | Topology | |||
|---|---|---|---|---|---|---|
| 1 | 0–10 | Arable | Irregular | > | > | < |
| 2 | 0–10 | Arable | Normal | > | < | < |
| 3 | 0–10 | Arable | Irregular | > | > | < |
| 4 | 10–20 | Arable | Irregular | > | > | < |
| 5 | 10–20 | Arable | Irregular | > | > | < |
| 6 | 20–30 | A2 | Normal | > | < | < |
| 7 | 20–30 | A2 | Normal | < | < | < |
| 8 | 30–40 | A2 | Normal | < | < | < |
| 9 | 30–40 | A2 | Normal | < | < | < |
| 10 | 40–50 | AB | Normal | < | < | < |
| 11 | 40–50 | AB | Normal | - | - | - |
| 12 | 80–90 | B2 | Normal | < | < | < |
| 13 | 80–90 | B2 | Normal | < | < | < |
© 2020 by the authors. Licensee MDPI, Basel, Switzerland. This article is an open access article distributed under the terms and conditions of the Creative Commons Attribution (CC BY) license (http://creativecommons.org/licenses/by/4.0/).
Share and Cite
Ivonin, D.; Kalnin, T.; Grachev, E.; Shein, E. Quantitative Analysis of Pore Space Structure in Dry and Wet Soil by Integral Geometry Methods. Geosciences 2020, 10, 365. https://doi.org/10.3390/geosciences10090365
Ivonin D, Kalnin T, Grachev E, Shein E. Quantitative Analysis of Pore Space Structure in Dry and Wet Soil by Integral Geometry Methods. Geosciences. 2020; 10(9):365. https://doi.org/10.3390/geosciences10090365
Chicago/Turabian StyleIvonin, Dmitriy, Timofey Kalnin, Eugene Grachev, and Evgeny Shein. 2020. "Quantitative Analysis of Pore Space Structure in Dry and Wet Soil by Integral Geometry Methods" Geosciences 10, no. 9: 365. https://doi.org/10.3390/geosciences10090365
APA StyleIvonin, D., Kalnin, T., Grachev, E., & Shein, E. (2020). Quantitative Analysis of Pore Space Structure in Dry and Wet Soil by Integral Geometry Methods. Geosciences, 10(9), 365. https://doi.org/10.3390/geosciences10090365


