
Alginite-Rich Layers in the Bazhenov Deposits of Western Siberia

 , , ,
, , ,
Abstract
:1. Introduction
2. Geological Setting
3. Materials and Methods
4. Results
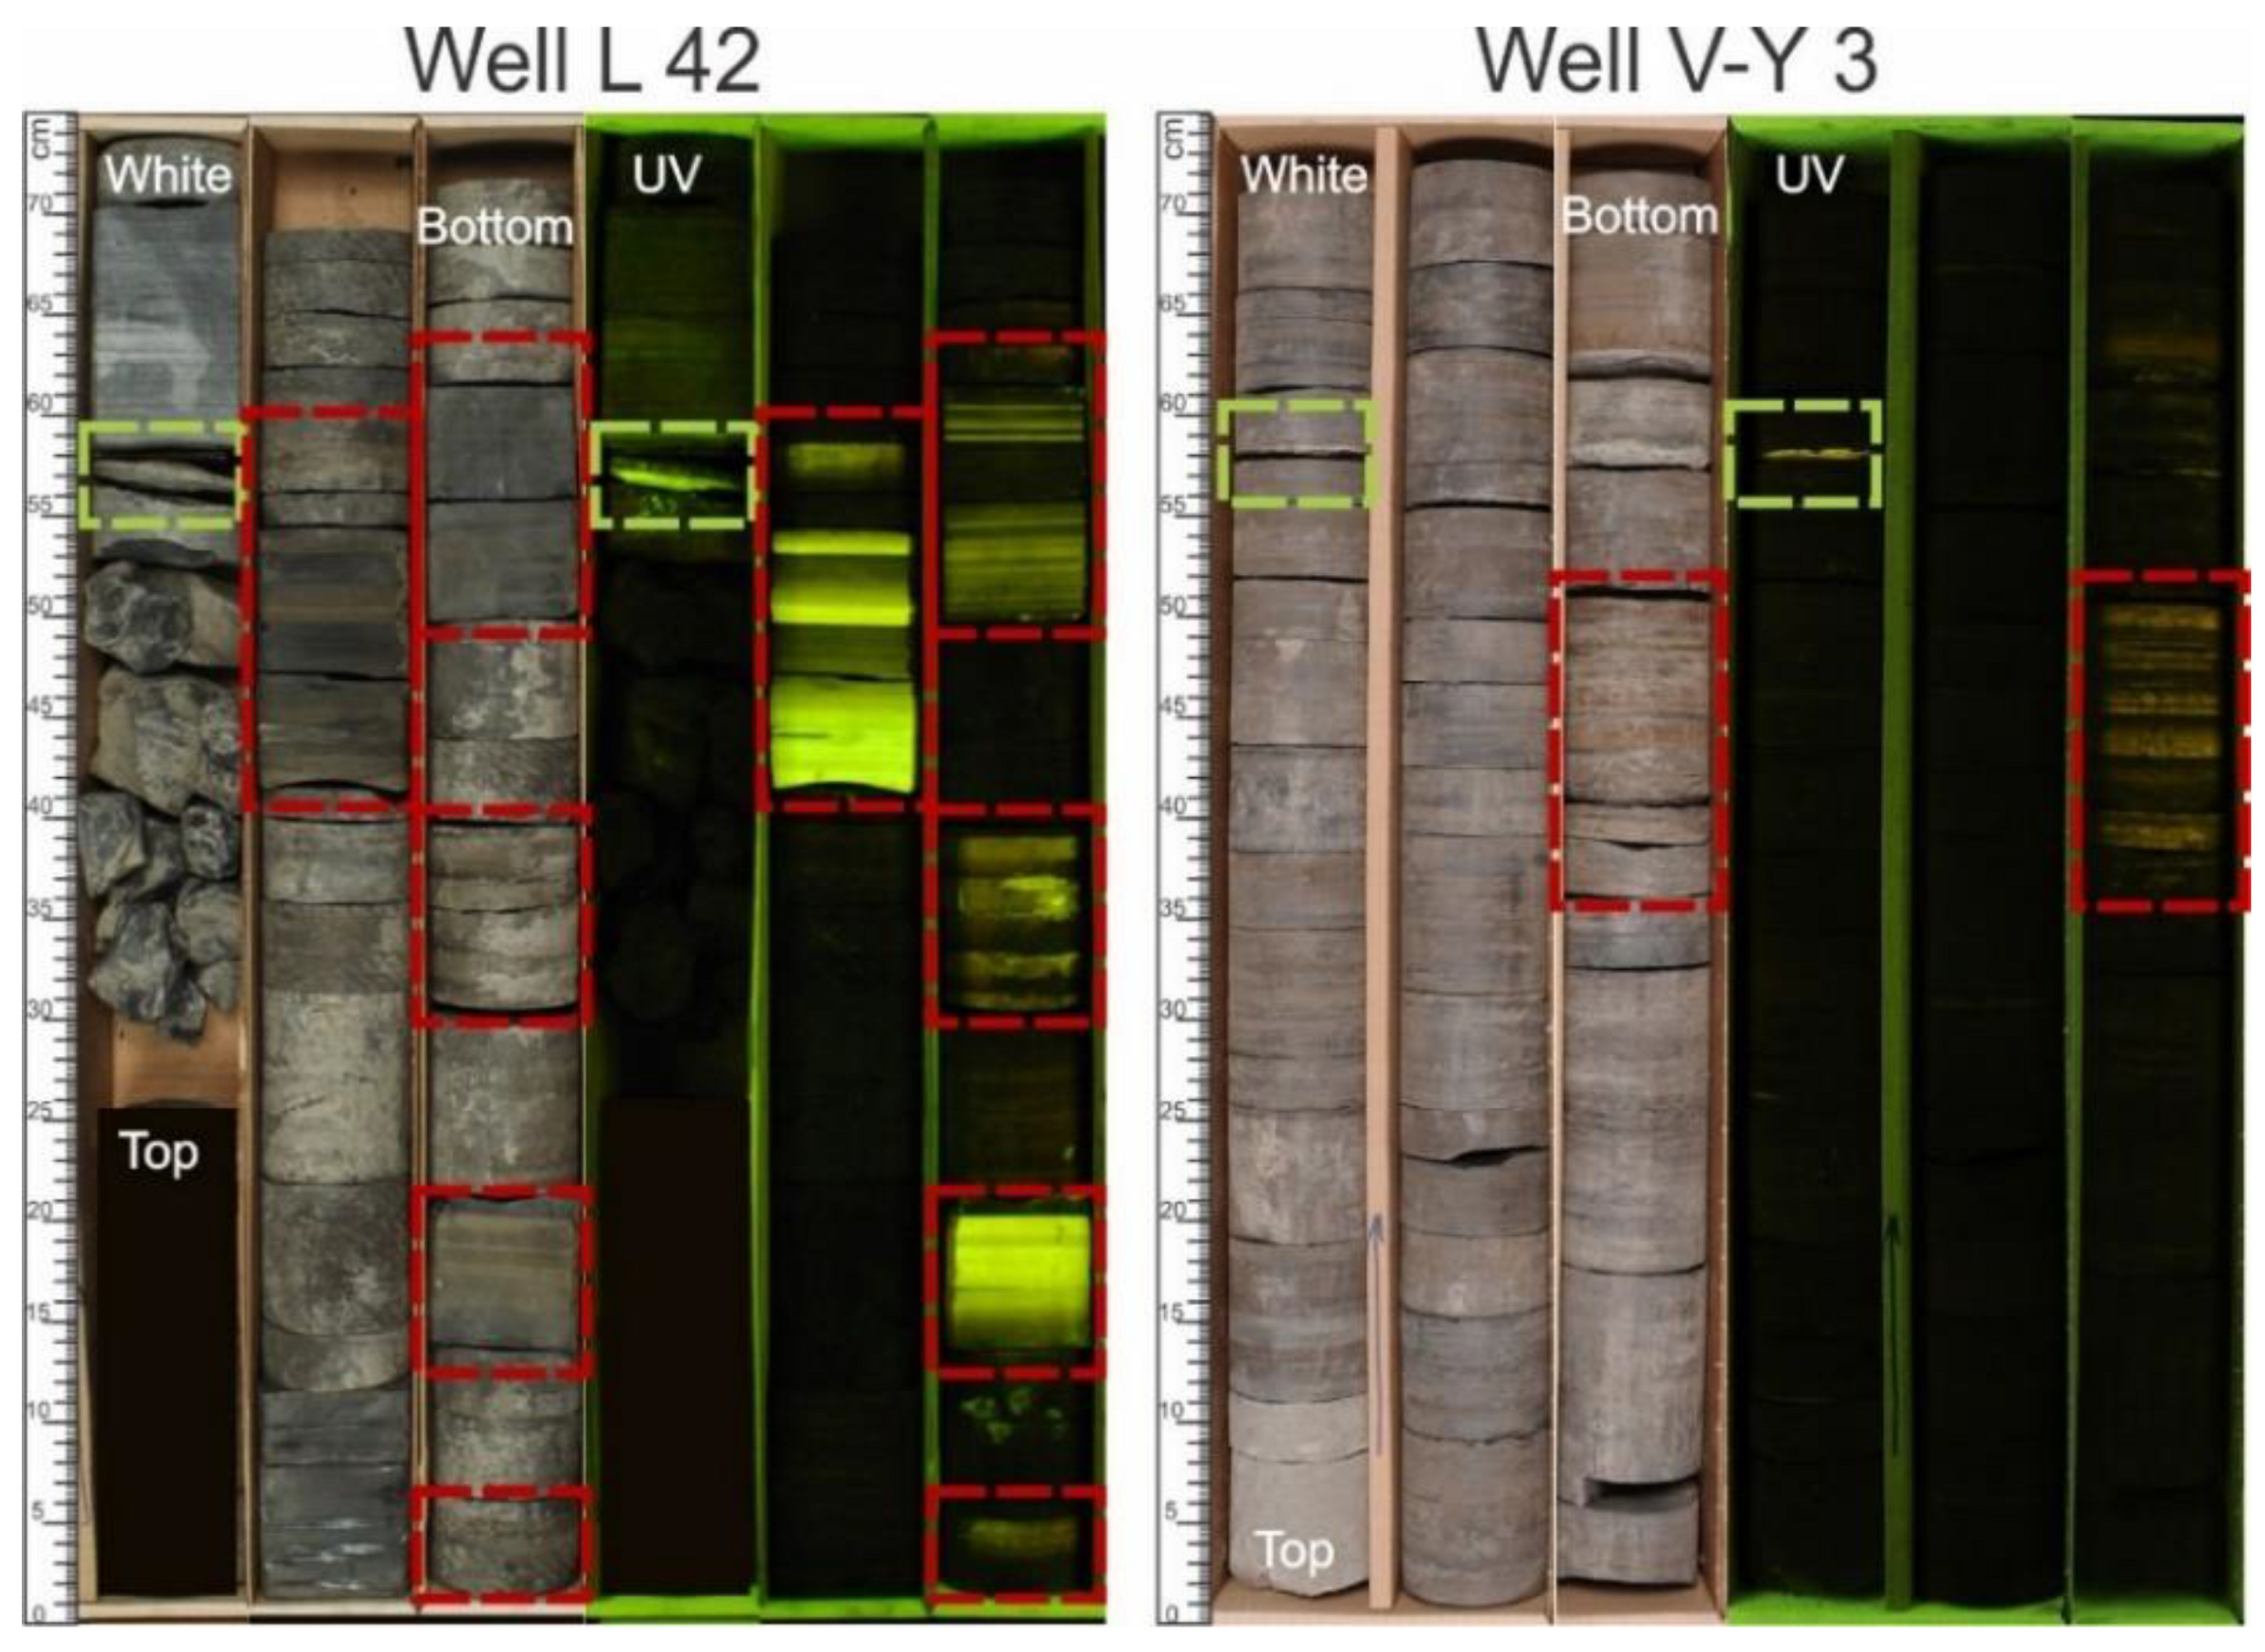
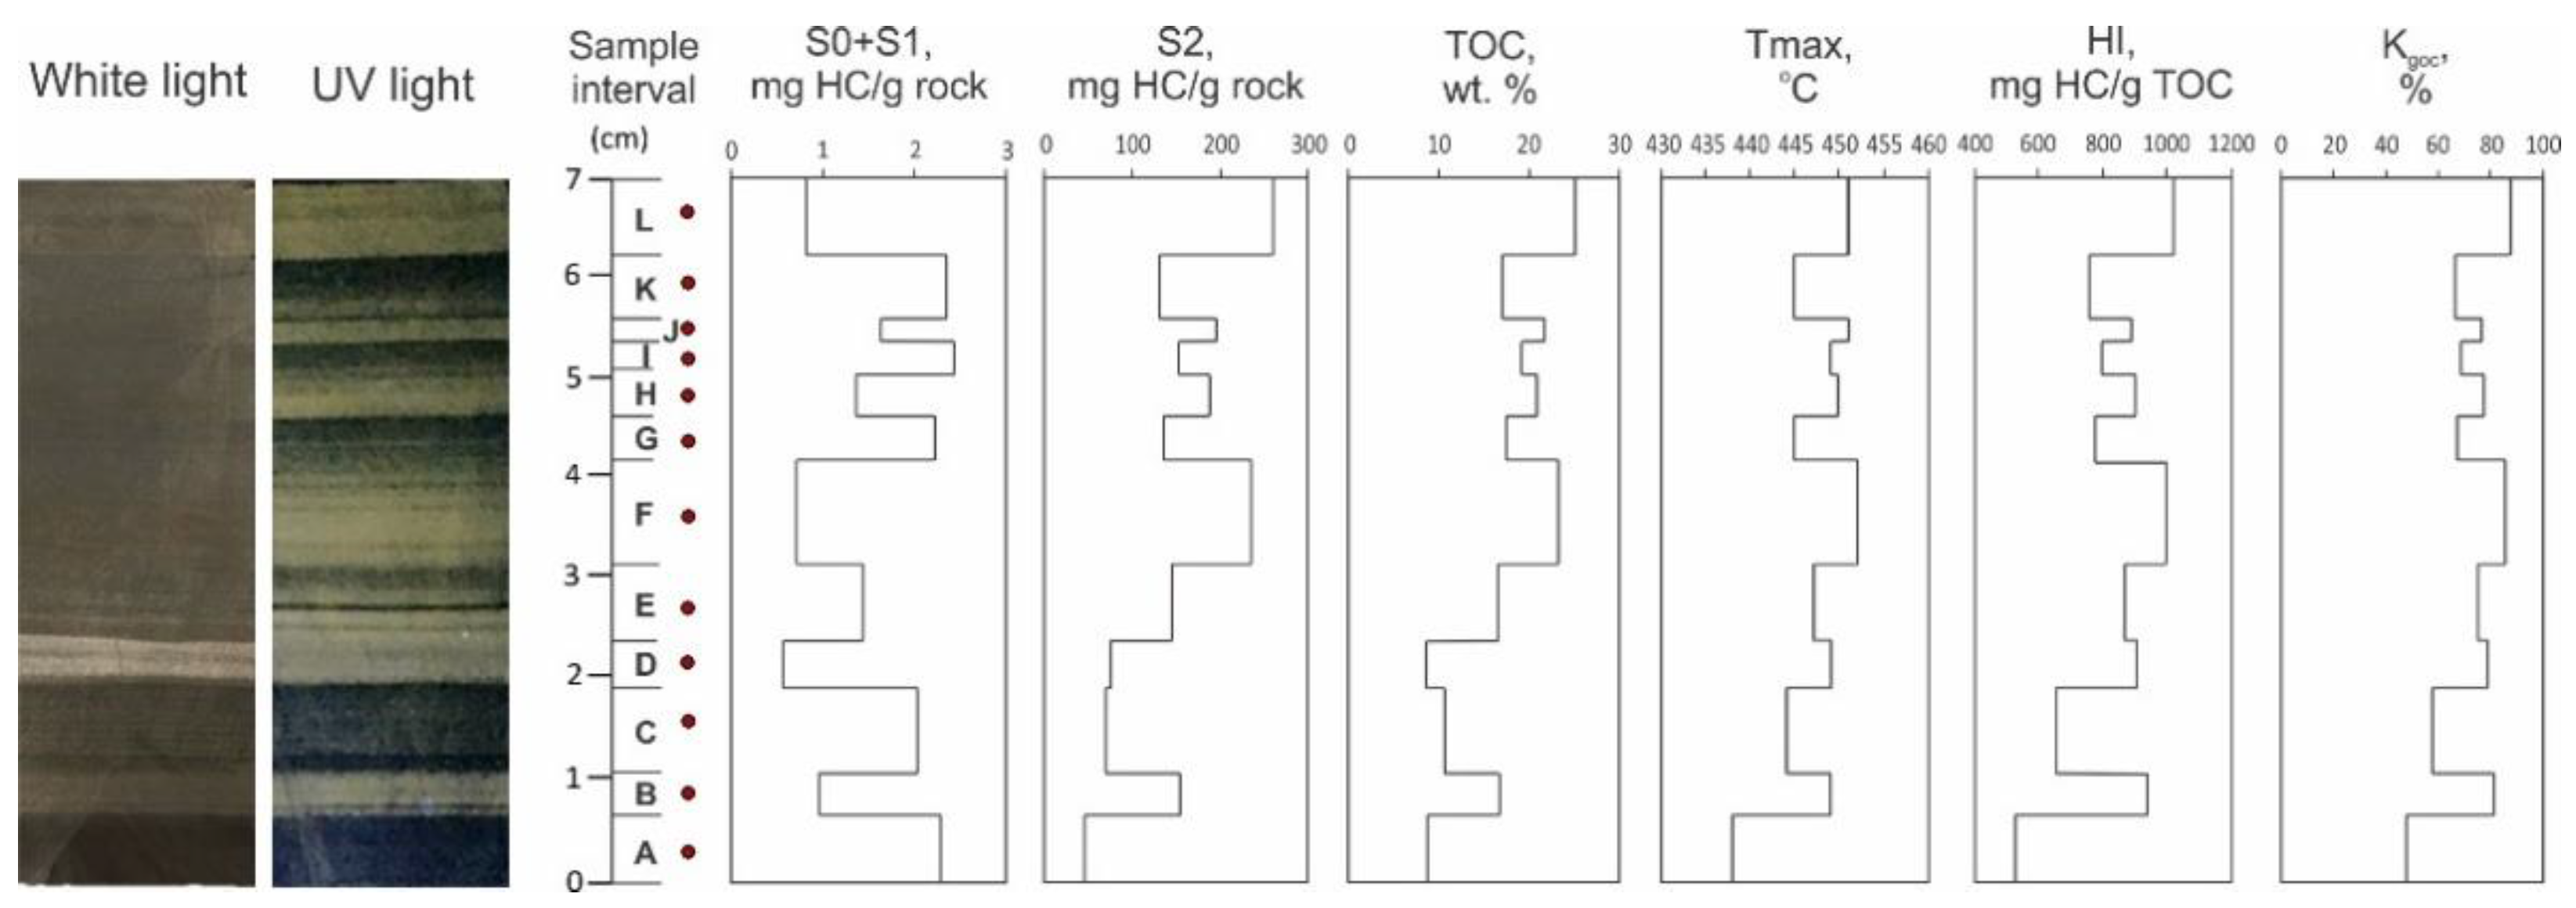
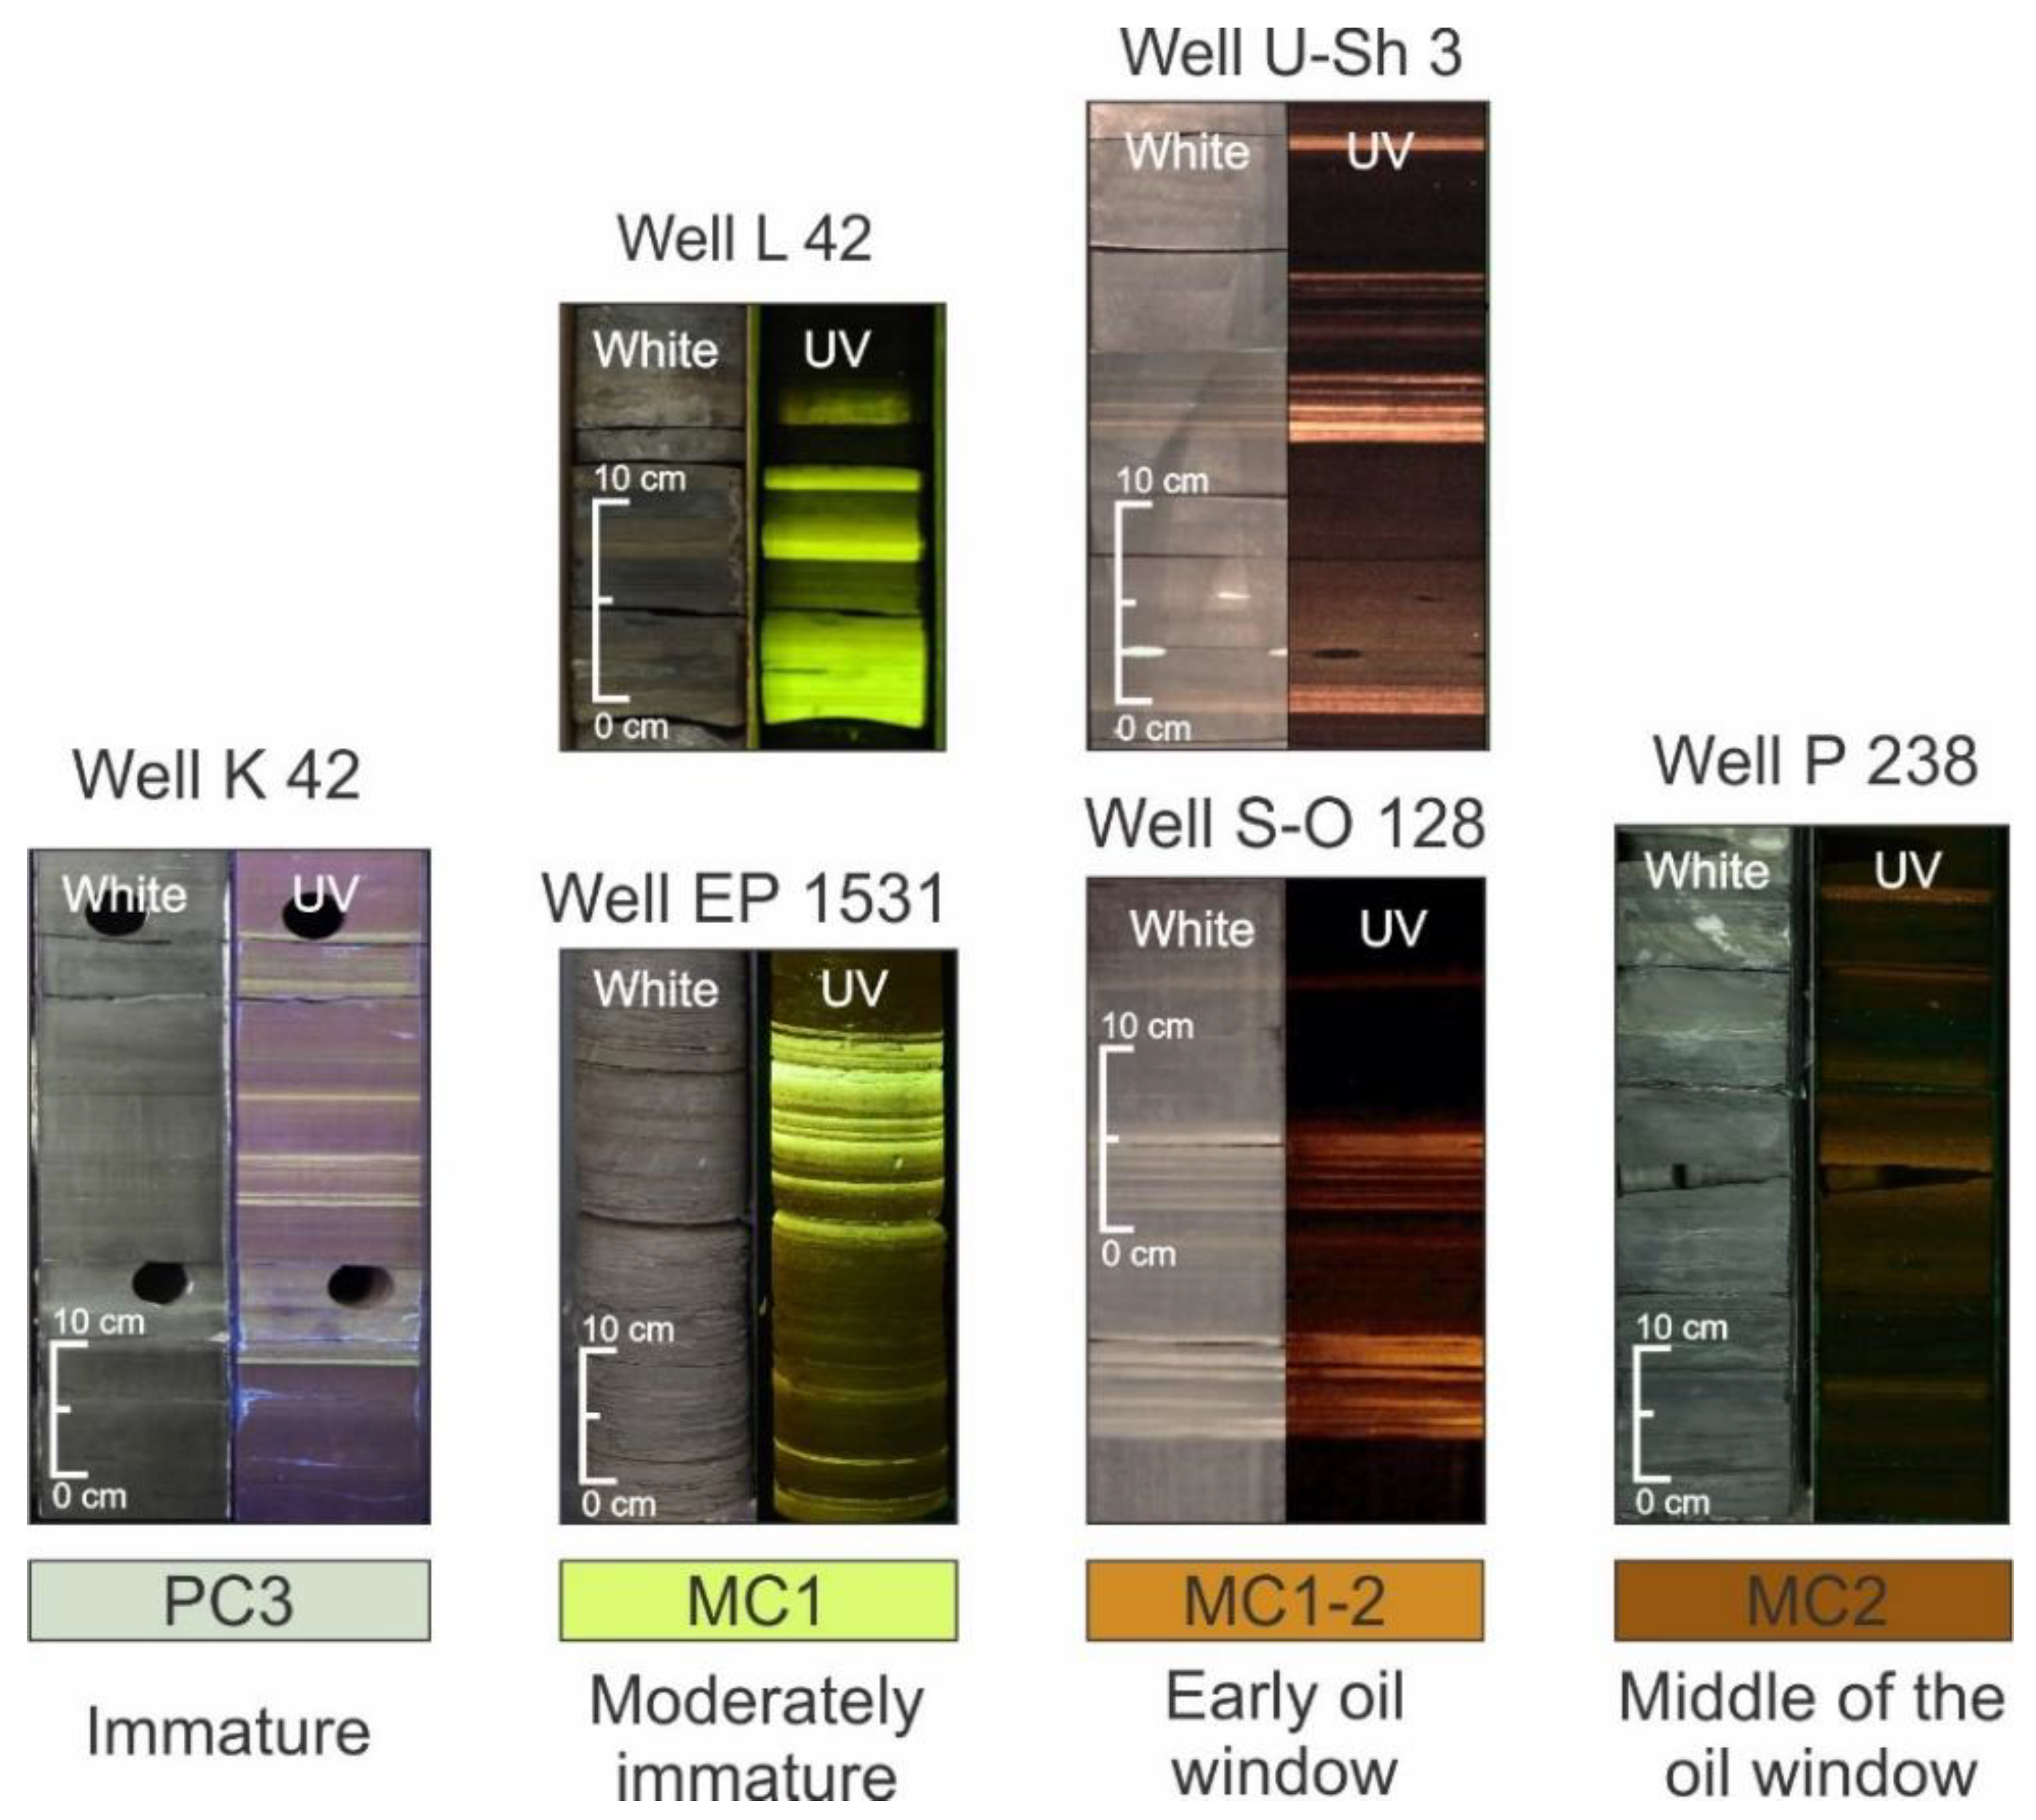
4.1. Visual Core Description under White and UV Light
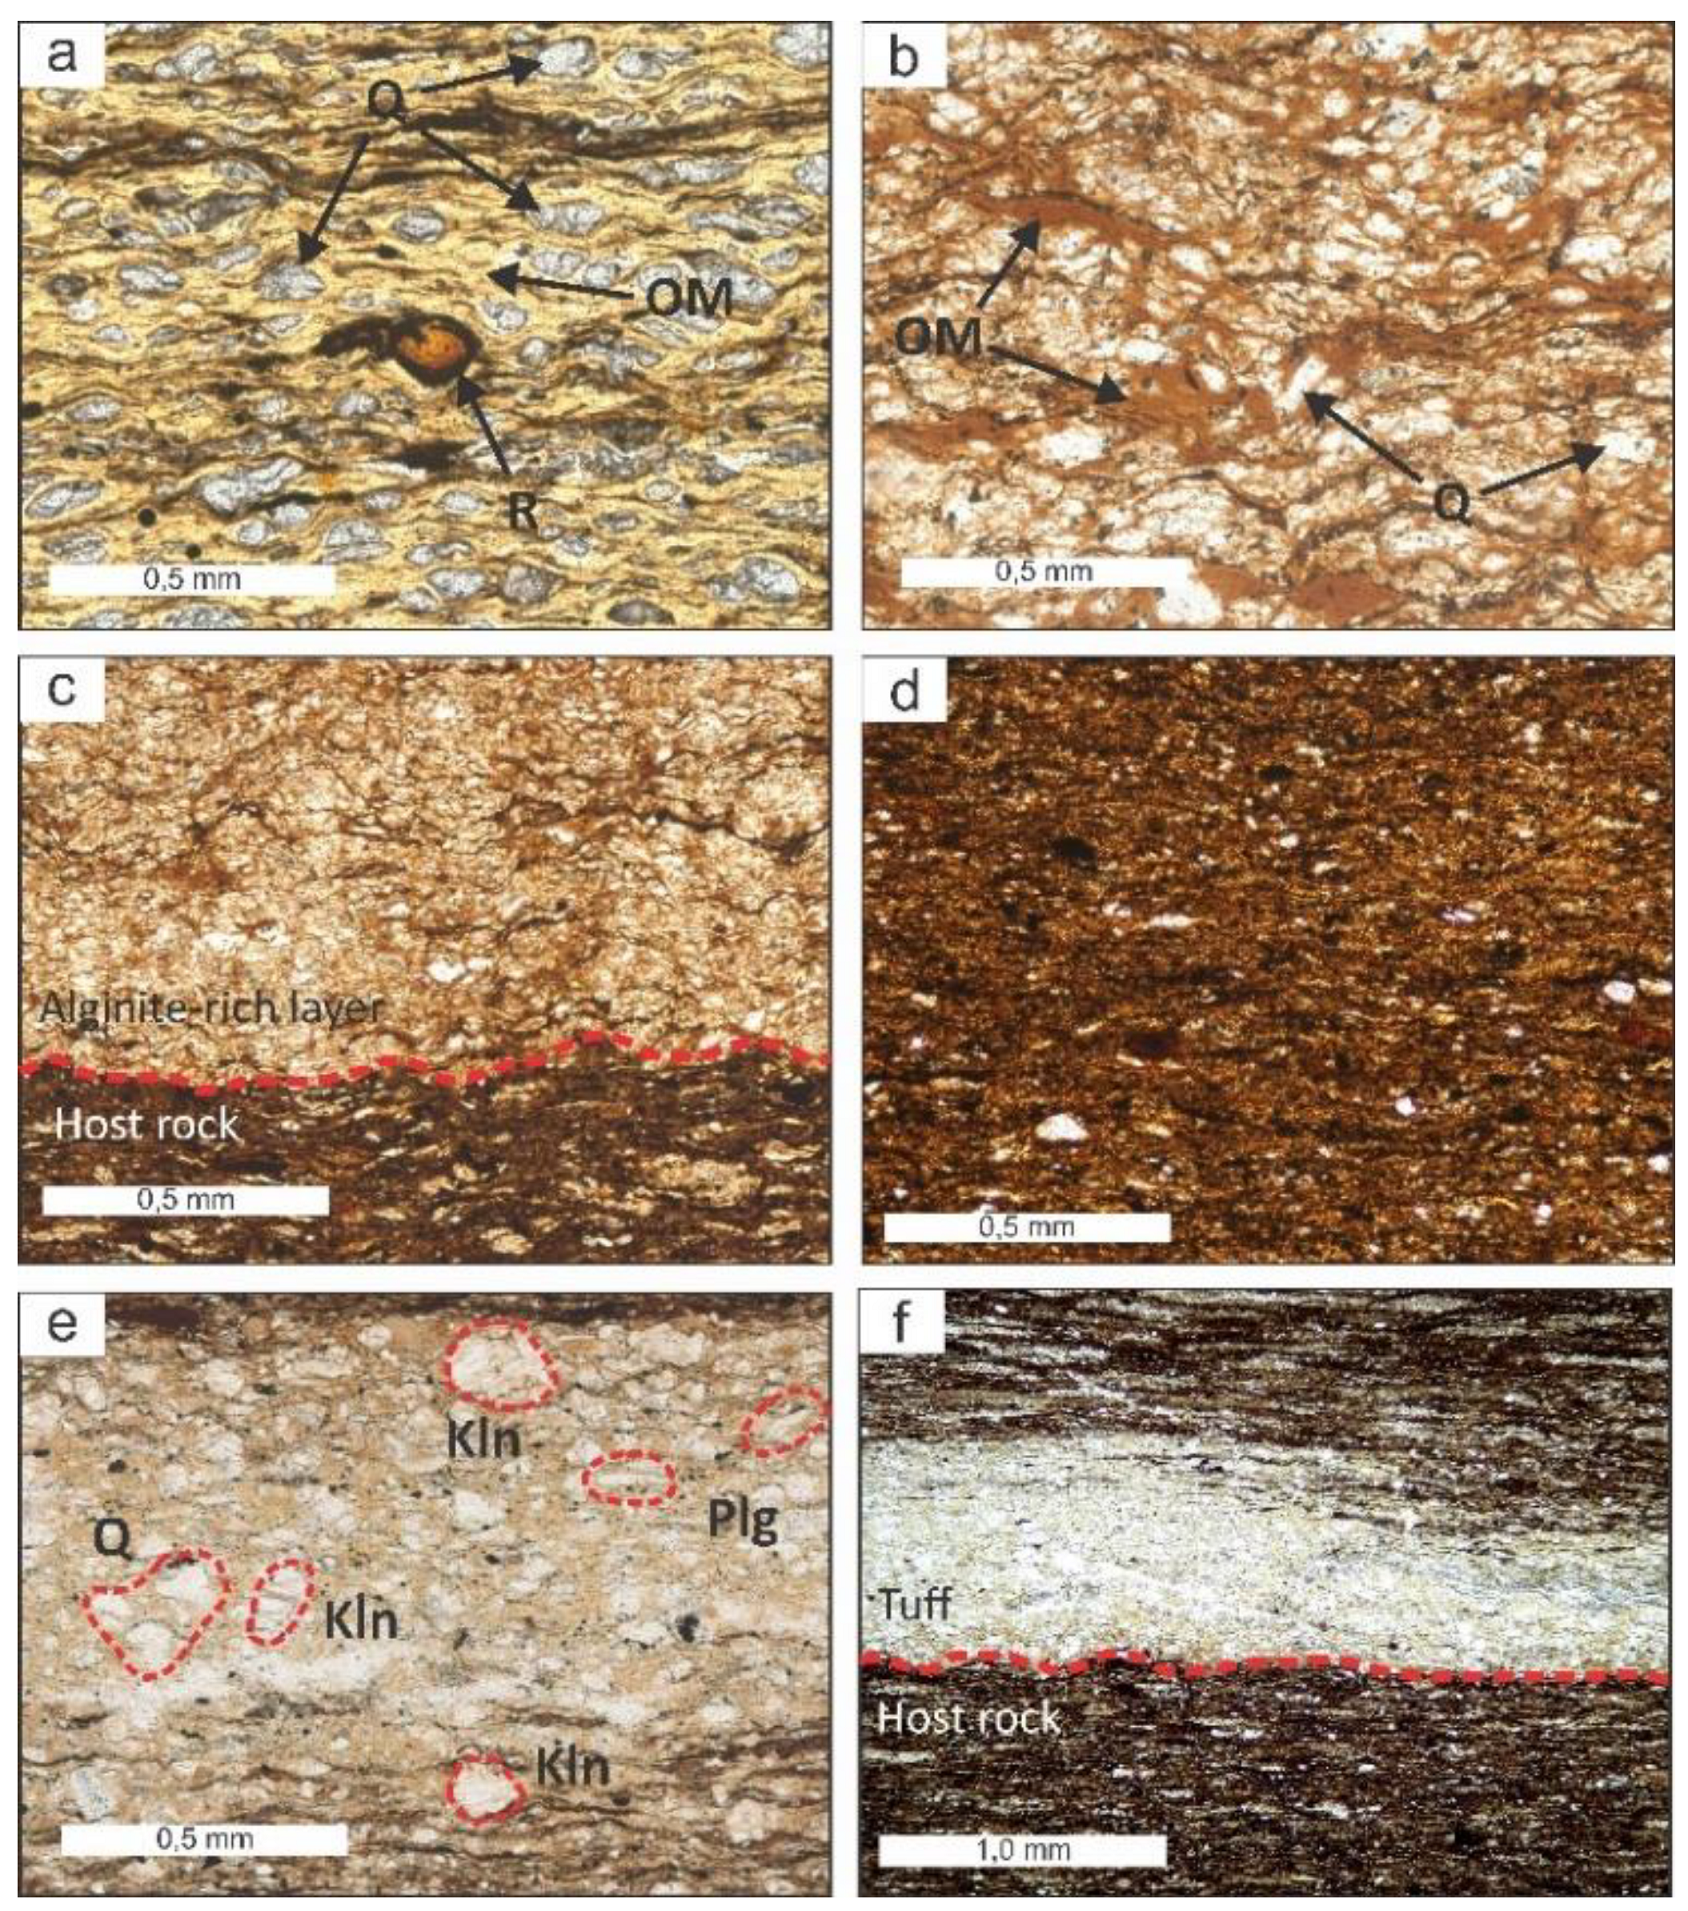
4.2. Lithology and Mineral Composition
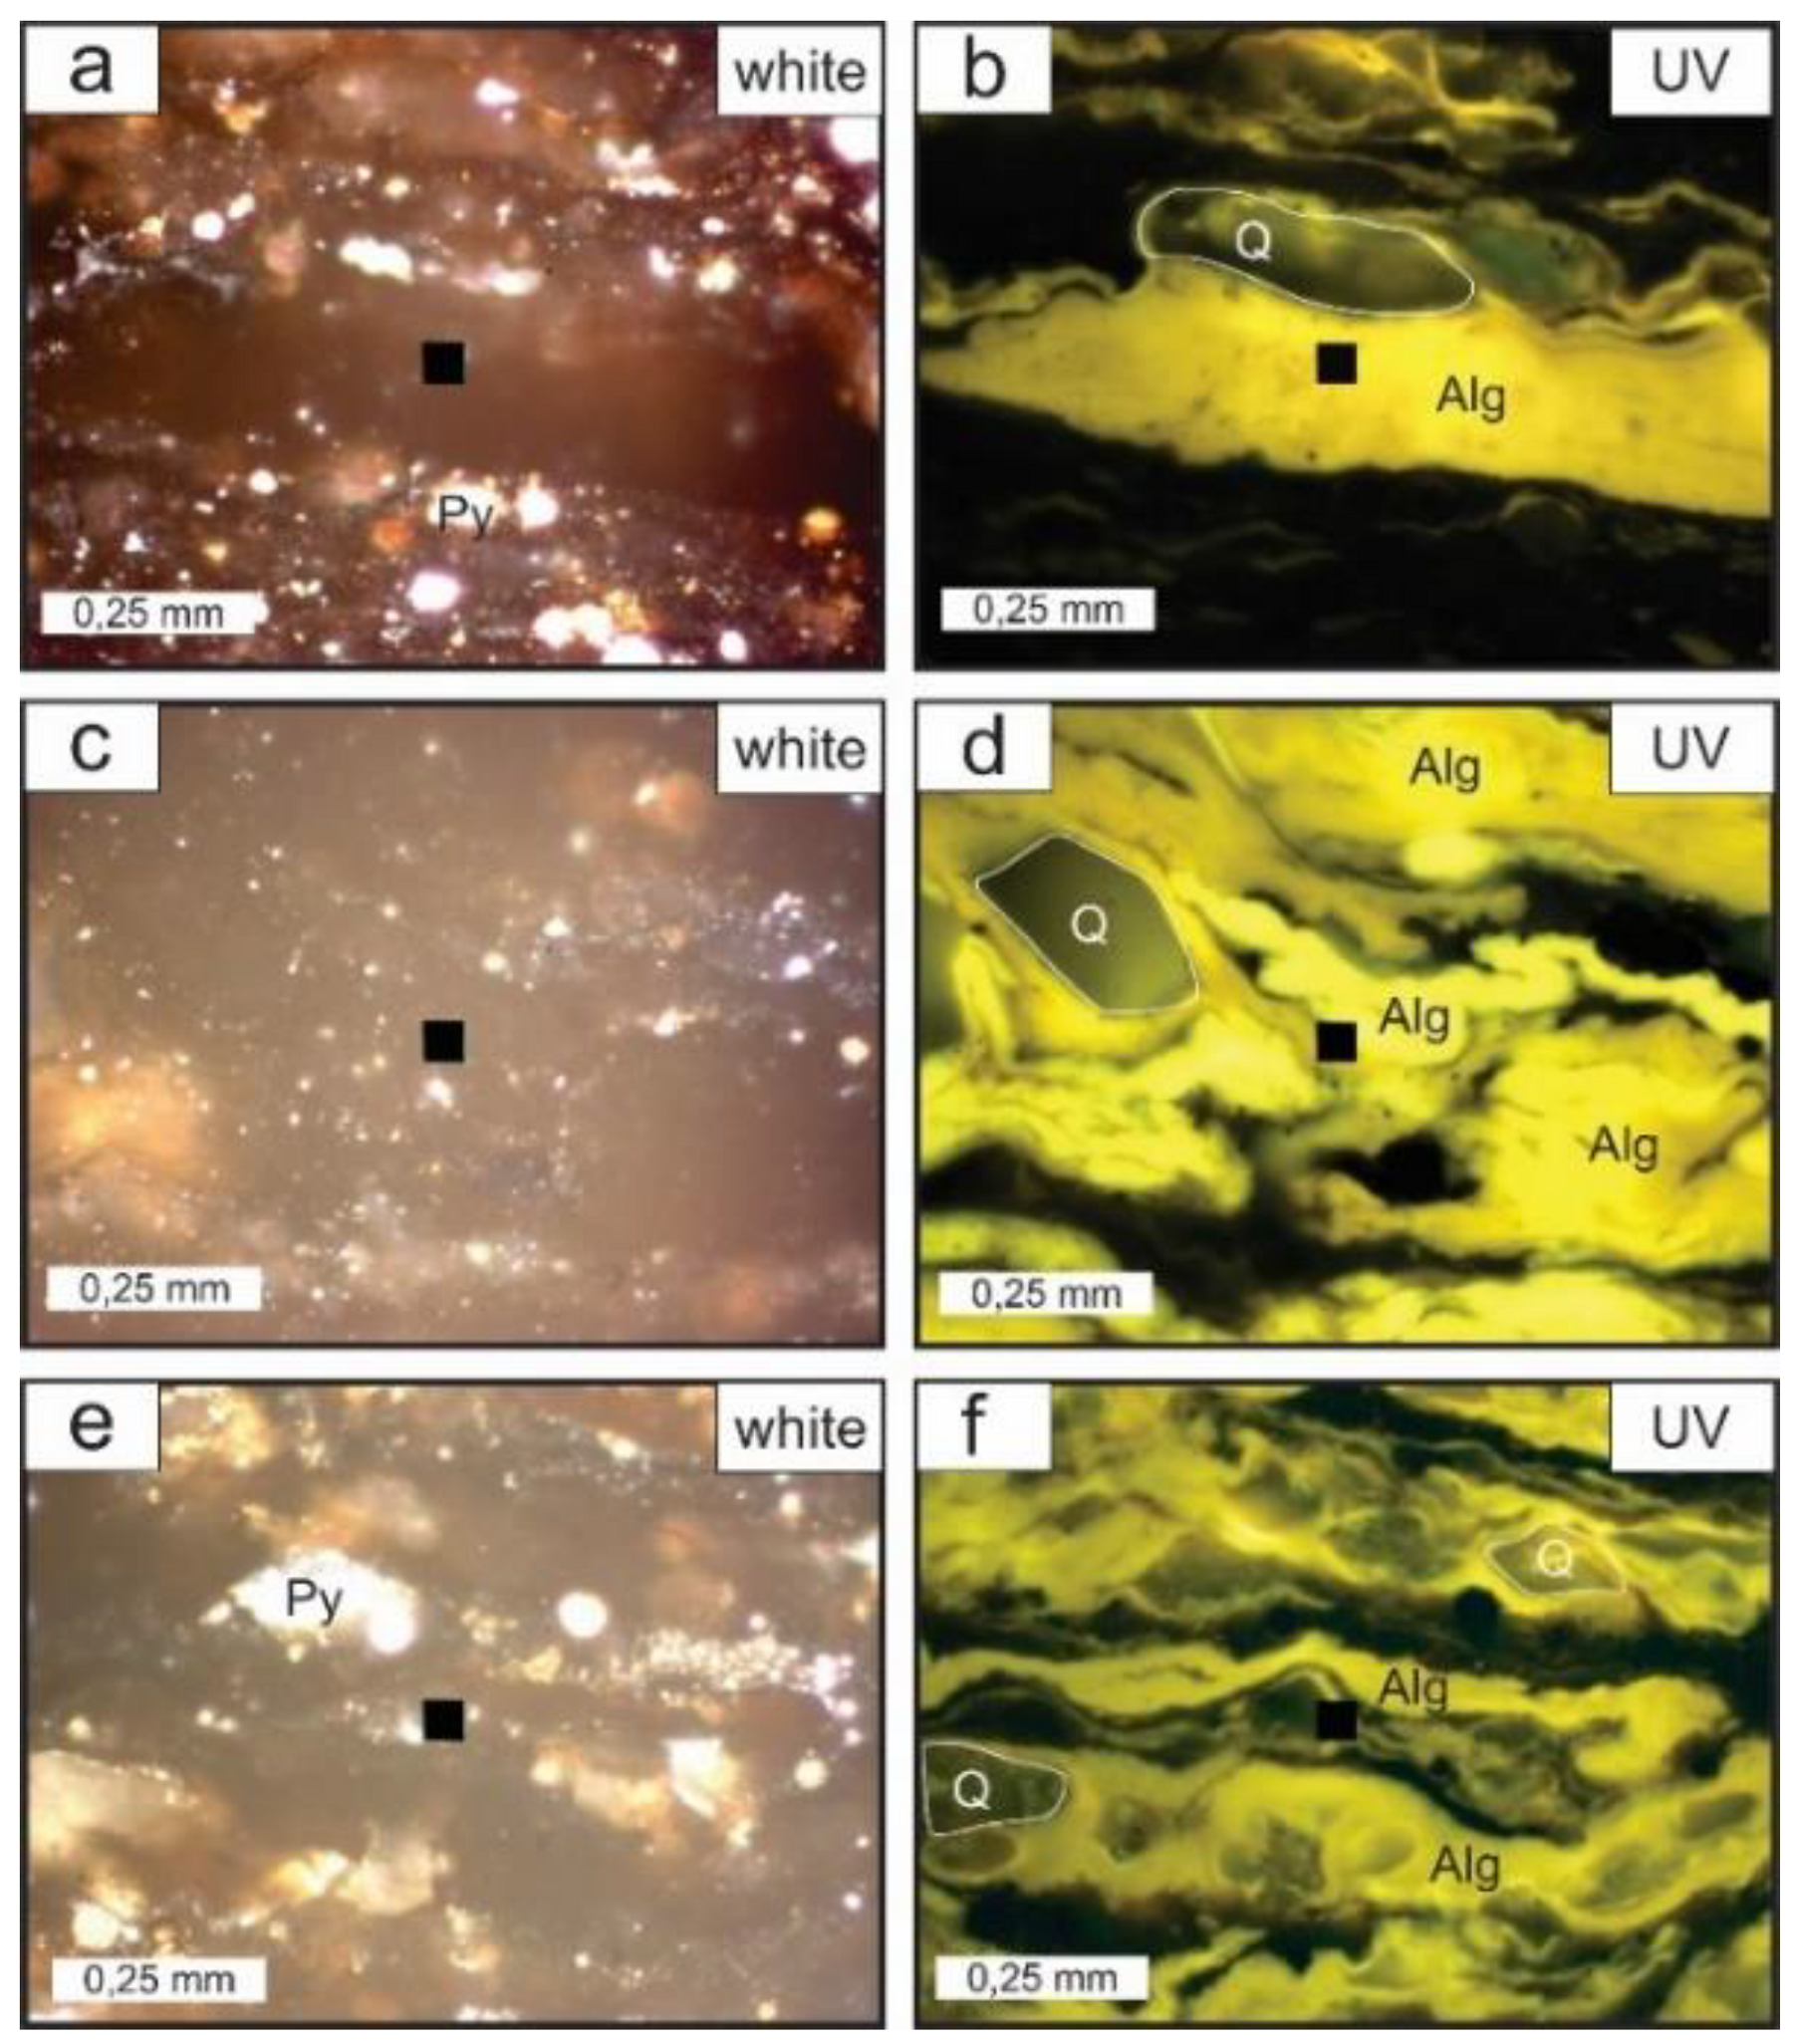
4.3. Organic Petrography
4.4. Characterization of Organic Matter
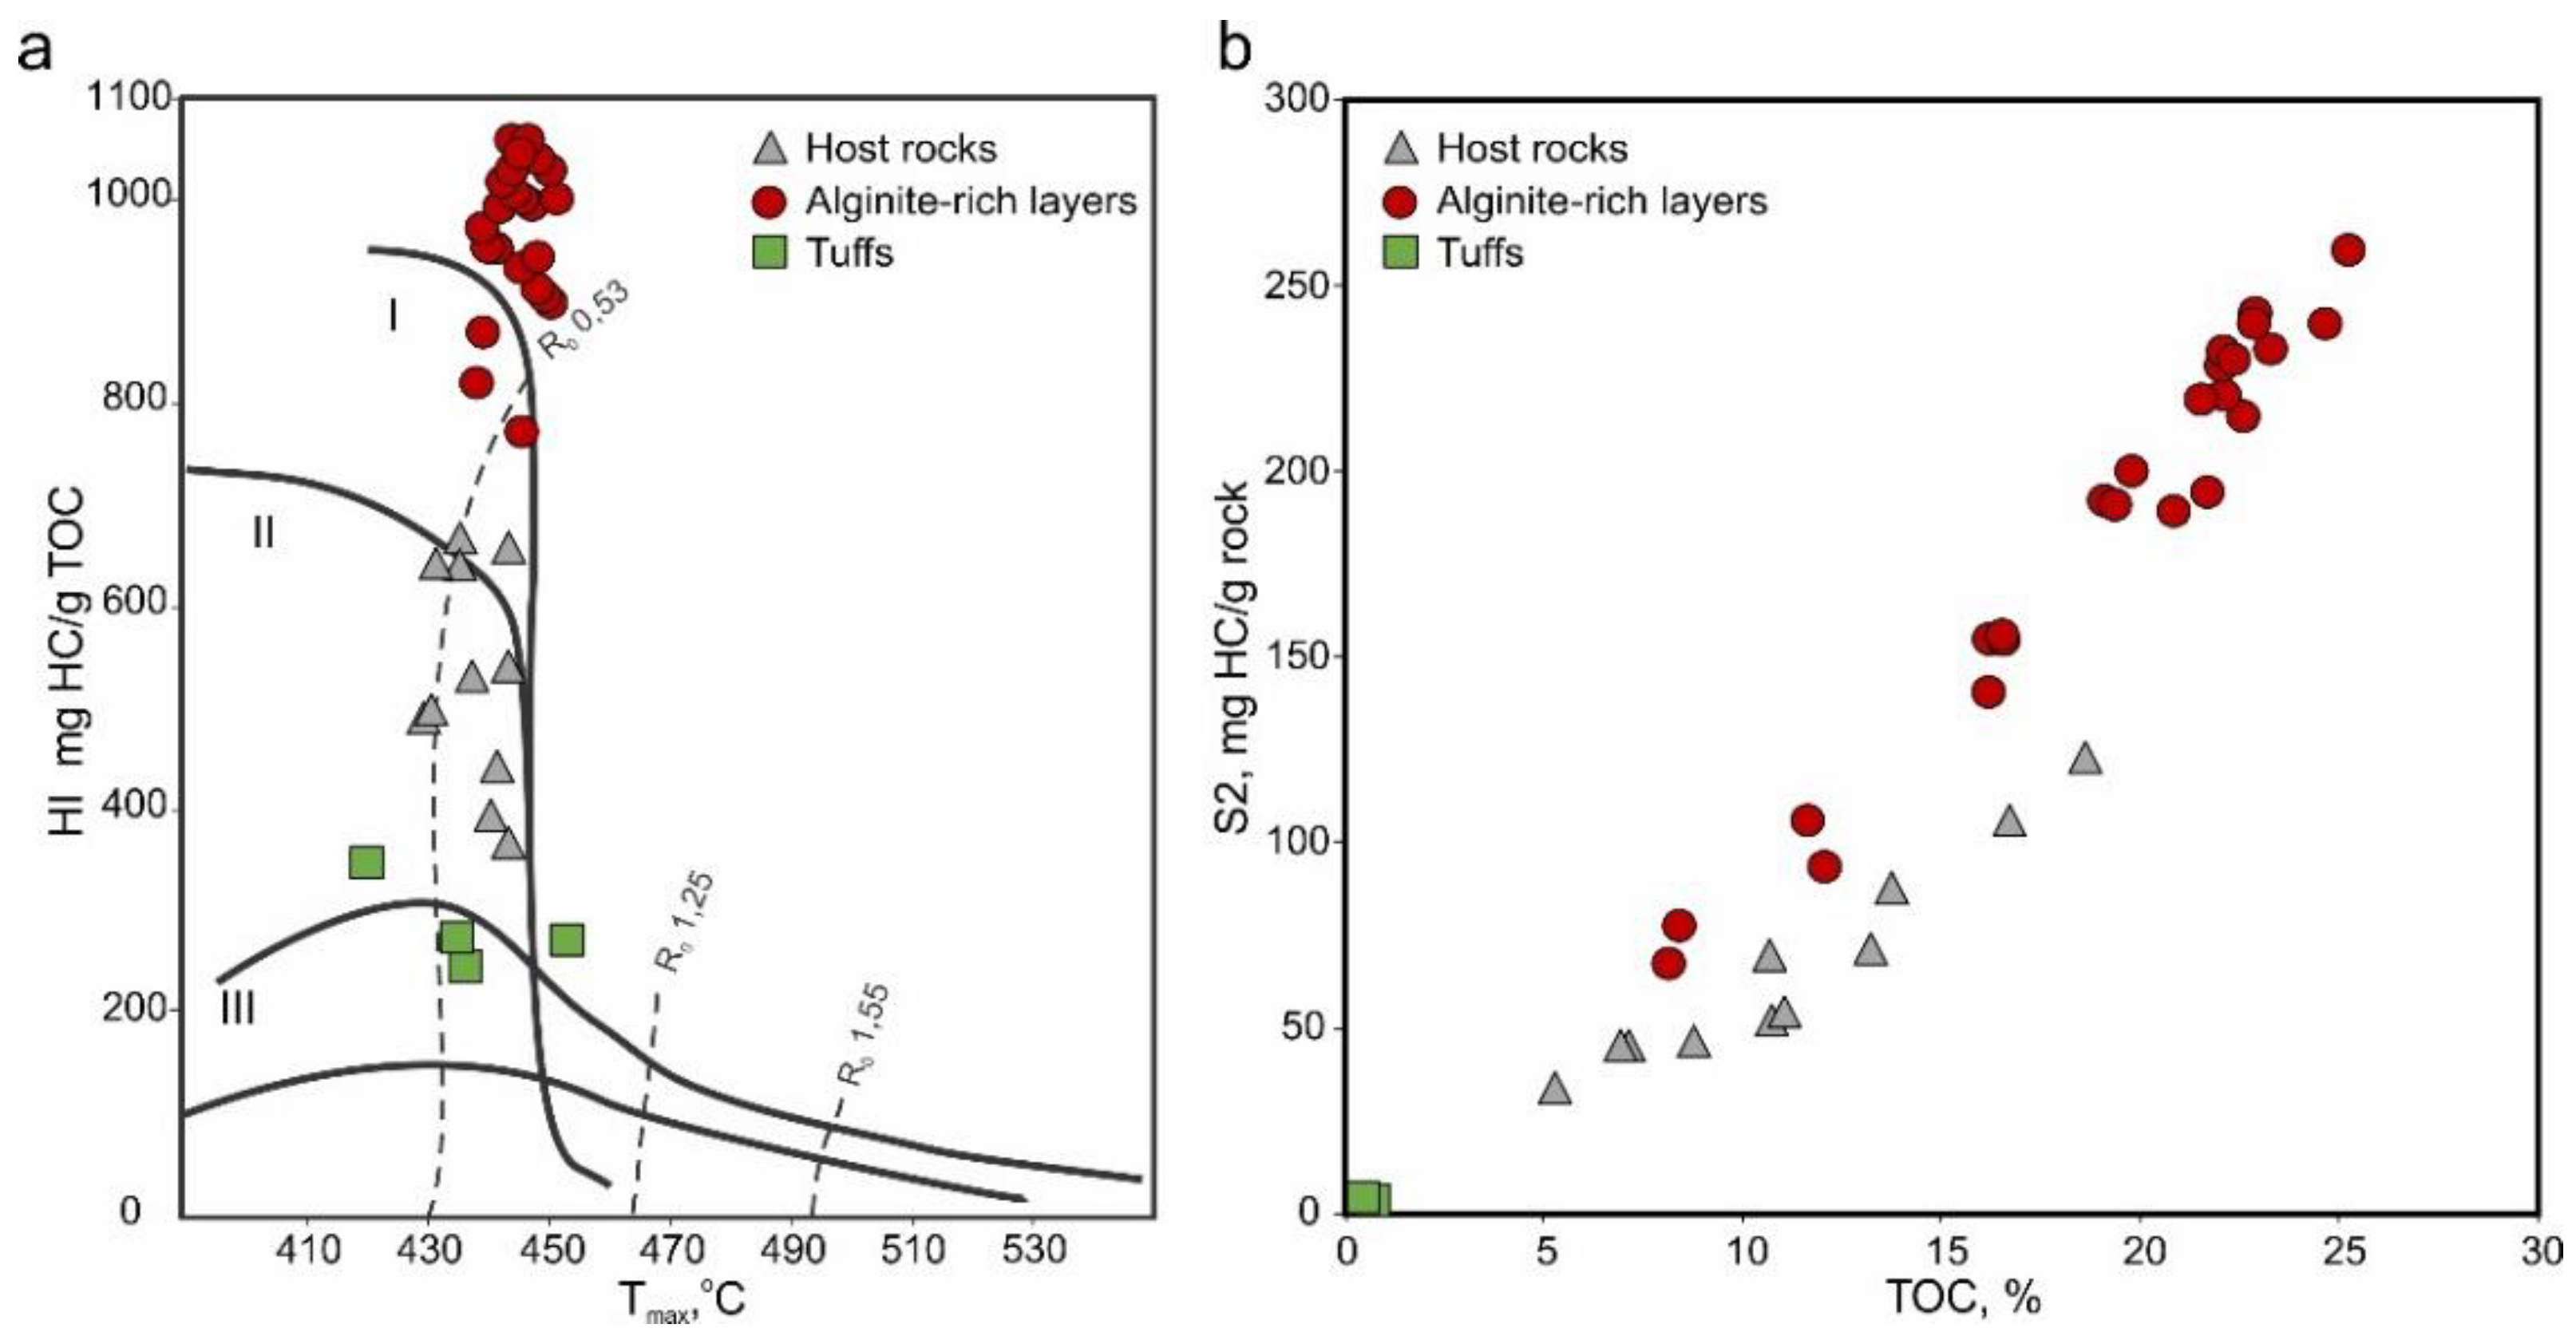
4.4.1. Rock-Eval Pyrolysis
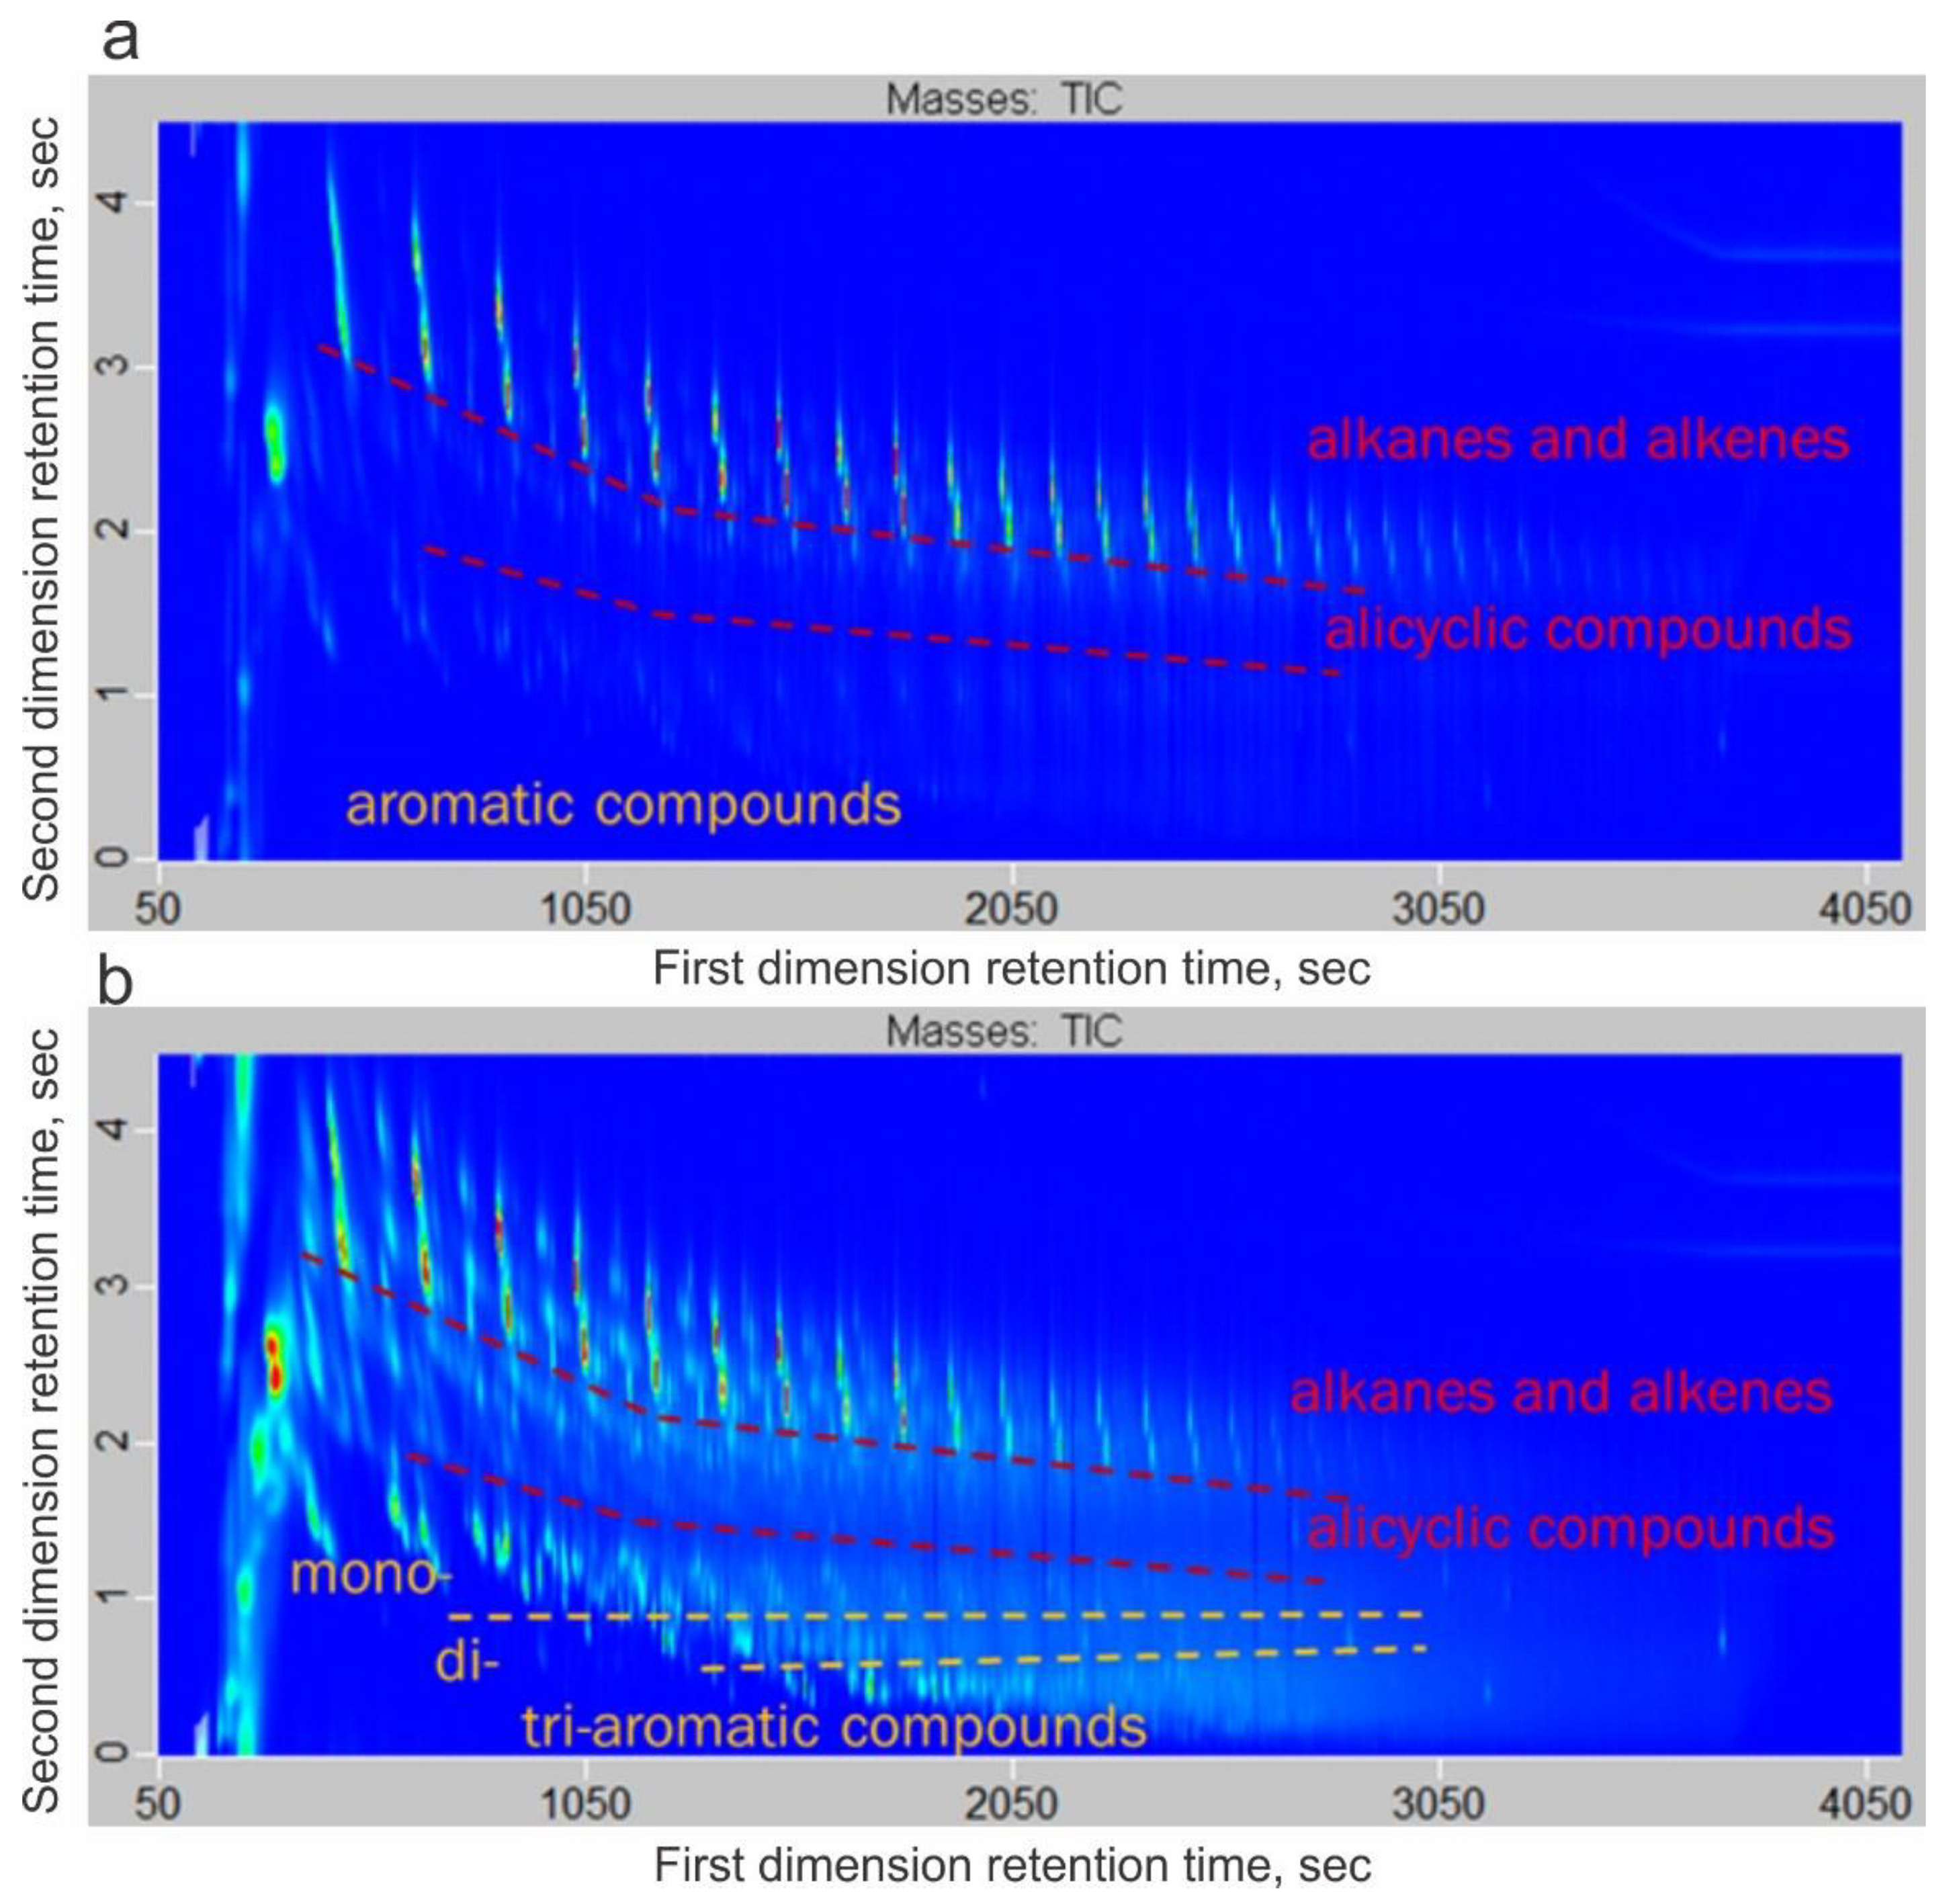
4.4.2. Organic Matter Thermal Decomposition
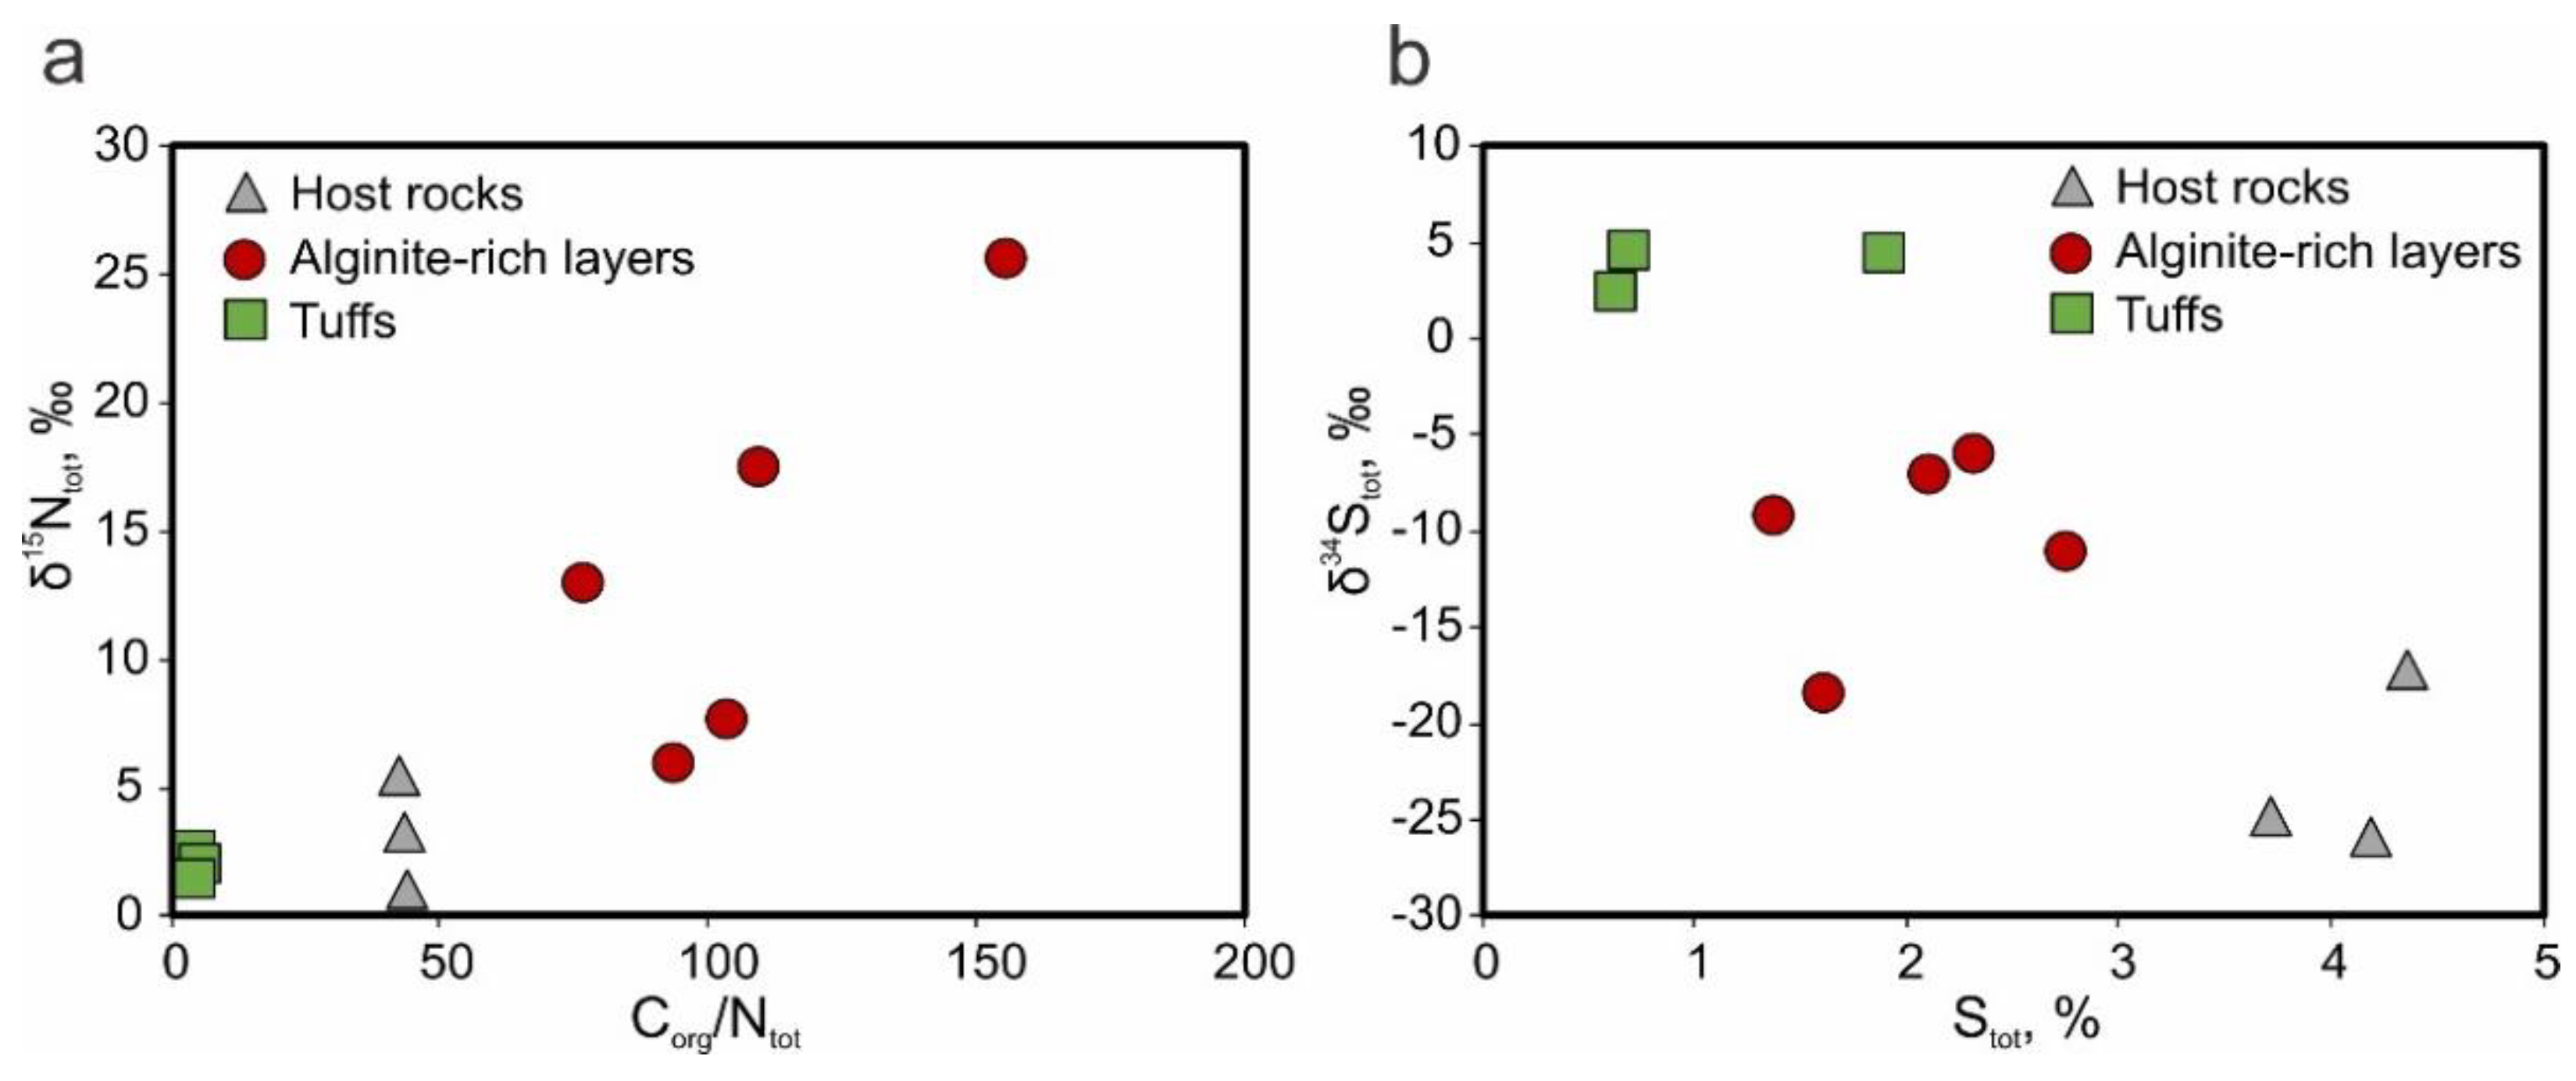
4.4.3. Isotope Composition of C, N, and S
5. Discussion
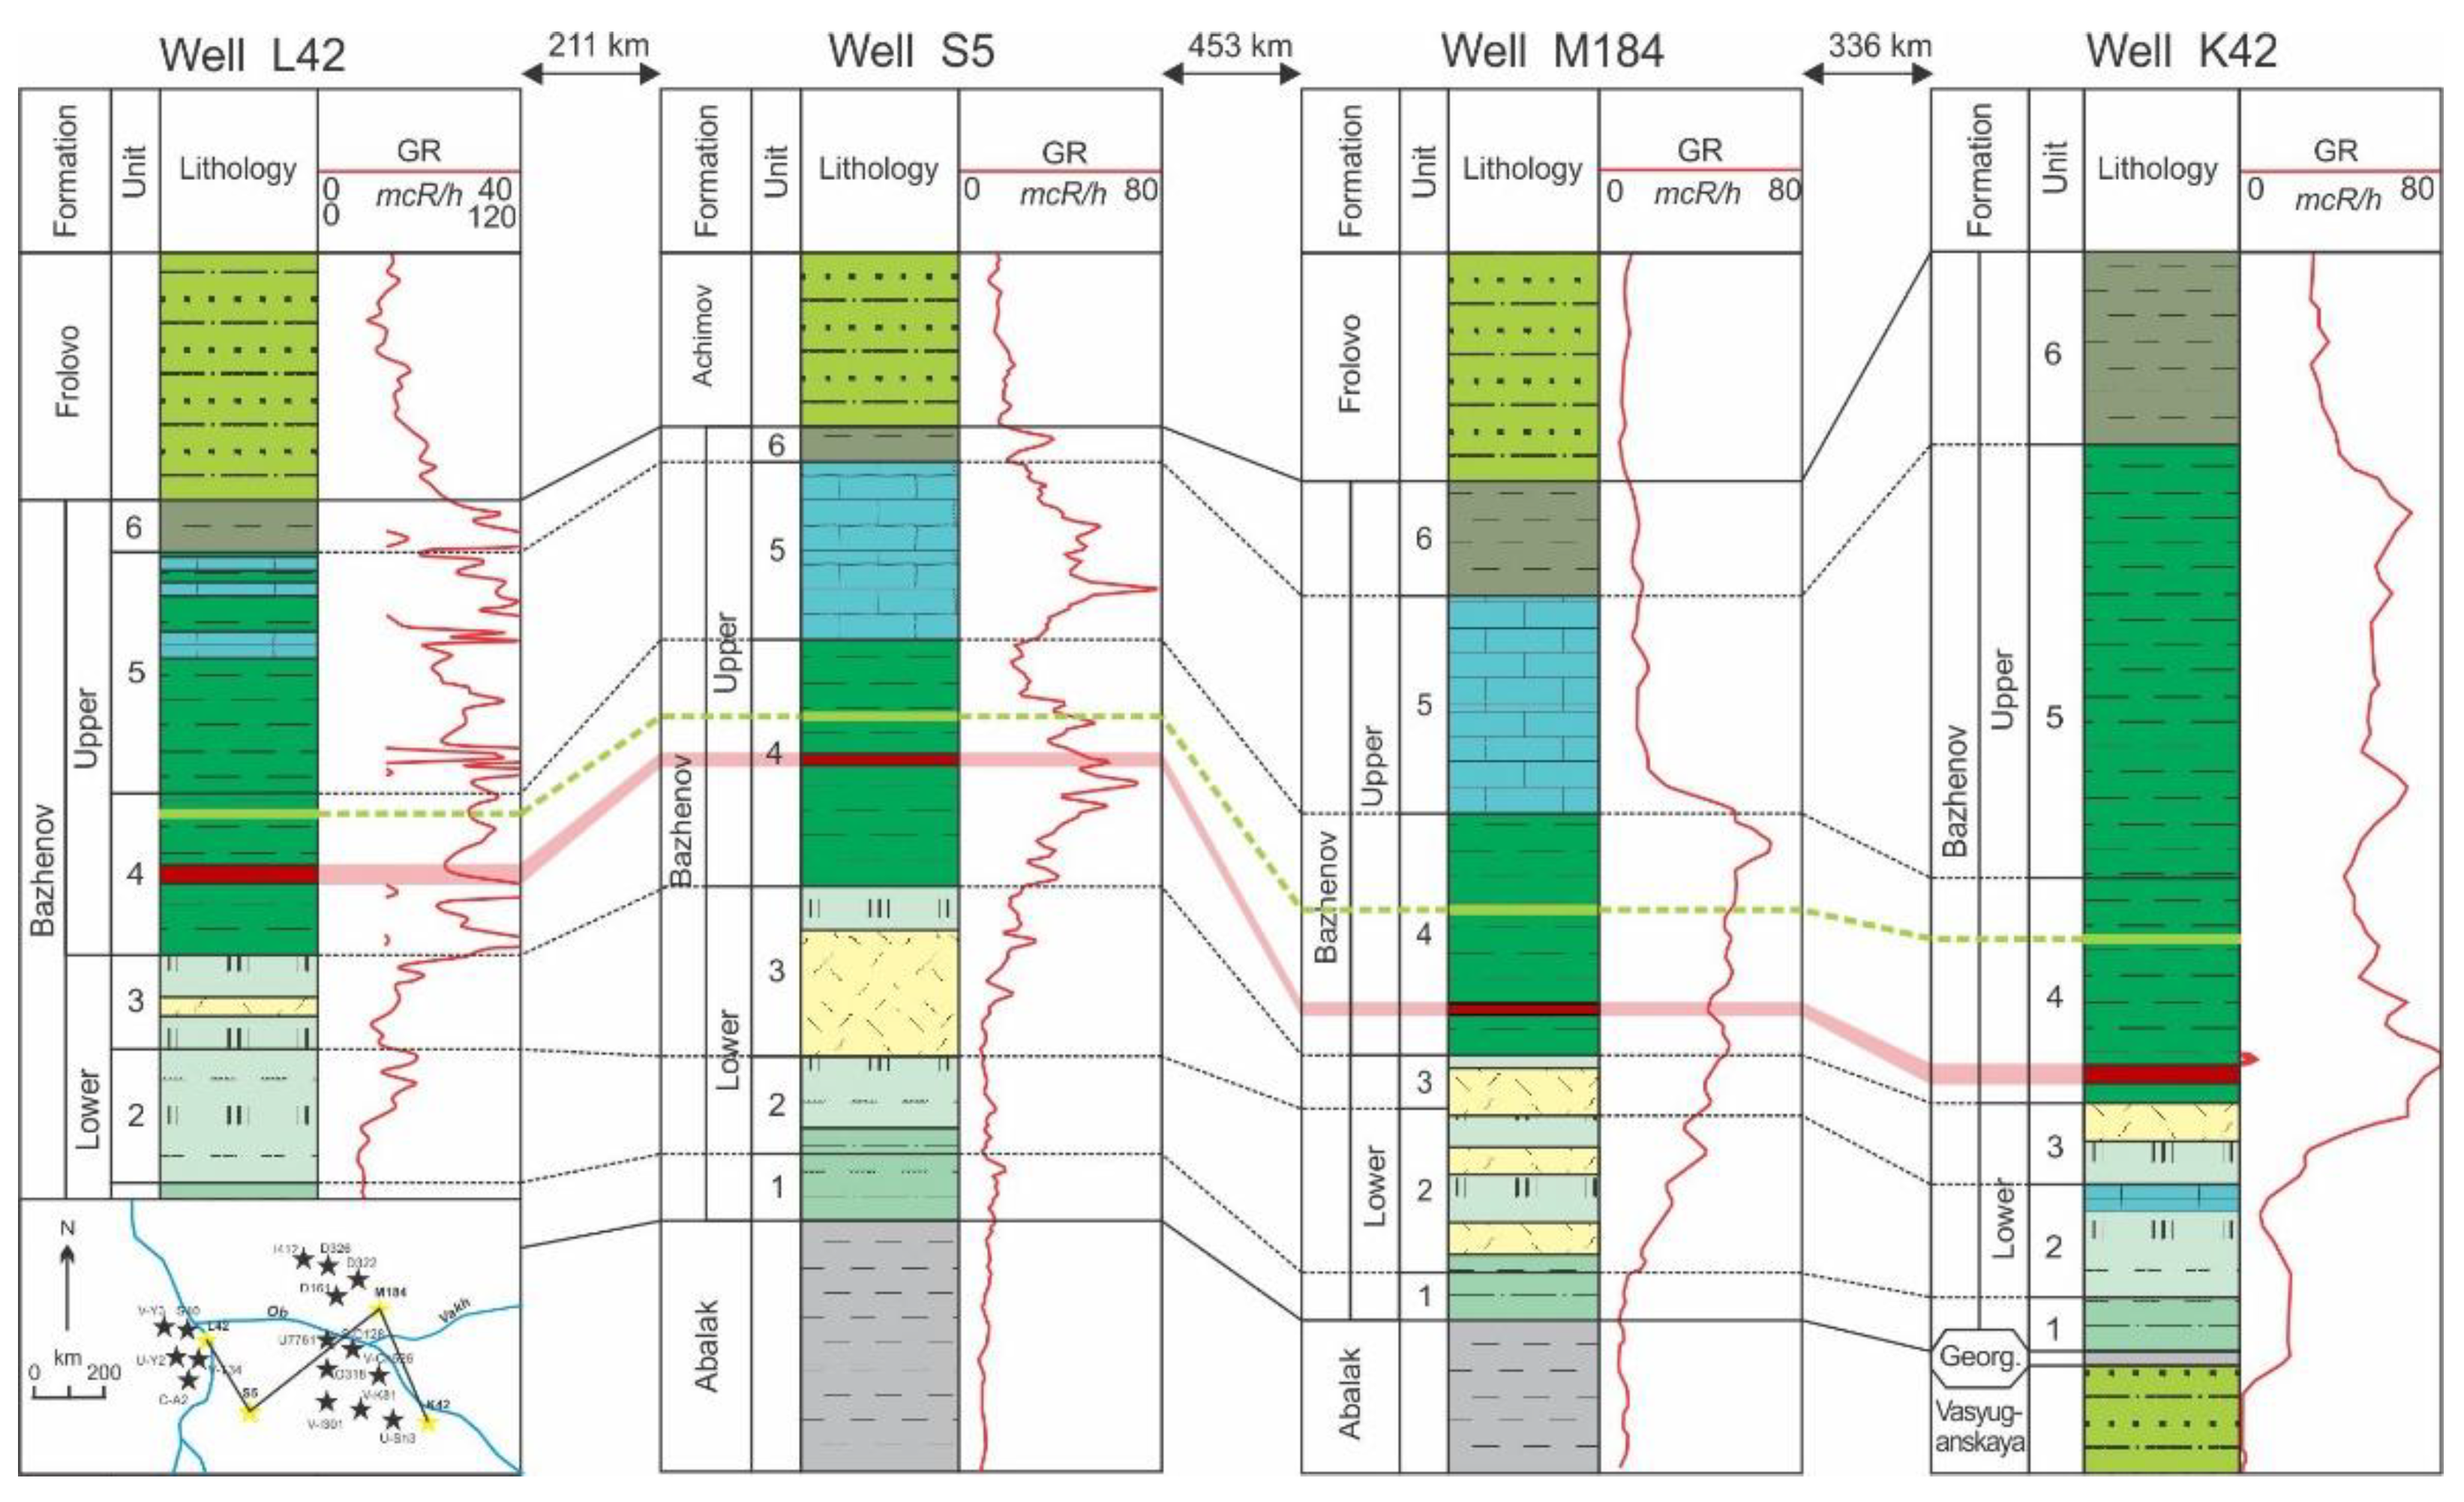
5.1. Occurrence
5.2. Key Characteristics of the Alginite-Rich Layers
5.3. Origin of the Alginite-Rich Layers
5.4. Stratigraphy and Hydrocarbon Potential
6. Conclusions
Author Contributions
Funding
Institutional Review Board Statement
Informed Consent Statement
Acknowledgments
Conflicts of Interest
References
- Kontorovich, A.; Ponomareva, E.; Burshtein, L.; Glinskikh, V.; Kim, N.; Kostyreva, E.; Pavlova, M.; Rodchenko, A.; Yan, P. Distribution of organic matter in rocks of the Bazhenov horizon (West Siberia). Russ. Geol. Geophys. 2018, 59, 285–298. [Google Scholar] [CrossRef]
- Krasnova, E.A.; Yurchenko, A.Y.; Kalmykov, A.G.; Fomina, M.M. Isotopic-geochemical peculiarities of distribution of gas hydrocarbons in the Bazhenov formation section (South part of the Western Siberia). Georesursy 2019, 21, 153–158. [Google Scholar] [CrossRef]
- Goncharov, I.V.; Samoilenko, V.V.; Veklich, M.A.; Zherdeva, A.V.; Shadrina, E.S.; Oblasov, N. Carbon Isotopic Composition of Extracts from the Rocks of the Bazhenov Formation of Various Catagenesis. In Proceedings of the 29th International Meeting on Organic Geochemistry, Gothenburg, Sweden, 1–6 September 2019. [Google Scholar] [CrossRef]
- Goncharov, I.; Samoilenko, V.; van Graas, G.; Trushkov, P.; Oblasov, N.; Fadeeva, S.; Veklich, M.; Kashapov, R.; Sidorov, D. Petroleum generation and migration in the southern Tyumen region, Western Siberia Basin, Russia. Org. Geochem. 2021, 152, 104178. [Google Scholar] [CrossRef]
- Kontorovich, A.; Fomin, A.; Krasavchikov, V.; Istomin, A. Catagenesis of organic matter at the top and base of the Jurassic complex in the West Siberian megabasin. Russ. Geol. Geophys. 2009, 50, 917–929. [Google Scholar] [CrossRef]
- Kontorovich, A.; Yan, P.; Zamirailova, A.; Kostyreva, E.; Eder, V. Classification of rocks of the Bazhenov Formation. Russ. Geol. Geophys. 2016, 57, 1606–1612. [Google Scholar] [CrossRef]
- Eder, V.G. Pyritization of Rocks in Black Shale/Host Rock Transition Zones: Evidence from the Bazhenov Formation, Western Siberia. Lithol. Miner. Resour. 2020, 55, 218–230. [Google Scholar] [CrossRef]
- Bulatov, T.; Kozlova, E.; Leushina, E.; Pronina, N.; Panchenko, I.; Kostina, Y.; Spasennykh, M. Specific Layers Containing Highly Oil-Prone Organic Matter in the Bazhenov Formation. In Proceedings of the 29th International Meeting on Organic Geochemistry, Gothenburg, Sweden, 1–6 September 2019. [Google Scholar] [CrossRef]
- Bulatov, T.D.; Oksenoyd, E.E.; Semechkova, L.V.; Vtorushina, E.A.; Vtorushin, M.N.; Bashirov, R.I.; Nesterova, L.L. Tuffaceous interlayers in the sediments of the Bazhenov Formation in the central part of West Siberia. In Proceedings of the XXI Scientific Conference “Ways of Realizing the Petroleum and Mineral Potential of the KhMAO-Yugra”, Khanty-Mansiysk, Russia, 13–17 November 2017. (In Russian). [Google Scholar]
- Shaldybin, M.; Wilson, M.; Wilson, L.; Lopushnyak, Y.; Brydson, R.; Krupskaya, V.; Kondrashova (Deeva), E.; Glotov, A.; Goncharov, I.; Samoilenko, V.; et al. The nature, origin and significance of luminescent layers in the Bazhenov Shale Formation of West Siberia, Russia. Mar. Pet. Geol. 2019, 100, 358–375. [Google Scholar] [CrossRef]
- Panchenko, I.V.; Sobolev, I.D.; Rogov, M.A.; Latyshev, A.V. Volcanic tuffs and tuffites at the Jurassic-Cretaceous boundary beds (Volgian–Ryazanian stages) of Western Siberia. Lithol. Miner. Resour. 2021, 2, 144–183. (In Russian) [Google Scholar] [CrossRef]
- Amon, E.O.; Alekseev, V.P.; Glebov, A.F.; Savenko, V.A.; Fedorov, Y.N. Stratigraphy and Paleogeography of the Mesozoic-Cenozoic Sedimentary Basin of the Shaim Petroleum Region (Western Siberia); Izd. UGGU: Yekaterinburg, Russia, 2010; p. 257. (In Russian) [Google Scholar]
- Bulynnikova, S.P.; Golbert, A.V.; Klimova, I.G. Paleobiofacies of Volgian and Neocomian Oil and Gas Deposits of the West Siberian Plate; Nedra: Moscow, Russia, 1978; p. 87. (In Russian) [Google Scholar]
- Braduchan, Y.V.; Gurari, F.G.; Zakharov, V.A. Bazhenov Horizon of Western Siberia (Stratigraphy, Paleogeography, Ecosystem, Petroleum System); Nauka: Novosibirsk, Russia, 1986; p. 217. (In Russian) [Google Scholar]
- Golbert, A.V.; Markova, L.G.; Polyakova, I.D.; Sachs, V.N.; Teslenko, Y.V. Paleolandscapes of West Siberia in Jurassic, Cretaceous, and Paleogene; Nauka: Moscow, Russia, 1968; p. 152. (In Russian) [Google Scholar]
- Rovnina, L.V.; Rodionova, M.K.; Sadovnikova, V.M.; Mazur, V.M.; Zhiltsova, N.N. Comprehensive Studies of the Jurassic and Lower Cretaceous Stratigraphy in Western Siberia; Nauka: Moscow, Russia, 1978; p. 140. (In Russian) [Google Scholar]
- Filina, S.I.; Korzh, M.V.; Zonn, M.S. Paleogeography and Oil-bearing Capacity of the Bazhenov Formation in Western Siberia; Nauka: Moscow, Russia, 1984; p. 36. (In Russian) [Google Scholar]
- Amon, E.O. Radiolarians in the Bazhenov Formation (Volgian Stage) of the Latitudinal Ob region, Western Siberia. Trudy IGG UrO RAN 2011, 158, 3–8 (In Russian). (In Russian) [Google Scholar]
- Baraboshkin, E.Y.; Panchenko, I.V.; Nemova, V.D.; Shchepetova, E.V.; Smirnova, M.E.; Zuikova, M.V. To the ichnology of Abalak and Bazhenov Formations (Western Siberia). In Proceedings of the 8th All-Russian Lithological Symposium, Moscow, Russia, 27–30 October 2015; pp. 60–63. (In Russian). [Google Scholar]
- Vishnevskaya, V.S.; Ovechkina, M.N.; Ustinova, M.A. Biostratigraphy and Paleogeography of the Bazhenovo Formation (Upper Jurassic and Lower Cretaceous) Based on Radiolarians, Nannoplankton and Calcareous Dinocysts. Paléontol. J. 2019, 53, 916–921. [Google Scholar] [CrossRef]
- Yurchenko, A.Y.; Potapova, A.S.; Bumagina, V.A.; Vilesov, A.P.; Chertina, K.N.; Balushkina, N.S.; Kalmykov, G.A.; Khotylev, O.V. Morphological and Lithogenetic Classification of the Carbonate Rocks of the Abalak–Bazhenov Complex. Mosc. Univ. Geol. Bull. 2019, 74, 372–379. [Google Scholar] [CrossRef]
- Galimov, E.M. Carbon Isotopes in Oil and Gas Geology; Nedra: Moscow, Russia, 1973; p. 384. (In Russian) [Google Scholar]
- Kontorovich, A.E.; Nesterov, I.I.; Salmanov, F.K. Oil and Gas Geology of Western Siberia; Nedra: Moscow, Russia, 1975; p. 680. (In Russian) [Google Scholar]
- Neruchev, S.G. Uranium and Life in the Earth History; Nedra: Leningrad, Russia, 1982; p. 208. (In Russian) [Google Scholar]
- Dorofeeva, T.V.; Krasnov, S.G.; Lebedev, B.A.; Petrova, G.V.; Pozinenko, B.V. Oil Reservoirs of the Bazhenov Formation in West-ern Siberia; Nedra: Leningrad, Russia, 1983; p. 131. (In Russian) [Google Scholar]
- Goncharov, I.V. Geochemistry of Oil in Western Siberia; Nedra Publishing House: Moscow, Russia, 1987; p. 181. (In Russian) [Google Scholar]
- Lopatin, N.V.; Emets, T.P. Pyrolysis in Oil and Gas Geology; Nauka: Moscow, Russia, 1987; p. 143. (In Russian) [Google Scholar]
- Gurari, F.G.; Weitz, E.Y.; Melenevsky, V.N.; Moskvin, V.I.; Perosio, G.N.; Predtechinskaya, E.A. Formation Conditions and Methods of Searching for Oil Deposits in Mudstones of the Bazhenov Formation; Nedra: Moscow, Russia, 1988; p. 199. (In Russian) [Google Scholar]
- Zubkov, M.Y.; Zubareva, N.M.; Sayfullina, A.K. The Bazhenov Formation organic matter of the Salym field. Oil Gas Geol. 1988, 5, 19–25. (In Russian) [Google Scholar]
- Panchenko, I.V.; Nemova, V.D.; Smirnova, M.E.; Ilyina, M.V.; Baraboshkin, E.Y.; Ilyin, V.S. Stratification and detailed correlation of Bazhenov horizon in the central part of the Western Siberia according to lithological and paleontological core analysis and well logging. Oil Gas Geol. 2016, 6, 22–34. (In Russian) [Google Scholar]
- Zanin, Y.N.; Zamirailova, A.G.; Eder, V.G. Nickel, molybdenum, and cobalt in the black shales of the Bazhenov Formation of the West Siberian basin. Geochem. Int. 2017, 55, 195–204. [Google Scholar] [CrossRef]
- Nesterov, I.I. Oil and gas content of bituminous clays of the Bazhenov Formation in Western Siberia. Sov. Geol. 1980, 11, 3–10. (In Russian) [Google Scholar]
- Melenevsky, V.N. Genesis of the organic matter of the Bazhenov Formation. Geol. Geophys. 2000, 41, 71–79. (In Russian) [Google Scholar]
- Goncharov, I.V.; Samoilenko, V.V.; Oblasov, N.V. Prospects of Shale Oil Bazhenov Formation in the South-East of Western Siberia. In Proceedings of the SPE Russian Oil and Gas Exploration & Production Technical Conference and Exhibition, Moscow, Russia, 14–16 October 2014. [Google Scholar] [CrossRef]
- Dakhnova, M.V.; Mozhegova, S.V.; Nazarova, E.S.; Paizanskaya, I.L. Evaluation of reserves of shale oil using geochemical parameters. Oil Gas Geol. 2015, 4, 55–61. (In Russian) [Google Scholar]
- Kozlova, E.V.; Fadeeva, N.P.; Kalmykov, G.A.; Balushkina, N.S.; Pronina, N.V.; Poludetkina, E.N.; Kostenko, O.V.; Yurchenko, A.Y.; Borisov, R.S.; Bychkov, A.Y.; et al. Geochemical technique of organic matter research in deposits enrich in kerogene (the Bazhenov Formation, West Siberia). Mosc. Univ. Geol. Bull. 2015, 70, 409–418. [Google Scholar] [CrossRef]
- Kalmykov, G.A.; Balushkina, N.S. Model of Oil Saturation of the Pore Space of the Bazhenov Formation Rocks within Western Siberia and its Use for Assessing the Resource Potential; Geos Publications: Moscow, Russia, 2017; p. 247. (In Russian) [Google Scholar]
- Volkov, V.A.; Oleinik, E.V.; Oksenoid, E.E.; Solopakhina, L.A. On the type of organic matter in the rocks of the Bazhenov Formation. Subsoil User Bull. 2016, 28. Available online: http://www.oilnews.ru/28-28/k-voprosu-o-tipe-organicheskogo-veshhestva-porod-bazhenovskoj-svity/ (accessed on 1 June 2021). (In Russian).
- Goncharov, I.V.; Samoilenko, V.V.; Oblasov, N.V.; Fadeeva, S.V.; Veklich, M.A.; Kashapov, R.S.; Trushkov, P.V.; Bahtina, E.S. Types of organic matter and catagenesis of the Bazhenov formation and its same-aged analogues. Oil Ind. 2016, 10, 20–25. (In Russian) [Google Scholar]
- Kozlova, E.; Spasennykh, M.; Kalmykov, G.; Gutman, I.; Potemkin, G.; Alekseev, A. Balance of the petroleum hydrocarbon compounds in pyrolyzed organic matter of the Bazhenov formation. Neft. Khozyaystvo Oil Ind. 2017, 3, 18–21. [Google Scholar] [CrossRef]
- Fomin, A.N. Catagenesis of Organic Matter and Petroleum Potential of Mesozoic and Paleozoic Deposits of the West Siberian Megabasin; IPGG SB RAS: Novosibirsk, Russia, 2011; p. 331. (In Russian) [Google Scholar]
- Kalmykov, A.G.; Karpov, Y.A.; Topchiy, M.S.; Fomina, M.M.; Manuilova, E.A.; Tretyakova, I.O.; Sheremeteva, E.V.; Pronina, N.V.; Shishkov, V.A.; Balushkina, N.S.; et al. The effect of catagenetic maturity on the formation of reservoirs with organic porosity in the Bazhenov formation and peculiarities of their extension. Georesursy 2019, 21, 159–171. [Google Scholar] [CrossRef]
- Vassoevich, N.B. Geochemistry of Matter and Origin of Petroleum; Nauka: Moscow, Russia, 1986; p. 368. (In Russian) [Google Scholar]
- Shpilman, V.I.; Solopahia, L.A.; Pyatkov, V.I. New Tectonic Map of the Central Regions of Western Siberia; Putived Publications: Khanty-Mansiysk, Russia, 1999. (In Russian) [Google Scholar]
- Skvortsov, M.B.; Dakhnova, M.V.; Mozhegova, S.V.; Kirsanov, A.M.; Komkov, I.K.; Paizanskaya, I.L. Geochemical methods for prediction and assessment of shale oil resources (case study of Bazhenov Formation). Гeoлoгия И Гeoφизикa 2017, 58, 495–503. [Google Scholar] [CrossRef]
- Maglevannaia, P.; Kozlova, E.; Spasennykh, M. Analysis of Geochemical Trends for the Bazhenov Oil Shale Formation Based on Pyrolysis Data. In Proceedings of the 29th International Meeting on Organic Geochemistry, Gothenburg, Sweden, 1–6 September 2019. [Google Scholar] [CrossRef]
- Gusev, I.M.; Panchenko, I.V.; Smirnova, M.E.; Taldykin, Y.B.; Kulikov, P.Y. Approaches to assessing the maturity of organic matter in the Bazhenovo formation according to a comparison of pyrolytic parameters, lithology and stratigraphy of sections. In Proceedings of the 8th All-Russian Meeting with International Participation, Syktyvkar, Russia, 7–10 September 2020; pp. 54–58. (In Russian). [Google Scholar]
- Leushina, E.; Kozlova, E.; Voropaev, A.; Yurchenko, A.; Bogdanovich, N.; Spasennykh, M. Characterization of the Organic Matter in the Bazhenov Formation Deposits from Northern and Central Parts of Western Siberia. In Proceedings of the 6th EAGE Shale Workshop, Bordeaux, France, 28 April–1 May 2019. [Google Scholar] [CrossRef]
- Spasennykh, M.; Voropaev, A.; Kozlova, E.; Leushina, E.; Polyakov, V.; Vasiliev, A.; Bogdanovich, N.; Popov, Y.; Maximov, A. Organic Matter of Bazhenov Formation: Chemical and Isotope Composition, Microstructure, Thermal Maturation, Generation Potential and the Effect on Rock Properties. In Proceedings of the 6th EAGE Shale Workshop, Bordeaux, France, 28 April–1 May 2019. [Google Scholar] [CrossRef]
- ISO 7404-3. Methods for the Petrographic Analysis of Coals—Part 3: Method of Determining Maceral Group Composition; International Organization for Standardization: Geneva, Switzerland, 2009; pp. 1–7. [Google Scholar]
- The new inertinite classification (ICCP System 1994). Fuel 2001, 80, 459–471. [CrossRef]
- Sýkorová, I.; Pickel, W.; Christanis, K.; Wolf, M.; Taylor, G.; Flores, D. Classification of huminite—ICCP System 1994. Int. J. Coal Geol. 2005, 62, 85–106. [Google Scholar] [CrossRef]
- Pickel, W.; Kus, J.; Flores, D.; Kalaitzidis, S.; Christanis, K.; Cardott, B.; Misz-Kennan, M.; Rodrigues, S.; Hentschel, A.; Hamor-Vido, M.; et al. Classification of liptinite—ICCP System 1994. Int. J. Coal Geol. 2017, 169, 40–61. [Google Scholar] [CrossRef] [Green Version]
- Espitalie, J.; Madec, M.; Tissot, B.P.; Mennig, J.; Leplat, P. Source Rock Characterization Method for Petroleum Exploration. In Proceedings of the 9th Annual Offshore Technology Conf., Houston, TX, USA, 2–5 May 1977. [Google Scholar] [CrossRef]
- Peters, K.E. Guidelines for Evaluating Petroleum Source Rock Using Programmed Pyrolysis. AAPG Bull. 1986, 70, 318–329. [Google Scholar] [CrossRef]
- Tissot, B.P.; Pelet, R.; Ungerer, P.H. Thermal History of Sedimentary Basins, Maturation Indices, and Kinetics of Oil and Gas Generation. AAPG Bull. 1987, 71, 1445–1466. [Google Scholar] [CrossRef]
- Tissot, B.P.; Welte, D.H. Petroleum Formation and Occurrence, 2nd ed.; Springer: Berlin, Germany, 1984; p. 699. [Google Scholar]
- Pepper, A.S.; Corvi, P.J. Simple kinetic models of petroleum formation. Part I: Oil and gas generation from kerogen. Mar. Pet. Geol. 1995, 12, 291–319. [Google Scholar] [CrossRef]
- Horsfield, B. Practical criteria for classifying kerogens: Some observations from pyrolysis-gas chromatography. Geochim. Cosmochim. Acta 1989, 53, 891–901. [Google Scholar] [CrossRef]
- Giraud, A. Application of Pyrolysis and Gas Chromatography to Geochemical Characterization of Kerogen in Sedimentary Rock. AAPG Bull. 1970, 54, 439–451. [Google Scholar] [CrossRef]
- Dembicki, H., Jr. Three common source rock evaluation errors made by geologists during prospect or play appraisals. AAPG Bull. 2009, 93, 341–356. [Google Scholar] [CrossRef]
- Kontorovich, A.E.; Bogorodskaya, L.I.; Borisova, L.S.; Burshtein, L.M.; Ismagilov, Z.P.; Efimova, O.S.; Kostyreva, E.A.; Lemina, N.M.; Ryzhkova, S.V.; Sozinov, S.A.; et al. Geochemistry and Catagenetic Transformations of Kerogen from the Bazhenov Horizon. Geochem. Int. 2019, 57, 621–634. [Google Scholar] [CrossRef]
- Dakhnova, M.V.; Pankina, R.G.; Korab, Z.; Glogochyevski, Y.Y.; Stshetatski, Y.S. Identification of hydrocarbon generation zones in Zechstein Main Dolomite of Permian region in Poland. Oil Gas Geol. 1981, 4, 49–55. (In Russian) [Google Scholar]
- Kusakabe, M.; Mizutani, Y.; Kometani, M. A preliminary stable isotope study of volcanic ashes discharged by the 1979 eruption of Ontake Volcano, Nagano, Japan. Bull. Volcanol. 1982, 45, 203–209. [Google Scholar] [CrossRef]
- Ikehata, K.; Maruoka, T. Sulfur isotopic characteristics of volcanic products from the September 2014 Mount Ontake eruption, Japan. Earth Planets Space 2016, 68, 1. [Google Scholar] [CrossRef] [Green Version]
- Meyers, P.A.; Leenheer, M.J.; Kawka, O.E.; Trull, T.W. Enhanced preservation of marine-derived organic matter in Cenomanian black shales from the southern Angola Basin. Nat. Cell Biol. 1984, 312, 356–359. [Google Scholar] [CrossRef]
- Rau, G.H.; Arthur, M.A.; Dean, W.E. 15N/14N variations in Cretaceous Atlantic sedimentary sequences: Implication for past changes in marine nitrogen biogeochemistry. Earth Planet Sci. Lett. 1987, 82, 269–279. [Google Scholar] [CrossRef] [Green Version]
- Ohkouchi, N.; Kuroda, J.; Okada, M.; Tokuyama, H. Why Cretaceous black shales have high C/N ratios? Implications from SEM-EDX observations for Livello Bonarelli black shales at the Cenomanian-Turonian boundary. Front. Res. Earth Evol. 2003, 1, 239–241. [Google Scholar]
- Galimov, E. Isotope organic geochemistry. Org. Geochem. 2006, 37, 1200–1262. [Google Scholar] [CrossRef]
- Macko, S.A.; Fogel, M.L.; Hare, P.; Hoering, T. Isotopic fractionation of nitrogen and carbon in the synthesis of amino acids by microorganisms. Chem. Geol. Isot. Geosci. Sect. 1987, 65, 79–92. [Google Scholar] [CrossRef]
- Shaldybin, M.; Krupskaya, V.V.; Glotov, A.; Dorjieva, O.V.; Goncharov, I.V.; Samoilenko, V.V.; Deeva, E.S.; Lopushnyak, Y.M.; Bether, O.V.; Zakusin, S.; et al. Petrography and clay mineralogy of anomaly luminescent layers in Bazhenov suite of Western Siberia sedimentary basin. Neft. Khozyaystvo Oil Ind. 2018, 2, 36–40. [Google Scholar] [CrossRef]
- Taylor, T.; Longo, A. Valuing algal bloom in the Black Sea Coast of Bulgaria: A choice experiments approach. J. Environ. Manag. 2010, 91, 1963–1971. [Google Scholar] [CrossRef]
- Ferrante, M.; Conti, G.O.; Fiore, M.; Rapisarda, V.; Ledda, C. Harmful Algal Blooms in The Mediterranean Sea: Effects on Human Health. Euromediterr. Biomed. J. 2013, 8, 25–34. [Google Scholar] [CrossRef]
- Van, A.V.; Kazansky, Y.P. Volcanoclastic Material in Sediments and Sedimentary Rocks; Nauka: Novosibirsk, Russia, 1985; p. 128. (In Russian) [Google Scholar]
- Fujimura, R.; Sato, Y.; Nishizawa, T.; Nanba, K.; Oshima, K.; Hattori, M.; Kamijo, T.; Ohta, H. Analysis of Early Bacterial Communities on Volcanic Deposits on the Island of Miyake (Miyake-jima), Japan: A 6-year Study at a Fixed Site. Microbes Environ. 2012, 27, 19–29. [Google Scholar] [CrossRef] [PubMed] [Green Version]
- Zhang, R.; Jiang, T.; Tian, Y.; Xie, S.; Zhou, L.; Li, Q.; Jiao, N. Volcanic ash stimulates growth of marine autotrophic and heterotrophic microorganisms. Geology 2017, 45, G38833.1. [Google Scholar] [CrossRef]
- Predtechenskaya, E.A.; Krol, L.A.; Gurari, F.G.; Sapyanik, V.V.; Perosio, G.N.; Malyushko, L.D. On the genesis of carbonates in the Bazhenov Formation within the central and southeastern regions of the West Siberian plate. Lithosphere 2006, 4, 131–148. (In Russian) [Google Scholar]
- Khotylev, O.V.; Balushkina, N.A.; Vishnevskaya, V.S.; Korobova, N.I.; Kalmykov, G.A.; Roslyakova, A.S. A Model of the Accumulation of Radiolarite Layers in the Bazhenov Formation of West Siberia. Mosc. Univ. Geol. Bull. 2019, 74, 206–211. [Google Scholar] [CrossRef]
- Tian, R.; Lin, Q.; Li, D.; Zhang, W.; Zhao, X. Atmospheric transport of nutrients during a harmful algal bloom event. Reg. Stud. Mar. Sci. 2020, 34, 101007. [Google Scholar] [CrossRef]
- Hallegraeff, G.M.; Anderson, D.M.; Cembella, A.D.; Enevoldsen, H.O. Manual on Harmful Marine Microalgae, 2nd ed.; UNESCO: Paris, France, 2004; p. 793. [Google Scholar]
- Golbert, A.V. Regional Paleoclimatology of Siberia (Jurassic-Paleogene. Methods, Results). Ph.D. Thesis, SNIIGGiMS, Novosibirsk, Russia, 1983; p. 396. (In Russian). [Google Scholar]
- Surkov, A.V. Some features of detrital quartz grains from aeolian and marine beach sediments. Izv. Universities. Geol. Dev. 1987, 4, 143–145. (In Russian) [Google Scholar]
- Huc, A. Geochemistry of Fossil Fuels: From Conventional to Unconventional Hydrocarbon Systems; Editions Technip: Paris, France, 2013; p. 254. [Google Scholar]
- Speight, J. Shale Oil and Gas. Production Processes; Elsevier: Oxford, UK, 2020; p. 1046. [Google Scholar]
- Bertrand, P.; Pittion, J.-L.; Bernaud, C. Fluorescence of sedimentary organic matter in relation to its chemical composition. Org. Geochem. 1986, 10, 641–647. [Google Scholar] [CrossRef]
- Pradier, B.; Bertrand, P.; Martinez, L.; Laggoun-Defarge, F. Fluorescence of organic matter and thermal maturity assessment. Org. Geochem. 1991, 17, 511–524. [Google Scholar] [CrossRef]
- Hackley, P.C.; Cardott, B.J. Application of organic petrography in North American shale petroleum systems: A review. Int. J. Coal Geol. 2016, 163, 8–51. [Google Scholar] [CrossRef] [Green Version]
- Abarghani, A.; Ostadhassan, M.; Hackley, P.C.; Pomerantz, A.E.; Nejati, S. A chemo-mechanical snapshot of in-situ conversion of kerogen to petroleum. Geochim. Cosmochim. Acta 2020, 273, 37–50. [Google Scholar] [CrossRef]
- Kalkreuth, W.; Naylor, R.; Pratt, K.; Smith, W. Fluorescence properties of alginiterich oil shales from the Stellarton Basin, Canada. Fuel 1990, 69, 139–144. [Google Scholar] [CrossRef]
- Smith, W.; Peter, C.S.; Naylor, R.; Mukhopadhyay, P.; Kalkreuth, W.; Ball, F.; Macauley, G. Composition and depositional environment of major eastern Canadian oil shales. Int. J. Coal Geol. 1991, 19, 385–438. [Google Scholar] [CrossRef]
- Langrock, U.; Stein, R. Origin of marine petroleum source rocks from the Late Jurassic to Early Cretaceous Norwegian Greenland Seaway—Evidence for stagnation and upwelling. Mar. Pet. Geol. 2004, 21, 157–176. [Google Scholar] [CrossRef]
- Stein, R. The Late Mesozoic-Cenozoic Arctic Ocean Climate and Sea Ice History: A Challenge for Past and Future Scientific Ocean Drilling. Paleoceanogr. Paleoclimatol. 2019, 34, 1851–1894. [Google Scholar] [CrossRef] [Green Version]
- Ioannides, N.S.; Stavrinos, G.N.; Downie, C. Kimmeridgian Microplankton from Clavell’s Hard, Dorset, England. Micropaleontology 1976, 22, 443. [Google Scholar] [CrossRef]
- Morgans-Bell, H.S.; Coe, A.; Hesselbo, S.P.; Jenkyns, H.C.; Weedon, G.P.; Marshall, J.E.A.; Tyson, R.V.; Williams, C.J. Integrated stratigraphy of the Kimmeridge Clay Formation (Upper Jurassic) based on exposures and boreholes in south Dorset, UK. Geol. Mag. 2001, 138, 511–539. [Google Scholar] [CrossRef] [Green Version]


| Well | Sample | S0 + S1, mg HC/g | S2 mg HC/g | PI (S1/S1 + S2) | TOC, wt.% | Kgoc, % | Tmax, °C | HI, mg HC/g TOC | OI, mg CO2/g TOC |
|---|---|---|---|---|---|---|---|---|---|
| V-K 81 | Alginite-rich layer | 2.15 | 241.65 | 0.01 | 22.94 | 91 | 445 | 1053 | 1 |
| Host rock | 4.64 | 133.90 | 0.03 | 17.81 | 67 | 431 | 751 | 4 | |
| V-Ch 526 | Alginite-rich layer | 1.06 | 219.02 | 0.01 | 21.56 | 87 | 443 | 1015 | 1 |
| Host rock | 5.12 | 74.52 | 0.06 | 10.72 | 67 | 430 | 682 | 3 | |
| M 184 | Alginite-rich layer | 0.53 | 259.24 | 0.00 | 25.25 | 88 | 451 | 1026 | 3 |
| Host rock | 1.36 | 46.21 | 0.03 | 8.77 | 48 | 438 | 527 | 11 | |
| S-O 128 | Alginite-rich layer | 2.49 | 110.48 | 0.02 | 12.20 | 79 | 450 | 905 | 6 |
| Host rock | 2.99 | 71.05 | 0.04 | 13.20 | 49 | 444 | 538 | 4 | |
| O 318 | Alginite-rich layer | 1.36 | 103.14 | 0.53 | 12.19 | 74 | 447 | 846 | 4 |
| Tuff | 0.22 | 2.08 | 0.10 | 0.77 | 34 | 436 | 269 | 36 | |
| Host rock | 5.65 | 66.43 | 0.45 | 13.9 | 48 | 436 | 478 | 3 | |
| S 40 | Alginite-rich layer | 1.79 | 140.25 | 0.01 | 16.21 | 76 | 440 | 865 | 2 |
| Host rock | 2.81 | 51.93 | 0.05 | 10.69 | 46 | 430 | 485 | 3 | |
| V-I 301 | Alginite-rich layer | 0.50 | 66.78 | 0.01 | 8.19 | 72 | 439 | 815 | 4 |
| Host rock | 3.44 | 54.25 | 0.06 | 11.03 | 48 | 431 | 491 | 5 | |
| D 541 | Tuff | 0.16 | 1.88 | 0.08 | 0.71 | 28 | 454 | 264 | 28 |
| M 14 | Tuff | 0.25 | 2.03 | 0.11 | 0.60 | 37 | 421 | 339 | 59 |
| J 177 | Tuff | 0.34 | 1.89 | 0.15 | 0.79 | 28 | 437 | 240 | 29 |
| Hydrocarbon Classes (% w/w) | Well S-O 128 | Well V-I 301 | ||
|---|---|---|---|---|
| Host Rock | Alginite-Rich Layer | Host Rock | Alginite-Rich Layer | |
| Light HC C1–C7 | 7 | 6 | 19 | 8 |
| n-Alkanes C8–C40 | 8 | 25 | 25 | 33 |
| Unsaturated HC and naphthenes | 37 | 64 | 29 | 53 |
| Mono-aromatic compounds | 21 | 4 | 19 | 4 |
| Di-aromatic compounds | 15 | 1 | 7 | 1 |
| Tri- and poly-aromatic compounds | 12 | 0 | 1 | 1 |
| Aliphatic/aromatic | 52/48 | 95/5 | 73/27 | 94/6 |
| H/C | 1.09 | 1.88 | 1.19 | 1.69 |
| O/C | 0.06 | 0.07 | 0.09 | 0.05 |
| Well | Sample | Corg/Ntot | δ13Corg, ‰ PDB | Ntot, wt.% | δ15Ntot, ‰ AIR | Stot, wt.% | δ34Stot, ‰ CDT | Corg, wt.% |
|---|---|---|---|---|---|---|---|---|
| V-K81 | Alginite-rich layer | 93.37 | −31.5 | 0.21 | 5.9 | 2.31 | −6.0 | 22.12 |
| Host rock | 43.84 | −31.4 | 0.37 | 0.9 | 4.36 | −17.3 | 17.81 | |
| S-O 128 | Alginite-rich layer | 103.28 | −31.8 | 0.11 | 7.7 | 1.61 | −18.5 | 12.20 |
| Host rock | 43.54 | −30.5 | 0.34 | 3.2 | 3.71 | −24.9 | 12.30 | |
| V-I 301 | Alginite-rich layer | 109.57 | −31.8 | 0.07 | 17.5 | 2.75 | −11.2 | 8.19 |
| Host rock | 42.23 | −31.9 | 0.24 | 5.4 | 4.18 | −26.0 | 11.03 | |
| V-C 526 | Alginite-rich layer | 155.50 | −31.1 | 0.15 | 25.7 | 1.37 | −9.3 | 21.56 |
| Host rock | - | - | - | - | - | - | - | |
| L 42 | Alginite-rich layer | 76.83 | −31.9 | 0.21 | 13.0 | 2.10 | −7.1 | 19.79 |
| Host rock | - | - | - | - | - | - | - | |
| D 541 | Tuff | 2.70 | −28.8 | 0.45 | 2.4 | 1.89 | 4.4 | 0.71 |
| M 14 | Tuff | 4.38 | −29.0 | 0.21 | 1.5 | 0.69 | 4.5 | 0.60 |
| J 177 | Tuff | 4.11 | −28.9 | 0.23 | 2.1 | 0.63 | 2.4 | 0.79 |
Publisher’s Note: MDPI stays neutral with regard to jurisdictional claims in published maps and institutional affiliations. |
© 2021 by the authors. Licensee MDPI, Basel, Switzerland. This article is an open access article distributed under the terms and conditions of the Creative Commons Attribution (CC BY) license (https://creativecommons.org/licenses/by/4.0/).
Share and Cite
Bulatov, T.; Kozlova, E.; Leushina, E.; Panchenko, I.; Pronina, N.; Voropaev, A.; Morozov, N.; Spasennykh, M. Alginite-Rich Layers in the Bazhenov Deposits of Western Siberia. Geosciences 2021, 11, 252. https://doi.org/10.3390/geosciences11060252
Bulatov T, Kozlova E, Leushina E, Panchenko I, Pronina N, Voropaev A, Morozov N, Spasennykh M. Alginite-Rich Layers in the Bazhenov Deposits of Western Siberia. Geosciences. 2021; 11(6):252. https://doi.org/10.3390/geosciences11060252
Chicago/Turabian StyleBulatov, Timur, Elena Kozlova, Evgeniya Leushina, Ivan Panchenko, Natalia Pronina, Andrey Voropaev, Nikita Morozov, and Mikhail Spasennykh. 2021. "Alginite-Rich Layers in the Bazhenov Deposits of Western Siberia" Geosciences 11, no. 6: 252. https://doi.org/10.3390/geosciences11060252