

Applying Factor Analysis and the CCME Water Quality Index for Assessing Groundwater Quality of an Aegean Island (Rhodes, Greece)


Laboratory of Geoenvironmental Science and Environmental Quality Assurance, Department of Civil Engineering, School of Engineering, University of West Attica, 250 Thivon & P. Ralli Str., 12241 Athens, Greece
Geosciences 2022, 12(10), 384; https://doi.org/10.3390/geosciences12100384
Submission received: 20 August 2022
/
Revised: 8 October 2022
/
Accepted: 12 October 2022
/
Published: 17 October 2022
Abstract
:Globally, water quality indices (WQIs) are beneficial for evaluating groundwater and surface water quality. The Canadian Council of Ministers of Environment Water Quality Index (CCME WQI) was combined with the parametric values given by Directive 98/83/EC to investigate the possible suitability of groundwater resources for human consumption on Rhodes Island. Chloride (Cl−), pH, calcium (Ca2+), electrical conductivity (CND), carbonate (CO32−), bicarbonate (HCO3−), potassium (K+), magnesium (Mg2+), sulfate (SO42−), sodium (Na+),nitrate (NO3−), nitrite (NO2−), ammonium (NH4+), and phosphate (PO43−) were included in the dataset applied in this study. Statistical analysis, GIS database, and WQI estimation were successfully used to evaluate the groundwater resources of the study area. All studied groundwater parameters have mean and median values lower than the corresponding parametric values established by Directive 98/83/EC. The high CND values (up to 2730 μs cm−1) in groundwater collected from Rhodes’ coastal aquifers indicate a direct relationship with seawater intrusion. CCME-WQI classifies the groundwater samples for most monitoring stations on Rhodes aquifers as “excellent”, Class 5, for 2019 and 2020. The findings of this study may be helpful for scientists and stakeholders monitoring the study area and applying measures to protect the groundwater resources.
1. Introduction
Evaluating water quality and analyzing potential linkages between element concentration in water and human health are essential components of the laws and guidelines issued by many researchers and authorities [1,2,3,4,5,6,7,8]. Although numerous scientists and engineers have conducted meticulous research studies on a wide range of water quality issues, it is evident that there is a shortage of mature and scientifically sound processes in several areas [9,10]. One of these issues is the documentation of a universally acknowledged single value or score for expressing the water quality of an aquifer in terms of a WQI (water quality index). WQIs are intended to be valuable and persuasive tools for preventing deterioration of water quality and the sustainable development of water resources. WQIs are able to allow a better understanding of the water quality status by calculating a single value that is not based on any particular dimension. This makes it feasible to evaluate, express, and communicate even to non-experts the overall quality of any water source [11].
The topic of water quality is broad and comprehensive [1,12,13,14,15]. Gradual deterioration of water quality is one of the primary impacts of agricultural, industrial, and household expansion and other land use changes [2,4,13,16]. Well-structured planning of water resources is essential for protecting water quality and assessing and managing groundwater and surface water contamination.
In the present survey, a research study based on multivariate statistics and a WQI is performed to assess groundwater quality of Rhodes Island, Greece.
Recent research studies focusing on the water quality evaluation using factor analysis and estimation of WQI include:
- (a)
- Alexakis [1] proposed a new meta-evaluation approach of two widely used WQIs for application in groundwater quality assessment;
- (b)
- Panagopoulos et al. [17] implemented the CCME-WQI (Canadian Council of Ministers of Environment Water Quality Index) for the evaluation of the physicochemical quality of Greek rivers;
- (c)
- Alqarawy et al. [18] combined, among others, physicochemical parameters and WQIs to delineate water quality and controlling factors using multivariate modeling techniques;
- (d)
- Haider et al. [19] discussed the spatiotemporal water quality variations in smaller water supply systems by applying modified CCME-WQI from groundwater resources to distribution networks;
- (e)
- Molekoa et al. [20] employed hydrogeochemical analysis of groundwater samples to calculate WQI and evaluated factors governing water quality evolution in the Mokopane area (South Africa);
- (f)
- Shafique et al. [21] applied multivariate and geospatial monitoring of water and soil quality to investigate the impact on the planted mangroves growth pattern at the Indus delta;
- (g)
- Aldrees et al. [22] presented the development of a multi-expression programming based predictive model for water quality parameters and WQI.
Most of the WQIs in the literature include steps for sub-indexing and weighting [23]. However, the CCME-WQI skipped these steps and performed the final aggregation function by using the parameter measurements directly within fixed mathematical functions [24]. The CCME-WQI has become the most popular index, which has been used for all kinds of water bodies. Compared to other water quality indices, CCME-WQI has many benefits, such as the fact that it can be used with anywhere from only four to a vast number of water parameters, it is flexible when it comes to select water quality standards, and it can still be used if some data is missing [24]. Additionally, the index is practically independent of a specific set of quality parameters, so it can be used with almost any combination of parameters [24].
The main objectives of the present study are to apply the CCME-WQI to a dataset available for all the aquifers of an Aegean Island for the determination of their groundwater quality over a 2-year period and to evaluate water suitability for drinking purposes. To the writer’s knowledge, this is a unique effort so far to provide a representative application of the CCME-WQI on an Aegean island scale and investigate possible variations in its performance during two sampling campaigns (2019–2020).
The novelty of the present study lies mainly in the implementation of a well-known index for the first time on groundwater resources of an Aegean island with a high variation in topographical, climatic, geological, and hydrological settings and anthropogenic activities. It has to be highlighted that the application of the CCME-WQI on a Aegean island may attract many EU researchers, even policymakers, to the results of a globally used WQI. The results of this study could prove helpful for those who would like to identify how the examined index behaves. Moreover, the findings of this study may initiate the discussion that it is important to install and setup a monitoring network to evaluate groundwater deterioration of the aquifers on Rhodes Island by applying WQI because it turns raw data of water quality into information that is coherent and convenient for policy makers, stakeholders, and inhabitants. Furthermore, since the climate crisis is most likely to accelerate the mixing of seawater in coastal aquifers, the monitoring network in the area studied can help to the sustainable management of groundwater resources of Rhodes Island.
2. Materials and Methods
2.1. Study Area
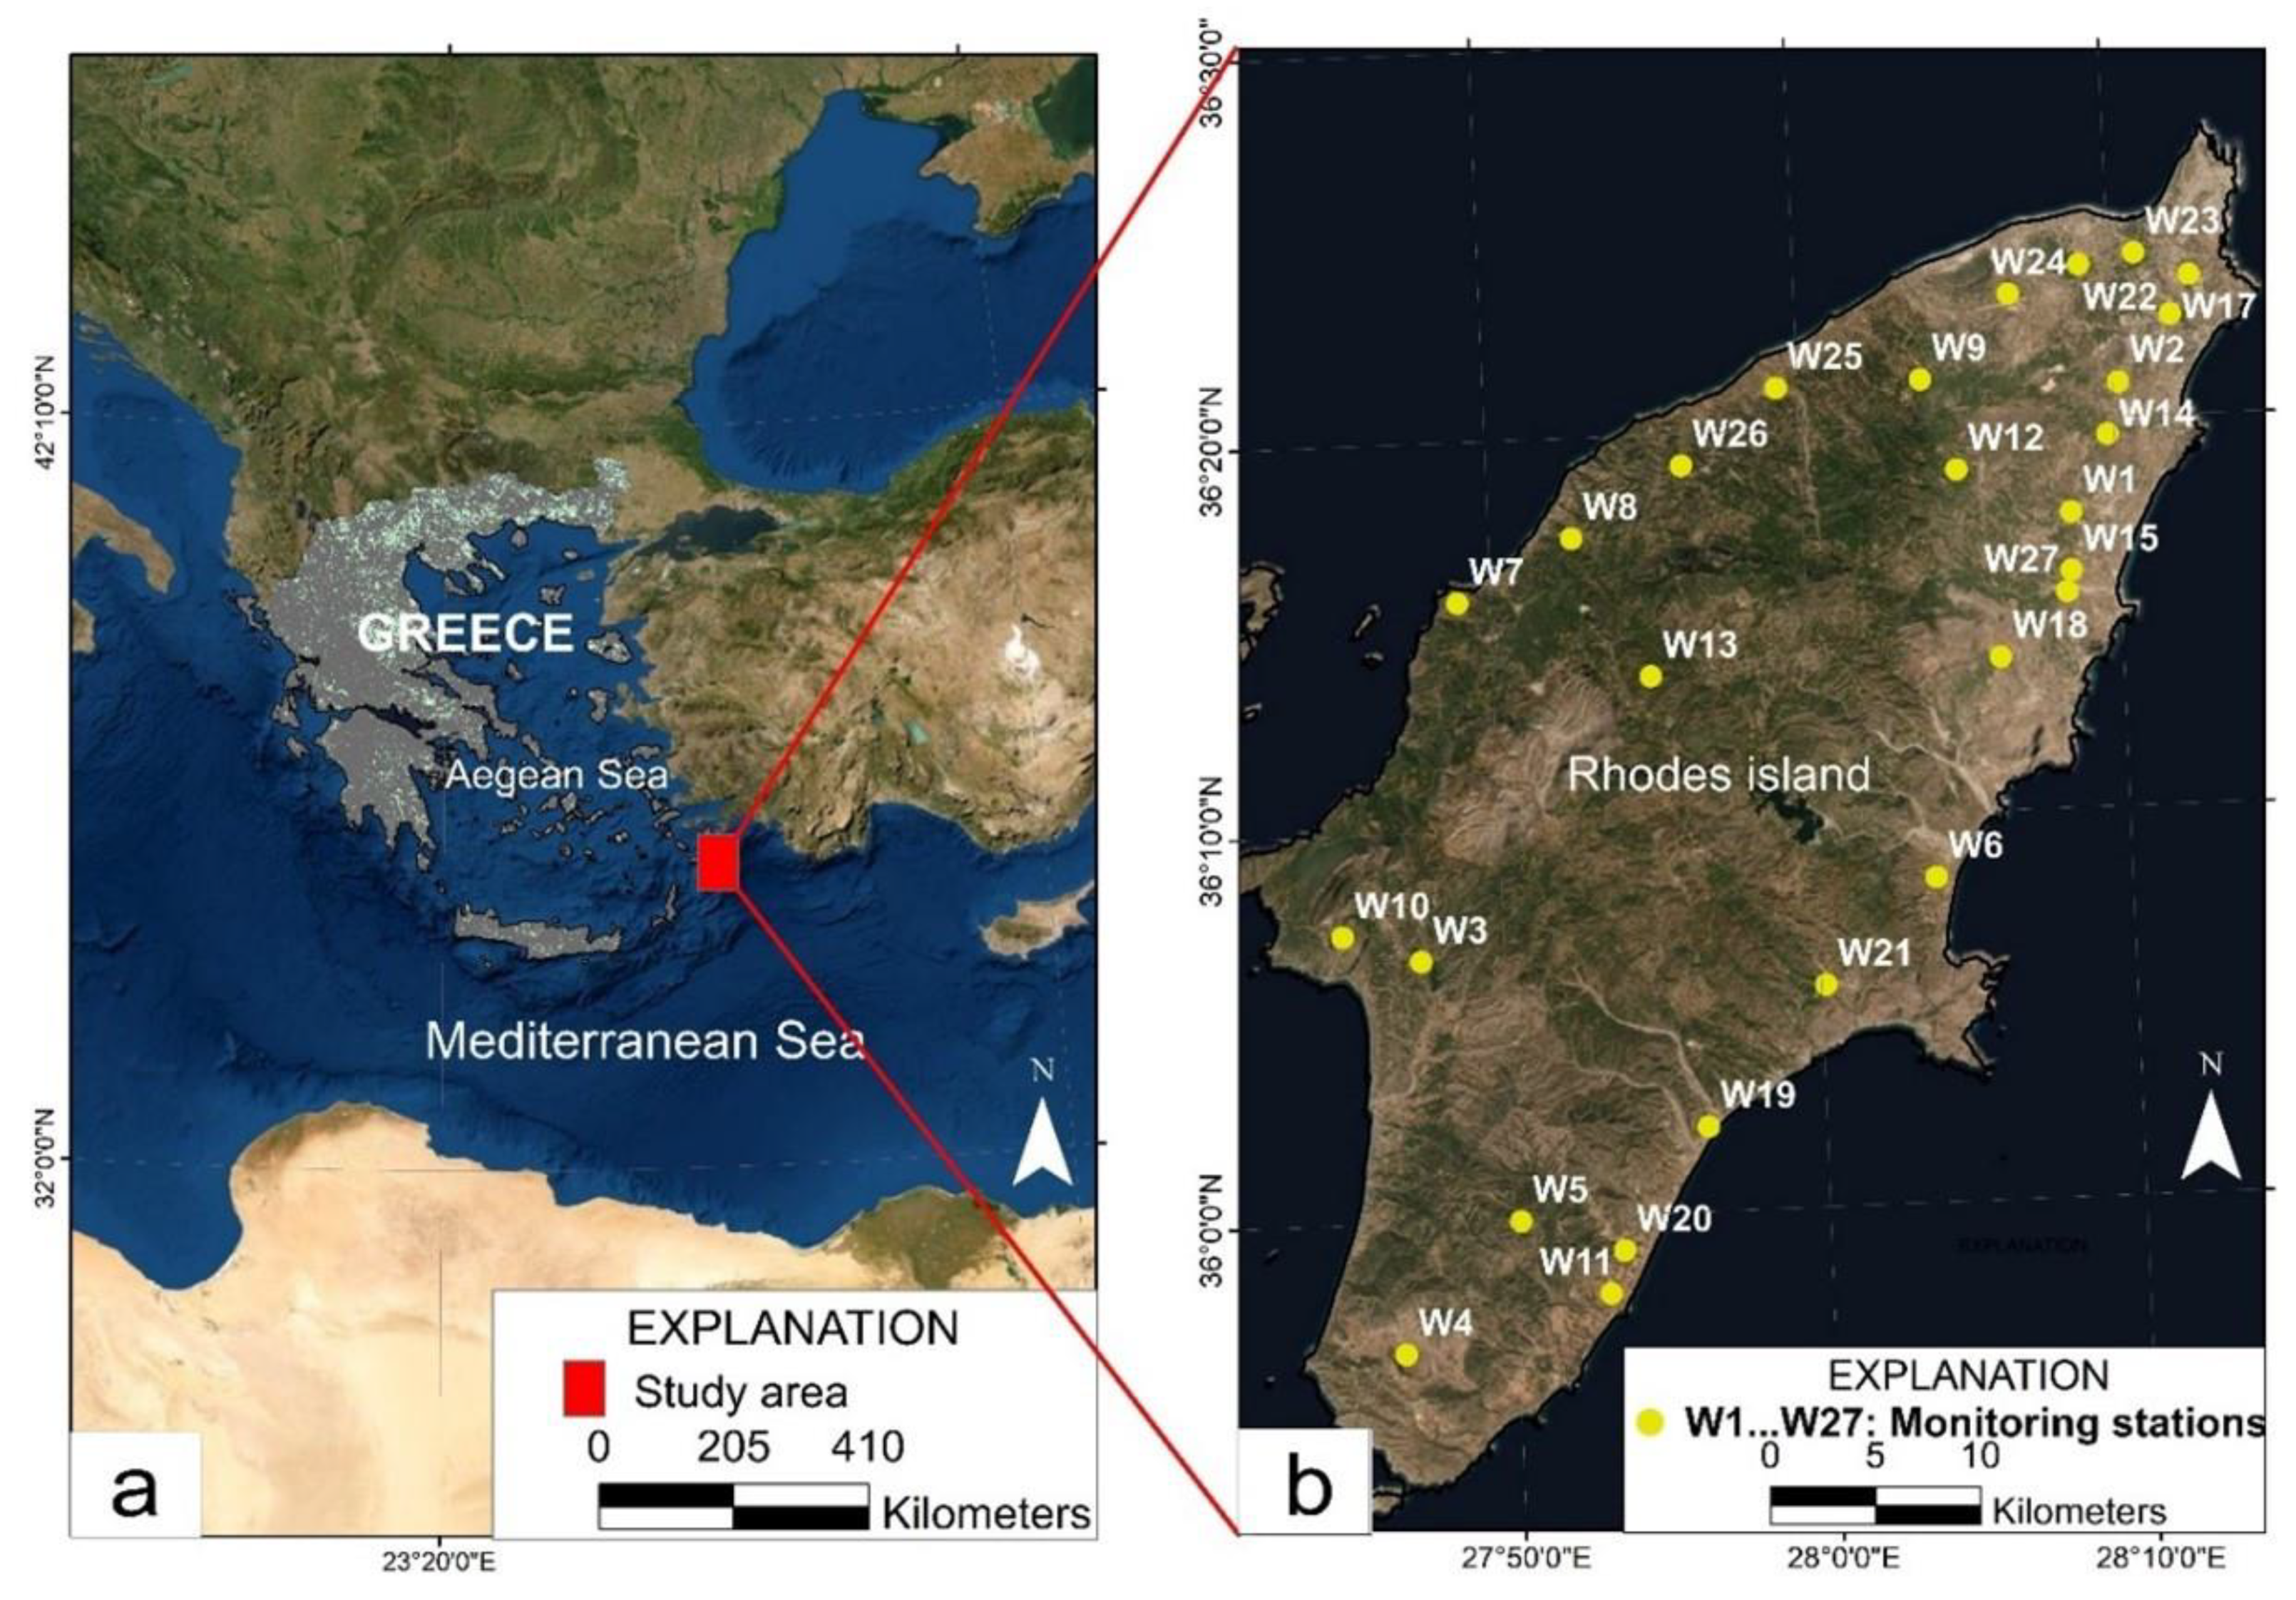
Rhodes Island is situated in the Aegean Sea, Greece (Figure 1). Water resource management is a significant concern on Rhodes Island (Figure 1), particularly during the summer when water demands increase due to the Island’s high visitor population. It is worth noting that the total population on Rhodes Island is 115,490 [25], and the total number of visiting people during the summer exceeds 3,300,000 [26].
The study area has a temperate, dry, hot summer climate, or Csa type, where at least one month’s average temperature is above 22 °C, the hottest month’s average temperature is above 10 °C, and the coldest month’s average temperature ranges from 0 to 8 °C [27]. The driest month’s rainfall is less than 33% of the wettest month’s rainfall [27]. Rhodes Island’s hydrogeological system is comprised of nine aquifer systems, which are as follows [28,29]: North Rhodes Island A granular aquifer (EL1400511), North Rhodes Island B granular aquifer (EL1400512), Prophet Elias karst aquifer (EL1400520), Seven springs karst aquifer (EL1400530), Kalathos-Gadouras granular aquifer (EL1400540), and Central granular aquifer (EL1400550), Attavyros karst aquifer (EL1400560), Central Rhodes Island granular aquifer (EL1400550), Apolakkia granular aquifer (EL1400570), and Genadi granular aquifer (EL1400580). Groundwater extraction and spring discharge meet most water demands, while wells on Rhodes Island are over-pumped during the summer [29].
Figure 1.
(a) Map showing the location of Rhodes Island and (b) sites of monitoring stations of groundwater (modified from [30]). More information and details about each monitoring station are tabulated in Table 1.
The CORINE land cover classes were acquired from the CORINE/land cover Copernicus application [31] and then added to the GIS (geographic information system) database as a separate polygon layer. The land on Rhodes Island is characterized by agricultural activities (Figure 2). A significant part of the land on Rhodes Island is covered by forest and semi-natural areas (Figure 2).
2.2. Primary Data and Data Treatment
A database was developed using all available information for 2019 and 2020 by collecting data from the Greek Ministry of Environment and Energy database [28]. It is important to note that data only for the wet period of each year is available. According to the Mediterranean climate type, the hydrological year is comprised of a wet and a dry period, with the wet period lasting from October to March and the dry period from April to September. The locations of monitoring stations are presented in Figure 1. The monitoring stations, aquifer codes, and water uses on Rhodes Island are tabulated in Table 1. The primary data applied in this study was assembled by Institute of Geology and Mineral Exploration. The dataset used in this study included the following parameters: pH, chloride (Cl−), calcium (Ca2+), electrical conductivity (CND), carbonate (CO32−), bicarbonate (HCO3−), potassium (K+), magnesium (Mg2+), sulfate (SO42−), sodium (Na+), nitrate (NO3−), nitrite (NO2−), ammonium (NH4+), and phosphate (PO43−). The Greek Government Gazette II 1635 of 9 June 2016 contains more technical information about field methods and water chemistry studies [32]. Microsoft® Excel (Redmond, Washington, DC, USA) and IBM®SPSS v.28 (International Business Machines Corporation; Statistical Product and Service Solutions; Armonk, NY, USA) for Windows were utilized for data processing. Simplified digital maps were developed using the ArcView 10.4 GIS software (ESRI®) (Environmental Systems Research Institute; Redlands, CA, USA).
The Rhodes Island dataset of groundwater quality parameters was processed by the statistical techniques of R-mode factor analysis, applying the Varimax-raw rotational approach with Kaiser normalization [33] to determine the common origin of the parameters and inter-parameter relationships. Kaiser [33] suggested that the variance of the squared loadings across a factor be maximized rather than the variance of the squared loadings for the variables. According to Kaiser [33] (Equation (1)), the resulting criterion to be maximized is:
where v is the number of variables, the ’s are the loadings and is the variance of the squared loadings for factor f.
Since factor analysis classifies or combines all the highly correlated variables into the same factor, the WQI is included in factor analysis to identify which parameter is “more important” than the other water quality parameters. The multivariate statistics analysis was applied to 9 parameters: pH, CND, Cl−, NO3−, NO2−, NH4+, SO42−, Na+, and CCME-WQI.
The KMO (Kaiser–Meyer–Olkin) test evaluates data for factor analysis [33]. The KMO test measures model as well as variable sampling adequacy. The statistic test measures common variance among variables (Equation (2)). Higher proportions and KMO-value make data better suited for factor analysis.
where is the partial correlation, and is the correlation between the variable in question and another variable.
A varimax rotation simplifies a sub-expression spaces into a few major items each [33,34]. The actual coordinate system is unchanged, and it is the orthogonal basis that is being rotated to align with those coordinates. Principal component analysis or factor analysis produce a dense subspace with multiple non-zero weights, making it difficult to interpret. Orthogonality requires a subspace-invariant rotation. Varimax maximizes squared loading variances (squared correlations between variables and factors). Intuitively, this is achieved if [33,34]: (a) a variable has a high loading on a single factor but near-zero loadings on the remaining factors and (b) a factor is composed of only a few variables with very high loadings on this factor while the remaining variables have near-zero loadings on this factor.
Varimax rotation brings the loading matrix closer to a simple structure if these conditions hold (as much as the data allow). Varimax seeks a basis that most economically represents each individual, meaning each can be described by a linear combination of a few basic functions [33,34].
According to Davis [34], the application of R-mode factor analysis in geochemical data was performed in the following steps:
(a) Computation of variances/covariances.
Variances/covariances were calculated using the formula (Equation (4)):
where x and y represent the i-th values of the standardized variables x and y, and xm and ym stand for their respective means.
(b) Estimation of the Eigen values and Eigen vectors. The covariance matrix’s values were computed. The data were transformed into factors.
(c) The “correct” number of factors was determined by applying a combination of Davis’s [34] proposed standard criteria. To accomplish a “simple structure,” the rotation of the factor axis was calculated. The correlation coefficients between variables and factors (loadings in factor analysis) are close to 0 or +1. The higher the factor loadings, the better the factors characterize the variables.
2.3. Application of WQI
The WQI developed by the CCME [24] was utilized to analyze Rhodes Island’s groundwater. CCME-WQI employs a goal value (objective or guideline) for each parameter that should not be exceeded and three important aspects (factors) to calculate a single unitless number that represents overall water quality.
The CCME modified the BC (British Columbia) WQI (water quality index) to create a CCME-WQI that water agencies in many countries could use. The CCME-WQI did not use sub-indices, weights, or classical index aggregation [24]. CCME-WQI applies a target value (guideline or objective) for each water quality parameter that should not be exceeded and three essential factors to estimate a single unitless number that represents overall water quality. The three factors are: (a) scope, or the number of variables in a dataset not meeting water quality criteria; (b) frequency, or the number of times the objectives are not met; and (c) amplitude, or the amount by which the objectives are not fulfilled. A score of 0 indicates the worst water quality, and 100 is the greatest. Acceptable water quality criteria are combined into a single number with a range from 0 to 100, with 100 signifying “excellent” quality [24]. The WQI classes, ratings, and boundaries which were applied in this study are tabulated in Table 2.
According to CCME [24], the equations of CCME-WQI are the following (5)–(11):
F1 (Scope) represents the percentage of failed parameters relative to the total number of measured parameters. The term “guidelines” means “objectives” or “target values.”
F2 (Frequency) shows the percentage of failed tests. A test compares a parameter’s value from a sampling campaign to its guideline.
F3 (Amplitude) stands for the amount by which failed test values do not meet their objectives (guidelines).
An excursion is the number of times a sample’s concentration is above (or below, if the guideline is a minimum) the guideline.
When the test value cannot fall below the objective [24]:
Summing individual tests’ deviations from guidelines and dividing by the total number of tests yields the total amount of non-compliance (both those meeting guidelines and those not meeting guidelines). This parameter, called nse, is estimated as [24]:
An asymptotic function scales the normalized sum of deviations from guidelines (nse) to calculate F3.
After obtaining the factors, the CCME-WQI is estimated by adding the F1, F2, and F3 as follows [24]:
The divisor 1.732 normalizes the outcome from 0 to 100, where 0 is the ‘worst’ and 100 is the ‘best’ water quality [24].
3. Results and Discussion
The variation of water quality parameters in the aquifers in the area studied is demonstrated in terms of three factors, accounting for 83.2% and 64.2% of the total variance of the dataset for the wet periods of 2019 and 2020, respectively. The varimax rotated factor loadings and the proportion of variance explained are tabulated in Table 4 and Table 5 for the sampling campaigns of 2019 and 2020, respectively. The KMO and Bartlett’s test of sphericity are calculated as 0.624 and 245.1 (p-value < 0.05) for the 2019 dataset and 0.655 and 83.6 (p-value < 0.05) for the 2020 dataset.
The analysis of the 2019 dataset revealed the following findings (Table 4): (a) Factor 1, explaining 48.6% of the total variability, is a dipolar factor with high positive loadings (greater than +0.875) for CND, Cl−, SO42−, and Na+ and high negative loading for CCME-WQI (−0.913); (b) Factor 2 accounts for 17.8% of the total variance and is a factor with high positive loadings for pH and NO2− (greater than +0.706) and moderate negative loading for NH4+ (−0.680); and (c) Factor 3, explaining 16.8% of the total variance and showing high positive loading for NO3− (+0.945).
The treatment of the 2020 dataset produced the following results (Table 5): (a) Factor 1, explaining 32.1% of the total variance, is a dipolar factor with high positive loadings (greater than +0.777) for CND, Cl−, and SO42−, moderate positive loading for Na+ (+0.530), and high negative loading for CCME-WQI (−0.711); (b) Factor 2 accounts for 17.3% of the total variance and is a factor with high positive loadings for NO3− (+0.950); and (c) Factor 3, explaining 14.7% of the total variance, presents high positive loading for NH4+ (+0.718).
Factor 1 is the most significant factor because it can illustrate the largest proportion of the total variance in both datasets (Table 4 and Table 5). The variability of CND, Cl−, SO42−, and Na+ in Factor 1 can be attributed to the process of mixing seawater with freshwater. The close relationships between Cl−, SO42−, and Na+ can be attributed to the presence of these ions in seawater. Groundwater salinization in the agricultural areas of Rhodes Island be away from the coast can be attributed to “irrigation return-flow” (Figure 2 and Figure 3). In other words, dissolved salts in irrigation water are concentrated by evapotranspiration process and finally infiltrate from soil to aquifer of Rhodes Island. Similar processes of groundwater salinization which are directly related to agricultural areas are also reported by Suarez et al. [36] in the Upper Rio Grande (USA) and Foster et al. [37] in Almeria (Spain) and Punjab (Pakistan). Moreover, the CND value increases with the content of dissolved salts. Factor 1 expresses the total salt content of the groundwater samples determined by these parameters. Thus, Factor 1 may be referred to as “salinity factor” for both examined datasets. Similar results derived from factor analysis were also reported by many researchers who studied seawater intrusion into coastal aquifers [38,39]. Moreover, Vandarakis et al. [40], who evaluated the coastal vulnerability to the ongoing sea level rise for Rhodes Island, indicated high to very high vulnerability for 40% of the entire coastline length. Factor 1 identified the antipathetic relation between CND-Cl−-SO42−-Na+, and CCME-WQI in both sampling campaigns indicating that these water quality parameters significantly influence the CCME-WQI (Table 4 and Table 5).
All the mean and median values of the examined parameters in groundwater of the area studied did not exceed the corresponding parametric values (PVs) given by Dir.98/83/EC [35] (Table 6), denoting that most water samples are suitable for human consumption.
The content of Cl− in groundwater samples collected from three (W4, W5, and W7) and two (W4 and W5) monitoring stations during the 2019 and 2020 sampling period, respectively, exceed the PV given by the EC [35]. The Na+ concentration in groundwater collected from monitoring stations W5, W8, and W22 during 2019 is higher than the PV given by the EC [35]. The Na+ content in groundwater gathered from W5 and W8 during 2020 exceeds the corresponding PV established by the EC [35]. Only one monitoring station (W7) in 2019 and one monitoring station (W4) during 2020 presented NO3− contents in groundwater higher than PV suggested by the EC [35] (Table 6; Figure 4). The groundwater gathered from monitoring station W5 in both sampling periods presented SO42− concentration higher than PV proposed by the EC [35]. Only one groundwater sample collected from W5 in 2019 exceeded the PV for CND established by the EC [35] (Table 6; Figure 3). The pH value in groundwater collected from monitoring station W6 during 2020 is higher than the corresponding PV established by the EC [35].
The spatial distribution of NO3− content in aquifers on Rhodes Island is depicted in Figure 4. The elevated NO3− concentration in groundwater of the study area is directly related to agricultural land use and especially the application of nitrogen fertilizers in cultivated areas (Figure 2 and Figure 4). Many researchers have identified high NO3− concentration in groundwater due to the leaching of fertilizers in many regions worldwide [3,41,42,43,44]. Moreover, NO3− is a common groundwater pollutant that is symptomatic of anthropogenic sources, such as agricultural and domestic sewages [42,44], and elevated concentration of NO3− is typical in aquifers [1,41,45].
The spatial variation of CND value in groundwater monitoring stations of the area studied is presented in Figure 3. The high CND values are recorded mainly in the coastal aquifer systems of Rhodes Island, suggesting a direct link with seawater intrusion in these systems (Figure 3). Furthermore, Chandrajith et al. [46] reported that the mean value of CND in groundwater samples collected in a coastal region of Sri Lanka was 1260 μS cm−1 and served as the first indication of seawater intrusion. According to scientific reports, the Mediterranean basin will be significantly impacted by anticipated climatic crises such as increased air temperatures, precipitation decrease, and rising sea levels [47,48,49]. The surface temperature is expected to rise by 2050 by 2.5 °C, and precipitation will fall by 10.5% [47,48]. Furthermore, existing freshwater in the Mediterranean region has been depleted over the last few decades [47]. Elevated CND values in irrigation water are among the primary threats to the agricultural sector [50,51]. According to the IPCC [52], global warming will cause an increase in sea level, which will, in turn, affect seawater intrusion into coastal aquifers [53,54].
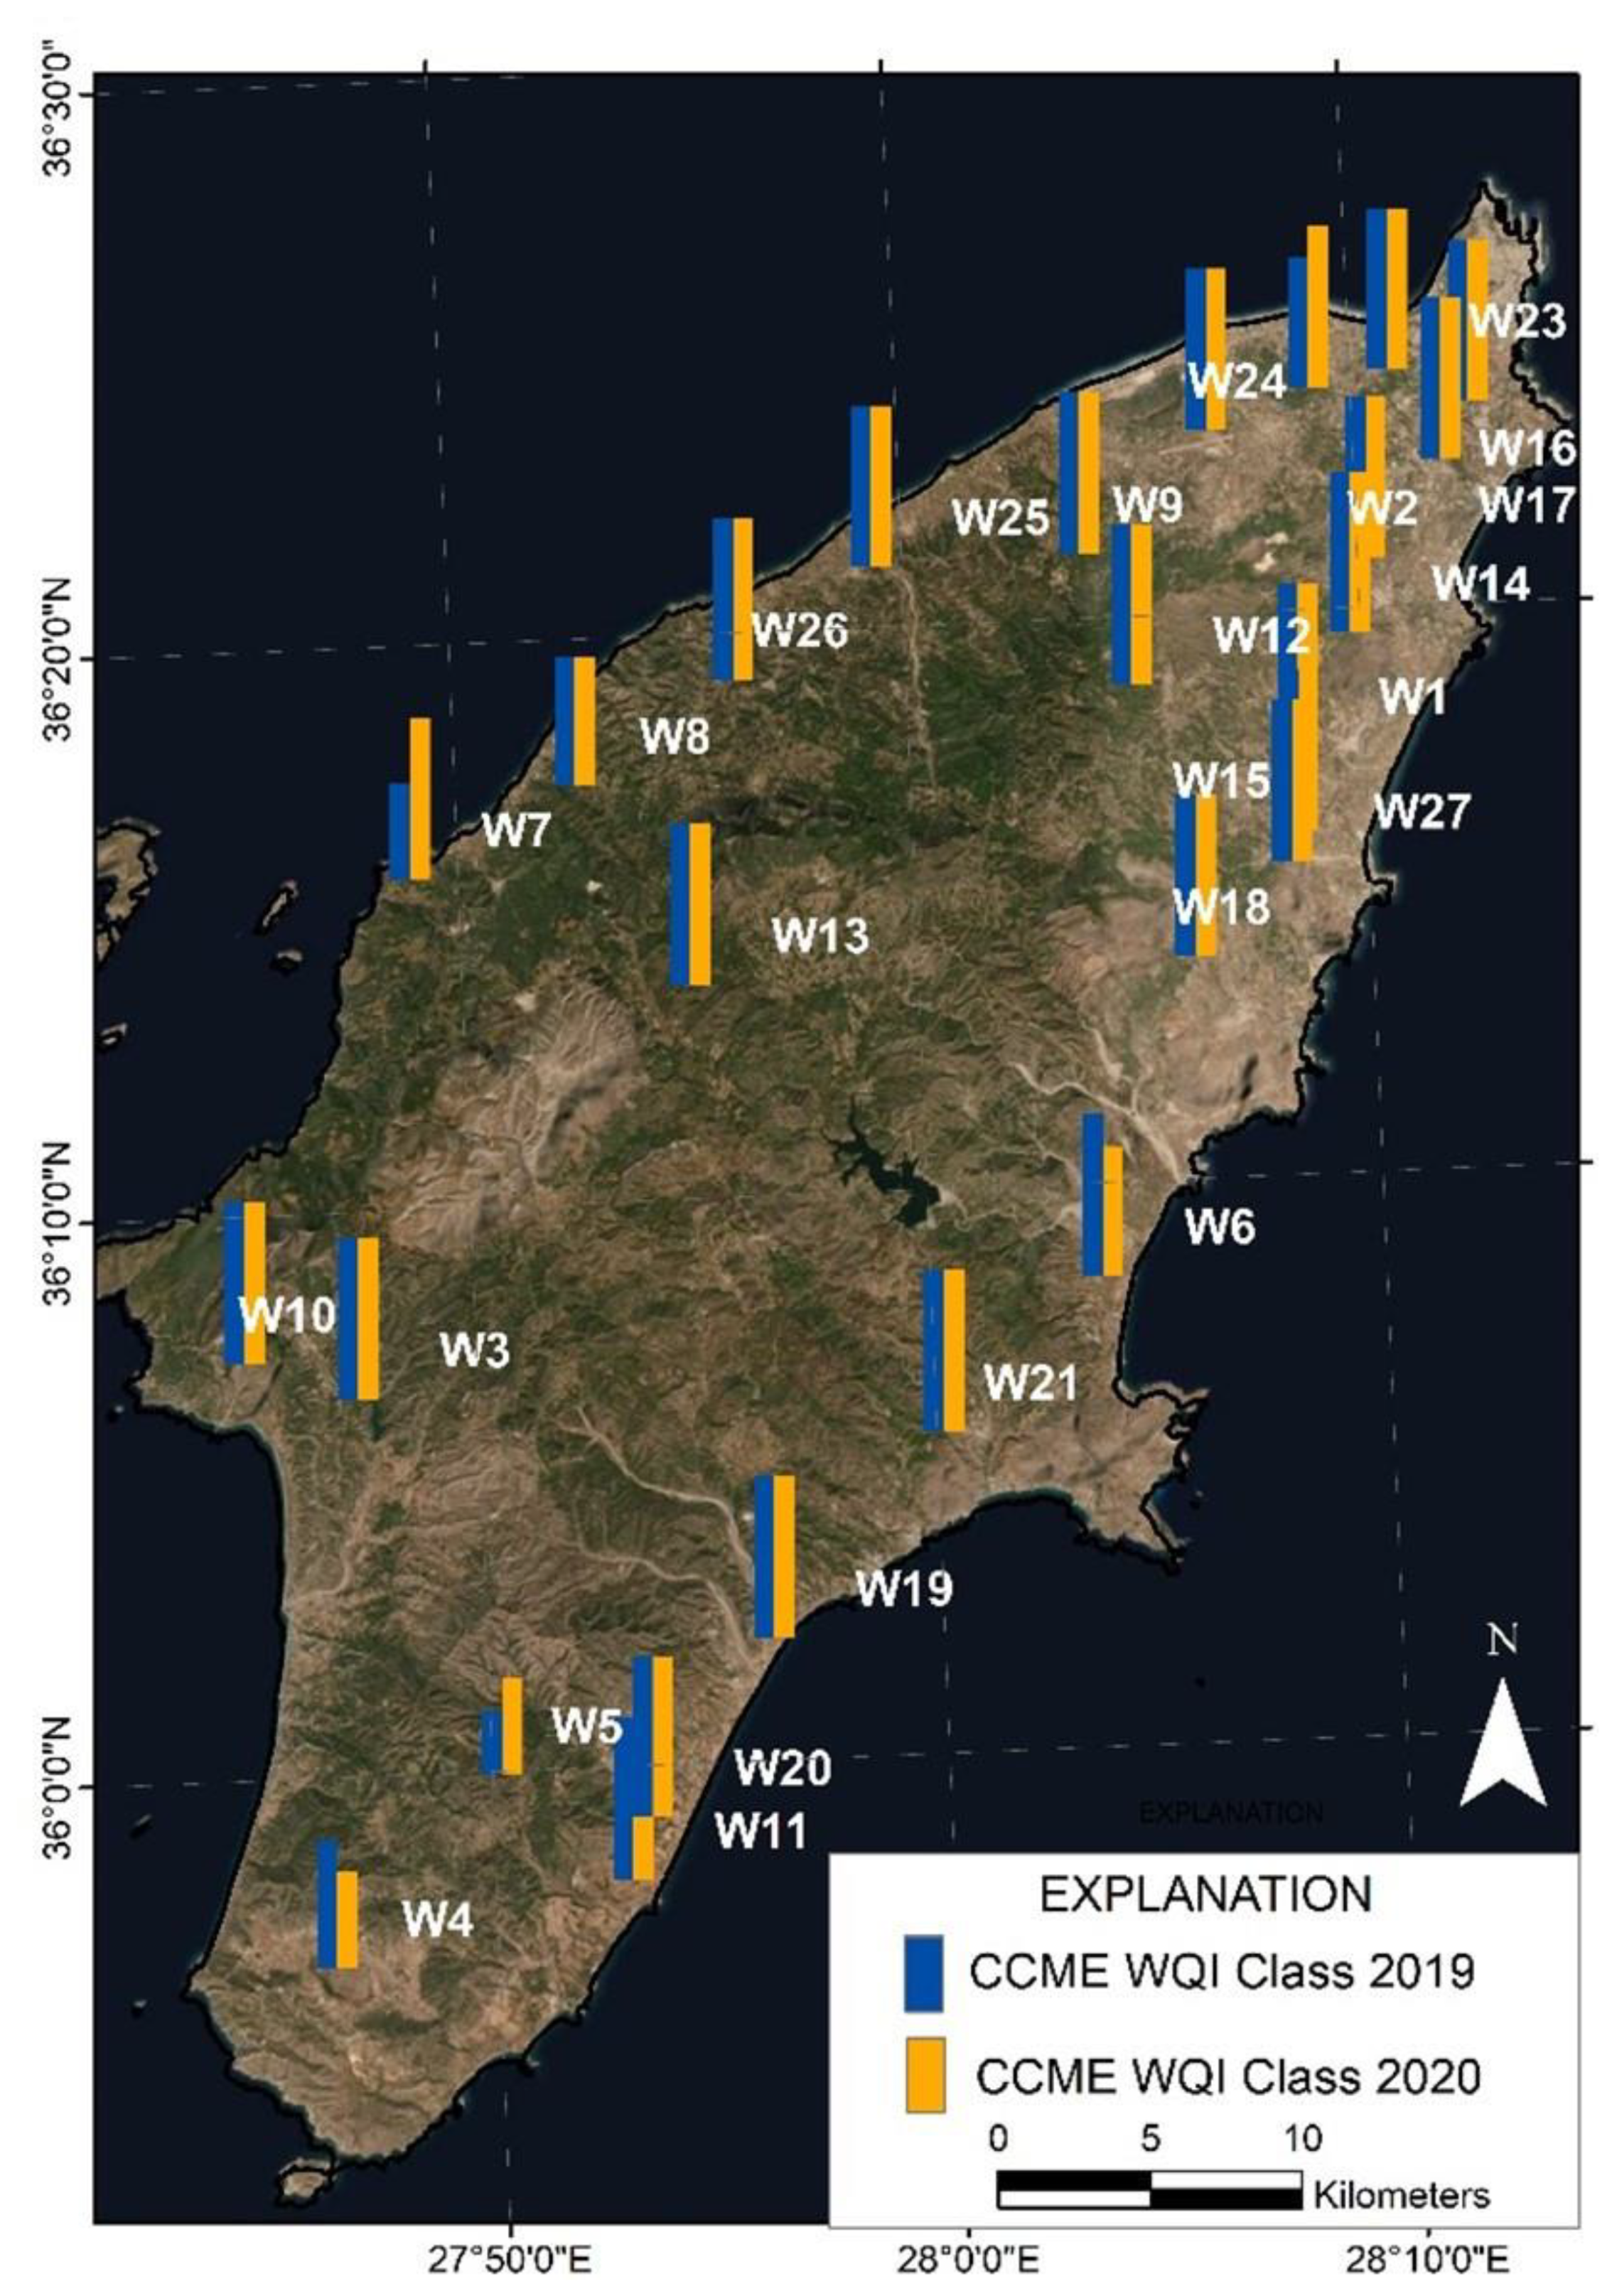
The spatial variation of the quality class in the study area derived by the application of CCME-WQI is illustrated in Figure 5. It is observed that CCME-WQI classifies the majority of monitoring stations, the Rhodes aquifers, into the highest class (Class 5) for both sampling campaigns in 2019 and 2020 (Figure 5). Only three monitoring stations (W4, W5, and W6) show differences in the classification derived by CCME-WQI (Figure 5). CCME-WQI has also been applied in many regions to record the quality status of surface water and groundwater [1,3,55,56,57]. Moreover, Chandrajith et al. [46] also applied WQI as a vulnerability indicator to highlight seawater intrusion in sedimentary aquifers of Sri Lanka.
4. Conclusions
All of the examined parameters in the groundwater of the study area presented mean and median values that are lower than the corresponding parametric values established by Directive 98/83/EC. The high CND values are primarily observed in the coastal aquifer systems on the island of Rhodes, indicating a direct relationship between seawater intrusion and these aquifer systems. CCME-WQI classifies the majority of Rhodes aquifer monitoring stations as belonging to the highest category (Class 5) for both sampling campaigns in 2019 and 2020. The most critical factor which accounts for the greatest proportion of total variance in both water quality datasets includes CND, Cl−, SO42−, and Na+. The contents of CND, Cl−, SO42−, and Na+ in the groundwater of Rhodes Island are mainly attributed to the process of seawater intrusion. The statistical analysis results of this study revealed that the CCME-WQI is primarily controlled by CND, Cl−, SO42−, and Na+. The linking of factor analysis with CCME-WQI is a helpful tool for monitoring the groundwater quality on Rhodes Island. It is important to install and setup a monitoring network to evaluate groundwater deterioration of the aquifers on Rhodes Island applying WQI because it turns the raw data of water quality into information that is coherent and convenient to policy makers, stakeholders, and inhabitants. Since climate crisis is most likely to accelerate the mixing of seawater in coastal aquifers, the monitoring network in the area studied can help to the sustainable management of groundwater resources of Rhodes Island.
Funding
This research received no external funding.
Data Availability Statement
The data used in this study is available to external parties upon request at the Greek Ministry of Environment and Energy: https://ypen.gov.gr/ (accessed on 01 August 2022).
Acknowledgments
The author would like to thank the Greek Ministry of Environment and Energy and Institute of Geology and Mineral Exploration, Greece, for kindly providing valuable data for this research.
Conflicts of Interest
The author declares no conflict of interest.
References
- Alexakis, D.E. Meta-Evaluation of Water Quality Indices. Application into Groundwater Resources. Water 2020, 12, 1890. [Google Scholar] [CrossRef]
- Alexakis, D.E. Water Quality Indices: Current and Future Trends in Evaluating Contamination of Groundwater Resources. Water 2021, 13, 401. [Google Scholar] [CrossRef]
- Alexakis, D.E. Linking DPSIR Model and Water Quality Indices to Achieve Sustainable Development Goals in Groundwater Resources. Hydrology 2021, 8, 90. [Google Scholar] [CrossRef]
- Alexakis, D.E. The Relationship between the Chemical Composition of Groundwater and the Geological Environment in the East Attiki Area, Greece. Miner. Wealth 1998, 109, 12. [Google Scholar]
- Alexakis, D.; Tsihrintzis, V.A.; Tsakiris, G.; Gikas, G.D. Suitability of Water Quality Indices for Application in Lakes in the Mediterranean. Water Resour. Manag. 2016, 30, 1621–1633. [Google Scholar] [CrossRef]
- Lalumbe, L.; Kanyerere, T. Characterisation of Hydro-Geochemical Processes Influencing Groundwater Quality in Rural Areas: A Case Study of Soutpansberg Region, Limpopo Province, South Africa. Water 2022, 14, 1972. [Google Scholar] [CrossRef]
- Bakalár, T.; Pavolová, H.; Tokarčík, A. Analysis and Model of River Basin Sustainable Management by SWOT and AHP Methods. Water 2021, 13, 2427. [Google Scholar] [CrossRef]
- Feng, J.; Sun, H.; He, M.; Gao, Z.; Liu, J.; Wu, X.; An, Y. Quality Assessments of Shallow Groundwaters for Drinking and Irrigation Purposes: Insights from a Case Study (Jinta Basin, Heihe Drainage Area, Northwest China). Water 2020, 12, 2704. [Google Scholar] [CrossRef]
- Ewaid, S.; Abed, S.; Al-Ansari, N.; Salih, R. Development and Evaluation of a Water Quality Index for the Iraqi Rivers. Hydrology 2020, 7, 67. [Google Scholar] [CrossRef]
- Yu, H.; Yang, Z.; Li, B. Sustainability Assessment of Water Resources in Beijing. Water 2020, 12, 1999. [Google Scholar] [CrossRef]
- Abbasi T, Abbasi SA Water Quality Indices; Elsevier: Amsterdam, The Netherlands, 2012.
- Sun, C.; Wang, S.; Chen, W. Hydrochemical Characteristics and the Relationship between Surface and Groundwater in a Typical ‘Mountain–Oasis’ Ecosystem in Central Asia. Sustainability 2022, 14, 7453. [Google Scholar] [CrossRef]
- Vespasiano, G.; Muto, F.; Apollaro, C. Geochemical, Geological and Groundwater Quality Characterization of a Complex Geological Framework: The Case Study of the Coreca Area (Calabria, South Italy). Geosciences 2021, 11, 121. [Google Scholar] [CrossRef]
- Gevera, P.K.; Cave, M.; Dowling, K.; Gikuma-Njuru, P.; Mouri, H. Naturally Occurring Potentially Harmful Elements in Groundwater in Makueni County, South-Eastern Kenya: Effects on Drinking Water Quality and Agriculture. Geosciences 2020, 10, 62. [Google Scholar] [CrossRef] [Green Version]
- Salem, I.B.; Nazzal, Y.; Howari, F.M.; Sharma, M.; Mogaraju, J.K.; Xavier, C.M. Geospatial Assessment of Groundwater Quality with the Distinctive Portrayal of Heavy Metals in the United Arab Emirates. Water 2022, 14, 879. [Google Scholar] [CrossRef]
- Gotsis, D.; Giakoumakis, S.; Alexakis, D. Drainage Water Use Options for a Regional Irrigation System. Proc. Inst. Civ. Eng. Water Manag. 2015, 168, 29–36. [Google Scholar] [CrossRef]
- Panagopoulos, Y.; Alexakis, D.E.; Skoulikidis, N.T.; Laschou, S.; Papadopoulos, A.; Dimitriou, E. Implementing the CCME Water Quality Index for the Evaluation of the Physicochemical Quality of Greek Rivers. Water 2022, 14, 2738. [Google Scholar] [CrossRef]
- Alqarawy, A.; El Osta, M.; Masoud, M.; Elsayed, S.; Gad, M. Use of Hyperspectral Reflectance and Water Quality Indices to Assess Groundwater Quality for Drinking in Arid Regions, Saudi Arabia. Water 2022, 14, 2311. [Google Scholar] [CrossRef]
- Haider, H.; Alkhowaiter, M.H.; Shafiquzzaman, M.; AlSaleem, S.S.; Almoshaogeh, M.; Alharbi, F. Spatiotemporal Water Quality Variations in Smaller Water Supply Systems: Using Modified CCME WQI from Groundwater Source to Distribution Networks. Water 2019, 11, 1884. [Google Scholar] [CrossRef] [Green Version]
- Molekoa, M.; Avtar, R.; Kumar, P.; Minh, H.; Kurniawan, T. Hydrogeochemical Assessment of Groundwater Quality of Mokopane Area, Limpopo, South Africa Using Statistical Approach. Water 2019, 11, 1891. [Google Scholar] [CrossRef] [Green Version]
- Shafique, T.; Khan, M.A.; Fatima, S.U.; Alamgir, A. Multivariate and Geospatial Monitoring of Water and Soil Quality Impact on Planted Mangroves Growth Pattern at Indus Delta: A Pilot Study. J. Coast. Conserv. 2022, 26, 29. [Google Scholar] [CrossRef]
- Aldrees, A.; Khan, M.A.; Tariq, M.A.U.R.; Mustafa Mohamed, A.; Ng, A.W.M.; Bakheit Taha, A.T. Multi-Expression Programming (MEP): Water Quality Assessment Using Water Quality Indices. Water 2022, 14, 947. [Google Scholar] [CrossRef]
- Uddin, M.G.; Nash, S.; Olbert, A.I. A Review of Water Quality Index Models and Their Use for Assessing Surface Water Quality. Ecol. Indic. 2021, 122, 107218. [Google Scholar] [CrossRef]
- Canadian Council of Ministers of the Environment (CCME). Canadian Water Quality Guidelines for the Protection of Aquatic Life; CCME Water Quality Index 1.0; User’s Manual: Winnipeg, MB, Canada, 2001. [Google Scholar]
- Hellenic Statistical Authority Hellenic Statistical Authority. Demographic Characteristics/2011. Available online: Https://Www.Statistics.Gr/El/Statistics/-/Publication/SAM03/- (accessed on 16 August 2022).
- Civil Aviation Authority. Civil Aviation Authority. Airports Traffic 2021. Available online: Http://Www.Ypa.Gr/En/Profile/Statistics/2021 (accessed on 16 August 2021).
- Peel, M.C.; Finlayson, B.L.; McMahon, T.A. Updated World Map of the Köppen-Geiger Climate Classification. Hydrol. Earth Syst. Sci. 2007, 11, 1633–1644. [Google Scholar] [CrossRef] [Green Version]
- Ministry of Environment and Energy. 1st Update of River Basin Management Plans of the Aegean Islands Water District; Special Secretariat for Water; Ministry of Environment and Energy: Athens, Greece, 2017. (In Greek)
- Institute of Geology and Mineral Exploration (IGME). Hydrogeological Study—Water District of Aegean Islands. In Project: Recording and Evaluation of Hydrogeological Characteristics of Groundwater and Water Systems in the Country; IGME: Athens, Greece, 2010; Volumes 1 and 2. (In Greek) [Google Scholar]
- Google Earth. Greece, World Imagery. Available online: Https://Earth.Google.Com/Web (accessed on 1 August 2022).
- Copernicus. Urban Atlas 2018. Copernicus Land Monitoring Service. 2021. Available online: Https://Land.Copernicus.Eu/Local/Urban-Atlas/Urban-Atlas-2018 (accessed on 7 August 2022).
- Greek Government Greek Government Gazette II 1635 of 9 June 2016. Modification of Article 19 of Annex 19 to Presidential Decree 51/2007 (A’54), as Modified by Article 5 of Law 4117/2013 (A29), in Compliance with Directive 2014/101/EU of the European Council of 30 October 2014. Available online: Www.et.Gr (accessed on 14 August 2022).
- Kaiser, H.F. The Varimax Criterion for Analytic Rotation in Factor Analysis. Psychometrika 1958, 23, 187–200. [Google Scholar] [CrossRef]
- Davis, J.C. Statistics and Data Analysis in Geology, 3rd ed.; Wiley: Hoboken, NJ, USA, 2002. [Google Scholar]
- EC (European Community). Council Directive 98/83/EC Directive of the European Parliament on the Quality of Water Intended for Human Consumption. The European Parliament and the Council of the European Union. Off. J. Eur. Commun. 1998, 330, 32–54. [Google Scholar]
- Suarez, D.L. Impact of Agricultural Practices on Groundwater Salinity. Agric Ecosy Environ 1989, 26, 215–227. [Google Scholar] [CrossRef]
- Foster, S.; Pulido-Bosch, A.; Vallejos, Á.; Molina, L.; Llop, A.; MacDonald, A.M. Impact of Irrigated Agriculture on Groundwater-Recharge Salinity: A Major Sustainability Concern in Semi-Arid Regions. Hydrogeol. J. 2018, 26, 2781–2791. [Google Scholar] [CrossRef] [Green Version]
- Gamvroula, D.; Alexakis, D.; Stamatis, G. Diagnosis of Groundwater Quality and Assessment of Contamination Sources in the Megara Basin (Attica, Greece). Arab. J. Geosci. 2013, 6, 2367–2381. [Google Scholar] [CrossRef]
- Stamatis, G.; Alexakis, D.; Gamvroula, D.; Migiros, G. Groundwater Quality Assessment in Oropos–Kalamos Basin, Attica, Greece. Environ. Earth Sci. 2011, 64, 973–988. [Google Scholar] [CrossRef]
- Vandarakis, D.; Panagiotopoulos, I.P.; Loukaidi, V.; Hatiris, G.-A.; Drakopoulou, P.; Kikaki, A.; Gad, F.-K.; Petrakis, S.; Malliouri, D.I.; Chatzinaki, M.; et al. Assessment of the Coastal Vulnerability to the Ongoing Sea Level Rise for the Exquisite Rhodes Island (SE Aegean Sea, Greece). Water 2021, 13, 2169. [Google Scholar] [CrossRef]
- Veale, N.; Visser, A.; Esser, B.; Singleton, M.; Moran, J. Nitrogen Cycle Dynamics Revealed Through Δ18O-NO3− Analysis in California Groundwater. Geosciences 2019, 9, 95. [Google Scholar] [CrossRef] [Green Version]
- Janardhana Raju, N.; Shukla, U.K.; Ram, P. Hydrogeochemistry for the Assessment of Groundwater Quality in Varanasi: A Fast-Urbanizing Center in Uttar Pradesh, India. Environ. Monit. Assess. 2011, 173, 279–300. [Google Scholar] [CrossRef] [PubMed]
- Yuan, J.; Xu, F.; Deng, G.; Tang, Y.; Li, P. Hydrogeochemistry of Shallow Groundwater in a Karst Aquifer System of Bijie City, Guizhou Province. Water 2017, 9, 625. [Google Scholar] [CrossRef] [Green Version]
- Maas, B.; Peterson, E.W.; Honings, J.; Oberhelman, A.; Oware, P.; Rusthoven, I.; Watson, A. Differentiation of Surface Water and Groundwater in a Karst System Using Anthropogenic Signatures. Geosciences 2019, 9, 148. [Google Scholar] [CrossRef] [Green Version]
- Kovač, Z.; Nakić, Z.; Špoljarić, D.; Stanek, D.; Bačani, A. Estimation of Nitrate Trends in the Groundwater of the Zagreb Aquifer. Geosciences 2018, 8, 159. [Google Scholar] [CrossRef] [Green Version]
- Chandrajith, R.; Bandara, U.G.C.; Diyabalanage, S.; Senaratne, S.; Barth, J.A.C. Application of Water Quality Index as a Vulnerability Indicator to Determine Seawater Intrusion in Unconsolidated Sedimentary Aquifers in a Tropical Coastal Region of Sri Lanka. Groundw. Sustain. Dev. 2022, 19, 100831. [Google Scholar] [CrossRef]
- Al-Jamal, K. Climate Change and Water Desalination in MENA—World Bank Involvement. Desalination Water Treat. 2009, 3, 271–275. [Google Scholar] [CrossRef] [Green Version]
- Fernández-Torquemada, Y.; Gónzalez-Correa, J.M.; Loya, A.; Ferrero, L.M.; Díaz-Valdés, M.; Sánchez-Lizaso, J.L. Dispersion of Brine Discharge from Seawater Reverse Osmosis Desalination Plants. Desalination Water Treat. 2009, 5, 137–145. [Google Scholar] [CrossRef] [Green Version]
- Alexakis, D.; Tsakiris, G. Drought Impacts on Karstic Spring Annual Water Potential. Application on Almyros (Crete) Brackish Spring. Desalination Water Treat. 2010, 16, 229–237. [Google Scholar] [CrossRef] [Green Version]
- Hussain, H.A.; Men, S.; Hussain, S.; Chen, Y.; Ali, S.; Zhang, S.; Zhang, K.; Li, Y.; Xu, Q.; Liao, C.; et al. Interactive Effects of Drought and Heat Stresses on Morpho-Physiological Attributes, Yield, Nutrient Uptake and Oxidative Status in Maize Hybrids. Sci. Rep. 2019, 9, 3890. [Google Scholar] [CrossRef] [Green Version]
- Dhankher, O.P.; Foyer, C.H. Climate Resilient Crops for Improving Global Food Security and Safety: Climate Resilient Crops for Improving Global Food Security and Safety. Plant Cell Environ. 2018, 41, 877–884. [Google Scholar] [CrossRef] [PubMed]
- IPCC. IPCC 2014 Climate Change 2014: Synthesis Report. Contribution of Working Groups I, II and III to the Fifth Assessment Report of the Intergovernmental Panel on Climate Change; Pachauri, R.K., Meyer, L.A., Eds.; IPCC: Geneva, Switzerland, 2014; 151p. [Google Scholar]
- Mazi, K.; Koussis, A.D.; Destouni, G. Tipping Points for Seawater Intrusion in Coastal Aquifers under Rising Sea Level. Environ. Res. Lett. 2013, 8, 014001. [Google Scholar] [CrossRef]
- Werner, A.D.; Simmons, C.T. Impact of Sea-Level Rise on Sea Water Intrusion in Coastal Aquifers. Ground Water 2009, 47, 197–204. [Google Scholar] [CrossRef]
- Gyamfi, C.; Boakye, R.; Awuah, E.; Anyemedu, F. Application of the Ccme-Wqi Model in Assessing the Water Quality of the Aboabo River, Kumasi-Ghana. J. Sustain. Dev. 2013, 6, p1. [Google Scholar] [CrossRef] [Green Version]
- Finotti, A.R.; Finkler, R.; Susin, N.; Schneider, V.E. Use of Water Quality Index as a Tool for Urban Water Resources Management. Int. J. Sustain. Dev. Plan. 2015, 10, 781–794. [Google Scholar] [CrossRef]
- Al-Saffawi, A.-A. Application of the CCME WQI to Evaluate Water Quality for Drinking Purpose: A Case Study for Groundwater Quality of Al-Mahalibiyah SubDistrict, Nineveh Province/Iraq. Rafidain J. Sci. 2018, 27, 193–202. [Google Scholar] [CrossRef]
Figure 2.
Map showing study area and groundwater monitoring sites compared with land use (modified from [31]).
Figure 2.
Map showing study area and groundwater monitoring sites compared with land use (modified from [31]).
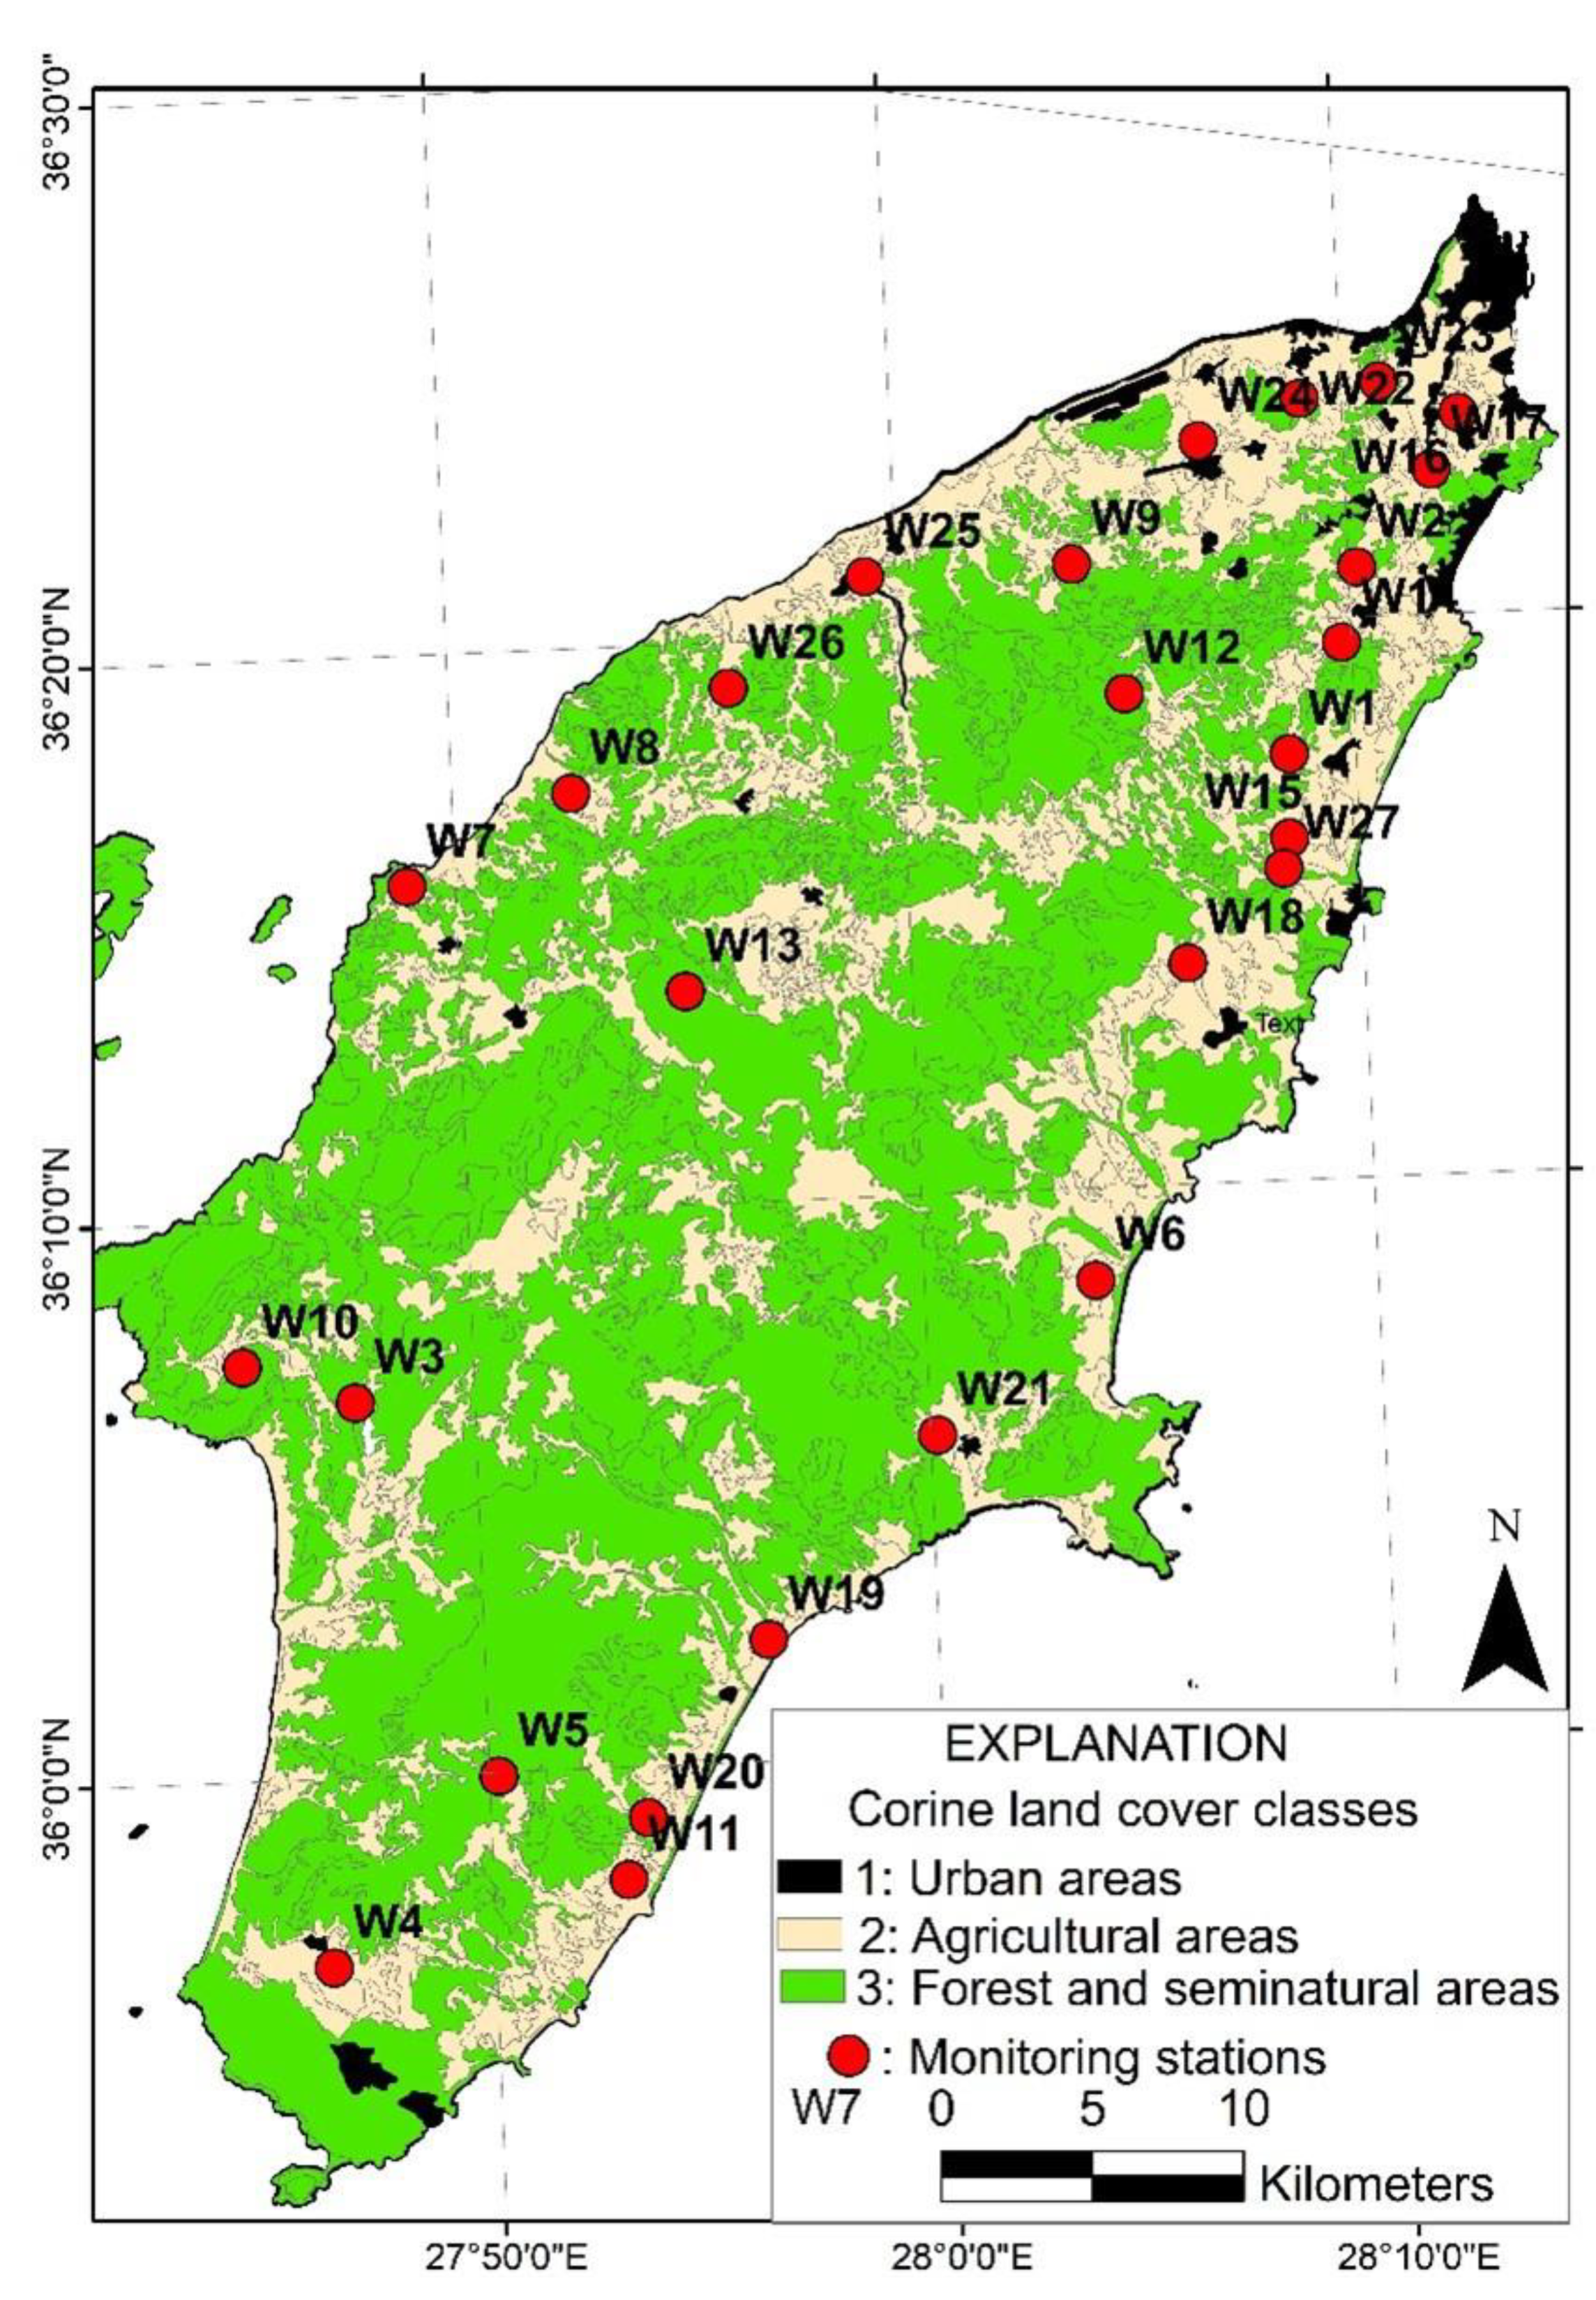
Figure 3.
Map showing Electrical Conductivity values in monitoring stations of aquifers on Rhodes Island for: (a) 2019 and (b) 2020 (modified from [30]).
Figure 3.
Map showing Electrical Conductivity values in monitoring stations of aquifers on Rhodes Island for: (a) 2019 and (b) 2020 (modified from [30]).
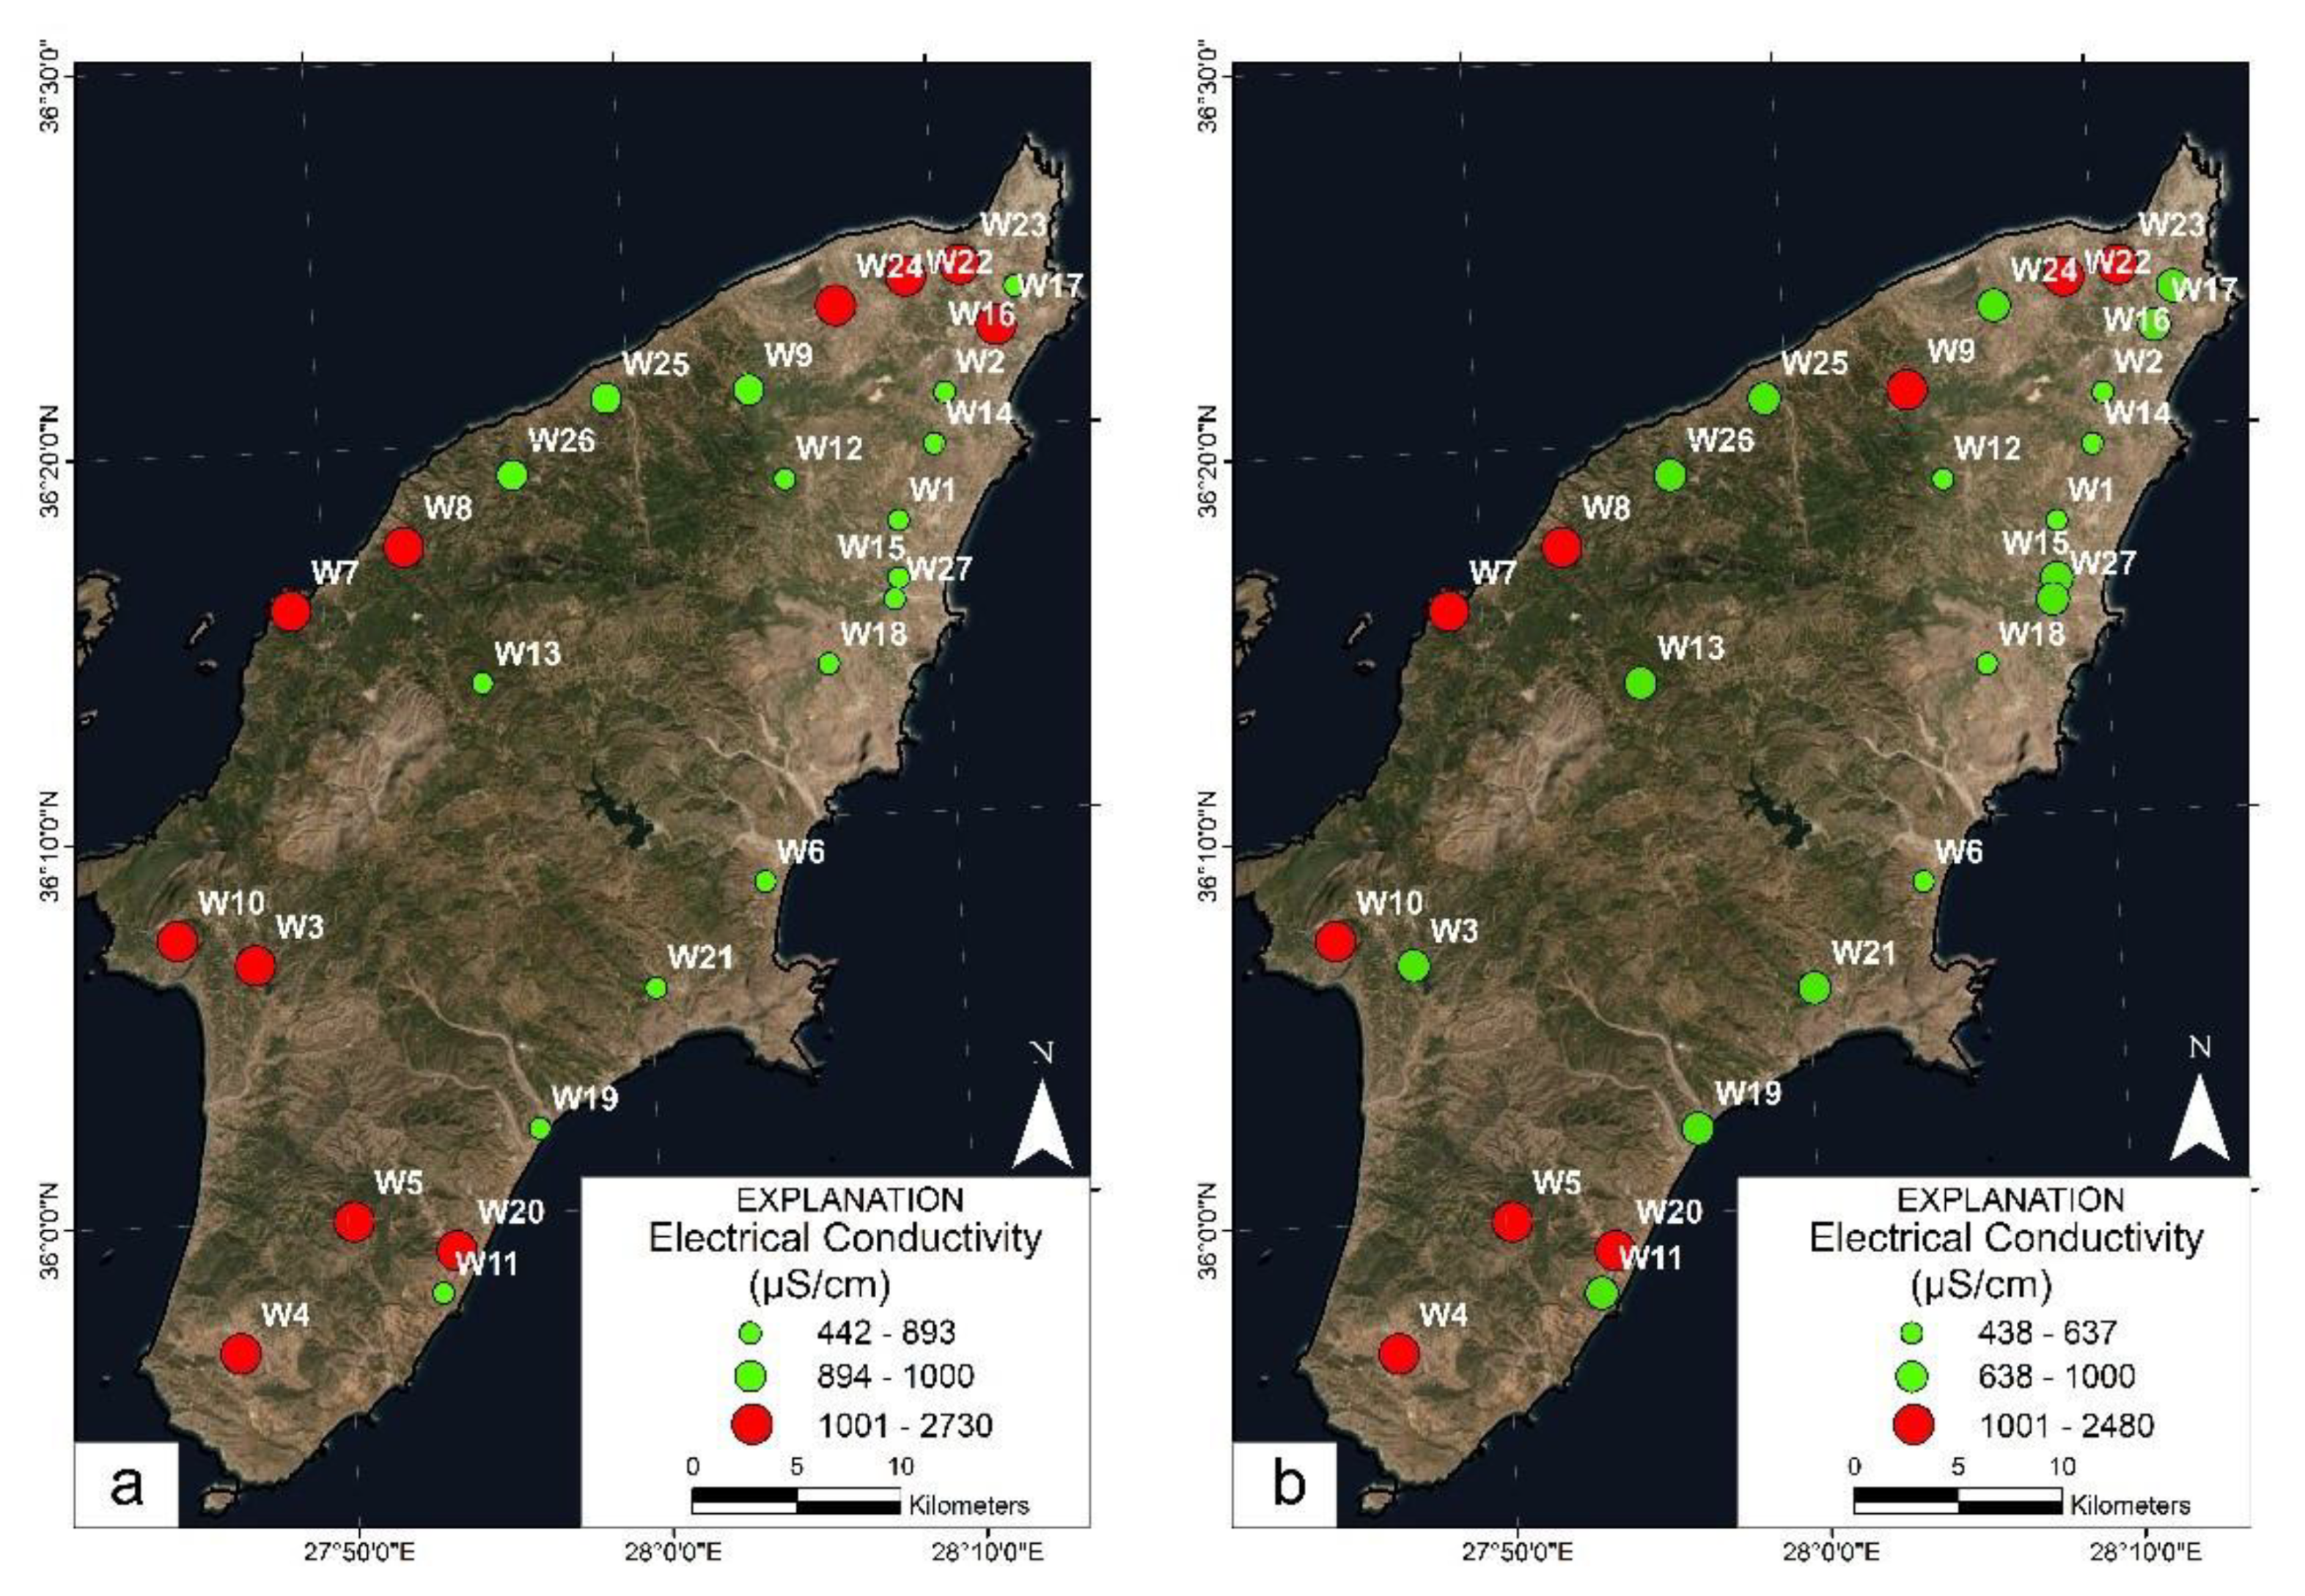
Figure 4.
Map showing Nitrate contents in groundwater monitoring stations of Rhodes Island for: (a) 2019, and (b) 2020 (modified from [30]).
Figure 4.
Map showing Nitrate contents in groundwater monitoring stations of Rhodes Island for: (a) 2019, and (b) 2020 (modified from [30]).
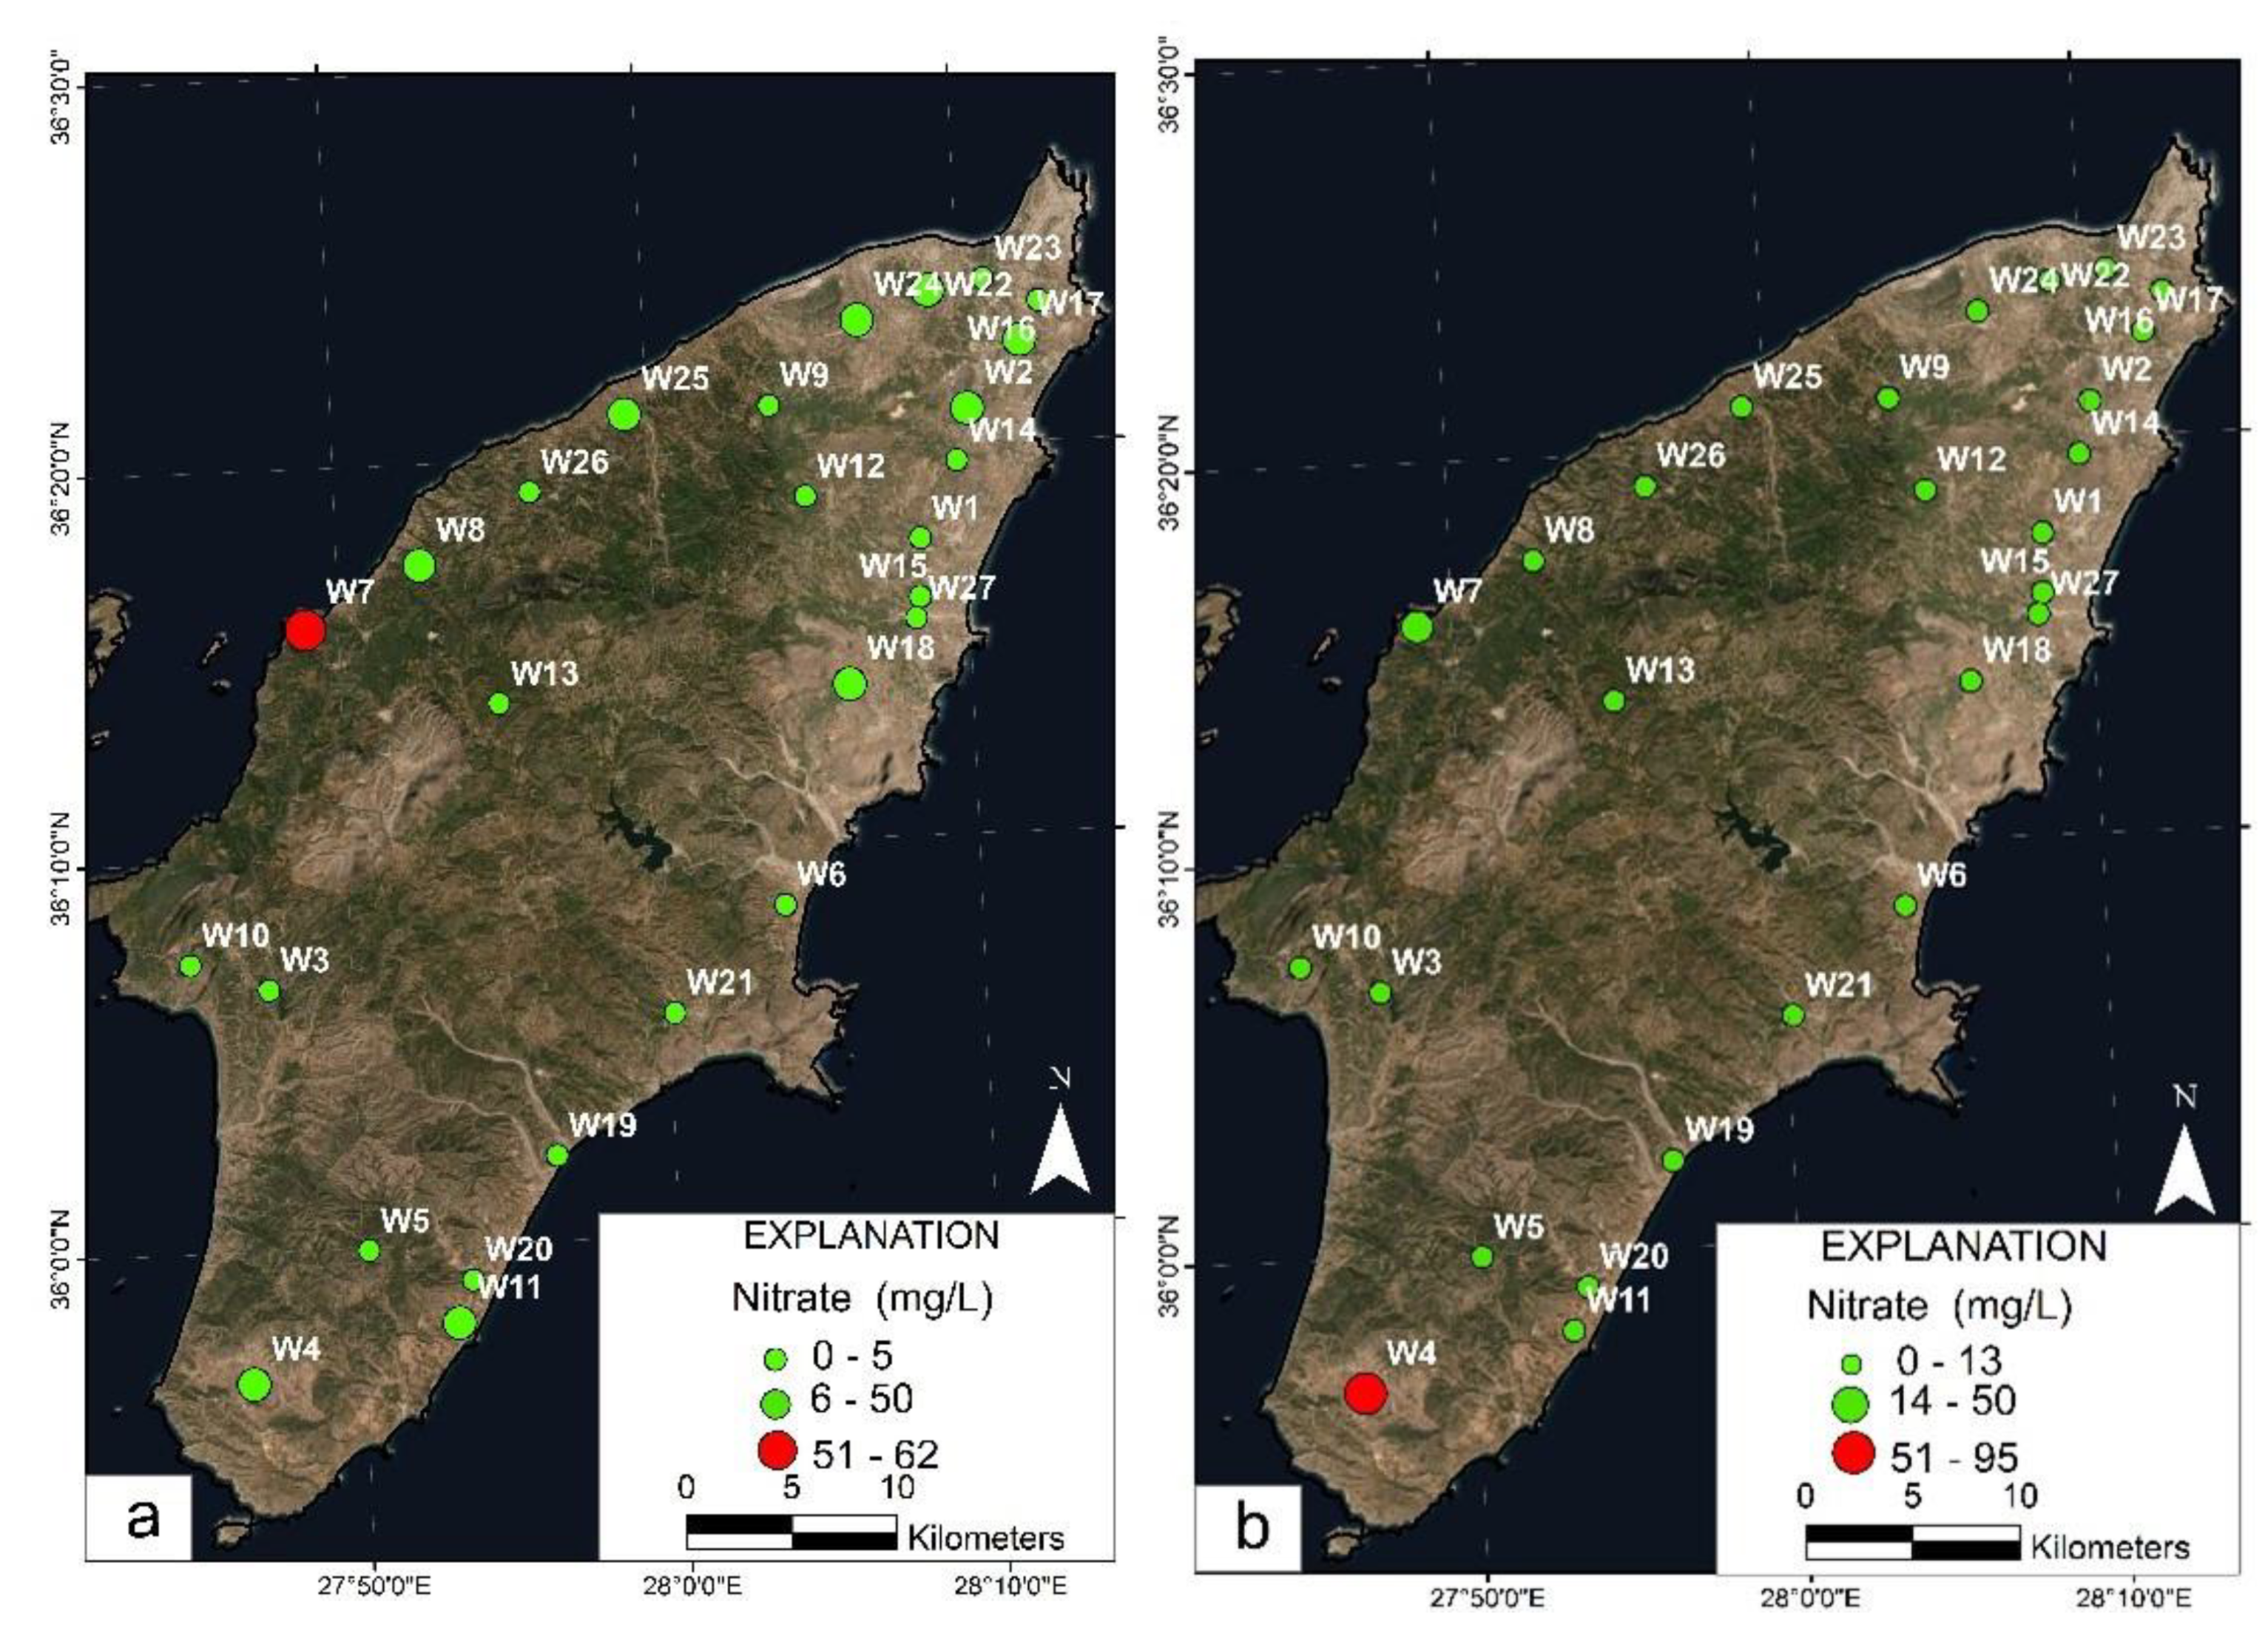
Figure 5.
Spatial distribution of CCME-WQI classes in groundwater monitoring stations of the study area (modified from [30]).
Figure 5.
Spatial distribution of CCME-WQI classes in groundwater monitoring stations of the study area (modified from [30]).

Table 1.
Monitoring stations, aquifer systems and water use on Rhodes Island.
| Location Number (as Shown in Figure 1b) | Aquifer System | Aquifer Code | Use |
|---|---|---|---|
| W1 | North Rhodes Island B granular aquifer | EL1400512 | Drinking |
| W2 | North Rhodes Island A granular aquifer | EL1400511 | Drinking |
| W3 | Apolakkia granular aquifer | EL1400570 | Drinking |
| W4 | Genadi granular aquifer | EL1400580 | Drinking |
| W5 | Genadi granular aquifer | EL1400580 | Drinking |
| W6 | Kalathos-Gadouras granular aquifer | EL1400540 | Drinking |
| W7 | Central granular aquifer | EL1400550 | Irrigation |
| W8 | North Rhodes Island A granular aquifer | EL1400511 | Irrigation |
| W9 | North Rhodes Island A granular aquifer | EL1400511 | Irrigation |
| W10 | Central granular aquifer | EL1400550 | Drinking |
| W11 | Genadi granular aquifer | EL1400580 | Drinking |
| W12 | North Rhodes Island A granular aquifer | EL1400511 | Drinking |
| W13 | Central granular aquifer | EL1400550 | Drinking |
| W14 | North Rhodes Island B granular aquifer | EL1400512 | Drinking |
| W15 | North Rhodes Island B granular aquifer | EL1400512 | Drinking |
| W16 | North Rhodes Island A granular aquifer | EL1400511 | Drinking |
| W17 | North Rhodes Island A granular aquifer | EL1400511 | Drinking |
| W18 | Seven springs karst aquifer | EL1400530 | Drinking |
| W19 | Genadi granular aquifer | EL1400580 | Drinking |
| W20 | Genadi granular aquifer | EL1400580 | Drinking |
| W21 | Central granular aquifer | EL1400550 | Drinking |
| W22 | North Rhodes Island A granular aquifer | EL1400511 | Drinking |
| W23 | North Rhodes Island A granular aquifer | EL1400511 | Drinking |
| W24 | North Rhodes Island A granular aquifer | EL1400511 | Drinking |
| W25 | North Rhodes Island A granular aquifer | EL1400511 | Drinking |
| W26 | North Rhodes Island A granular aquifer | EL1400511 | Drinking |
| W27 | North Rhodes Island B granular aquifer | EL1400512 | Drinking |
Table 2.
CCME-WQI classes, boundaries, and description of water quality [24].
Table 2.
CCME-WQI classes, boundaries, and description of water quality [24].
| Class | Rating | Boundaries | Description of Water Quality |
|---|---|---|---|
| 5 | Excellent | 95–100 | Water quality is preserved with a virtual absence of threat; conditions very close to pristine levels. |
| 4 | Good | 80–94 | Water quality is preserved with only a minor degree of threat; conditions rarely depart from desirable levels. |
| 3 | Fair | 65–79 | Water quality is usually preserved but occasionally threatened; conditions sometimes depart from desirable levels. |
| 2 | Marginal | 45–64 | Water quality is frequently threatened; conditions often depart from desirable levels. |
| 1 | Poor | 0–44 | Water quality is almost always threatened; conditions usually depart from desirable levels. |
Table 3.
Parameters and objective values used to classify groundwater quality on Rhodes Island.
| Units | Objective Values [35] | |
|---|---|---|
| pH | - | 6.5–9.0 |
| Cl− | mg L−1 | 250 |
| CND | μS cm−1 | 2500 |
| Na+ | mg L−1 | 200 |
| NH4+ | mg L−1 | 0.5 |
| NO3− | mg L−1 | 50 |
| NO2− | mg L−1 | 0.5 |
| SO42− | mg L−1 | 250 |
Table 4.
Varimax rotated component loadings and variance explained for water quality parameters of aquifers on Rhodes Island (sampling campaign 2019).
Table 4.
Varimax rotated component loadings and variance explained for water quality parameters of aquifers on Rhodes Island (sampling campaign 2019).
| Factor 1 | Factor 2 | Factor 3 | |
|---|---|---|---|
| pH | −0.133 | 0.706 | −0.558 |
| CND | 0.940 | 0.003 | 0.258 |
| Cl− | 0.875 | 0.062 | 0.400 |
| NO3− | 0.190 | 0.070 | 0.945 |
| NO2− | −0.062 | 0.786 | 0.100 |
| NH4+ | −0.042 | −0.680 | −0.024 |
| SO42− | 0.949 | −0.105 | 0.002 |
| Na+ | 0.965 | −0.019 | −0.123 |
| CCME-WQI | −0.913 | 0.068 | −0.239 |
| Total variance explained (%) | 48.6 | 17.8 | 16.8 |
Table 5.
Varimax rotated component loadings and variance explained for water quality parameters of aquifers on Rhodes Island (sampling campaign 2020).
Table 5.
Varimax rotated component loadings and variance explained for water quality parameters of aquifers on Rhodes Island (sampling campaign 2020).
| Factor 1 | Factor 2 | Factor 3 | |
|---|---|---|---|
| pH | −0.011 | −0.205 | 0.576 |
| CND | 0.846 | 0.284 | 0.068 |
| Cl− | 0.777 | 0.506 | −0.185 |
| NO3− | 0.079 | 0.950 | −0.028 |
| NO2− | −0.123 | −0.059 | −0.592 |
| NH4+ | −0.181 | 0.066 | 0.718 |
| SO42− | 0.856 | −0.180 | 0.202 |
| Na+ | 0.530 | −0.061 | −0.218 |
| CCME-WQI | −0.711 | −0.483 | −0.044 |
| Total variance explained (%) | 32.1 | 17.3 | 14.7 |
Table 6.
Water quality parameters determined in groundwater samples (n = 27) gathered from monitoring stations located on Rhodes Island (PV: Parametric Value [35]).
Table 6.
Water quality parameters determined in groundwater samples (n = 27) gathered from monitoring stations located on Rhodes Island (PV: Parametric Value [35]).
| Units | Min | Mean | Median | Max | Min | Mean | Median | Max | PV | |
|---|---|---|---|---|---|---|---|---|---|---|
| 2019 | 2020 | |||||||||
| pH | - | 7.9 | 8.2 | 8.2 | 8.9 | 7.8 | 8.3 | 8.3 | 9.6 | 6.5–9.5 |
| Ca2+ | mg L−1 | 9 | 50 | 46 | 145 | 4 | 45 | 43 | 92 | - |
| Cl− | mg L−1 | 22 | 109 | 73 | 387 | 23 | 98 | 70 | 344 | 250 |
| CND | μS cm−1 | 442 | 1024 | 923 | 2730 | 438 | 968 | 916 | 2480 | 2500 |
| CO32− | mg L−1 | 0 | 3 | 2 | 21 | 0 | 3 | 2 | 20 | - |
| HCO3− | mg L−1 | 229 | 384 | 374 | 541 | 150 | 365 | 342 | 621 | - |
| K+ | mg L−1 | 1 | 5 | 3 | 19 | 1 | 4 | 3 | 15 | - |
| Mg2+ | mg L−1 | 16 | 52 | 48 | 94 | 16 | 54 | 49 | 123 | - |
| Na+ | mg L−1 | 13 | 95 | 55 | 529 | 14 | 81 | 51 | 452 | 200 |
| NO3− | mg L−1 | 0 | 8 | 4 | 62 | 0 | 8 | 4 | 95 | 50 |
| NO2− | mg L−1 | 0.0 | 0.0 | 0.0 | 0.0 | 0.0 | 0.0 | 0.0 | 0.1 | 0.5 |
| NH4+ | mg L−1 | 0.0 | 0.0 | 0.0 | 0.5 | 0.0 | 0.0 | 0.0 | 0.1 | 0.5 |
| PO43− | mg L−1 | 0.0 | 0.0 | 0.0 | 0.2 | 0.0 | 0.0 | 0.0 | 0.2 | - |
| SO42− | mg L−1 | 8 | 74 | 60 | 499 | 7 | 74 | 61 | 376 | 250 |
Publisher’s Note: MDPI stays neutral with regard to jurisdictional claims in published maps and institutional affiliations. |
© 2022 by the author. Licensee MDPI, Basel, Switzerland. This article is an open access article distributed under the terms and conditions of the Creative Commons Attribution (CC BY) license (https://creativecommons.org/licenses/by/4.0/).
Share and Cite
MDPI and ACS Style
Alexakis, D.E. Applying Factor Analysis and the CCME Water Quality Index for Assessing Groundwater Quality of an Aegean Island (Rhodes, Greece). Geosciences 2022, 12, 384. https://doi.org/10.3390/geosciences12100384
AMA Style
Alexakis DE. Applying Factor Analysis and the CCME Water Quality Index for Assessing Groundwater Quality of an Aegean Island (Rhodes, Greece). Geosciences. 2022; 12(10):384. https://doi.org/10.3390/geosciences12100384
Chicago/Turabian StyleAlexakis, Dimitrios E. 2022. "Applying Factor Analysis and the CCME Water Quality Index for Assessing Groundwater Quality of an Aegean Island (Rhodes, Greece)" Geosciences 12, no. 10: 384. https://doi.org/10.3390/geosciences12100384
Note that from the first issue of 2016, this journal uses article numbers instead of page numbers. See further details here.