

Comparing the Accuracy of sUAS Navigation, Image Co-Registration and CNN-Based Damage Detection between Traditional and Repeat Station Imaging

Abstract
:1. Introduction
2. Background
3. Methods
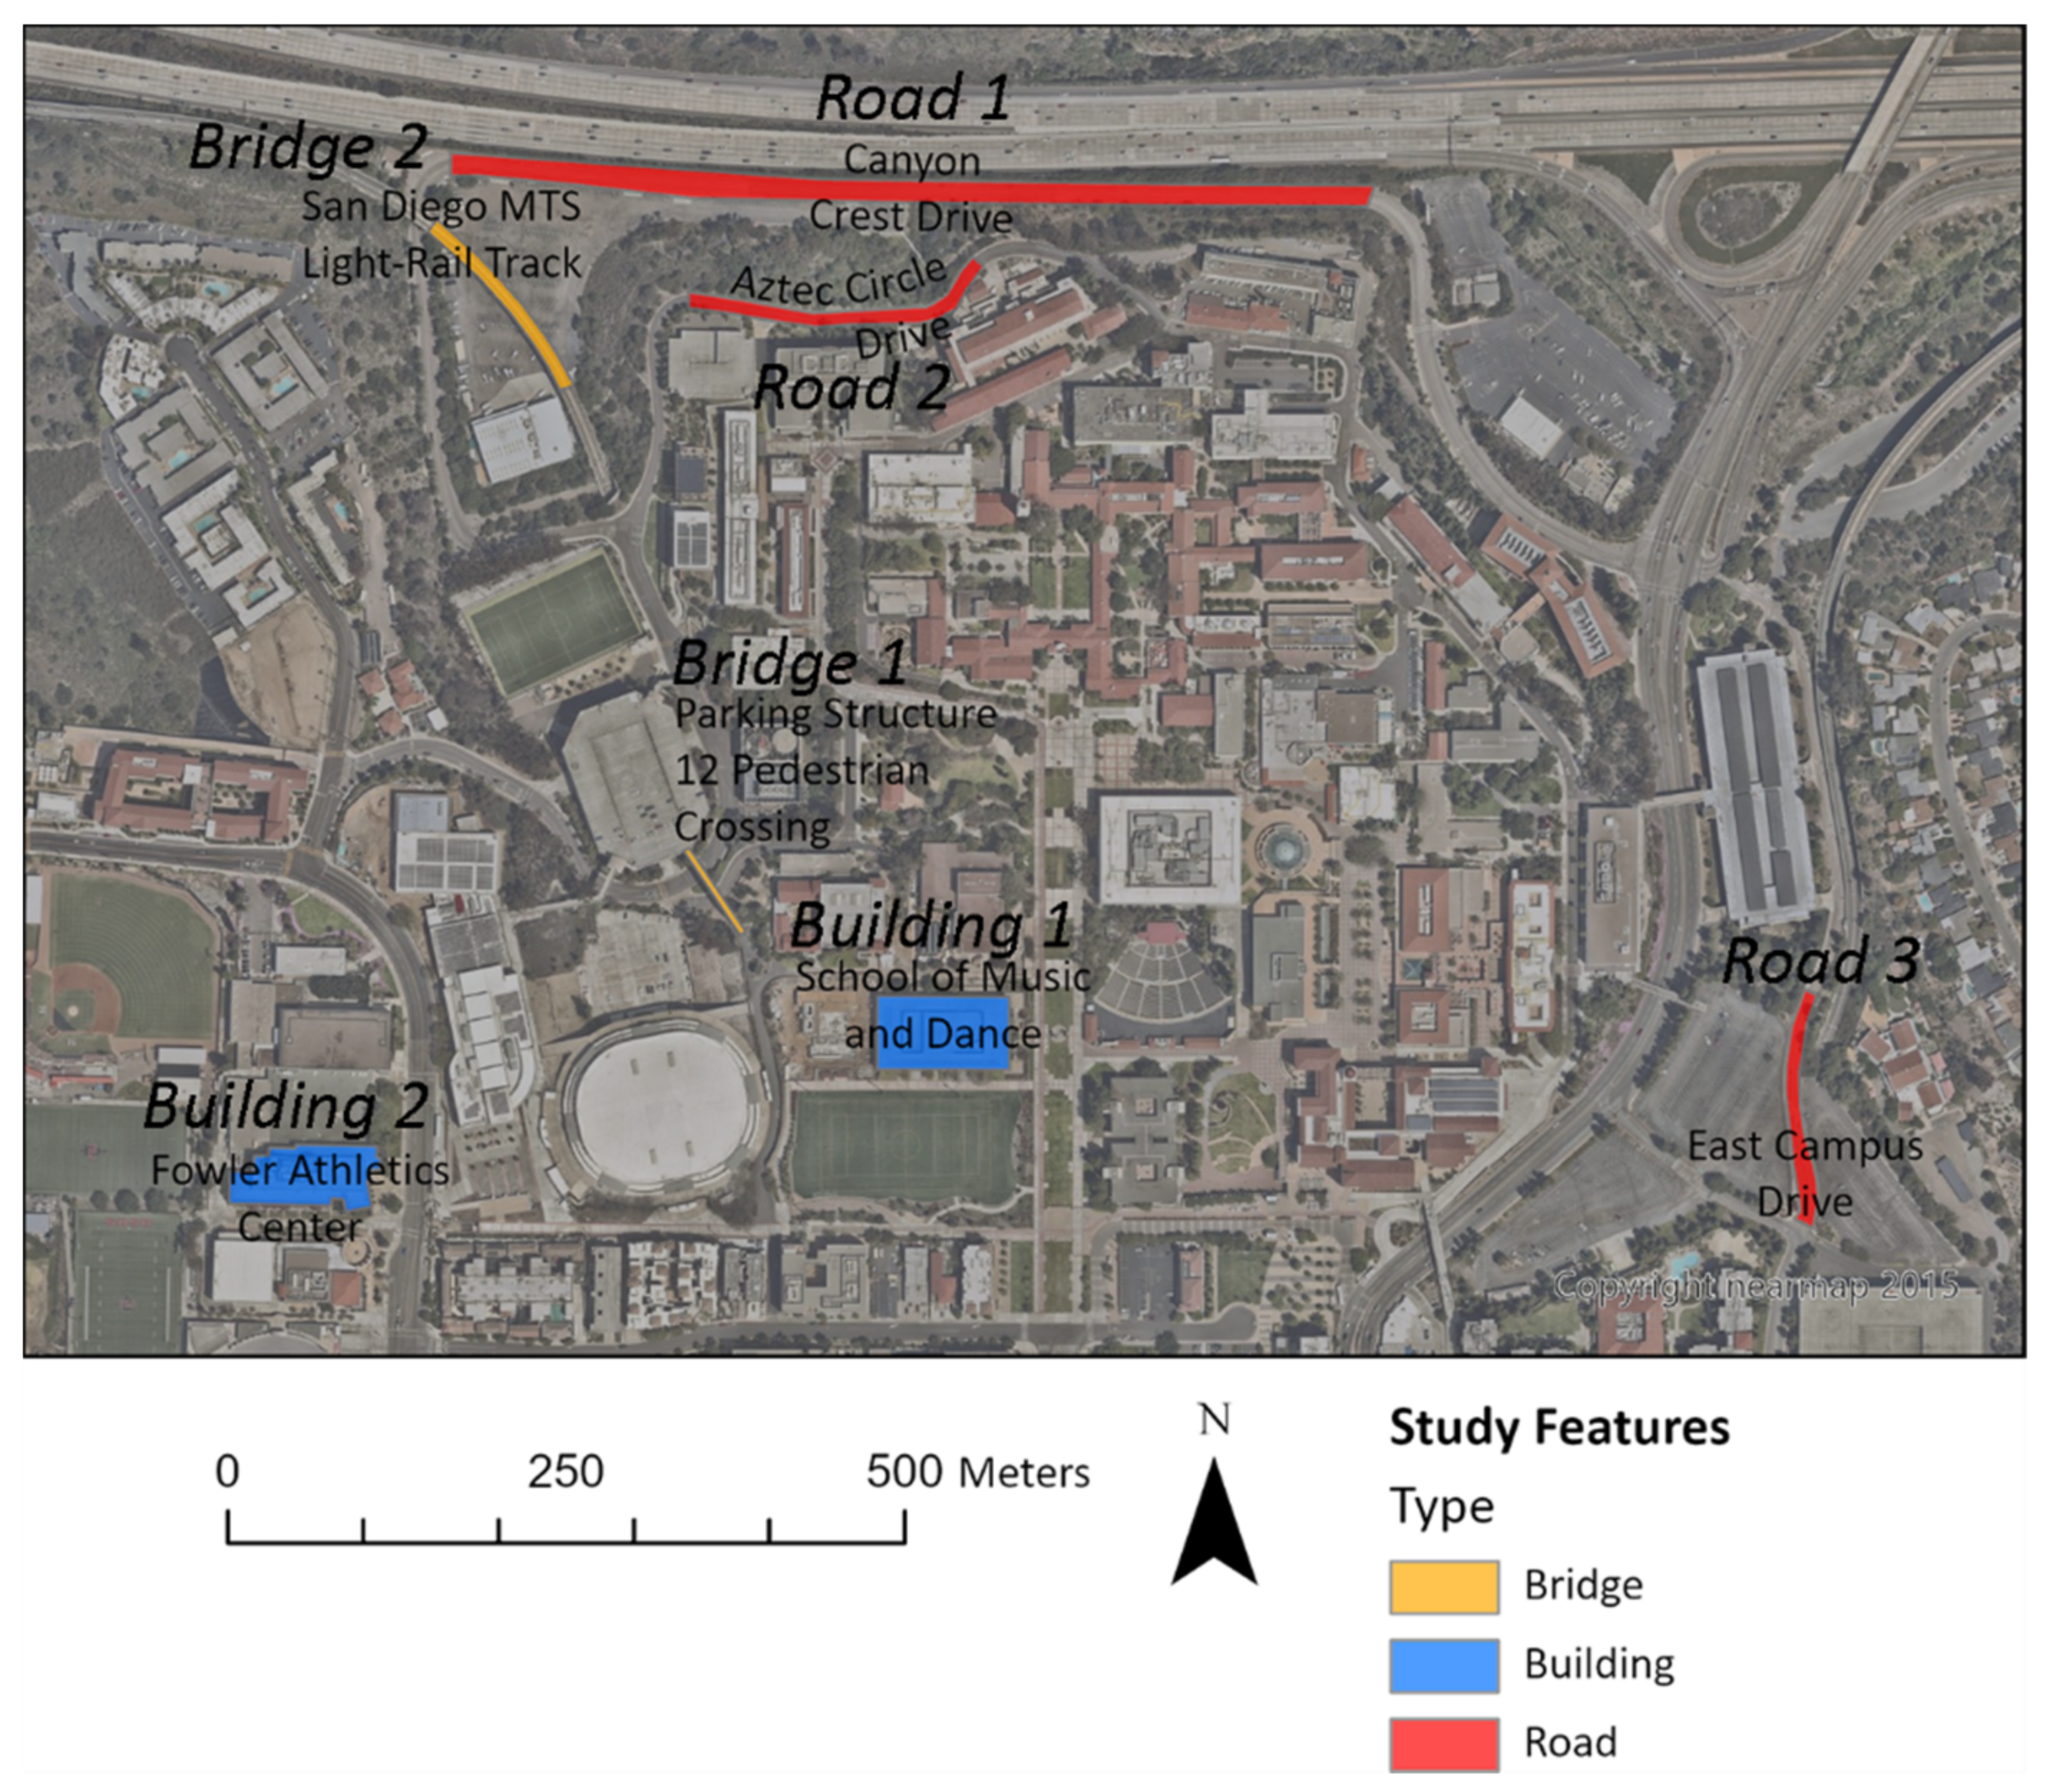
3.1. Study Area
3.2. General Approach
3.2.1. Data Acquisition
3.2.2. Software Development
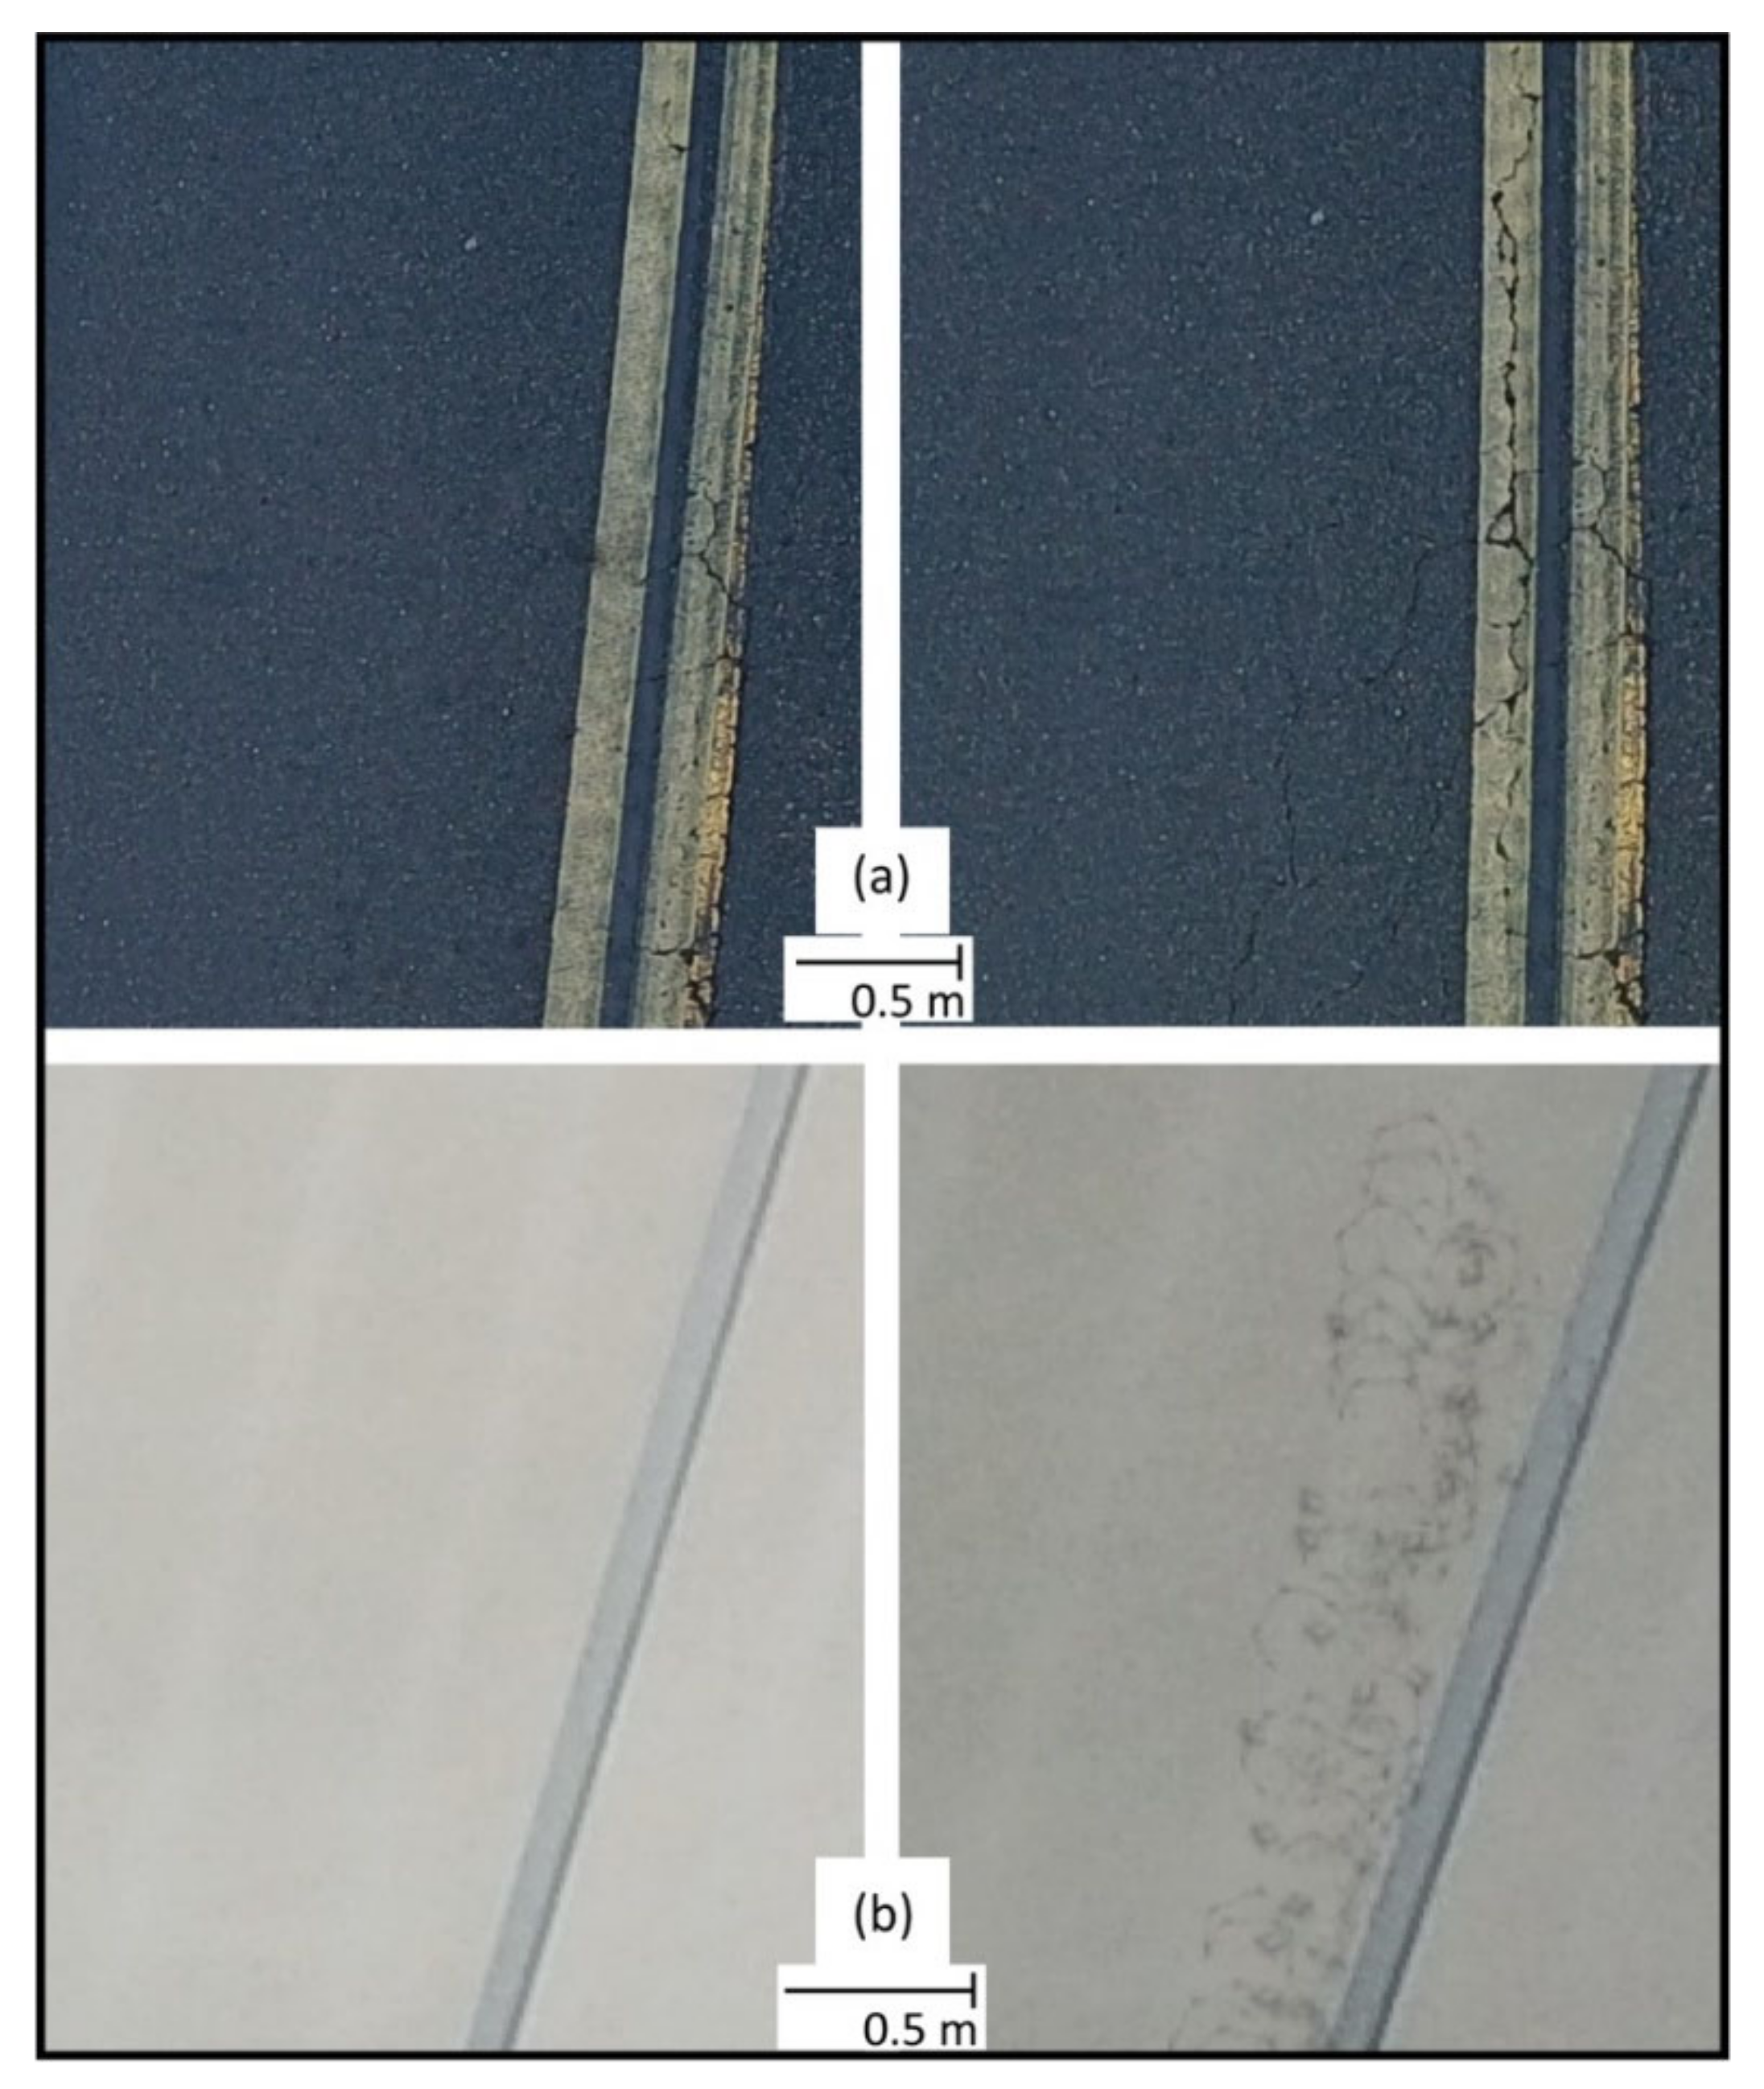
3.2.3. Damage Simulation
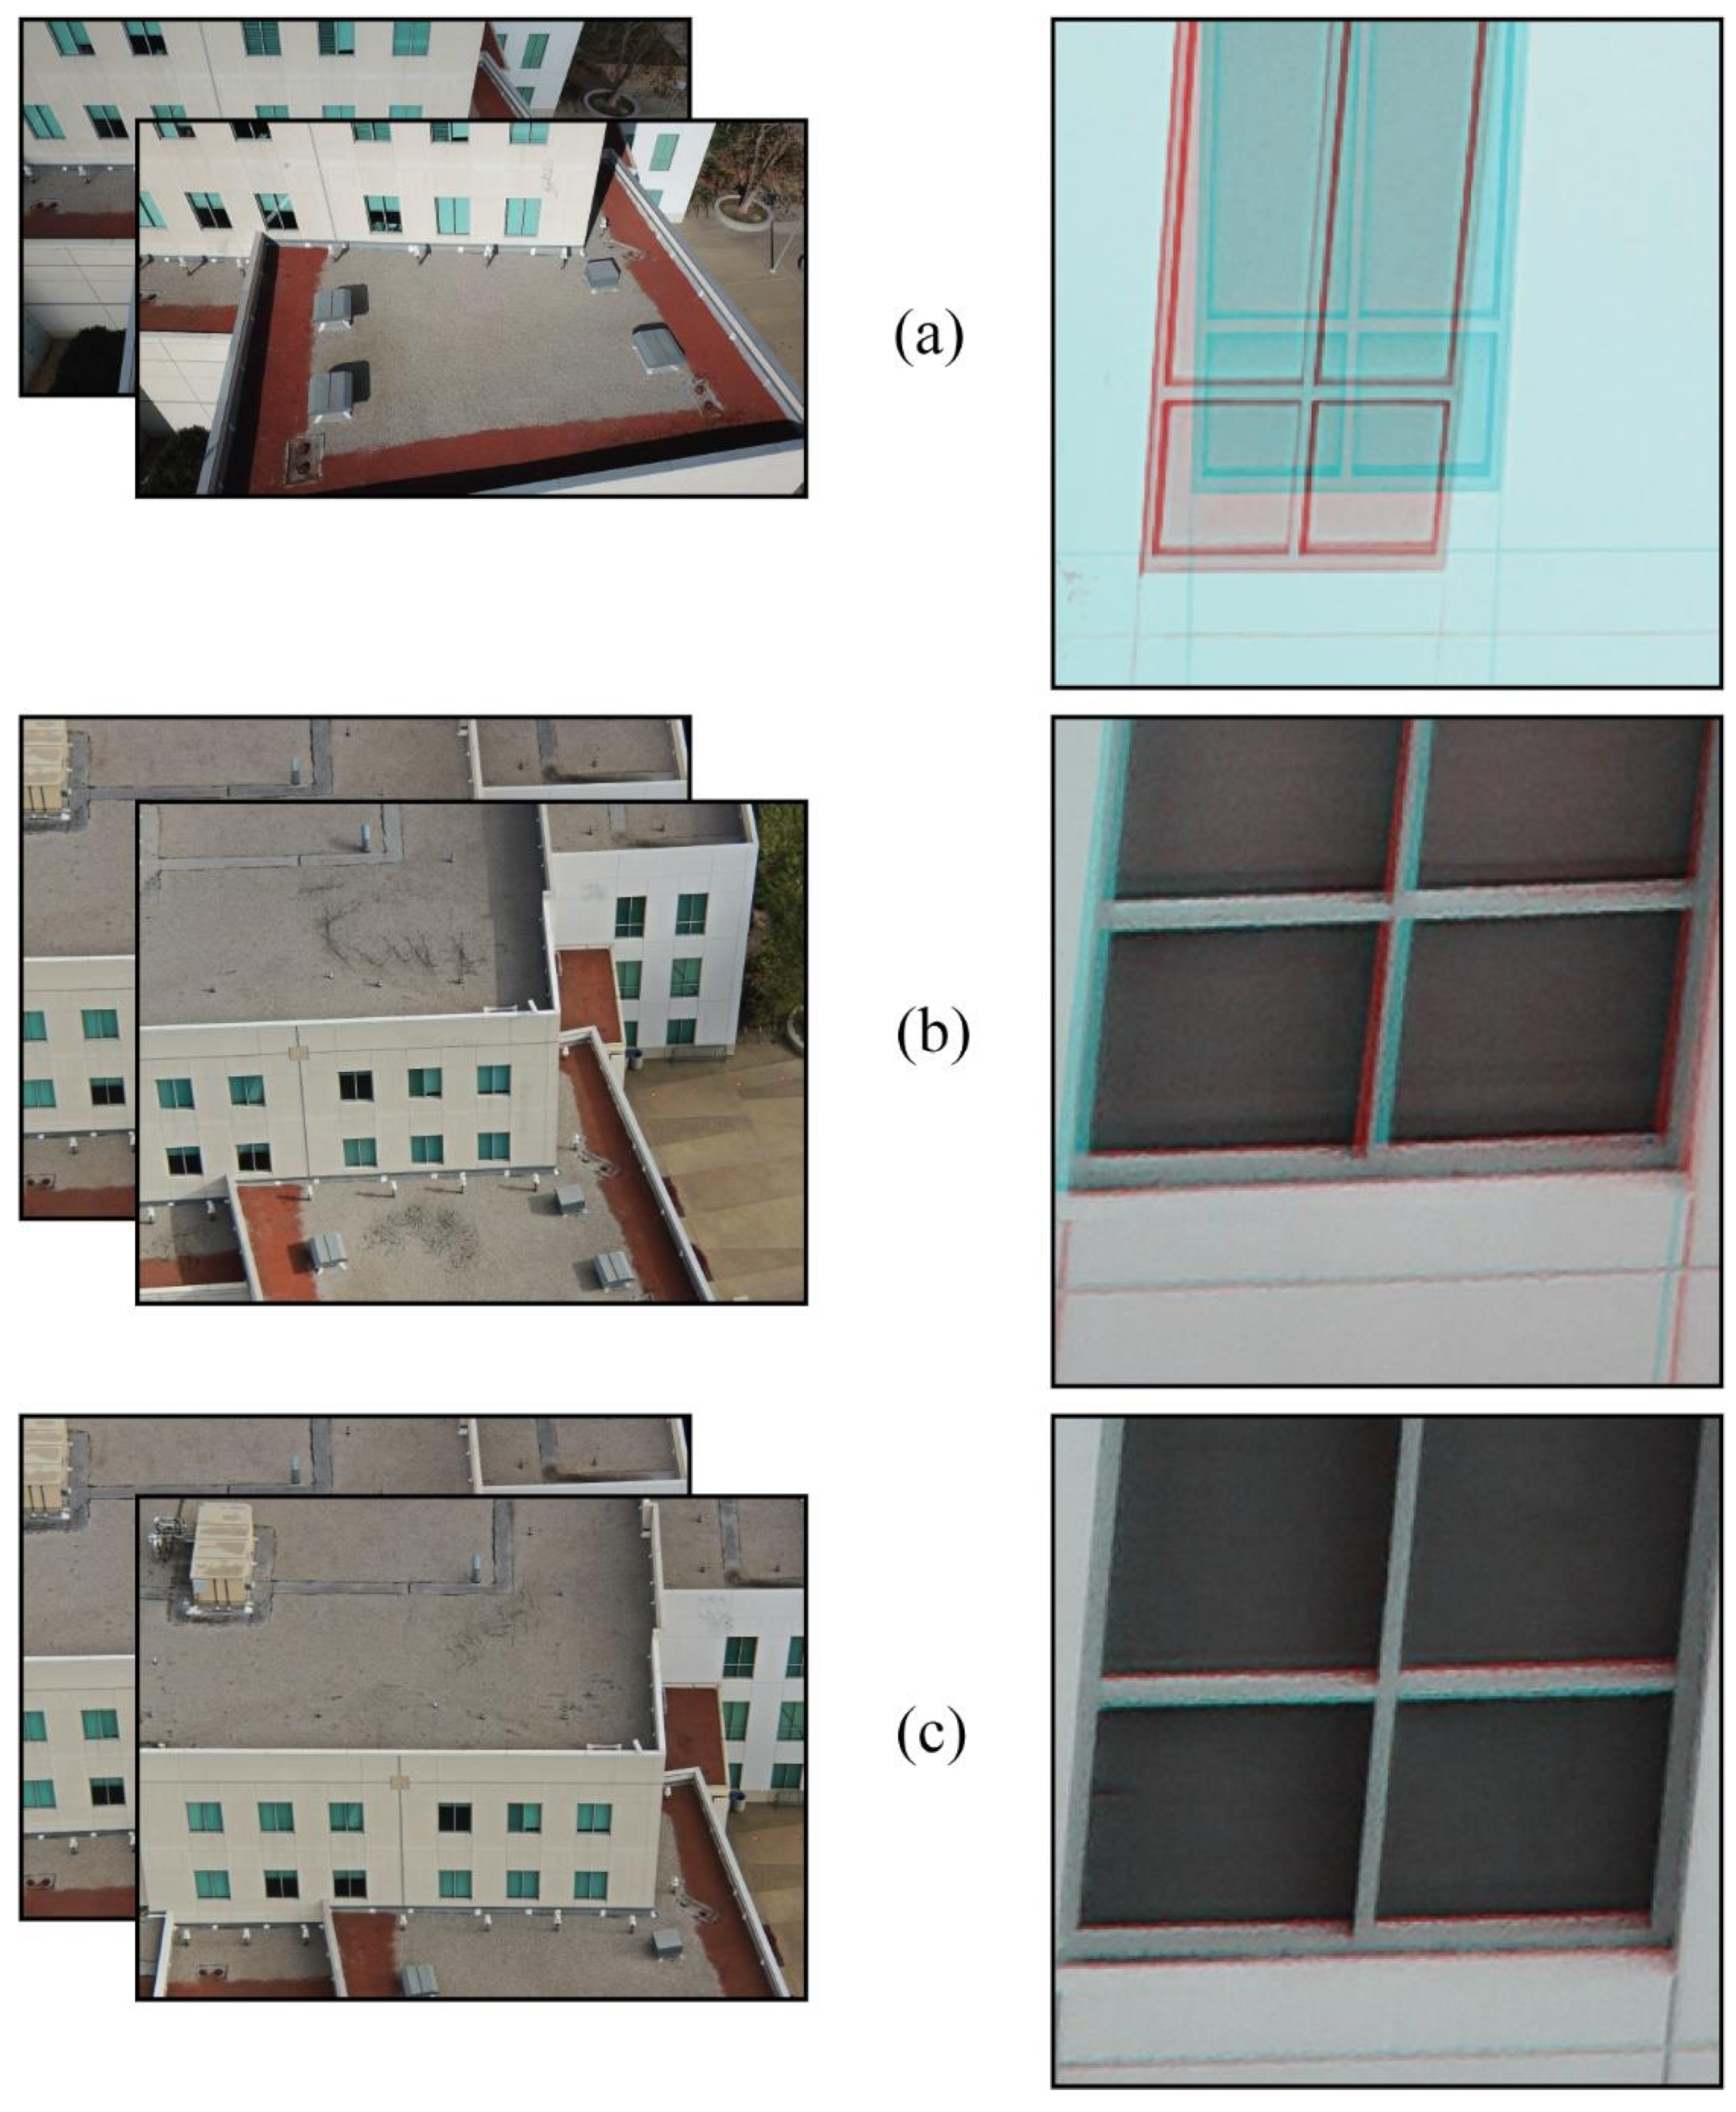
3.2.4. Image Pre-Processing
3.2.5. Neural Network Training and Classification
4. Analytical Procedures
4.1. RSI and Non-RSI Navigational Accuracy
4.2. Image Co-Registration Accuracy
4.3. Neural Network Classification Accuracy
5. Results
5.1. Navigation and Image Co-Registration Accuracy
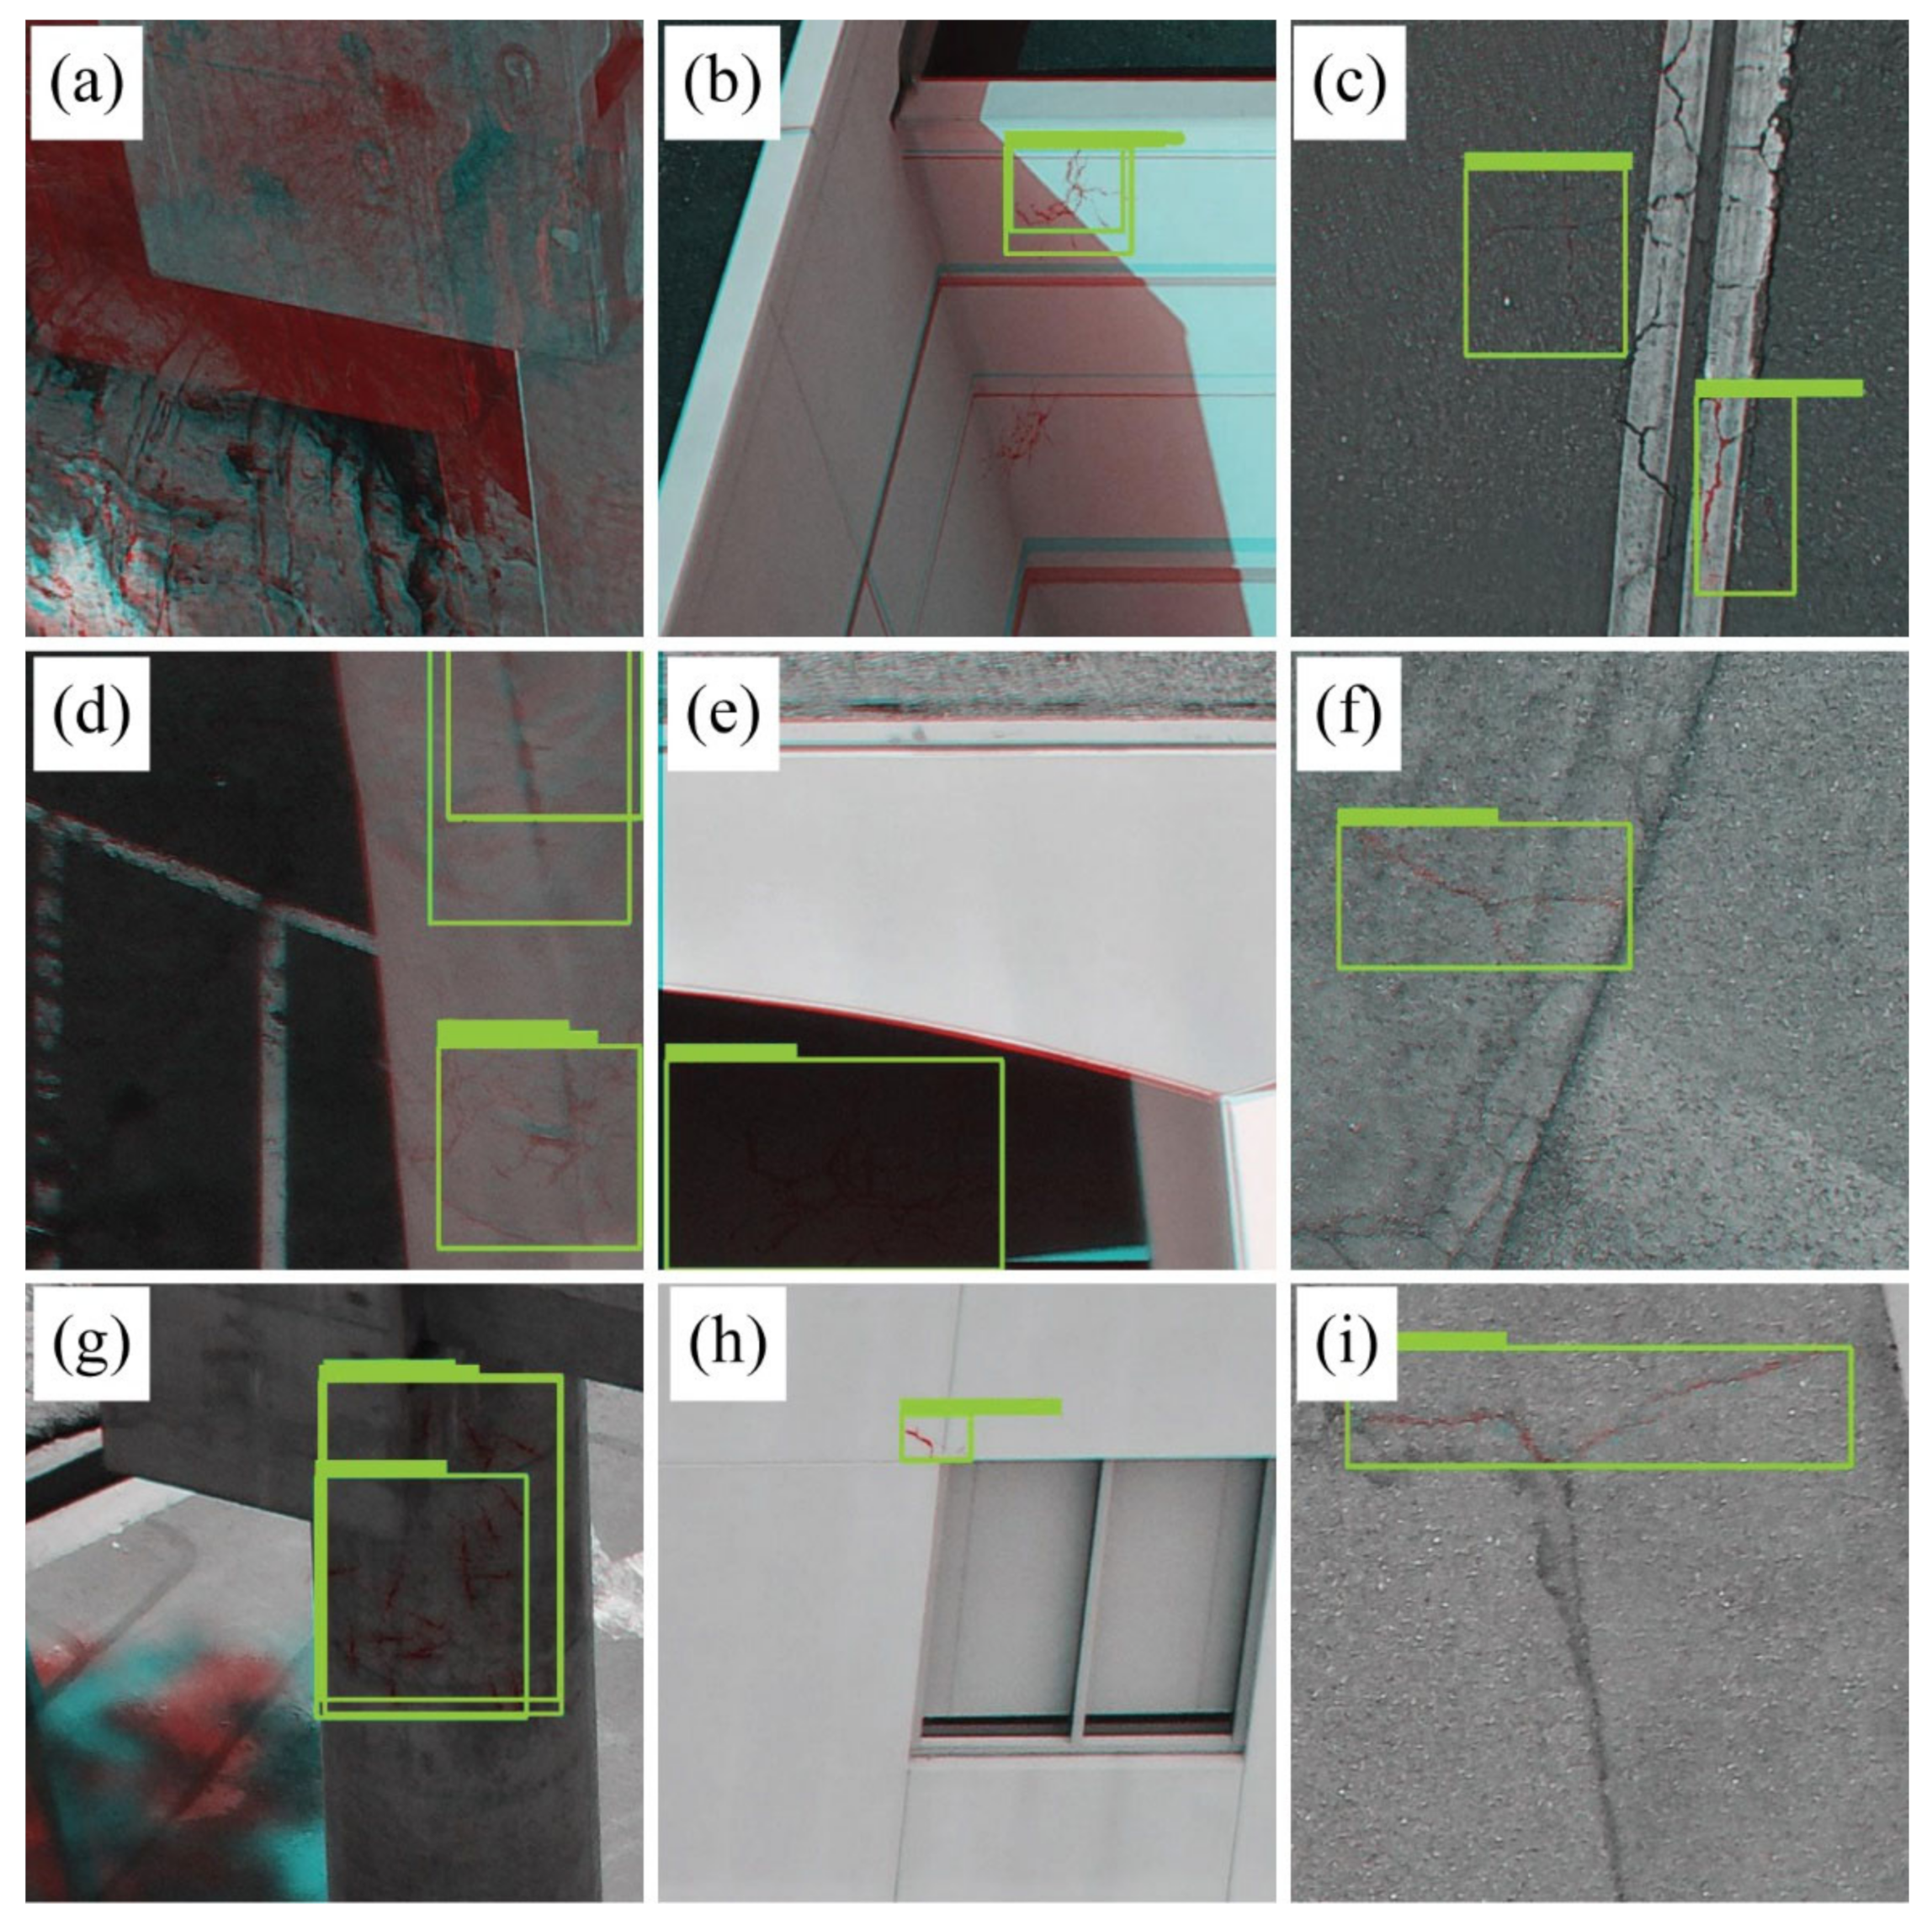
5.2. Neural Network Classification Results
6. Discussion
6.1. How Accurately Can an RTK GNSS Repeatedly Navigate a sUAS Platform and Trigger a Camera at a Specified Waypoint (i.e., Imaging Station)?
6.2. How Does the Co-Registration Accuracy Vary for RSI versus Non-RSI Acquisitions of sUAS Imagery Captured with Nadir and Oblique Views?
6.3. What Difference in Classification Accuracy of Bi-Temporal Change Objects Is Observed with a CNN for RSI and Non-RSI Co-Registered Images?
7. Conclusions
Author Contributions
Funding
Data Availability Statement
Conflicts of Interest
References
- Joyce, K.E.; Wright, K.C.; Samsonov, S.V.; Ambrosia, V.G. Remote Sensing and the Disaster Management Cycle. Adv. Geosci. Remote Sens. 2009, 48, 7. [Google Scholar]
- Laben, C. Integration of Remote Sensing Data and Geographic Information Systems Technology for Emergency Managers and Their Applications at the Pacific Disaster Center. Opt. Eng. 2002, 41, 2129–2136. [Google Scholar] [CrossRef]
- Cutter, S.L. GI Science, Disasters, and Emergency Management. Trans. GIS 2003, 7, 439–446. [Google Scholar] [CrossRef]
- Lippitt, C.D.; Stow, D.A. Remote Sensing Theory and Time-Sensitive Information. In Time-Sensitive Remote Sensing; Springer: Berlin/Heidelberg, Germany, 2015; pp. 1–10. [Google Scholar]
- Taubenböck, H.; Post, J.; Roth, A.; Zosseder, K.; Strunz, G.; Dech, S. A Conceptual Vulnerability and Risk Framework as Outline to Identify Capabilities of Remote Sensing. Nat. Hazards Earth Syst. Sci. 2008, 8, 409–420. [Google Scholar] [CrossRef]
- Pham, T.-T.-H.; Apparicio, P.; Gomez, C.; Weber, C.; Mathon, D. Towards a rapid automatic detection of building damage using remote sensing for disaster management. Disaster Prev. Manag. Int. J. 2014, 23, 53–66. [Google Scholar] [CrossRef]
- Lippitt, C.D.; Stow, D.A.; Clarke, K.C. On the Nature of Models for Time-Sensitive Remote Sensing. Int. J. Remote Sens. 2014, 35, 6815–6841. [Google Scholar] [CrossRef]
- Ehrlich, D.; Guo, H.D.; Molch, K.; Ma, J.W.; Pesaresi, M. Identifying Damage Caused by the 2008 Wenchuan Earthquake from VHR Remote Sensing Data. Int. J. Digit. Earth 2009, 2, 309–326. [Google Scholar] [CrossRef]
- Niethammer, U.; James, M.R.; Rothmund, S.; Travelletti, J.; Joswig, M. UAV-Based Remote Sensing of the Super-Sauze Landslide: Evaluation and Results. Eng. Geol. 2012, 128, 2–11. [Google Scholar] [CrossRef]
- Westoby, M.J.; Brasington, J.; Glasser, N.F.; Hambrey, M.J.; Reynolds, J.M. ‘Structure-from-Motion’ Photogrammetry: A Low-Cost, Effective Tool for Geoscience Applications. Geomorphology 2012, 179, 300–314. [Google Scholar] [CrossRef] [Green Version]
- Zhang, S.; Lippitt, C.D.; Bogus, S.M.; Loerch, A.C.; Sturm, J.O. The accuracy of aerial triangulation products automatically generated from hyper-spatial resolution digital aerial photography. Remote Sens. Lett. 2016, 7, 160–169. [Google Scholar] [CrossRef]
- Colomina, I.; Molina, P. Unmanned Aerial Systems for Photogrammetry and Remote Sensing: A Review. ISPRS J. Photogramm. Remote Sens. 2014, 92, 79–97. [Google Scholar] [CrossRef]
- Smith, M.J.; Chandler, J.; Rose, J. High Spatial Resolution Data Acquisition for the Geosciences: Kite Aerial Photography. Earth Surf. Process. Landf. 2009, 34, 155–161. [Google Scholar] [CrossRef]
- Turner, D.; Lucieer, A.; Watson, C. An Automated Technique for Generating Georectified Mosaics from Ultra-High Resolution Unmanned Aerial Vehicle (UAV) Imagery, Based on Structure from Motion (SfM) Point Clouds. Remote Sens. 2012, 4, 1392–1410. [Google Scholar] [CrossRef] [Green Version]
- Jensen, J.R.; Im, J. Remote Sensing Change Detection in Urban Environments. In Geo-Spatial Technologies in Urban Environments; Springer: Berlin/Heidelberg, Germany, 2007; pp. 7–31. [Google Scholar]
- Coulter, L.L.; Stow, D.A.; Baer, S. A Frame Center Matching Technique for Precise Registration of Multitemporal Airborne Frame Imagery. IEEE Trans. Geosci. Remote Sens. 2003, 41, 2436–2444. [Google Scholar] [CrossRef]
- Stow, D. Reducing the Effects of Misregistration on Pixel-Level Change Detection. Int. J. Remote Sens. 1999, 20, 2477–2483. [Google Scholar] [CrossRef]
- Slama, C.C. Manual of Photogrammetry; America Society of Photogrammetry: Falls Church, VA, USA, 1980. [Google Scholar]
- Stow, D.A.; Coulter, L.C.; Lippitt, C.D.; MacDonald, G.; McCreight, R.; Zamora, N. Evaluation of Geometric Elements of Repeat Station Imaging and Registration. Photogramm. Eng. Remote Sens. 2016, 82, 775–789. [Google Scholar] [CrossRef]
- Stow, D.; Hamada, Y.; Coulter, L.; Anguelova, Z. Monitoring Shrubland Habitat Changes through Object-Based Change Identification with Airborne Multispectral Imagery. Remote Sens. Environ. 2008, 112, 1051–1061. [Google Scholar] [CrossRef]
- Loerch, A.C.; Paulus, G.; Lippitt, C.D. Volumetric Change Detection with Using Structure from Motion—The Impact of Repeat Station Imaging. GI_Forum 2018, 6, 135–151. [Google Scholar] [CrossRef] [Green Version]
- Coulter, L.L.; Plummer, M.; Zamora, N.; Stow, D.; McCreight, R. Assessment of Automated Multitemporal Image Co-Registration Using Repeat Station Imaging Techniques. GIScience Remote Sens. 2019, 56, 1192–1209. [Google Scholar] [CrossRef]
- Atkinson, P.M.; Tatnall, A.R. Introduction Neural Networks in Remote Sensing. Int. J. Remote Sens. 1997, 18, 699–709. [Google Scholar] [CrossRef]
- Lyu, H.; Lu, H.; Mou, L. Learning a Transferable Change Rule from a Recurrent Neural Network for Land Cover Change Detection. Remote Sens. 2016, 8, 506. [Google Scholar] [CrossRef]
- Pinheiro, P.; Collobert, R. Recurrent Convolutional Neural Networks for Scene Labeling. In Proceedings of the 31st International Conference on Machine Learning, PMLR, Bejing, China, 22–24 June 2014; pp. 82–90. [Google Scholar]
- Long, J.; Shelhamer, E.; Darrell, T. Fully Convolutional Networks for Semantic Segmentation. In Proceedings of the IEEE Conference on Computer Vision and Pattern Recognition, Boston, MA, USA, 7–12 June 2015; pp. 3431–3440. [Google Scholar]
- Lv, Q.; Dou, Y.; Niu, X.; Xu, J.; Xu, J.; Xia, F. Urban Land Use and Land Cover Classification Using Remotely Sensed SAR Data through Deep Belief Networks. J. Sens. 2015, 2015, 538063. [Google Scholar] [CrossRef] [Green Version]
- Dumoulin, V.; Visin, F. A Guide to Convolution Arithmetic for Deep Learning. arXiv 2016, arXiv:1603.07285. [Google Scholar]
- Chen, G.; Hay, G.J.; Carvalho, L.M.T.; Wulder, M.A. Object-Based Change Detection. Int. J. Remote Sens. 2012, 33, 4434–4457. [Google Scholar] [CrossRef]
- Chen, L.-C.; Zhu, Y.; Papandreou, G.; Schroff, F.; Adam, H. Encoder-Decoder with Atrous Separable Convolution for Semantic Image Segmentation. In Proceedings of the European Conference on Computer Vision (ECCV), Munich, Germany, 8–14 September 2018; pp. 801–818. [Google Scholar]
- Stow, D. Geographic Object-Based Image Change Analysis. In Handbook of Applied Spatial Analysis; Springer: Berlin/Heidelberg, Germany, 2010; pp. 565–582. [Google Scholar]
- He, K.; Gkioxari, G.; Dollár, P.; Girshick, R. Mask R-Cnn. In Proceedings of the IEEE International Conference on Computer Vision, Venice, Italy, 22–29 October 2017; pp. 2961–2969. [Google Scholar]
- Storey, E.A.; Stow, D.A.; Coulter, L.L.; Chen, C. Detecting shadows in multi-temporal aerial imagery to support near-real-time change detection. GIScience Remote Sens. 2017, 54, 453–470. [Google Scholar] [CrossRef]
- Dronova, I.; Gong, P.; Wang, L. Object-Based Analysis and Change Detection of Major Wetland Cover Types and Their Classification Uncertainty during the Low Water Period at Poyang Lake, China. Remote Sens. Environ. 2011, 115, 3220–3236. [Google Scholar] [CrossRef]
- Voulodimos, A.; Doulamis, N.; Doulamis, A.; Protopapadakis, E. Deep Learning for Computer Vision: A Brief Review. Comput. Intell. Neurosci. 2018, 2018, 7068349. [Google Scholar] [CrossRef]
- Dieleman, S.; De Fauw, J.; Kavukcuoglu, K. Exploiting Cyclic Symmetry in Convolutional Neural Networks. In Proceedings of the International Conference on Machine Learning, PMLR, New York, NY, USA, 20–22 June 2016; pp. 1889–1898. [Google Scholar]


| Feature Types and Descriptions | Damage Type | Imaging View Perspective |
|---|---|---|
Building
| roof & side cracks | oblique |
Bridge
| surface & support structure cracks | oblique |
Road
| surface cracks | nadir |
| Platform | Sensor Make/Model | Image Dimensions | Sensor Dimensions | Focal Length |
|---|---|---|---|---|
| Mavic 1 | DJI FC220 | 4000 × 3000 | 6.16 mm × 4.55 mm | 4.74 mm |
| Matrice 300 | Zenmuse H20 | 5184 × 3888 | 9.50 mm × 5.70 mm | 25.4 mm |
| Bridge 1 | Bridge 2 | Building 1 | Building 2 | Road 1 | Road 2 | Road 3 | ||||||||
|---|---|---|---|---|---|---|---|---|---|---|---|---|---|---|
| WP | IM | WP | IM | WP | IM | WP | IM | WP | IM | WP | IM | WP | IM | |
| Mavic 1 | 14 | 128 | 11 | 71 | 11 | 66 | 15 | 49 | 28 | 354 | 33 | 331 | n/a | n/a |
| Matrice 300 | 8 | 103 | 8 | 101 | 11 | 110 | 10 | 132 | n/a | n/a | 12 | 176 | 12 | 145 |
| Dataset | Navigation MAE (m) | Navigation RMSE (m) | Image Overlap (MPE) | Co-Registration MAE (Pixels) | Co-Registration RMSE (Pixels) |
|---|---|---|---|---|---|
| Nadir, M300 RSI (n = 161) | 0.174 | 0.191 | 10.1 | 2.1 | 4.9 |
| Nadir, M300 non-RSI (n = 160) | 0.277 | 0.292 | 12.5 | 3.8 | 8.7 |
| Nadir, M1 non-RSI (n = 685) | 9.131 | 9.770 | 27.8 | 11.0 | 53.3 |
| Oblique, M300 RSI (n = 223) | 0.144 | 0.173 | 8.6 | 2.3 | 5.5 |
| Oblique, M300 non-RSI (n = 223) | 0.137 | 0.150 | 18.0 | 5.0 | 10.7 |
| Oblique, M1 non-RSI (n = 314) | 0.184 | 0.508 | 7.6 | 139.2 | 195.9 |
| Roads (Nadir) | Buildings (Oblique) | Bridges (Oblique) | Overall Accuracy | |
|---|---|---|---|---|
| M1 (non-RSI) | 88.9% | 71.4% | 37.5% | 72.5% |
| Matrice 300 (non-RSI) | 64.3% | 64.3% | 40.9% | 54.0% |
| Matrice 300 (RSI) | 88.2% | 92.3% | 69.2% | 83.7% |
Publisher’s Note: MDPI stays neutral with regard to jurisdictional claims in published maps and institutional affiliations. |
© 2022 by the authors. Licensee MDPI, Basel, Switzerland. This article is an open access article distributed under the terms and conditions of the Creative Commons Attribution (CC BY) license (https://creativecommons.org/licenses/by/4.0/).
Share and Cite
Loerch, A.C.; Stow, D.A.; Coulter, L.L.; Nara, A.; Frew, J. Comparing the Accuracy of sUAS Navigation, Image Co-Registration and CNN-Based Damage Detection between Traditional and Repeat Station Imaging. Geosciences 2022, 12, 401. https://doi.org/10.3390/geosciences12110401
Loerch AC, Stow DA, Coulter LL, Nara A, Frew J. Comparing the Accuracy of sUAS Navigation, Image Co-Registration and CNN-Based Damage Detection between Traditional and Repeat Station Imaging. Geosciences. 2022; 12(11):401. https://doi.org/10.3390/geosciences12110401
Chicago/Turabian StyleLoerch, Andrew C., Douglas A. Stow, Lloyd L. Coulter, Atsushi Nara, and James Frew. 2022. "Comparing the Accuracy of sUAS Navigation, Image Co-Registration and CNN-Based Damage Detection between Traditional and Repeat Station Imaging" Geosciences 12, no. 11: 401. https://doi.org/10.3390/geosciences12110401