Technical Note

Shallow Landslides and Rockfalls Velocity Assessment at Regional Scale: A Methodology Based on a Morphometric Approach

Earth Sciences Department, University of Firenze, Via G. La Pira 4, 50121 Firenze, Italy
*
Author to whom correspondence should be addressed.
Geosciences 2022, 12(4), 177; https://doi.org/10.3390/geosciences12040177
Submission received: 15 February 2022 / Revised: 18 March 2022 / Accepted: 14 April 2022 / Published: 16 April 2022
(This article belongs to the Special Issue Landslide Monitoring and Mapping)

Abstract

:
Velocity is one of the most important parameters to evaluate the damaging potential of a mass movement, but its assessment, especially for extremely rapid landslides, is a complex task. In the literature, several models to assess mass movement velocity exist, but they usually require many detailed parameters, and therefore, they are applicable only to a single slope and not usable for regional-scale analyses. This study aims to propose a simple morphometric methodology, based on the spatialisation of the Energy Line method, to determine the velocity of shallow landslides and rockfalls at a regional scale. The proposed method requires a limited amount of input data (landslide perimeters and a digital elevation model), and its application can be carried out using GIS software and a Matlab code. The test area of this work is the Valle d’Aosta Region (Northern Italy), selected due to its peculiar geological and geomorphological setting that makes this region susceptible to the occurrence of both shallow landslides and rockfalls. Since measured velocity values for rockfalls and shallow landslides were not available, the results obtained with the proposed method have been validated through the implementation of a model in the literature, namely the Gravitational Process Path (GPP) model, for some selected landslides.

1. Introduction

Landslides, defined as “movements of a mass of rock, earth or debris down a slope” [1], are one of the most disastrous natural phenomena from both an economic and a social point of view. As mentioned by Nadim et al. [2], the occurrence of these events has been increasing over time due to climate change and human impact. For this reason, the scientific and political community recognises the need to study these phenomena in order to implement possible prevention and mitigation plans.
The destructive capacity of mass movement events is a function of several parameters that are difficult to evaluate, such as the volume, the velocity, and hence, the energy of the landslide body. The latter represents an essential quantity for the landslide characterisation; indeed, the velocity is a parameter widely used in the scientific literature for the evaluation of landslide intensity [3,4,5,6,7,8,9] and is, consequently, a key requirement for landslide risk assessment.
However, mass movement velocity is difficult, and often impossible, to measure, when referring to extremely rapid movements, such as debris flows, shallow landslides, and rockfalls; only a few examples can be found in the literature [10,11]. Nevertheless, in the last twenty years, techniques that use images acquired by ground-based synthetic aperture radar (GB-SAR) sensors have been developed in order to monitor the kinematics of individual slopes also affected by fast-moving landslides [12]. This is an expensive technique that needs to be integrated with additional monitoring tools, and it is, therefore, mainly used for civil protection purposes [12]. Furthermore, GB-SAR, as well as other in situ instruments (e.g., total station), can be used to estimate slope deformation velocities only before the collapse of the landslides. For this reason, on a local scale, mass movement velocity is often estimated by applying numerical models that require a large amount of medium- and high-resolution data [13]. For example, for the study of shallow landslides, the SPH [14] model is widely used, while for rockfalls, RockFall Analyst [15] is often applied. Nevertheless, there are some models employed for both types of landslides (e.g., DAN-W [16], GPP [17]). Additionally to numerical models and monitoring, there are also other ways to estimate fast-moving landslide velocity on-field in the aftermath of an event, for instance, by the super-elevation of the flow, as discussed in Prochaska et al. [18].
For slow-moving landslides, several monitoring instruments (e.g., inclinometers, ground-based radar, GPS, and total stations) installed in situ allow for the measurement of the velocity at a slope scale [19].
Nevertheless, as stated by Corominas et al. [20], for spatial planning and management purposes, it is necessary to obtain the components of landslide risk (i.e., intensity, vulnerability, exposure, hazard) at a regional scale [21]. Methodologies that provide these parameters at a large scale involve the expensive and time-consuming use of spatially homogeneous data that are distributed over wide areas and are often not available [22]. Satellite radar interferometry techniques are consolidated methodologies [23,24,25] to estimate mass movement velocity with a relatively low cost and easy application, allowing for the analysis of ground surface deformations both at a detailed scale and over large areas. Although an advantageous method for spatial planning purposes, this instrumentation does not allow for the velocity of fast-moving landslides to be detected [26].
To overcome the aforementioned issue, this study aims to introduce a method for assessing the velocity of shallow landslides and rockfalls at a regional scale—a spatialisation of the Heim Energy Line method [27]. The proposed methodology is a morphometric approach, whose application implies the knowledge several input data spatialised on the area of interest. Therefore, the two types of movement analysed in this study are shallow landslides and rockfalls. Rockfalls are movements of rock masses characterised by an initial free fall, followed by rebound and rolling; they are phenomena that typically affect steep cliffs and have extremely rapid velocities. Shallow landslides also affect steep slopes and are characterised by high velocities; these are movements that generally occur on slopes characterised by water-saturated topsoil as a consequence of heavy rainfall. The above-mentioned two types of mass movements are part of the extremely rapid movement class, i.e., with a velocity greater than 5 m/s, as stated by Cruden and Varnes [3]. The proposed method was tested in the Valle d’Aosta Region, where several landslide events have been mapped within the regional inventory. Since measured mass movement velocity values were not available for the study area, the obtained results were validated using a suitably calibrated model from the literature.

2. Materials and Methods

2.1. Study Area

The study area was the Valle d’Aosta territory, an alpine region located in the extreme north-western sector of Italy.
From a geological point of view, this region belongs to the Alpine chain, and it is delimited by two important geological lines: the Periadriatic fault system to the south and the Penninic front to the north. The geological units outcropping in Valle d’Aosta have been reclassified into 16 litho-technical groups, which are shown in Figure 1.
Regarding the geomorphology of the area, the region is a mainly mountainous zone characterised by a very variable altitude, with values from 300 m a.s.l. to more than 4000 m a.s.l. with the main peaks of the Alpine orogeny [28]. The area corresponds to the mountain section of the Dora Baltea River basin, a glacial valley with an east–west orientation that is the main evidence of Quaternary glaciations [28] (Figure 2). The main phenomena that shape a mountain territory are mass movements and glaciers. In fact, the Valle d’Aosta territory was mainly influenced by the Pleistocene glacial phases that shaped the main valley and the tributary valleys; in the region, there is evidence of glacial modelling as both erosional and depositional forms. The subsequent fluvial action changed the landscape through the deepening of the glacial valley floors, the erosion of glacial deposits, and the formation of alluvial deposits [29].
In addition to glacial phenomena, gravitational movements play an important role in the modelling of the region. Indeed, the geological history and the morphology of the territory cause the presence of numerous mass movements of different types and sizes. In this regard, the data of the Inventario dei Fenomeni Franosi in Italia (IFFI, landslide inventory in Italy compiled by ISPRA [30,31]) Project show a 17.8% landslide index; this means that almost 18% of the regional area consists of landslides [29]. The IFFI inventory is the only homogeneous landslide inventory at a national level, and it is a fundamental instrument for landslide risk assessment and management. The IFFI Project does not include phenomena related to torrential processes, e.g., debris flows, because they are considered extraneous to a landslide inventory. Specifically regarding the Valle d’Aosta region, due to the morphology of the territory, which is characterised by high steepness, the most common landslides are the rapid ones, such as shallow landslides and rockfalls. In fact, the IFFI inventory includes 612 polygons of rockfalls/topplings and 728 polygons of shallow landslides out of a total of 2145 landslides mapped. The climate also plays an important role; the marginal mountainous areas are characterised by an alpine climate with high rainfall/snowfall up to 1100 mm/year [32], and slope steepness and rainfall are among the main triggers of mass movements. A further factor that causes slope instability conditions in Alpine regions is snowmelt. Therefore, global climate change leading to more intense rainfall and the growing anthropogenic impact are the main causes of the continuous increase in mass movements. There are several geological and geomorphological studies [33,34,35,36] dealing with the relation of slope instability in glacial valleys with freeze–thaw cycles, and in particular with the pressure release following glacier retreat.

2.2. Heim Method

The proposed methodology aims to estimate the velocity of fast-moving landslides on a large scale, such as shallow landslides and rockfalls. This method is based on the Heim Energy Lines model [27] and its application on a regional scale.
The Heim Energy Lines method [27] was suggested in order to identify the kinetic energy of a mass movement, and it is based on the slope morphology. In particular, the landslide body is considered as a rigid block moving down a slope, and this allows for the use of the conservation of energy law, assuming that all the energy lost in the movement is dissipated by friction.
The basic principles of the Heim [27] model are shown in Figure 3. Specifically, it is based on the definition of the energy line, i.e., the theoretical line connecting the highest point of the landslide (top) and the most distant point of landslide accumulation (tip). This line forms an angle β ((1) with the horizontal plane and represents the landslide travel angle, characterised by a value inversely proportional to the landslide propagation distance.
tan β = Δ H L ,
where β is the slope of the line from the horizontal, and L and ΔH represent the vertical and horizontal offsets, respectively.
Therefore, through the energy line, it is possible to obtain the arrival distance of the landslide and, consequently, its velocity. In fact, the velocity at any point of the landslide is proportional to the vertical distance (k) between the energy line and the point itself. The parameter k (Equation (2)) represents the kinetic load, i.e., the kinetic energy divided by the weight of the displaced mass. Within a landslide, k can be expressed as the semi-ratio between the square of the propagation velocity (v) and the acceleration of gravity (g).
k = 1 2 v 2 g
Thus, considering all the points of the landslide it is possible to have an idea of its velocity. In particular, with Equation (3), we can estimate the velocity of a landslide body for any position x:
v ( x ) = 2 k g

2.3. Input Data Preparation and Elaboration

The Heim Energy Line method [27] is limited to a local scale application; in order to apply it to a regional scale, and thus to all the fast-moving landslides in Valle d’Aosta, its spatialisation is necessary. To apply this model, the same model for shallow landslides and rockfalls, a procedure in the GIS environment was implemented for which the landslide perimeters and a digital elevation model (DEM) were requested. The landslide polygons were obtained from the IFFI Project, the Inventory of Landslide Phenomena in Italy compiled by ISPRA [30,31]. A DEM with a 10 m resolution [38] was cropped on each landslide polygon, hence obtaining the base file from which the length (L) and the maximum and minimum height values were extracted for each landslide, taken as the top and tip of the landslide, respectively. Afterwards, due to the large amount of data to be analysed and the absence of a specific tool in the GIS environment, all the data were processed using Matlab software (MathWorks, version R2020a). For the application of the Matlab code, provided in the Supplementary Materials, (Supplementary File S1), the required data were prepared; after converting the DEM into points (so that a regular grid of points was obtained), each point was associated with its spatial coordinates. Then, two tables were created: one showing the maximum height value of each polygon with its coordinates and the landslide identification code, and the other with the height of each point belonging to the polygons, its spatial coordinates, the length of the landslide (L), the difference in height between the top and the tip (ΔH), and the landslide identification code. Therefore, a specific calculation routine was performed in Matlab, which allowed for obtaining the following parameters for each point within all the landslides (Figure 4):
(1)
L’—horizontal distance of each point within the landslide from the top;
(2)
Tanβ—tangent of the propagation angle (constant for each landslide);
(3)
G—vertical distance between the top and the energy line, G = L’ × tanβ;
(4)
Q2—height of the energy line, Q2 = Qmax–G;
(5)
k—kinetic load, k = Q2—landslide point elevation (DEM).
Knowing the kinetic load k, by using the inverse formula, it is possible to get the velocity at each point belonging to the landslide polygons, as shown in Equations (2) and (3).

3. Results

In order to estimate the velocities of fast-moving landslides over the whole region, a Matlab code based on the Heim method [27] was created. Through the code, two tables with the velocity values were obtained: one with the maximum velocity value and the other one with the point velocity values for each landslide polygon. These tables can be easily imported into a GIS environment and used for studies with different purposes.
An example of the results can be seen in Figure 5 and Figure 6, where the velocity distribution of a shallow landslide and of a rockfall are reported, respectively. The shallow landslide shows a velocity distribution ranging from 0 m/s to 21 m/s, while that of the rockfall is from 0 m/s to 35 m/s. Over the whole region, the obtained velocity values are characterised by an average maximum value of about 19 m/s for shallow landslides and about 28 m/s for rockfalls. Therefore, the distribution of the velocity values resulting from the Matlab code based on the Heim method [27] is consistent with the values acquired from the monitoring activities that are available in the literature. These results were confirmed by several works carried out on the Alpine territory [11,39,40,41,42,43], which found that the average rockfall velocity values on forested slopes range between 15 and 25 m/s, and in non-forested areas, they reach a maximum value of 30 m/s. The results for shallow landslides are also consistent with the velocity values found in the literature. As stated by Iverson [44] and Rickenmann [45], fast-moving flows can travel over long distances with velocities between 2 and 20 m/s.

Validation of the Results

In the literature, there are only a few examples of measured velocity values of rapid landslides [10,11]; indeed; they are usually all modelled. This issue is even more complex when working at a regional scale. Therefore, in order to verify the reliability of the velocity values obtained with the spatialisation of the Heim Energy Line method [27], a validation procedure was performed using the Gravitational Process Path (GPP) model [17]. This is an extension of SAGA GIS that simulates the process path, the runout length, and the deposition area of gravitational phenomena using a digital elevation model (DEM). The GPP model combines several sub-models, which makes the model applicable to different processes such as rockfalls, debris flows, and snow avalanches. A further advantage of this model is that it requires a small amount of input data, allowing applications at a regional scale [46] as well as at a slope scale [7].
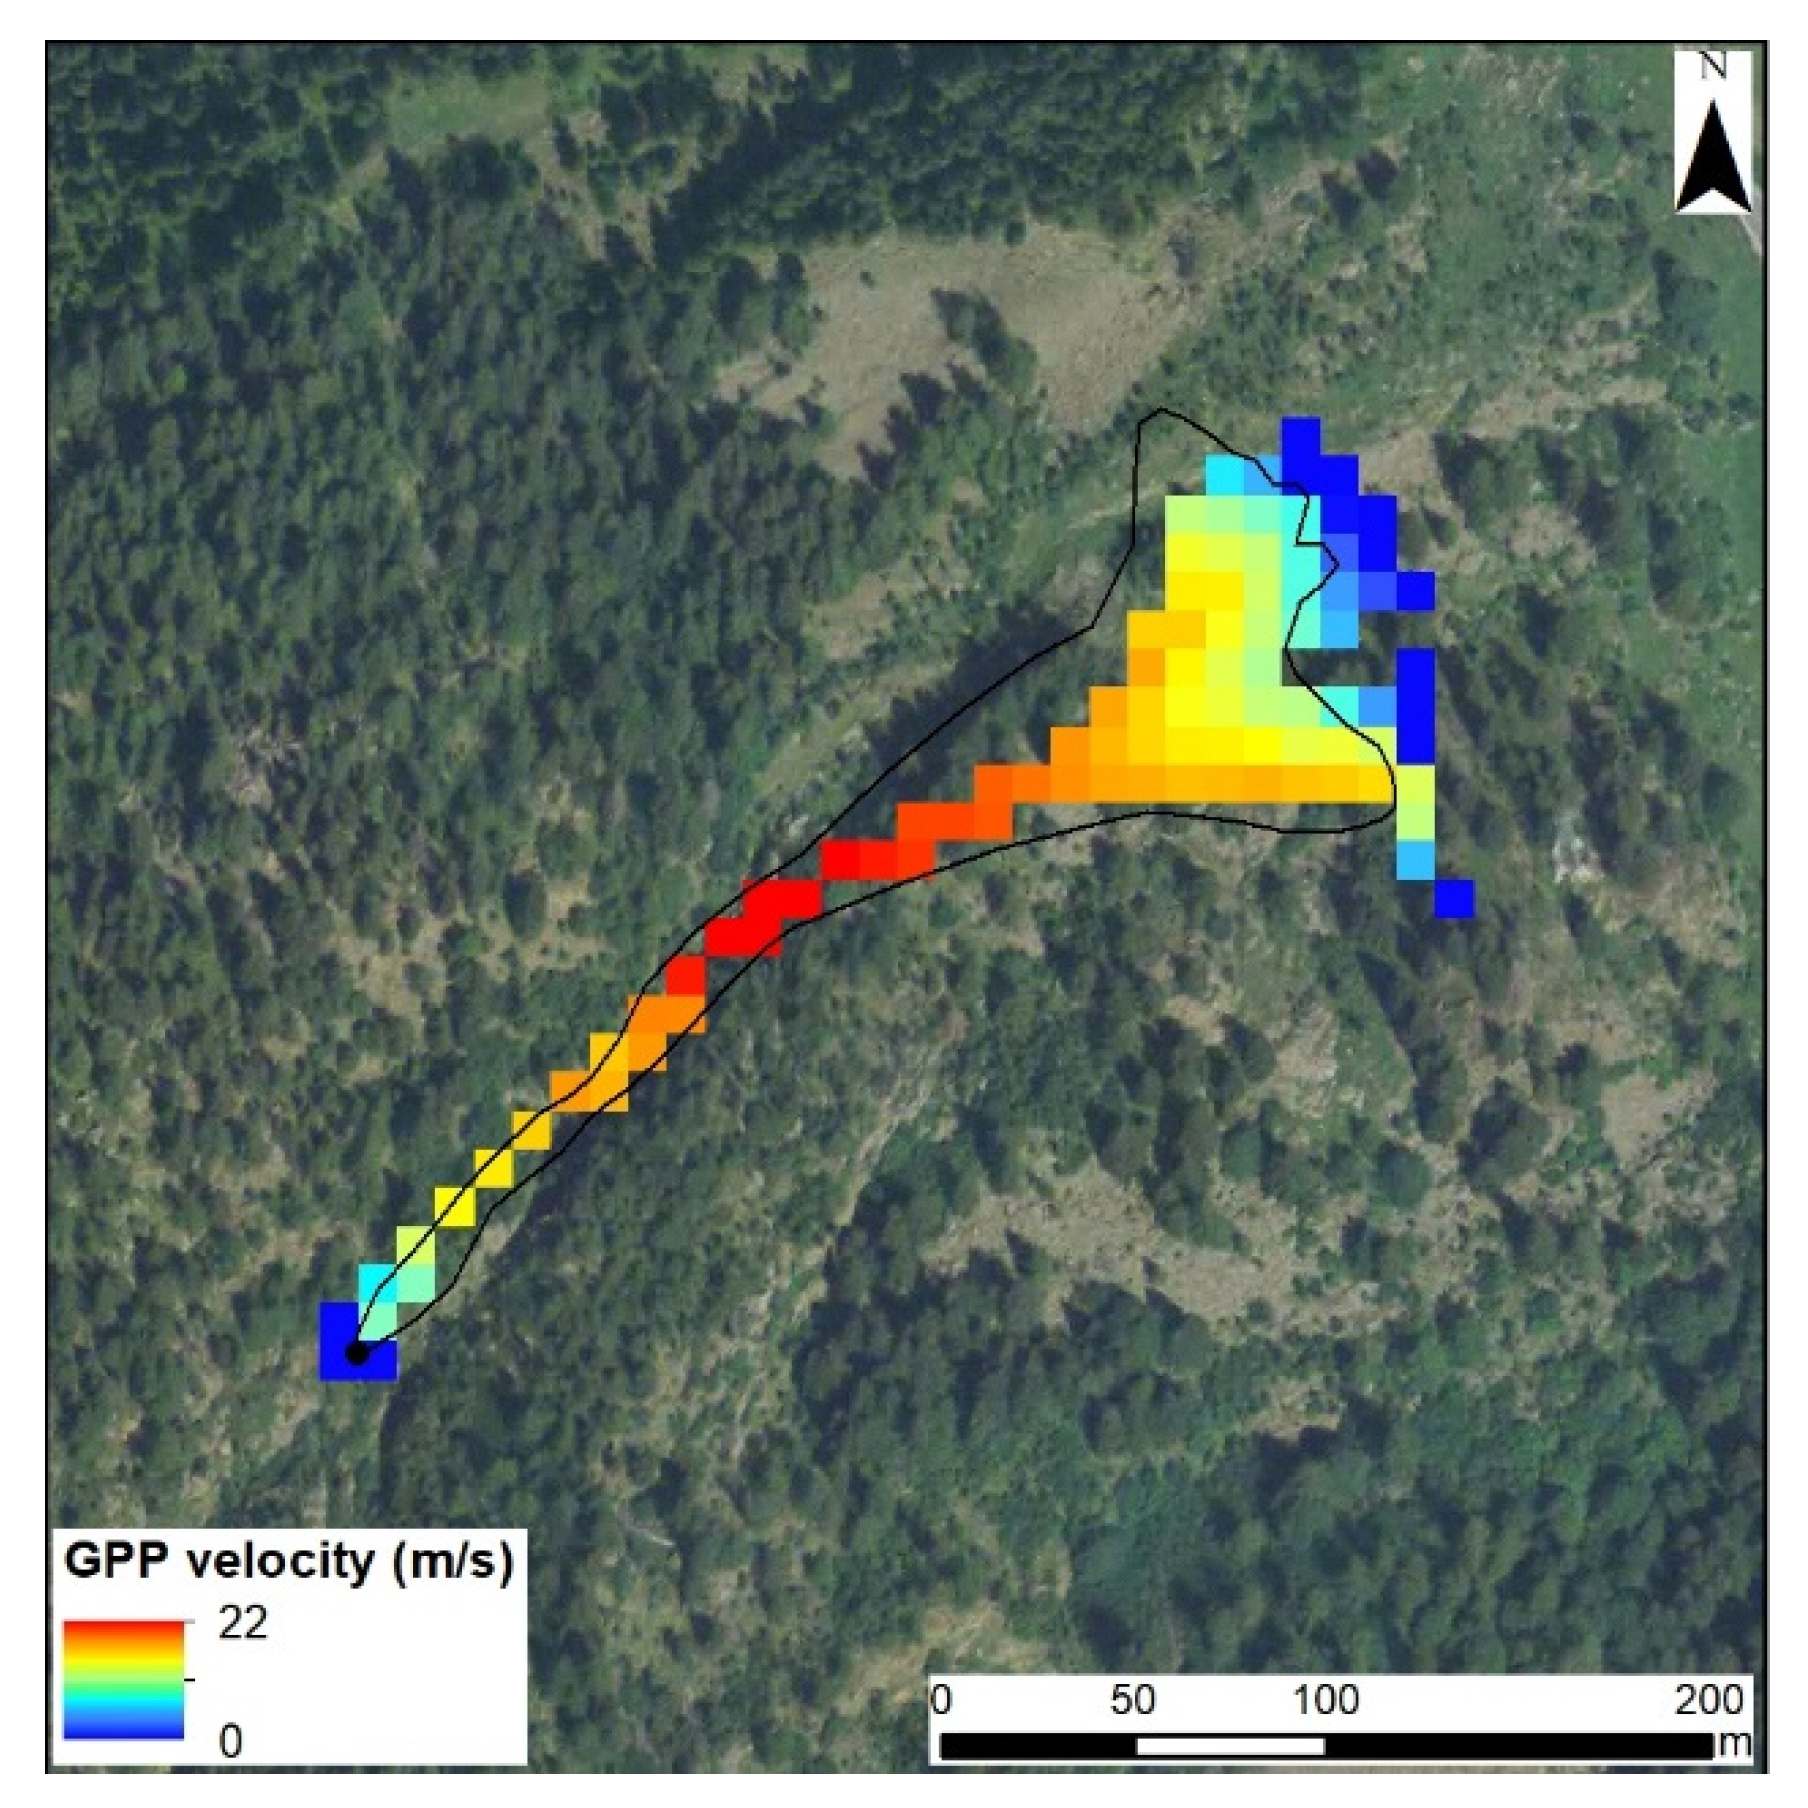
Regarding rockfalls and debris flows, the approaches typically used are “Random Walk” to determine the process path, the “one-parameter friction model” to calculate the runout distance of rockfalls, and the “Perla, Cheng, McClung (PCM) model [47] in the case of debris flows [17]. The GPP model requires as input data a DEM and a release area raster. The Random Walk approach involves as input a slope threshold, below which the divergent flow is modelled, and two parameters that control the flow. The one-parameter friction model requires the definition of the following parameters: a free fall threshold representing the minimum angle between the starting cell and the current one to model the free fall, the energy reduction after the impact, a friction parameter, and the type of movement (sliding or rolling). The PCM model is a two-parameter friction model according to which the movement depends mainly on a sliding friction coefficient and a mass-to-drag ratio. The aforementioned parameters have been calibrated according to the value ranges found in the literature for the study area [48,49]. The application of the model allows for obtaining three products: the “Process Area”, which shows the number of passages of the material, “Stopping Positions”, which highlight the arrival point of the landslide material, and “Maximum Velocity”, which provides the maximum velocity values for each cell. This procedure was performed on selected samples of landslide polygons. Specifically, ten rockfalls and ten shallow landslides were analysed; Figure 7 and Figure 8 show the velocity values obtained from the GPP model for a shallow landslide and a rockfall, respectively. These values can be compared with the velocities obtained by the proposed methodology shown in Figure 5 and Figure 6.
Other examples are shown in Figure 9. The comparison between the outputs highlights that the GPP results, even if with the same geometry, can be characterised by a greater extension. This is due to the different input data used by the two models. In fact, the proposed method works using a DEM corresponding to the landslide polygon, while the GPP model, requiring as input data a DEM of the whole region and the release area of the landslides, simulates the landslide path from the release area considering the entire territory.
The comparison between the maximum velocity values obtained with the two methods showed a good correspondence. In particular, a good positive correlation was found, as shown in the following graphs (Figure 10 and Figure 11), and Pearson correlation coefficients of 0.95 and 0.99 were obtained respectively for rockfalls and shallow landslides.
Non-parametric Kendall and Spearman tests, which measure the strength of the relationship between two variables, were also carried out, leading to the following results: a Kendall coefficient of 0.73 and a Spearman coefficient of 0.89 were achieved for rockfalls; regarding shallow landslides, these coefficients were 0.87 and 0.96, respectively. Moreover, not only the maximum velocity values were compared, but also the velocity distribution within each analysed landslide was investigated. To achieve this goal, boxplots of the velocity values of each landslide have been made both for the proposed approach and for the GPP model.
In Figure 12 and Figure 13, the boxplots relating to rockfalls and shallow landslides are shown. These graphs highlight a good correlation between the velocity values distributions obtained with the proposed method and the GPP model.

4. Discussion

The application of the proposed methodology based on the Heim method [27] for the evaluation of the velocity of fast-moving landslides on a regional scale provided positive results in terms of the velocity value accuracy and the calculation times obtained. Moreover, it is a simple application method that overcomes the traditional difficulties of regional scale studies.
In particular, as mentioned by Hungr [50], the dynamics of rapid landslides depend on the mass movement type. Rockfalls are characterised by an initial acceleration caused by a loss of cohesion on very steep slopes, followed by free fall and rebound of rock material. These phases are characterised by extremely rapid velocity, which then decreases as a result of various impacts and rolling on low slope surfaces. On the other hand, landslides characterised by rapid flow have a high front velocity, and they tend to stop in the presence of a change in slope.
The dynamics of these fast-moving landslides were confirmed by the obtained results. In fact, as shown in Figure 5, Figure 6, Figure 7, Figure 8 and Figure 9, the distributions of the velocity values within the landslide polygons are consistent with the topographic characteristics of the area. In particular, the highest velocities were observed in correspondence with significant altitude differences, decreasing to zero in the proximity of the deposit areas.
In order to verify the velocity values obtained, a GPP application was performed; it is a simple model, but it allows for obtaining good results that are useful for validating the velocity values obtained through the proposed method. The comparison between the maximum velocity values obtained with these two methods showed good results, as demonstrated by the statistical correlation coefficients (Pearson, Kendall, and Spearman). In addition, a comparison between the distributions of all the velocity values of the selected landslide polygons was performed; this was carried out by the implementation of boxplots, which showed a good correspondence between the proposed approach and the GPP model, especially for rockfalls. In the case of shallow landslides, the particular shape of the landslide polygons, which are often curved and very small in width, could explain the not optimal result.
Uncertainties can come from the spatial resolution of the DEM, which could influence the results, potentially reducing the accuracy of the results or masking some defects of both the used models. Other uncertainties are derived from the use of a remote-sensed inventory that, as stated by Bellugi et al. [51], is characterised by several limitations. In particular, this type of inventory does not distinguish landslides from their runout, it is not updated, and it does not include accurate geomorphological data. Given these limitations, the inventory used was suitable for the purposes of this paper, and working at a regional scale, it provided good results.
The application of the Heim method [27] is characterised by some disadvantages. Indeed, it must be considered that it is a simplified morphometric method and so it is based exclusively on altitude differences. The velocity values obtained are approximate due to some assumptions; in particular, a line connecting the top and the tip of the landslide was simply used and considered constant across the entire landslide, representing a kind of plane over the landslide. In this way, the maximum velocity value is the most significant one, but a future development to improve the results could be the application of the model using a semi-cone or a more complex shape to enhance the accuracy of the results.

5. Conclusions

“Velocity is the most important parameter determining the destructive potential of landslides” [50]. In this work, a procedure based on the Heim method was applied in the Valle d’Aosta Region (Italy) in order to determine the velocity for shallow landslides and rockfalls at a large scale over the whole region. It is a morphometric method whose application requires as input data the landslide polygons and a digital elevation model. Using a Matlab code, it was possible to obtain for both landslide types a table with the maximum velocity values and a table with the point velocity values for each landslide polygon. The results obtained were compared with velocities found in the literature and then validated with the GPP model. The estimated values are consistent with the morphological characteristics of the study area and highlight a good statistical correlation with the GPP model outputs. Regarding the distribution of velocities within the landslide polygons, rockfalls showed a better correspondence than shallow landslides due to their shape. In summary, the model applied provided acceptable results in a simple way, but these can be improved by using a surface that considers the irregularity of the landslide area. In addition, the velocity values provided within our procedure could be useful for assessing the landslide intensity and, thus, for strategies of quantitative risk evaluation.

Supplementary Materials

The following supplementary material can be downloaded at https://www.mdpi.com/article/10.3390/geosciences12040177/s1, File S1: Matlab code.

Author Contributions

A.M. and C.M. wrote the paper and analysed the data, A.R. conceptualised the approach and revised the manuscript, S.B. and V.T. gave scientific support to the work, and N.C. supervised the work. All authors have read and agreed to the published version of the manuscript.

Funding

This work was funded by “Dipartimento della Protezione Civile—Presidenza del Consiglio dei Ministri” (Presidency of the Council of Ministers—Department of Civil Protection); this publication, however, does not reflect the position and social policies of the Department.

Institutional Review Board Statement

Not applicable.

Informed Consent Statement

Not applicable.

Data Availability Statement

Not applicable.

Conflicts of Interest

The authors declare no conflict of interest.

References

  1. Cruden, D.M. A Simple Definition of a Landslide. Bull. Int. Assoc. Eng. Geol. 1991, 43, 27–29. [Google Scholar] [CrossRef]
  2. Nadim, F.; Kjekstad, O.; Peduzzi, P.; Herold, C.; Jaedicke, C. Global Landslide and Avalanche Hotspots. Landslides 2006, 3, 159–173. [Google Scholar] [CrossRef]
  3. Cruden, D.M.; Varnes, D.J. Landslides Types and Processes. Landslide: Investigation and Mitigation, Transportation Research Board; Natural Academy Press: Washington, DC, USA, 1994. [Google Scholar]
  4. Hürlimann, M.; Rickenmann, D.; Medina, V.; Bateman, A. Evaluation of Approaches to Calculate Debris-Flow Parameters for Hazard Assessment. Eng. Geol. 2008, 102, 152–163. [Google Scholar] [CrossRef]
  5. Jakob, M.; Stein, D.; Ulmi, M. Vulnerability of Buildings to Debris Flow Impact. Nat. Hazards 2012, 60, 241–261. [Google Scholar] [CrossRef]
  6. Tofani, V.; Del Ventisette, C.; Moretti, S.; Casagli, N. Integration of Remote Sensing Techniques for Intensity Zonation within a Landslide Area: A Case Study in the Northern Apennines, Italy. Remote Sens. 2014, 6, 907–924. [Google Scholar] [CrossRef] [Green Version]
  7. Solari, L.; Bianchini, S.; Franceschini, R.; Barra, A.; Monserrat, O.; Thuegaz, P.; Bertolo, D.; Crosetto, M.; Catani, F. Satellite Interferometric Data for Landslide Intensity Evaluation in Mountainous Regions. Int. J. Appl. Earth Obs. Geoinf. 2020, 87, 102028. [Google Scholar] [CrossRef]
  8. Kim, M.-I.; Kwak, J.-H. Assessment of Building Vulnerability with Varying Distances from Outlet Considering Impact Force of Debris Flow and Building Resistance. Water 2020, 12, 2021. [Google Scholar] [CrossRef]
  9. Novellino, A.; Cesarano, M.; Cappelletti, P.; Di Martire, D.; Di Napoli, M.; Ramondini, M.; Sowter, A.; Calcaterra, D. Slow-Moving Landslide Risk Assessment Combining Machine Learning and InSAR Techniques. Catena 2021, 203, 105317. [Google Scholar] [CrossRef]
  10. Arattano, M.; Marchi, L. Measurements of Debris Flow Velocity through Cross-Correlation of Instrumentation Data. Nat. Hazards Earth Syst. Sci. 2005, 5, 137–142. [Google Scholar] [CrossRef] [Green Version]
  11. Dorren, L.K.A.; Berger, F.; le Hir, C.; Mermin, E.; Tardif, P. Mechanisms, Effects and Management Implications of Rockfall in Forests. For. Ecol. Manag. 2005, 215, 183–195. [Google Scholar] [CrossRef]
  12. Bardi, F.; Raspini, F.; Frodella, W.; Lombardi, L.; Nocentini, M.; Gigli, G.; Morelli, S.; Corsini, A.; Casagli, N. Monitoring the Rapid-Moving Reactivation of Earth Flows by Means of GB-InSAR: The April 2013 Capriglio Landslide (Northern Appennines, Italy). Remote Sens. 2017, 9, 165. [Google Scholar] [CrossRef] [Green Version]
  13. Duncan, J.M. State of the art: Limit equilibrium and finite-element analysis of slopes. J. Geotech. Eng. 1996, 122, 577–596. [Google Scholar] [CrossRef]
  14. Pastor, M.; Blanc, T.; Haddad, B.; Petrone, S.; Sanchez Morles, M.; Drempetic, V.; Issler, D.; Crosta, G.B.; Cascini, L.; Sorbino, G.; et al. Application of a SPH Depth-Integrated Model to Landslide Run-out Analysis. Landslides 2014, 11, 793–812. [Google Scholar] [CrossRef] [Green Version]
  15. Lan, H.; Derek Martin, C.; Lim, C.H. RockFall Analyst: A GIS Extension for Three-Dimensional and Spatially Distributed Rockfall Hazard Modeling. Comput. Geosci. 2007, 33, 262–279. [Google Scholar] [CrossRef]
  16. Hungr, O. A Model for the Runout Analysis of Rapid Flow Slides, Debris Flows, and Avalanches. Can. Geotech. J. 1995, 32, 610–623. [Google Scholar] [CrossRef]
  17. Wichmann, V. The Gravitational Process Path (GPP) Model (v1.0)–A GIS-Basedsimulation Framework for Gravitational Processes. Geosci. Model Dev. 2017, 10, 3309–3327. [Google Scholar] [CrossRef] [Green Version]
  18. Prochaska, A.B.; Santi, P.M.; Higgins, J.D.; Cannon, S.H. A study of methods to estimate debris flow velocity. Landslides 2008, 5, 431–444. [Google Scholar] [CrossRef]
  19. Carlà, T.; Intrieri, E.; Di Traglia, F.; Nolesini, T.; Gigli, G.; Casagli, N. Guidelines on the Use of Inverse Velocity Method as a Tool for Setting Alarm Thresholds and Forecasting Landslides and Structure Collapses. Landslides 2017, 14, 517–534. [Google Scholar] [CrossRef] [Green Version]
  20. Corominas, J.; van Westen, C.; Frattini, P.; Cascini, L.; Malet, J.-P.; Fotopoulou, S.; Catani, F.; Van Den Eeckhaut, M.; Mavrouli, O.; Agliardi, F.; et al. Recommendations for the Quantitative Analysis of Landslide Risk. Bull. Eng. Geol. Environ. 2014, 73, 209–263. [Google Scholar] [CrossRef]
  21. Fell, R.; Corominas, J.; Bonnard, C.; Cascini, L.; Leroi, E.; Savage, W.Z. Guidelines for landslide susceptibility, hazard and risk zoning for land-use planning. Eng. Geol. 2008, 102, 99–111. [Google Scholar] [CrossRef] [Green Version]
  22. Pudasaini, S.P.; Krautblatter, M. The Landslide Velocity. Earth Surf. Dyn. 2022, 10, 165–189. [Google Scholar] [CrossRef]
  23. Bayer, B.; Simoni, A.; Mulas, M.; Corsini, A.; Schmidt, D. Deformation Responses of Slow Moving Landslides to Seasonal Rainfall in the Northern Apennines, Measured by InSAR. Geomorphology 2018, 308, 293–306. [Google Scholar] [CrossRef]
  24. Raspini, F.; Bianchini, S.; Ciampalini, A.; Del Soldato, M.; Solari, L.; Novali, F.; Del Conte, S.; Rucci, A.; Ferretti, A.; Casagli, N. Continuous, Semi-Automatic Monitoring of Ground Deformation Using Sentinel-1 Satellites. Sci. Rep. 2018, 8, 7253. [Google Scholar] [CrossRef] [PubMed] [Green Version]
  25. Crippa, C.; Valbuzzi, E.; Frattini, P.; Crosta, G.B.; Spreafico, M.C.; Agliardi, F. Semi-Automated Regional Classification of the Style of Activity of Slow Rock-Slope Deformations Using PS InSAR and SqueeSAR Velocity Data. Landslides 2021, 18, 2445–2463. [Google Scholar] [CrossRef]
  26. Pawluszek-Filipiak, K.; Borkowski, A.; Motagh, M. Multi-Temporal Landslide Activity Investigation by Spaceborne SAR Interferometry: The case study of Polish Carpathians. Remote Sens. Appl. Soc. Environ. 2021, 24, 100629. [Google Scholar] [CrossRef]
  27. Heim, A. Bergsturz und Menschenleben; Fretz und Wasmuth: Zurich, Switzerland, 1932. [Google Scholar]
  28. Cignetti, M.; Manconi, A.; Manunta, M.; Giordan, D.; De Luca, C.; Allasia, P.; Ardizzone, F. Taking Advantage of the ESA G-POD Service to Study Ground Deformation Processes in High Mountain Areas: A Valle d’Aosta Case Study, Northern Italy. Remote Sens. 2016, 8, 852. [Google Scholar] [CrossRef] [Green Version]
  29. Ratto, S.; Giardino, M.; Giordan, D.; Alberto, W.; Armand, M. Carta dei Fenomeni Franosi della Valle d’Aosta; Tipografia Valdostana: Aosta, Italy, 2007. [Google Scholar]
  30. Trigila, A.; Iadanza, C.; Guerrieri, L. The IFFI Project (Italian Landslide Inventory): Methodology and Results. Guidelines for Mapping Areas at Risk of Landslides in Europe; APAT: Rome, Italy, 2007; pp. 15–18. [Google Scholar] [CrossRef]
  31. Trigila, A.; Iadanza, C. Landslides in Italy. Special Report; Italian National Institute for Environmental Protection and Research (ISPRA): Rome, Italy, 2008.
  32. Ratto, S.; Bonetto, F.; Comoglio, C. The October 2000 Flooding in Valle d’Aosta (Italy): Event Description and Land Planning Measures for the Risk Mitigation. Int. J. River Basin Manag. 2003, 1, 105–116. [Google Scholar] [CrossRef]
  33. Giardino, M.; Giordan, D.; Ambrogio, S.G.I.S. Technologies for Data Collection, Management and Visualization of Large Slope Instabilities: Two Applications in the Western Italian Alps. Nat. Hazards Earth Syst. Sci. 2004, 4, 197–211. [Google Scholar] [CrossRef]
  34. Cossart, E.; Braucher, R.; Fort, M.; Bourlès, D.L.; Carcaillet, J. Slope Instability in Relation to Glacial Debuttressing in Alpine Areas (Upper Durance Catchment, Southeastern France): Evidence from Field Data and 10Be Cosmic Ray Exposure Ages. Geomorphology 2008, 95, 3–26. [Google Scholar] [CrossRef]
  35. Martinotti, G.; Giordan, D.; Giardino, M.; Ratto, S. Controlling Factors for Deep-Seated Gravitational Slope Deformation (DSGSD) in the Aosta Valley (NW Alps, Italy). Geol. Soc. Lond. Spec. Publ. 2011, 351, 113–131. [Google Scholar] [CrossRef]
  36. Crosta, G.B.; Frattini, P.; Agliardi, F. Deep Seated Gravitational Slope Deformations in the European Alps. Tectonophysics 2013, 605, 13–33. [Google Scholar] [CrossRef]
  37. Canuti, P.; Casagli, N. Considerazioni sulla Valutazione del Rischio di Frana. Fenomeni Franosi e Centri Abitati. Atti del Convegno di Bologna; Consiglio Nazionale delle Ricerche: Rome, Italy, 1996.
  38. Tarquini, S.; Nannipieri, L. The 10 M-Resolution TINITALY DEM as a Trans-Disciplinary Basis for the Analysis of the Italian Territory: Current Trends and New Perspectives. Geomorphology 2017, 281, 108–115. [Google Scholar] [CrossRef]
  39. Jahn, J. Entwaldung und Steinschlag. In Proceedings of the International Congress Interpraevent, Graz, Austria, 4–8 July 1988; Volume 1, pp. 185–198. [Google Scholar]
  40. Zinggeler, A. Steinschlagsimulation in Gebirgswa Ldern: Modellierung der Relevanten Teilprozesse. Master’s Thesis, University of Bern, Bern, Switzerland, 1990; p. 116. [Google Scholar]
  41. Gsteiger, P. Steinschlagschutzwald. Ein Beitrag zur Abgrenzung, Beurteilung und Bewirtschaftung. Schweiz. Z. Forstwes. 1993, 144, 115–132. [Google Scholar]
  42. Doche, O. Etude Experimentale de Chutes de Blocs en Forêt. In Cemagref Doc. 97/0898; Cemagref/Institut des Sciences et Techniques de Grenoble (ISTG): Grenoble, France, 1997; p. 130. [Google Scholar]
  43. Perret, S.; Dolf, F.; Kienholz, H. Rockfalls into Forests: Analysis and Simulation of Rockfall Trajectories -Considerations with Respect to Mountainous Forests in Switzerland. Landslides 2004, 1, 123–130. [Google Scholar] [CrossRef]
  44. Iverson, R.M. The Physics of Debris Flows. Rev. Geophys. 1997, 35, 245–296. [Google Scholar] [CrossRef] [Green Version]
  45. Rickenmann, D. Empirical relationships for debris flows. Nat. Hazards 1999, 19, 47–77. [Google Scholar] [CrossRef]
  46. Goetz, J.; Kohrs, R.; Parra Hormazábal, E.; Bustos Morales, M.; Belén Araneda Riquelme, M.; Henríquez, C.; Brenning, A. Optimizing and Validating the Gravitational Process Path Model Forregional Debris-Flow Runout Modelling. Nat. Hazards Earth Syst. Sci. 2021, 21, 2543–2562. [Google Scholar] [CrossRef]
  47. Perla, R.; Cheng, T.T.; McClung, D.M. A two-parameter model of snow-avalanche motion. J. Glaciol. 1980, 26, 197–207. [Google Scholar] [CrossRef] [Green Version]
  48. Salvatici, T.; Tofani, V.; Rossi, G.; D’Ambrosio, M.; Tacconi Stefanelli, C.; Masi, E.B.; Rosi, A.; Pazzi, V.; Vannocci, P.; Petrolo, M.; et al. Application of a physically based model to forecast shallow landslides at a regional scale. Nat. Hazards Earth Syst. Sci. 2018, 18, 1919–1935. [Google Scholar] [CrossRef] [Green Version]
  49. D’Ambrosio, M.; Tofani, V.; Rossi, G.; Salvatici, T.; Tacconi Stefanelli, C.; Rosi, A.; Masi, E.B.; Pazzi, V.; Vannocci, P.; Catani, F.; et al. Application of regional physically-based landslide early warning model: Tuning of the input parameters and validation of the results. In EGU General Assembly Conference Abstracts; EGU: Munich, Germany, 2017; p. 13712. [Google Scholar]
  50. Hungr, O. Dynamics of Rapid Landslides. In Progress in Landslide Science; Springer: Berlin/Heidelberg, Germany, 2007; pp. 47–57. [Google Scholar] [CrossRef]
  51. Bellugi, D.G.; Milledge, D.G.; Cuffey, K.M.; Dietrich, W.E.; Larsen, L.G. Controls on the size distributions of shallow landslides. Proc. Natl. Acad. Sci. USA 2021, 118, e2021855118. [Google Scholar] [CrossRef]
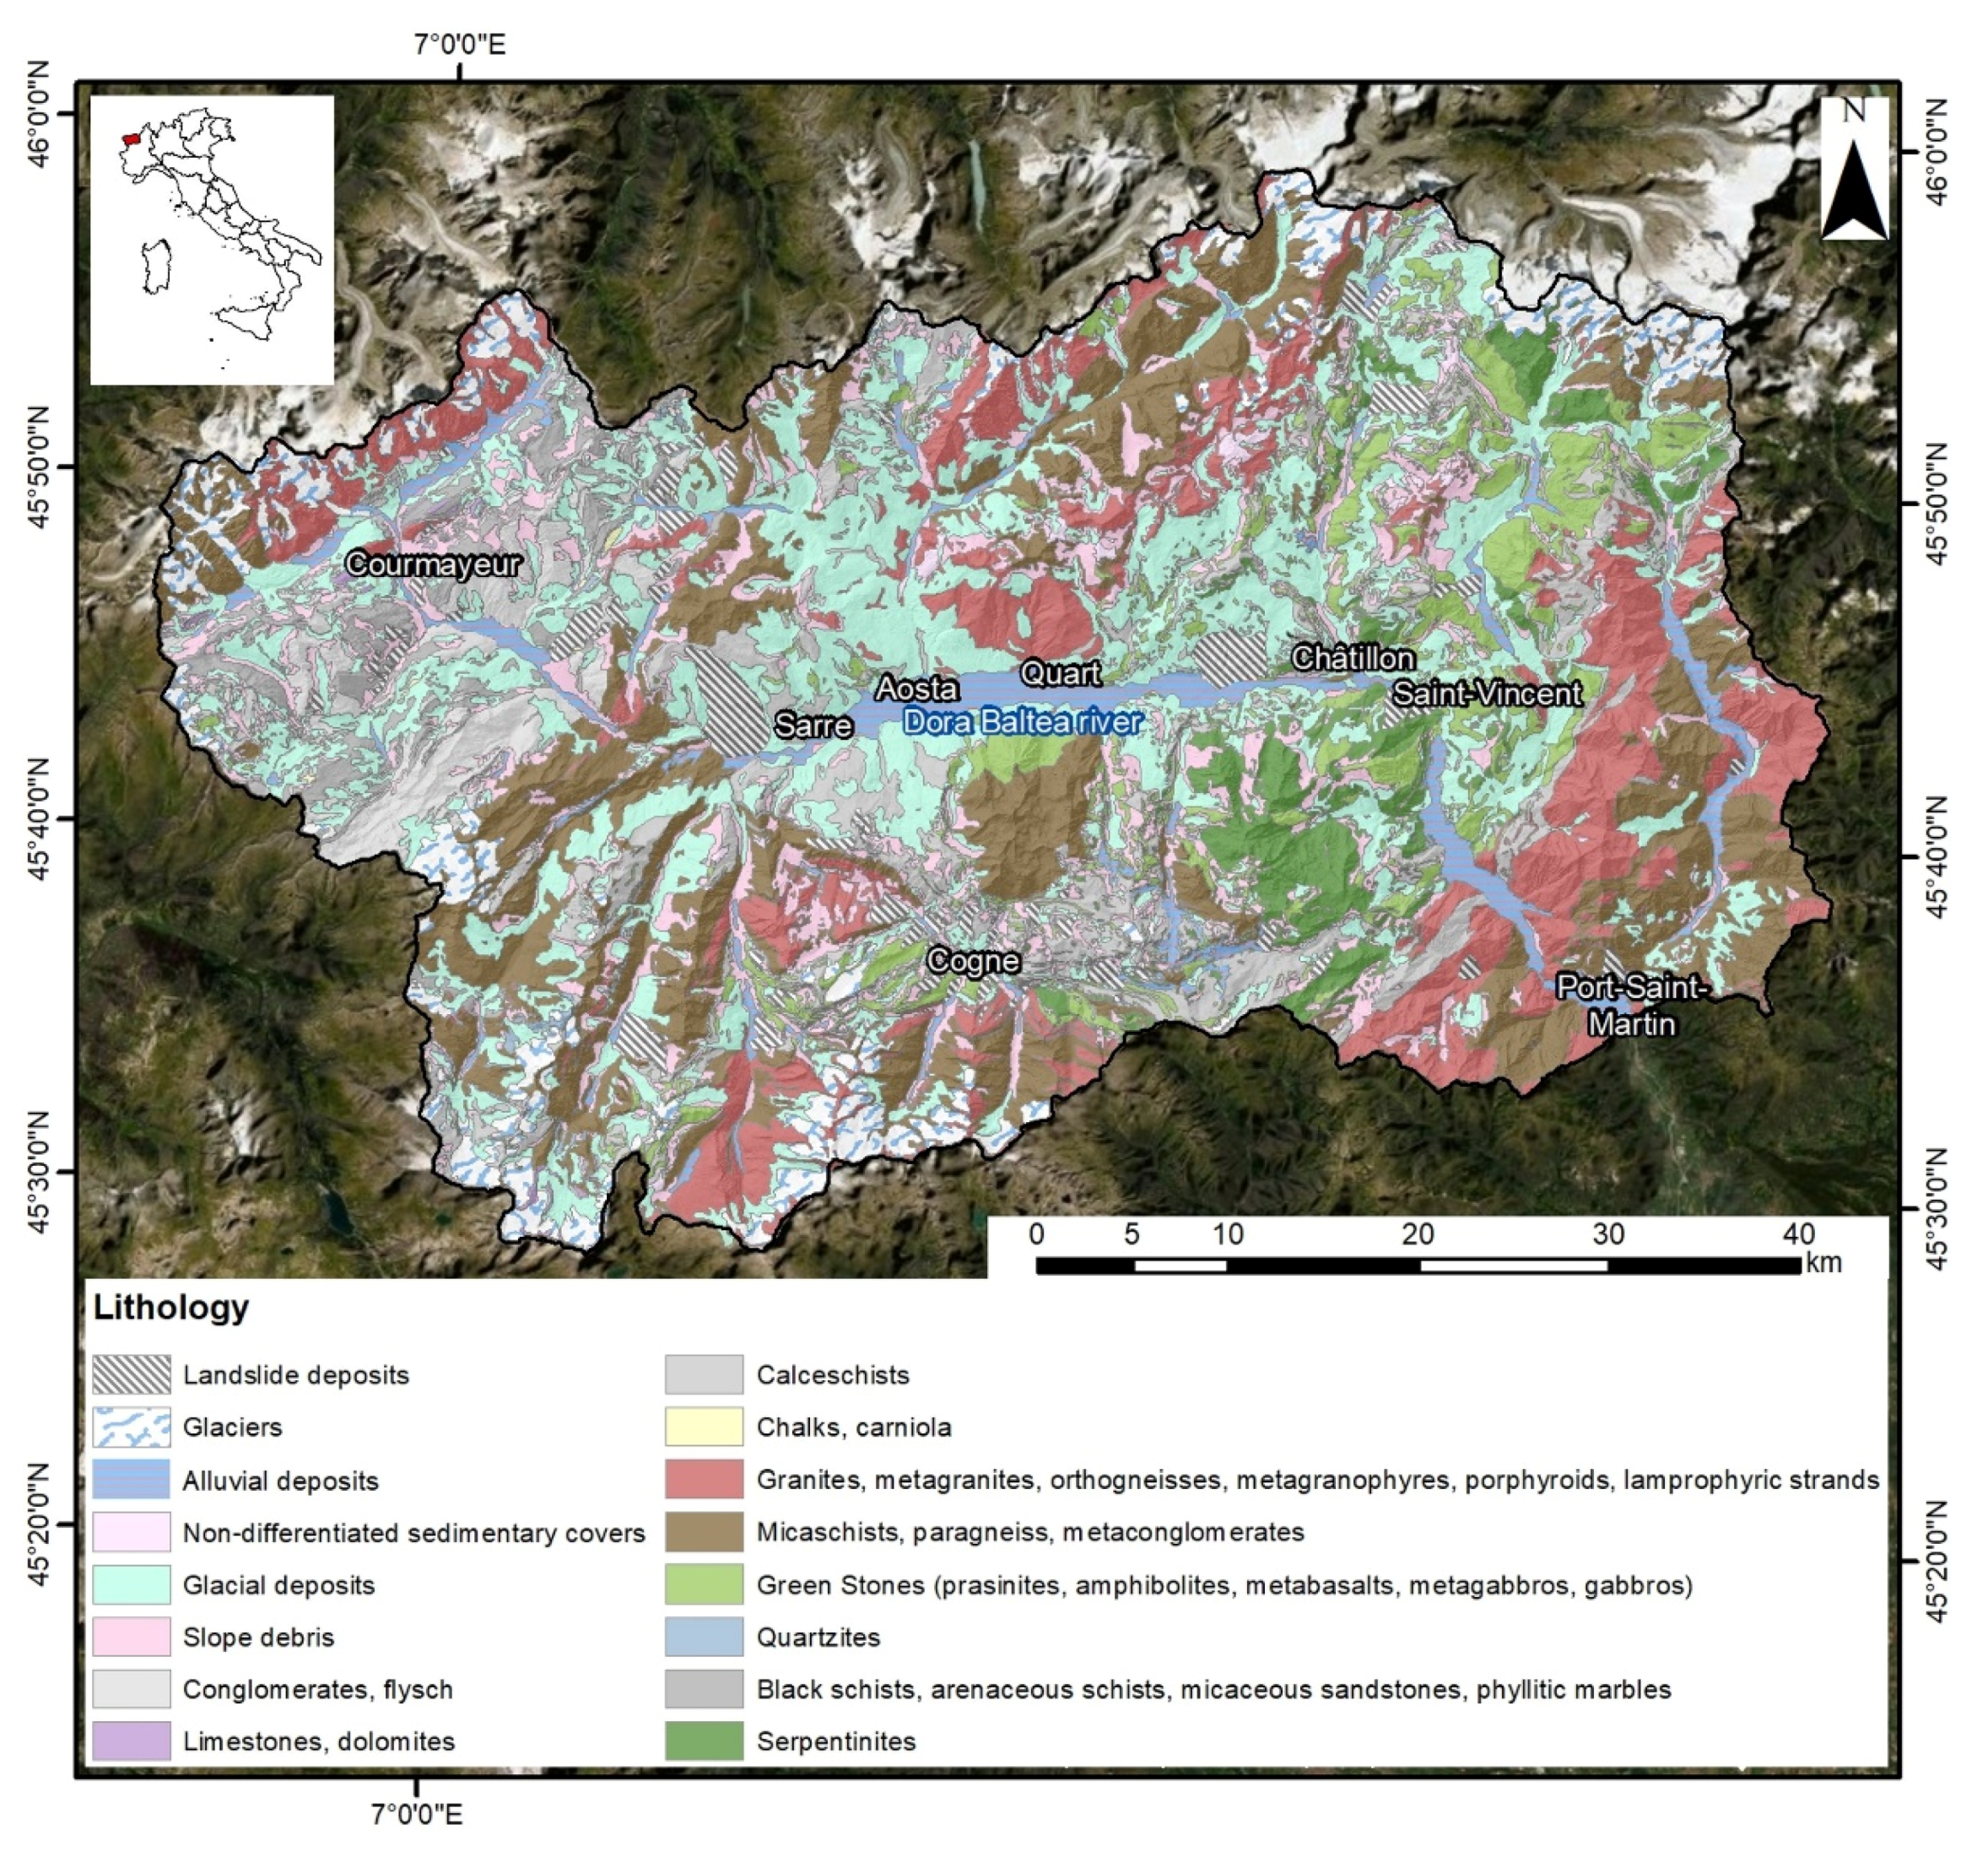
Figure 1. Litho-technical map of the Valle d’Aosta Region, Italy, distributed by regional authorities.
Geosciences 12 00177 g001
Figure 2. Digital elevation model of the study area with overlapping Dora Baltea River network and the IFFI landslide inventory [30,31].
Geosciences 12 00177 g002
Figure 3. Slide model of a landslide; CM = centre of mass of the displaced body; u = potential energy; k = kinetic load; w = work of the friction forces; φa= apparent angle of friction (tan φa = (1 − ru)tan φ’, where ru represents the ratio of water pressure to total vertical lithostatic pressure) (modified from Canuti and Casagli [37]).
Geosciences 12 00177 g003
Figure 4. Graphical representation of a generic landslide based on the Heim Energy Line method; the parameters obtained with a specific Matlab routine are indicated.
Geosciences 12 00177 g004
Figure 5. Velocity values of a shallow landslide obtained by a Matlab code based on the Heim method. The continuous black line corresponds to the landslide boundary, and the black point to the release reference point according to the IFFI inventory.
Geosciences 12 00177 g005
Figure 6. Velocity values of a rockfall obtained by a Matlab code based on the Heim method. The continuous black line corresponds to the landslide boundary, and the black point to the release reference point according to the IFFI inventory.
Geosciences 12 00177 g006
Figure 7. Velocity values of the shallow landslide, shown in Figure 5, obtained by the GPP model. The continuous black line corresponds to the landslide boundary, and the black point to the release reference point according to the IFFI inventory.
Geosciences 12 00177 g007
Figure 8. Velocity values of a rockfall, shown in Figure 7, obtained by the GPP model. The continuous black line corresponds to the landslide boundary, and the black point to the release reference point according to the IFFI inventory.
Geosciences 12 00177 g008
Figure 9. Other examples of the application of the proposed method and GPP model. (a) Velocity values of a shallow landslide obtained by a Matlab code based on the Heim method; (b) velocity values of the same shallow landslide shown in (a) obtained by the GPP model; (c) velocity values of a rockfall obtained by a Matlab code based on Heim method; (d) velocity values of the same rockfall shown in (c) obtained by the GPP model. In all the figures, the continuous black line corresponds to the landslide boundary, and the black point to the release reference point according to the IFFI inventory.
Geosciences 12 00177 g009
Figure 10. Graph of correlation between the proposed method and GPP model maximum velocity values for ten selected rockfalls. Each point shown in the graph represents the maximum velocity value of a rockfall computed with the two methods.
Geosciences 12 00177 g010
Figure 11. Graph of correlation between the proposed method and GPP model maximum velocity values for ten selected shallow landslides. Each point shown in the graph represents the maximum velocity value of a shallow landslide computed with the two methods.
Geosciences 12 00177 g011
Figure 12. Boxplots of the velocity values of the selected sample of rockfalls. The full-colour boxplots refer to the proposed method velocity values, and the dashed ones to the GPP velocity values. The colours correspond to those used in Figure 10. The boxplot consists of a box, delimited by the first and third quartiles, with the median value reported inside, and two whiskers that connect the box to the minimum and maximum value.
Geosciences 12 00177 g012
Figure 13. Boxplots of the velocity values of the selected sample of shallow landslides. The full-colour boxplots refer to the proposed method velocity values, and the dashed ones to the GPP velocity values. The colours correspond to those used in Figure 11. The boxplot consists of a box, delimited by the first and third quartiles, with the median value reported inside, and two whiskers that connect the box to the minimum and maximum value.
Geosciences 12 00177 g013
Publisher’s Note: MDPI stays neutral with regard to jurisdictional claims in published maps and institutional affiliations.