Article

Geophysical and Geochemical Proxies of Neolithic Sites from Thessaly: A Comparative Study on the Potential of Soil Magnetic Susceptibility and Phosphate Analyses for Minimally Invasive Location and Interpretation of Buried Features

1
Department of Archaeology & Cultural History, NTNU University Museum, Norwegian University of Science & Technology (NTNU), Erling Skakkes Gate 47B, 7012 Trondheim, Norway
2
Department of Geophysics, School of Geology, Aristotle University of Thessaloniki, 54124 Thessaloniki, Greece
3
School of Biological and Environmental Sciences, University of Stirling, Stirling FK9 4LA, UK
4
Laboratory of Georesources, Water Researches and Technologies Center (CERTE), Technopole of Borj-Cedria, BP 273, Soliman 8020, Tunisia
5
Dig Humanities Geo Informatics Lab, Sylvia Ioannou Chair on Digital Humanities, Archaeological Research Unit, Department of History and Archaeology, University of Cyprus, Nicosia 1678, Cyprus
*
Author to whom correspondence should be addressed.
Geosciences 2023, 13(1), 3; https://doi.org/10.3390/geosciences13010003
Submission received: 1 November 2022 / Revised: 15 December 2022 / Accepted: 15 December 2022 / Published: 21 December 2022

Abstract

:
This paper presents the results of a study exploring the potential of magnetic-susceptibility and phosphate soil analyses to locate and characterize buried Neolithic settlements in Thessaly, Greece. Using the preliminary results of large-area magnetometer surveys, soil samples were collected at three well-known sites along exploratory lines and augers targeting the locations of possible features of interest, including habitational structures and enclosures. The results demonstrated the capability of these analyses to detect the sites, outline hotspots and better interpret the features identified in the magnetometer results.

1. Introduction

In archaeology, geophysical and geochemical methods can be used to define variations of a range of soil physical properties (e.g., magnetic susceptibility) or soil element concentrations (e.g., phosphorus) as proxy indicators for past human occupation. In particular, these methods have been used to prospect (i.e., locate) subsurface sites or identify past activity areas and are considered minimally invasive [1,2,3,4,5,6]. An essential aspect to obtain meaningful results by using these methods is that there is sufficient variation or contrast between the physicochemical properties of the subsurface and those of the surrounding soil environment.
In the early compartmentalized approaches, the geophysical and soil geochemical methods tended to be used separately in archaeological prospection, whereas the trend now is their integration [7]. Integrated approaches that combine geophysics and soil physicochemical characterization have proven useful in characterizing traditionally challenging survey environments and provide complementary information about site features, stratigraphy and the surrounding paleoenvironment [8,9,10,11,12,13,14,15,16,17,18]. In other words, such integration has the potential to develop a better understanding of the identified proxy signatures/responses, hence improving the overall interpretation [19]. Whilst the number of integrated studies has been increasing in the last years and encouraged even more since 2018 with the creation of COST Action SAGA (https://www.saga-cost.eu (accessed on 1 November 2022)), the cases in Greek archaeology are scarce or nonexistent.
This paper shows the results of a comparative investigation carried out as part of the IGEAN project (https://www.ims.forth.gr/en/project/view?id=68 (accessed on 1 November 2022)). The project focused on the geophysical characterization of Neolithic sites in Thessaly (Greece), a key region to understand the introduction and expansion of the Neolithic culture in Europe. Large-area-coverage surveys were carried out by using satellite/aerial imagery, photogrammetry and magnetometry. These were complemented with targeted surveys, using electromagnetic induction (EMI), electrical resistance and ground-penetrating radar. The results of the geophysical surveys provided a great deal of information about the geometry and spatial distribution of previously unknown buried structures at more than 20 sites [20,21,22]. The goal of the study reported here was to assess the capability of minimally invasive soil sampling and ‘low-cost’ analyses (magnetic susceptibility and phosphate) to locate such sites and provide extra information about specific geophysical anomalies related to possible habitational structures and enclosures, as revealed with the magnetometer surveys. The targeted habitational structures and enclosures investigated in this study are common features that have been found in the few sites that have been excavated in Thessaly. Their makeup, use or function are still not fully understood by archaeologists.

2. Materials and Methods

2.1. Study Sites

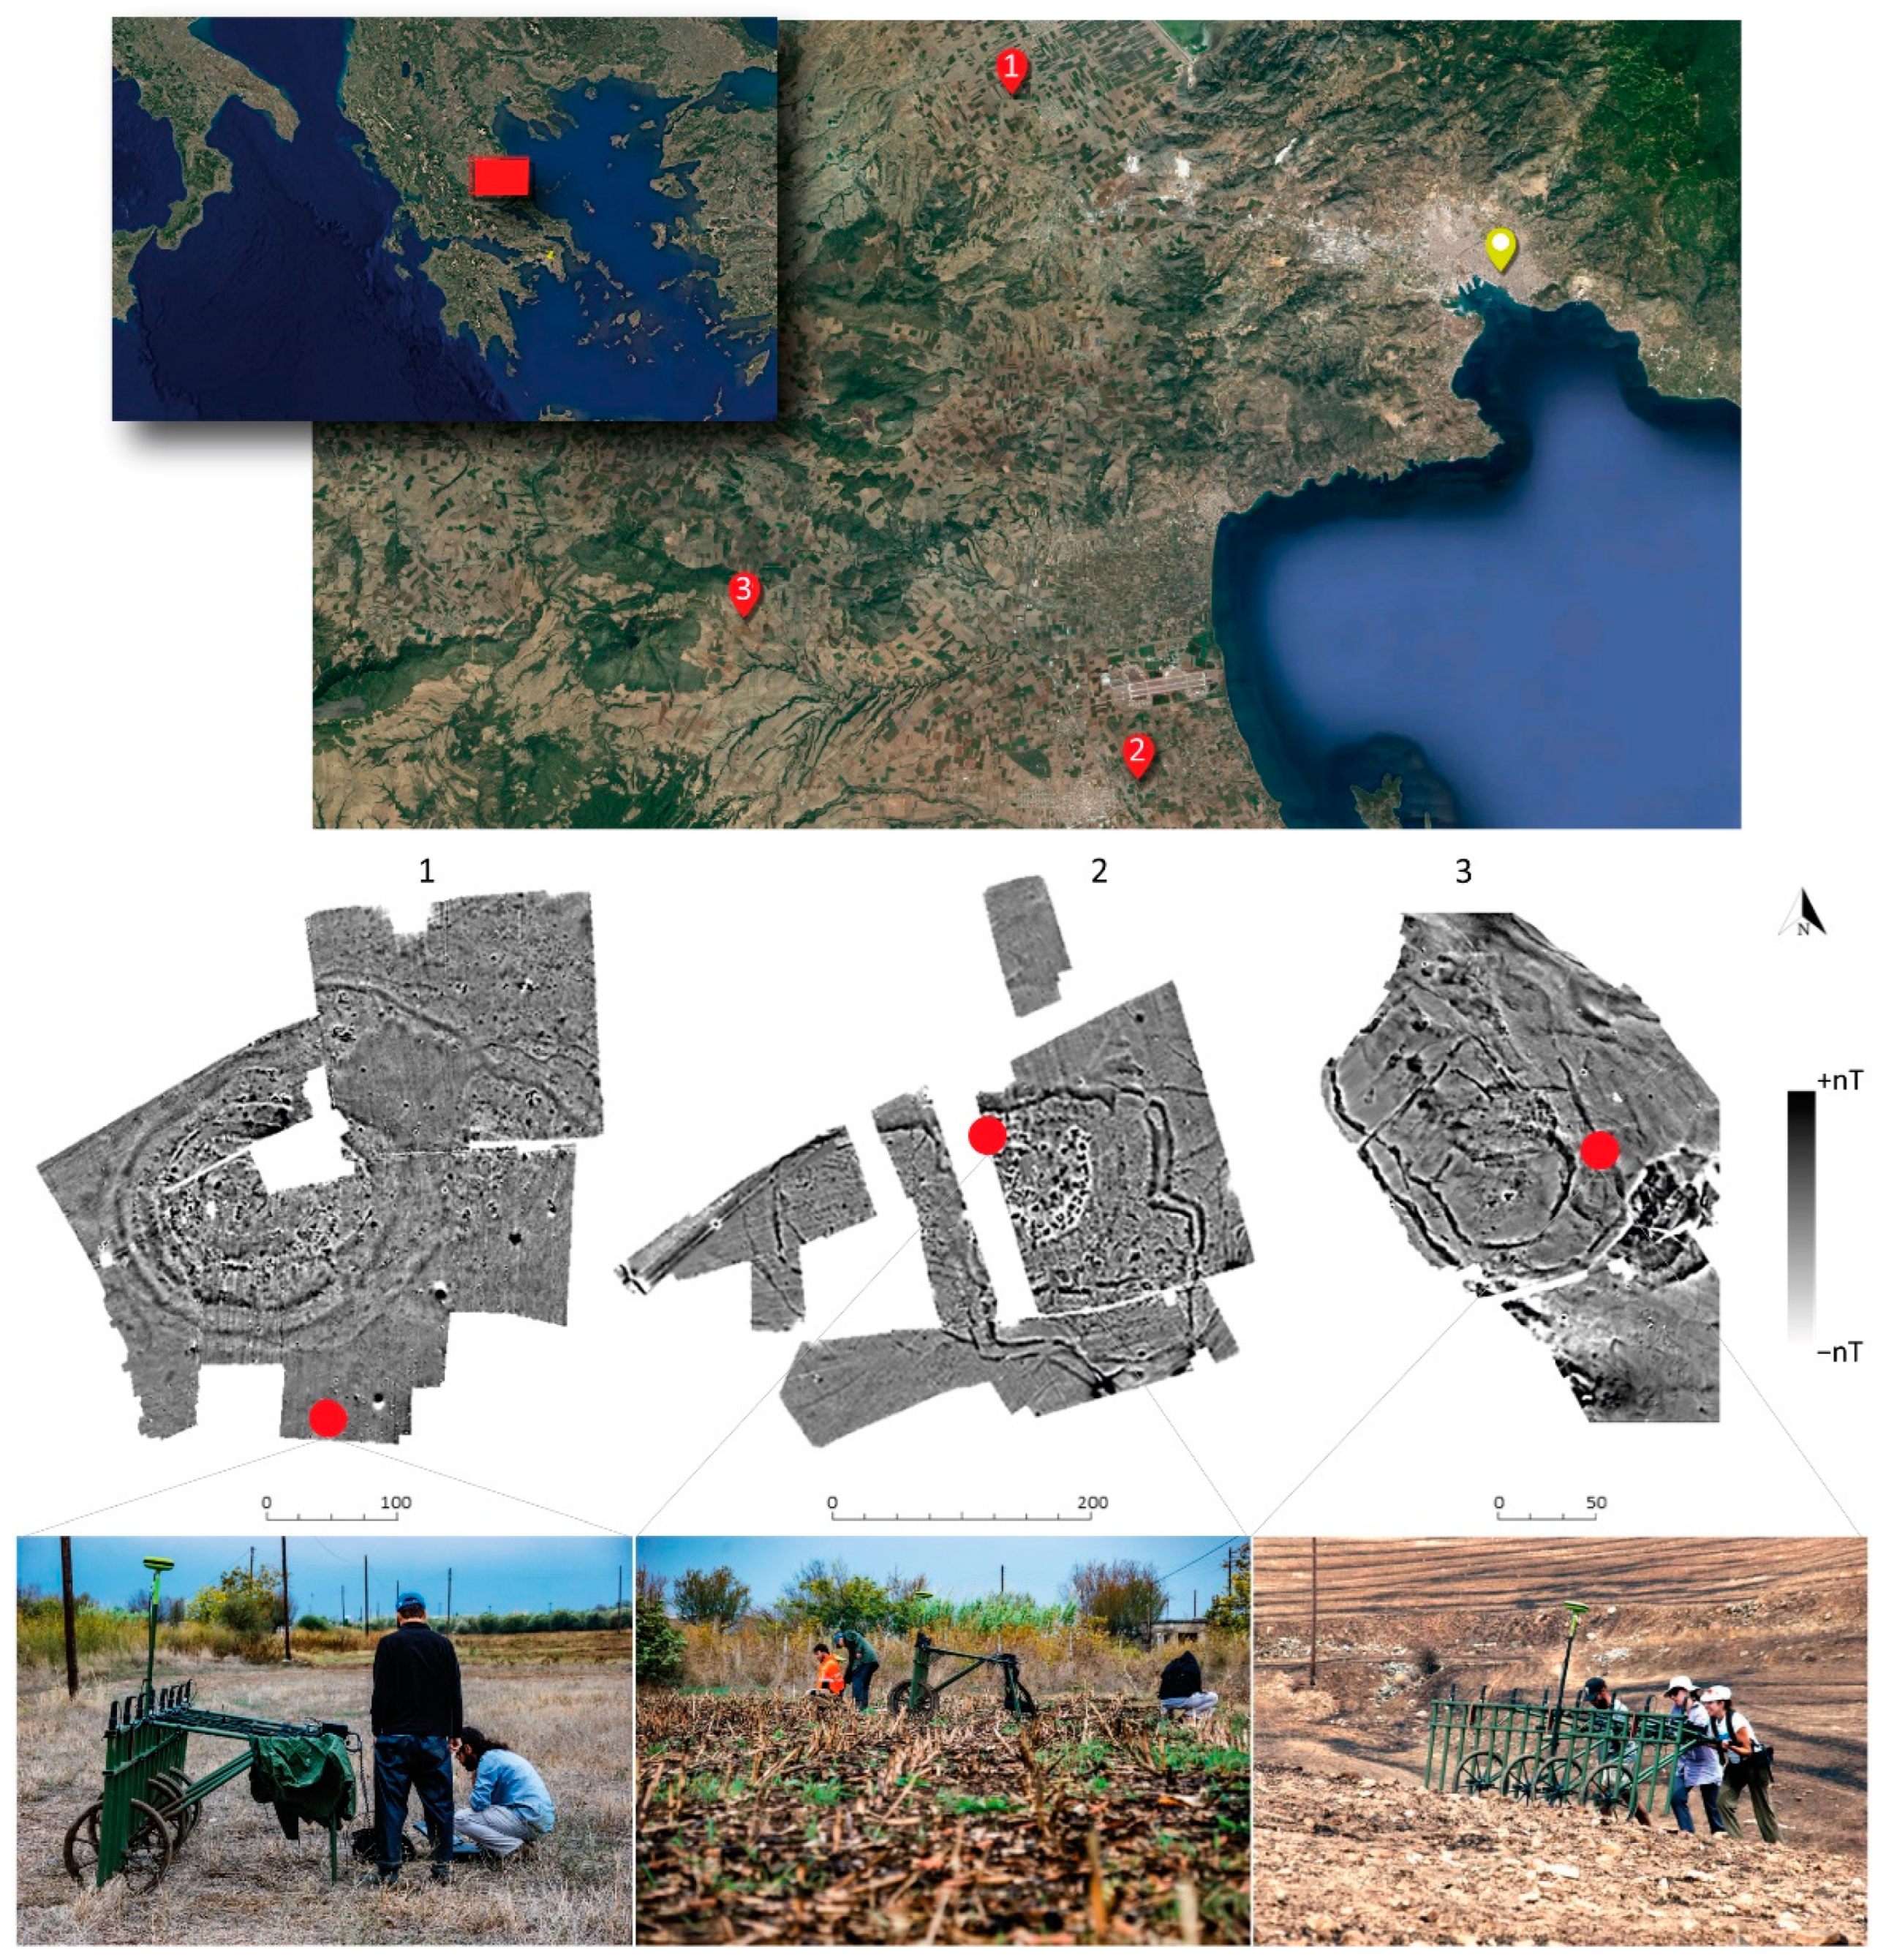
The location of the three sites used in this study (Rizomilos, Almyriotiki and Perdika II) is shown in Figure 1. These were selected in terms of the general good quality of the results obtained with the previous magnetometer surveys (including the presence of structural remains and well-defined ditched-like anomalies) and their typology (including tell-type and flat extended sites). Table 1 summarizes some characteristics of the environmental settings defining each case site. The sites were identified and dated by surface concentration of diagnostic Neolithic pottery and other finds. Further information related to the archaeological investigations carried out about the surface finds and dating is available at the webGIS platform developed by the IGEAN project (https://igean.ims.forth.gr/?q=el/archaeological-sites (accessed on 1 November 2022)).

2.2. Large-Area Magnetometer Survey Data

The extensive magnetometer surveys that were undertaken before the soil sampling explored the subsurface of several Neolithic sites and surrounding environs to reveal buried features. This type of geophysical survey measures disturbances of the Earth’s magnetic field caused by the presence of other discrete magnetic fields originating from buried features. Magnetic anomalies are generated through the measurement of both remanent magnetization (often thermoremanent) and induced magnetization that characterize the material properties of such buried features or deposits. Whilst thermoremanence magnetization can result after intense burning, the more common induced magnetization characterizing archaeological features and deposits derives from the fact that almost all soils exhibit an enhancement of magnetic susceptibility in the topsoil [23]. Magnetometry can provide a rapid mapping and a good definition of the shape and orientation of subsurface archaeological features. However, it cannot quantitatively discriminate between remanent or induced magnetic anomalies. It measures the strength of the magnetic field (the total field or just a component, depending on the type of instrument) in nanoTesta (nT) or nT/m resulting from the total magnetization generated by the subsurface features and the local geogenic magnetic background.
Ungridded data collection was carried out during three field campaigns in August 2013 and July/August 2014, using a Sensys Magneto MX-V3 modular large area magnetometer with eight fluxgate vertical gradiometers (FGM650) spaced 0.5 m apart and navigated through real-time kinematic DGPS. Datasets were minimally processed by using the Magneto software and included coordinates transformation, overlap correction and image gridding. Further processing was carried out by other in-house software, following the outline described by Sarris [24]. The results provided a wide range of magnetic anomalies (Figure 1) that were further explored with the soil analyses reported in this paper.

2.3. Soil Sampling Using Explorative Lines and Augering

A total of 712 soil samples were collected at the three sites between the 14 and 22 October 2014 by a team of two people and using an AMS American Falls auger (Table 2). The weather conditions during the sampling were dry and sunny. The samples were taken along explorative lines, running from side to side across the targets (Figure 2). Taking into account the stratigraphy information provided by previous geophysical results (i.e., GPR data) and preliminary site observations, the soil was initially collected along the explorative lines at two depths to assess the variability of the results (0.20–0.25 m and 0.25–0.30 m in Rizomilos/Almyriotiki, and 0.10–0.15 m and 0.15–0.20 m in Perdika II). These were quite similar, so the final sampling depth was established at 0.25–0.30 m in Rizomilos/Almyriotiki, and 0.15–0.20 m in Perdika II. The spacing of the sampling points along each line varied accordingly with the size of the targeted features. Some points along the exploratory lines were sampled in-depth (hereafter ‘augers’) in order to investigate specific features (e.g., ditch-enclosures and possible thermo-remanent structures). Control samples were taken outside the known site area to assess the background readings at each site. Each sampling point was surveyed by using a differential GPS.
After the removal of organic material (e.g., worms and roots), the soil samples were sealed in air-free plastic bags, with labeling, and stored in a dark environment (cardboard box). The samples were immediately air-dried at room temperature and stored until analysis to reduce geochemical alteration of the samples. The air-dried soils were homogenized and sub-sampled for different types of analyses.

2.4. Soil Analyses

2.4.1. Magnetic Susceptibility

Magnetic susceptibility (χ) is a physical property that describes how ‘magnetizable’ a material is in response to an applied magnetic field. In soils, the magnetic properties are dominated by the presence, form and abundance of iron oxides. Ferrimagnetic minerals in soils can be inherited from the parent material and enhanced by burning events and other biochemical processes (e.g., fermentation, redox and bacterial mechanisms developed in soils) that are able to transform the magnetic form of such oxides into stronger ones [25]. The relationship between enhanced magnetic susceptibility and buried archaeological deposits (e.g., ancient burning; and cut-and-backfilled ‘negative’ archaeological features, such as ditched-enclosures) has been used in archaeology to define sites and characterize buried anthropogenic deposits [26]. The objective of this analysis was to identify enhancements in soil magnetic susceptibility that could indicate the presence of the site/features (exploratory lines) and characterize the backfill deposits of the targeted features (augers) to provide more information about their makeup and use/function. Unlike the variations in the intensity of the earth’s magnetic field measured during a magnetometer survey, where the characteristics of buried remains are instinctively derived from remanent or induced magnetization (as explained in Section 2.2), magnetic susceptibility focuses on the induced part.
Routine measurements were carried out by using a Bartington Susceptibility MS3 m attached to a MS2B dual frequency sensor and connected to a USB port of a laptop. The samples were put into pre-weight 10 cm3 plastic cups provided by Bartington. The pots were completely full to minimize movement of the grains inside the cup and avoid errors in volume calculations. The samples were then weighed to calculate mass-specific magnetic susceptibility (χ 10−6 m3 kg−1), which considers differences in sample density and makes measurements more comparable. The samples were also measured at low (χlf) and at high (χhf) frequencies (0.46 and 4.6 kHz, respectively) to calculate the frequency-dependent susceptibility (χfd), which is expressed as a percentage of the low-frequency measurement (χfd% = 100 ((χlf χhf)/χlf)). This is a standard semi-quantitative way to establish the presence of ultrafine (<0.03 μm) superparamagnetic (SP) ferrimagnetic minerals. These grains, developed by biochemical processes, can be present in samples as crystals and be indicative of anthropogenic activity [27]. If ultrafine minerals are present in samples, the measurement will produce slightly lower values at a high frequency than at a low frequency due to a delay between the application of the magnetic field and the magnetization of the sample. Samples without SP minerals will show identical values at the two frequencies. An increase in χfd suggests an increase in SP grains, and a high χlf and high χfd are potentially indicative of burnt soil or other developed deposits related to intense human activity [28,29,30,31].

2.4.2. Phosphate Analysis

Anomalous concentrations of certain elements can be derived from past human activity (e.g., manuring and metalworking) and be fixed to the mineral surfaces of soil grains. Phosphorus is one of these markers [32]. Phosphorus quickly bonds with soil calcium, iron and aluminum ions to form relatively stable phosphate compounds. It exists in soil in both organic and inorganic forms (e.g., as inorganic phosphate minerals or organic phosphate esters). General sources of anthropogenic phosphorus include human waste, intentional soil enrichment for agriculture, or burials. The objective of this analysis was to identify enhancements in phosphate that could define the presence of the site/feature (exploratory lines). This analysis was carried out only in one auger point (Almyriotiki, Line 2) to obtain complementary information about the use/function of the targeted features.
The molybdovanadate method was used for the phosphate analysis in this study. This is a method that looks at the ‘total’ phosphate content of a sample by extracting both anthropogenic and geological phosphate derived from organic and inorganic phosphate forms. The basic idea of this method is to reduce vanadomolybdophosphoric compounds in an acidic environment. Phosphate reacts with molybdate in an acid medium and produces a mixed phosphate/molybdate complex. In the presence of vanadium, yellow molybdovanadophosphoric acid is formed. The intensity of the yellow color is proportional to the phosphate concentration. A spectrophotometer measures the capacity of each sample solution to absorb a specific wavelength of light. Initially, five grams of air-dried, less than 0.250 mm soil was burnt at 5500 °C and then dissolved in 21 mL of hydrochloric acid (1 M) at 1200 °C for 20 min. The solution was filtered through Whatman No. 2 filter paper, and the filtrate made up a volume of 250 mL by using deionized water. Samples were analyzed by using a Milton Spectronic 20d spectrophotometer at 460 nm. The phosphate content of each sample solution was calculated by using a standard curve, and the results were expressed as parts per million (ppm). A standard curve for each trial was calculated. The points of the curve were determined by spectrophotometer readings on samples of a known phosphate concentration. The parameters of the line equation were then used to plot the archaeological samples on the standard curve.

2.4.3. Data Integration

The results of the magnetic-susceptibility and phosphate analyses were initially edited in Excel, and some basic stats were calculated. Text files were imported in ArcMap, and maps were created by using graduated symbols and Natural Breaks (Jerks) classification. These results were analyzed overlying the different geophysical datasets in ArcMap environment.
To compare the results of the magnetometer results with those from the soil analyses, the data collected was imported into Geosoft, using Oasis Montaj software. The overlapped data were suppressed, and the format of the obtained files was corrected to be readable with Geosoft software. The obtained maps consist of the interpolation of the magnetometer data that were corrected by using the minimum curvature interpolation. We superposed the soil sampling lines on the magnetic maps to extract the magnetic-gradient profiles (Gr) located on the sampled lines. The visualization of the magnetic-gradient variation with the soil analyses enabled us to understand if there is or is not a correlation between the different physical and chemical parameters.

3. Results

Supplementary Tables S1–S3 (ST1_Rizomilos, ST2_Almyriotiki and ST3_Perdika II) containing the χlf, χhf, χfd and phosphate data are available at https://doi.org/10.5281/zenodo.7133280 (accessed on 1 November 2022).

3.1. Rizomilos

3.1.1. Lateral Results (Exploratory Lines 1, 2 and 3)

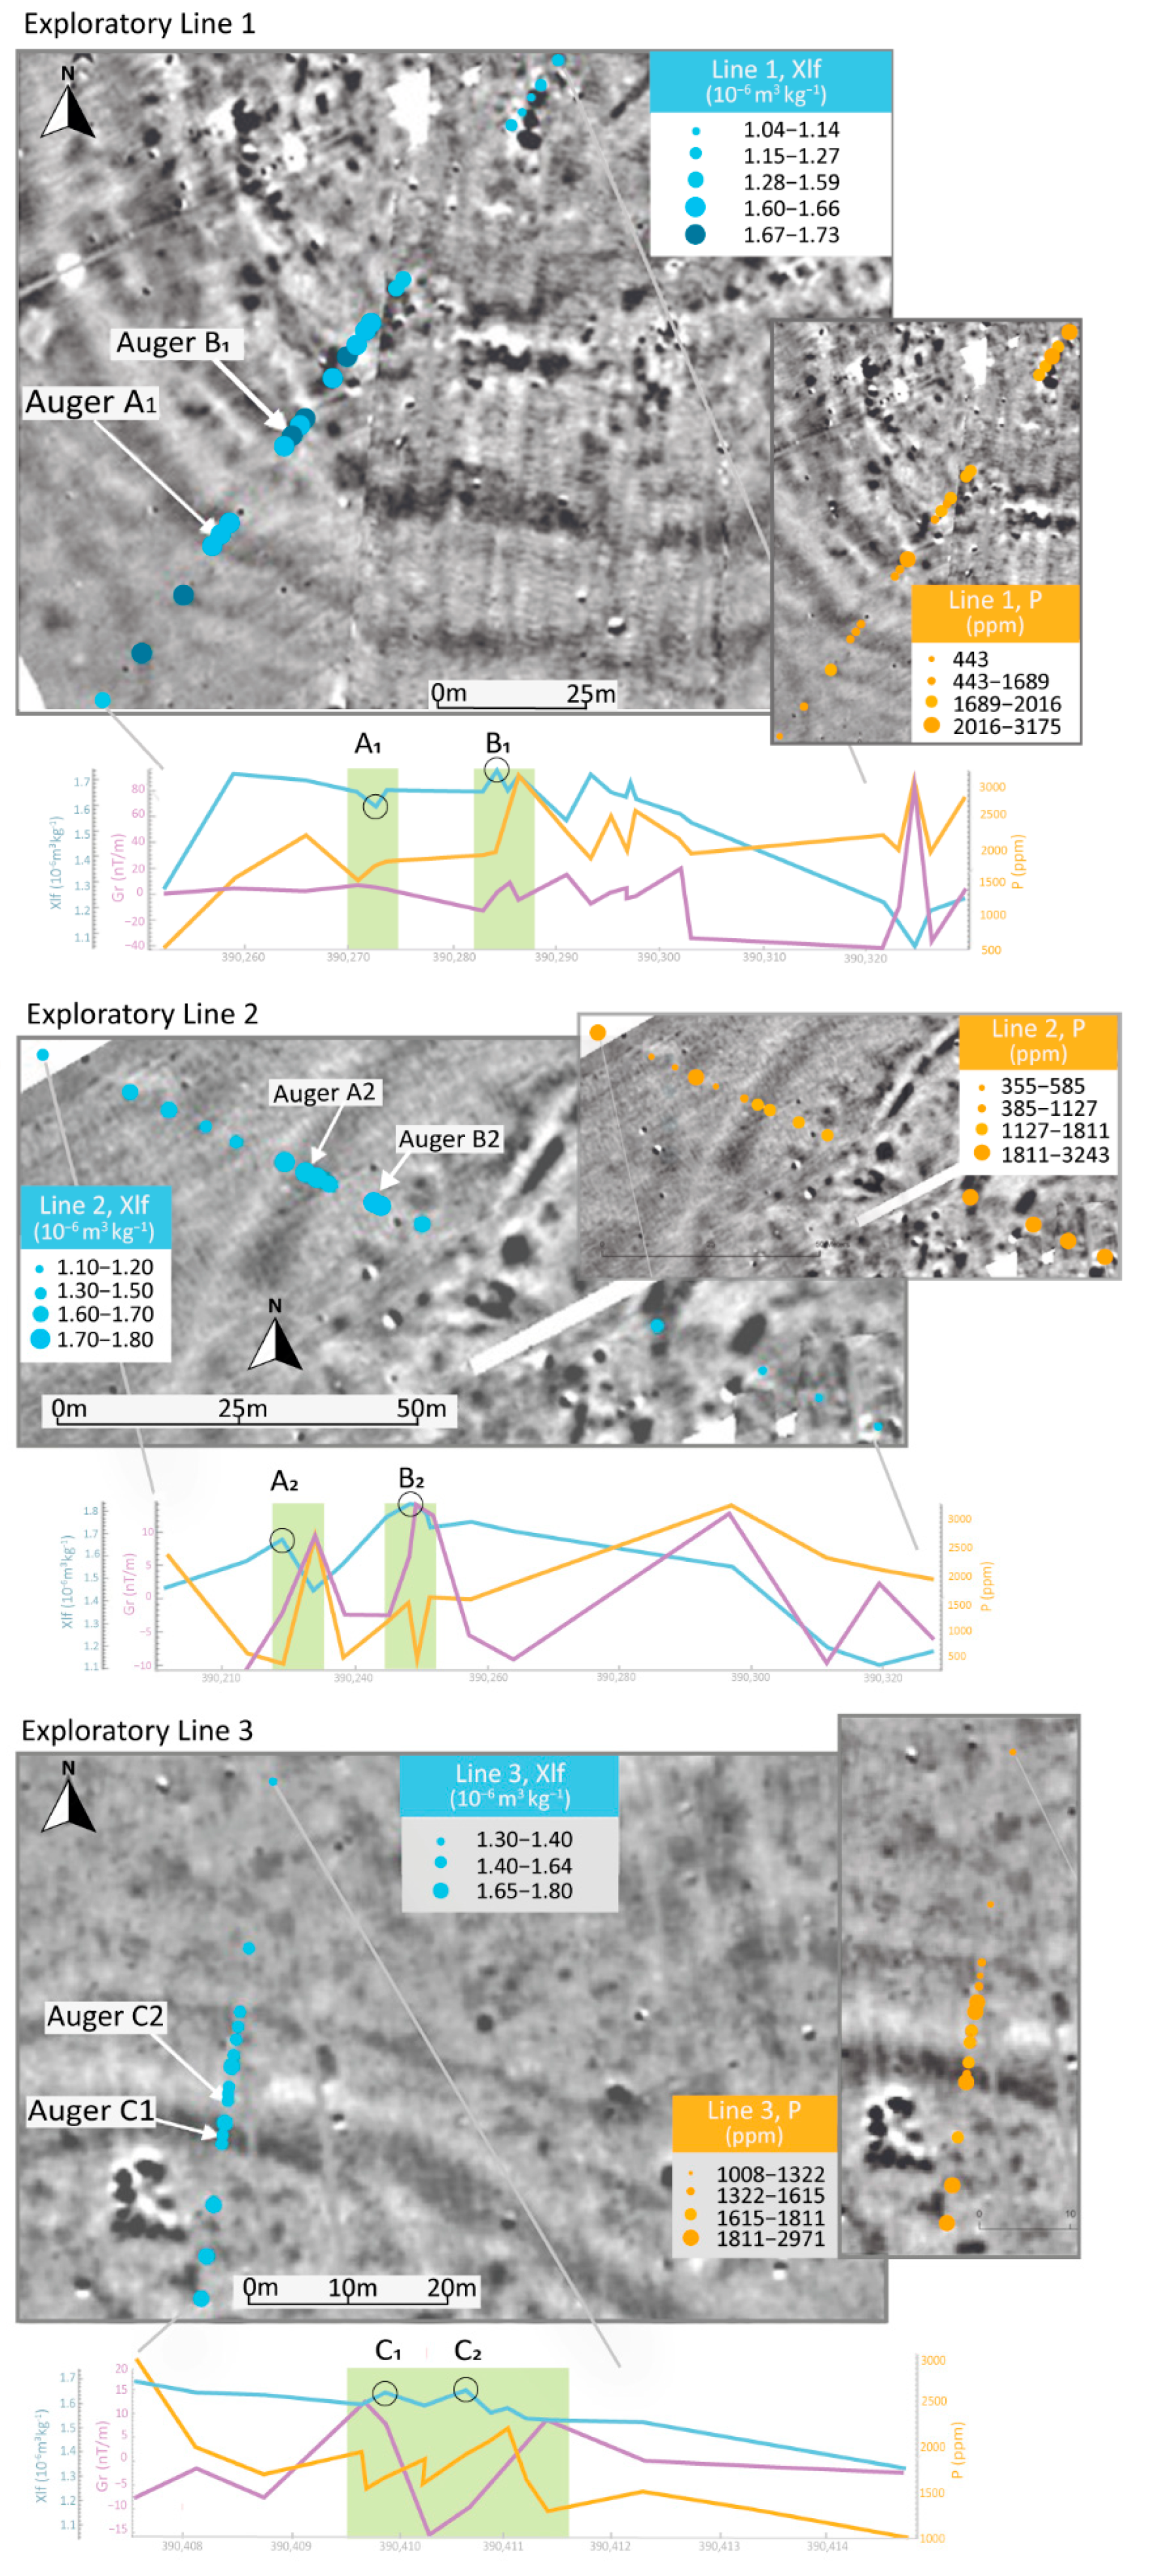
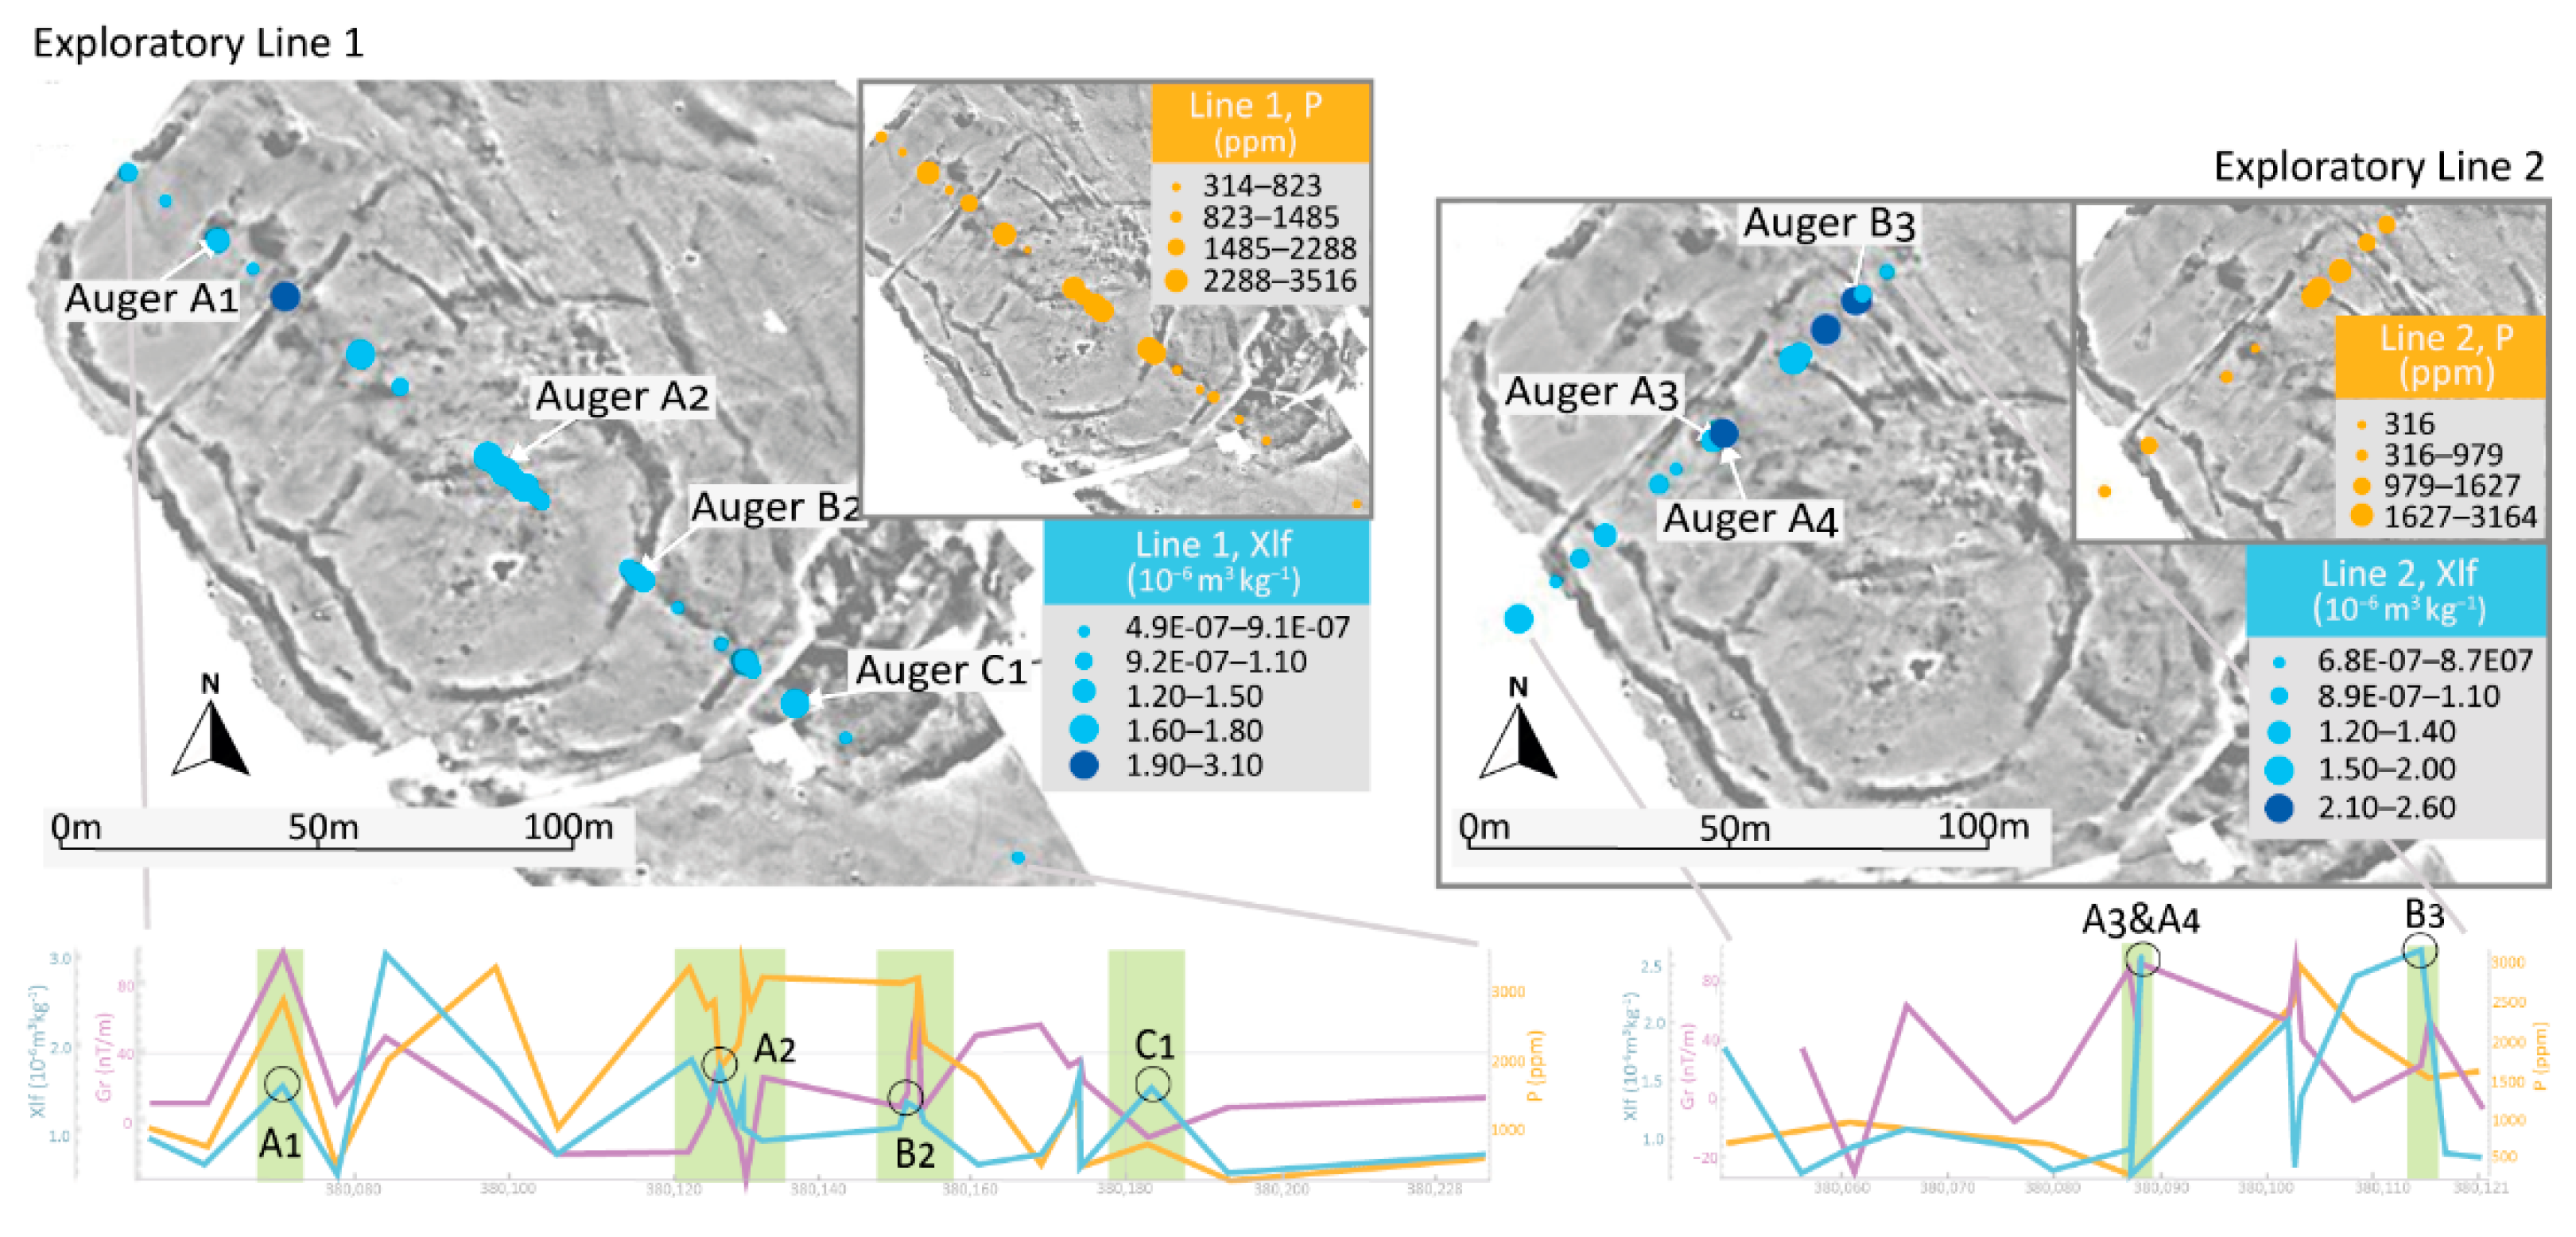
The samples collected over the same targeted positive magnetic anomalies enclosing the center of the site (outermost, A; and innermost, B) along exploratory Lines 1 and 2 produce similar results. The most significant observation of the lateral distribution of magnetic susceptibility of these lines was the unexpected decreased values at the center of the site (Figure 3). The phosphate results showed general increased values towards the center of the site in both lines, as well as an enhancement to the northeast of the innermost ditch-like positive magnetic anomaly (B in Line 1, Figure 3). In Line 1, a distinctive phosphate-concentration peak towards the end of Line 1 (center of the site) correlated with the peak in the intensity of the magnetic gradient, as well as with a trough in χlf.
The samples with the highest magnetic-susceptibility values were those collected on and immediately close to the targeted ditch-like positive magnetic anomalies. The lateral variation of the magnetic-gradient intensity and magnetic susceptibility had a similar pattern. Across these features, the phosphate concentrations were varied, and whilst some areas such as B1 have strongly enhanced phosphate concentrations, others such as those across B2 show little or no enhancement of phosphate compared to the off-site controls. In general, the magnetic-susceptibility values showed a more consistent enhancement associated with the anomalies identified in the magnetic-gradient data than those from the phosphate analysis. The samples collected within the outermost ditch-like anomaly resulted in depleted and enhanced values in (respectively, A1 and A2 in Figure 3) and in reverse for the innermost one (B1 and B2 in Figure 3).
Line 3 targeted a different area but a similar ditch-like positive magnetic anomaly. Different from what was observed in Lines 1 and 2, the magnetic-susceptibility results showed a general increase towards the center of the site (Figure 3). The results of the phosphate analysis also showed a general increase towards the center of the site. Whilst the distance from site center is the dominant trend in both the magnetic-susceptibility and phosphate results, there is a relative enhancement in both across the anomaly in the magnetometer data associated with Auger Points C1 and C2 (Line 3 in Figure 3). At this point, the extracted magnetic gradiometry data show two peaks and a trough, which seems to reflect the nature of magnetic anomaly signatures, at least at this part of the hemisphere, with a negative and a positive part/s [33]. Although Line 3 is further from the site center than Lines 1 and 2, the range of phosphate concentrations is not significantly different from those found along the more centrally located lines. Meanwhile, magnetic-susceptibility measures are higher on average, largely driven by the lower values closest to the center of the site along Lines 1 and 2. The samples collected within the target resulted in very variable phosphate values.

3.1.2. In-Depth Results (Auger Points)

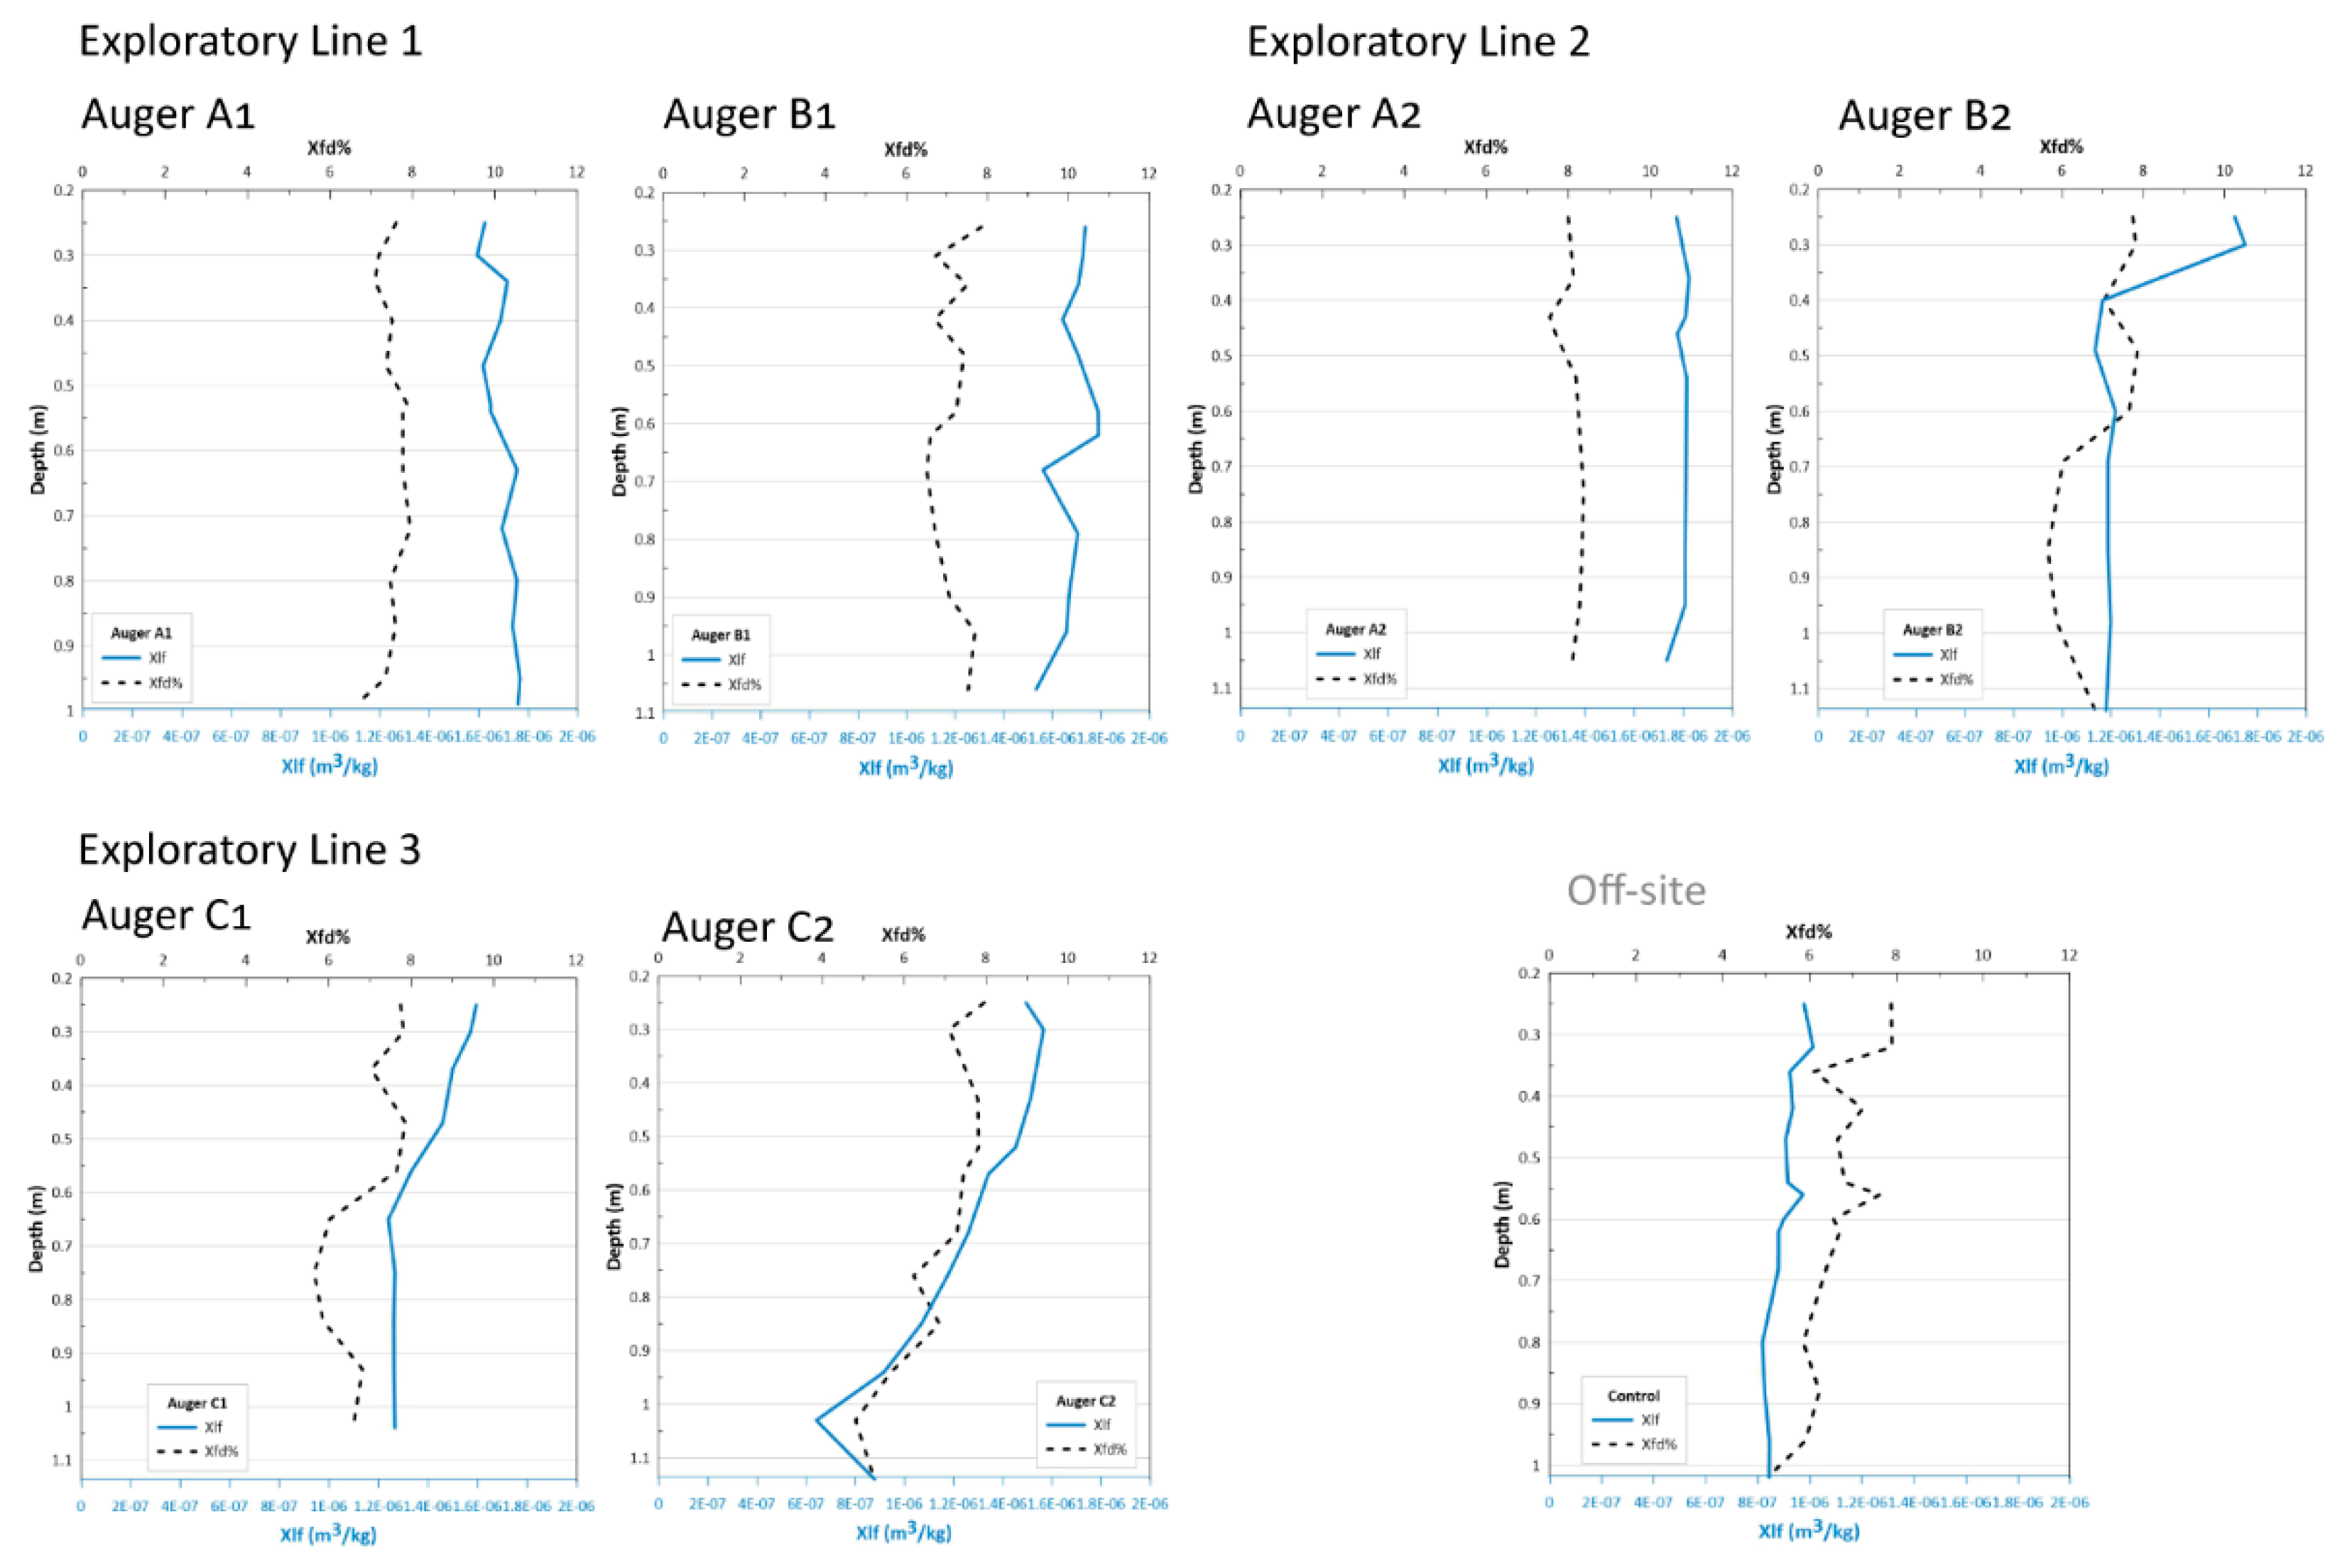
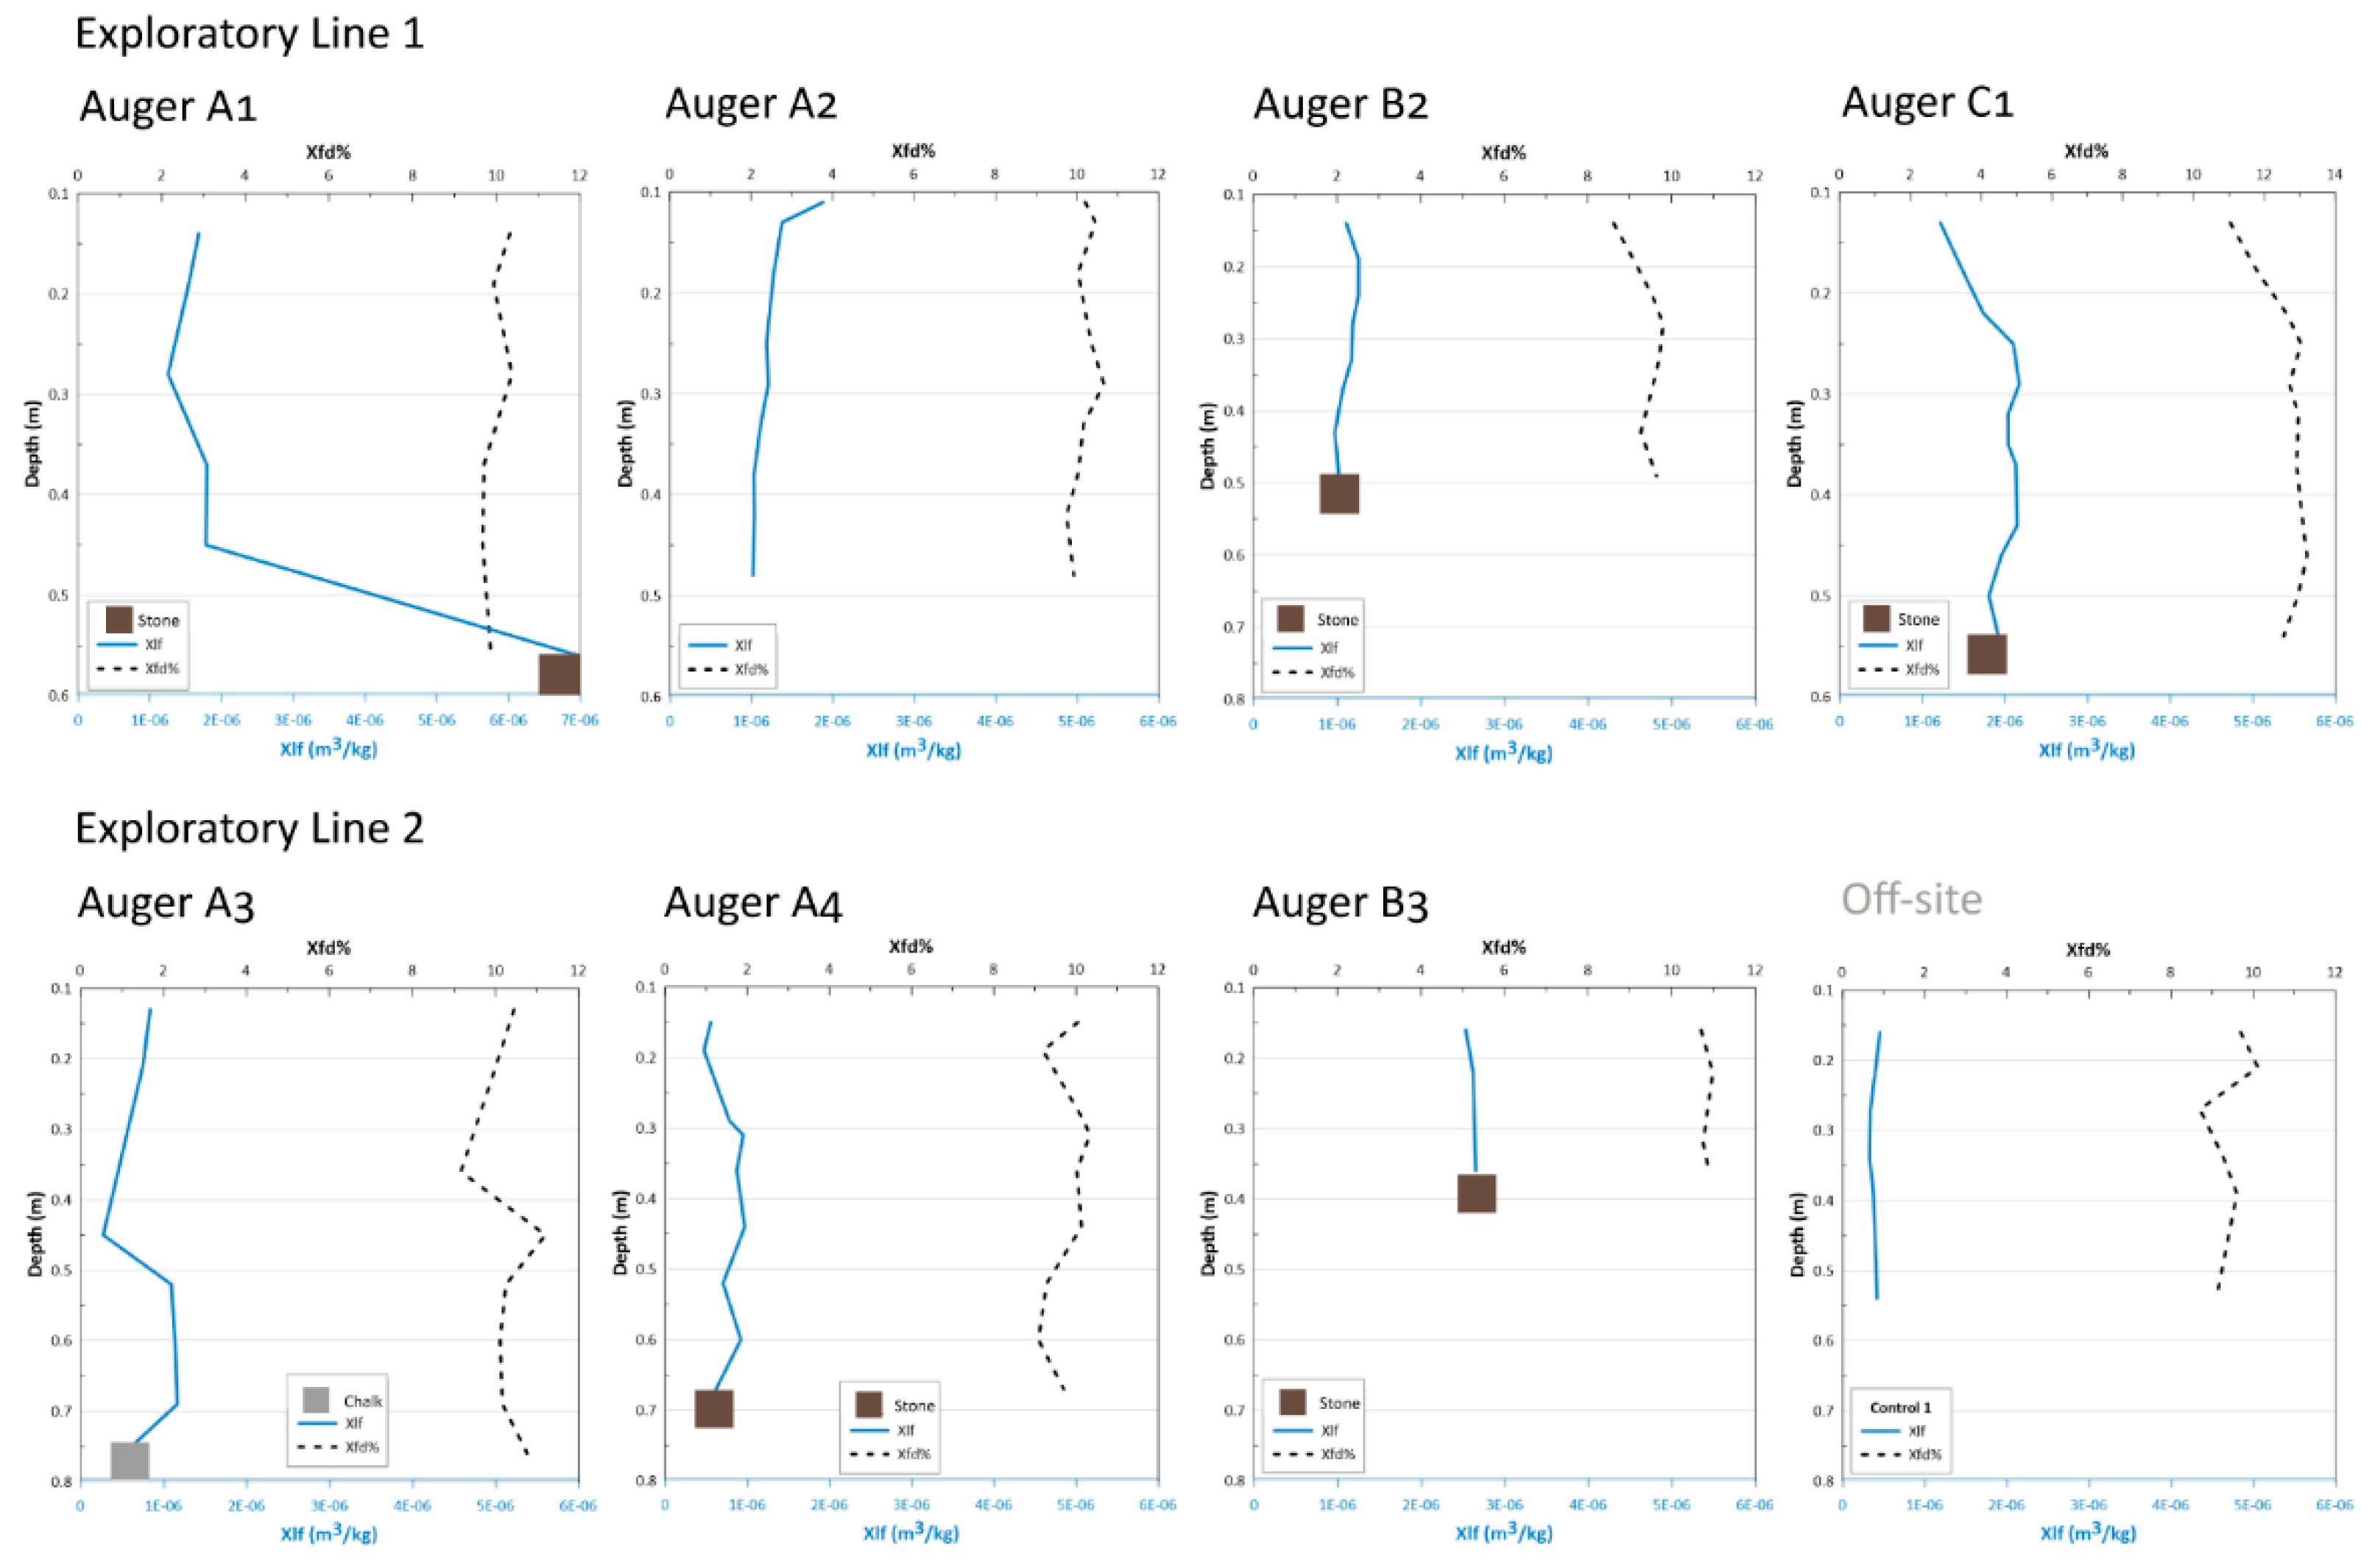
If compared with the off-site samples, the magnetic-susceptibility results of the ‘auger’ samples targeting the two concentric positive magnetic anomalies (outermost (A) and innermost (B) in Lines 1 and 2, Figure 4) showed enhanced values. In Line 1 (Auger A1, Figure 4), a peak value (~1.75 × 10⁻⁶ m3/kg) was measured at 0.63 m depth. Then similar high averaged values followed at least up to 0.99 m. Enhanced values of ~1.77 × 10⁻⁶ m3/kg were observed through the whole Auger A2 (Line 2, Figure 4) up to 1.05 m, without significant variation. Auger B1 (Line 1, Figure 4) showed enhanced χlf values (1.70 × 10⁻⁶ m3/kg) up to 0.96 m in depth, with an averaged peak of 1.79 × 10⁻⁶ m3/kg from 0.52 to 0.62 m in depth. Auger B2 (Line 2, Figure 4) showed a relevant drop in values from 0.40 m in depth. Whilst the idea was to target again the inner ditch-like anomaly in Line 2, it seems that the continuation of the feature in this area is not as clear as in Line 1. The frequency-dependent susceptibility (χfd%) showed similar behavior in both lines, with moderate mean values (~7%) following, in general, the trend of magnetic-susceptibility variation.
The samples taken inside the targeted ditch-like magnetic anomaly in Line 3 (Auger C1 was taken within the positive part of the magnetic anomaly) showed enhanced χlf values, ~1.53 × 10⁻⁶ m3/kg up to 0.47 m (Figure 4). Auger C2 (located in the area of the negative magnetic halo of the targeted feature) also showed averaged values of 1.51 × 10⁻⁶ m3/kg up to 0.52 m depth. The enhanced values obtained from the backfills of this specific feature were ~15% lower than the ditch-like features targeted in Lines 1 and 2. χfd% values are in the same range as in Lines 1 and 2, indicating a mean value of 6.8%.

3.1.3. Correlation of the Proxies at Rizomilos

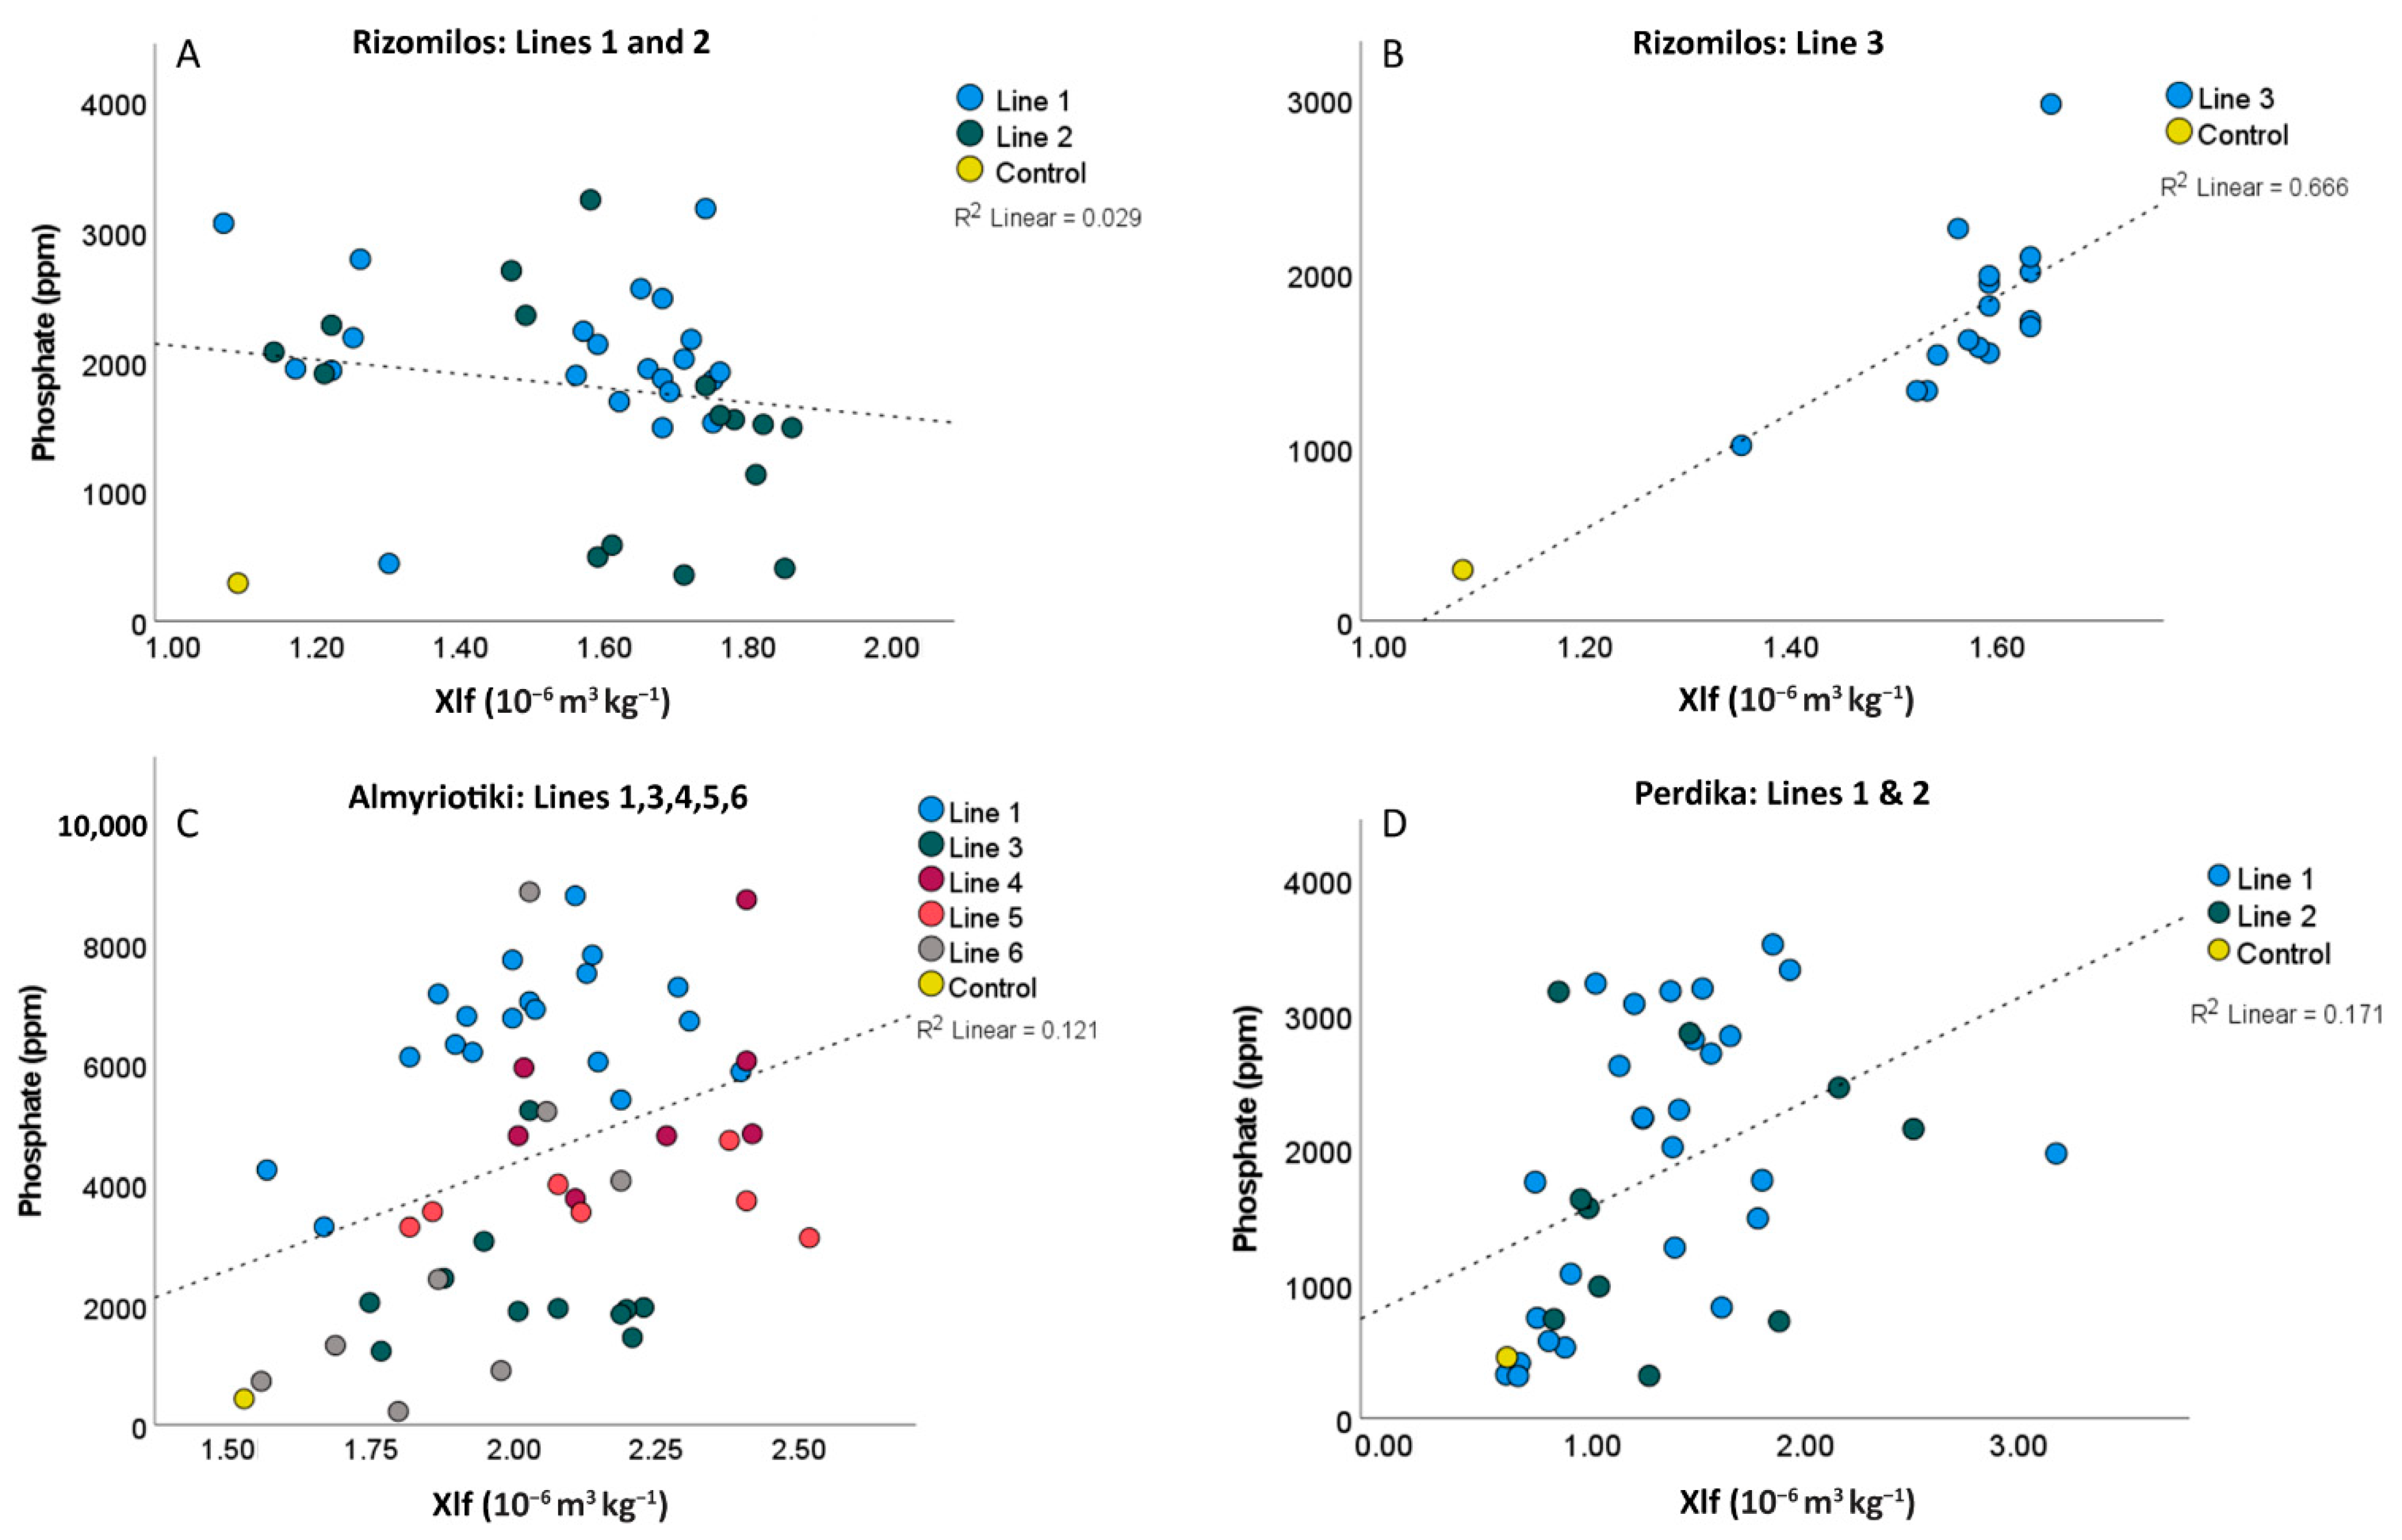
Along Rizomilos’ Lines 1 and 2, the expected positive correlation between χlf and phosphate concentrations was not observed (Figure 5A). However, both were positively correlated along Line 3 (Figure 5B), with both enhanced on-site relative to the off-site controls. The magnetic-susceptibility measurements of the soil samples collected across the concentric ditch-like positive magnetic anomalies enclosing the nucleus of the site (Line 1 and 2 in Figure 3) showed an unexpected depletion towards the center of the site. This reverse pattern to that seen at the other sites in this study could be a consequence of the truncation of putative archaeological layers or structures by agricultural practices at the nucleus (higher area) of the site. Given the presence of the farmstead close to the center of the site (blank area in Figure 2), it is possible that modern levelling and other infrastructure works related to the farm have heavily disturbed this area. An alternative interpretation of this depletion in magnetic susceptibility may be also indicative of a non-built area at the center of the nucleus of the settlement defining an open space or central courtyard. This is a feature that has been seen in the few excavated sites in Thessaly [34] or other surveyed sites though the course of the IGEAN project, such as Visviki and Almyros II [20,35].
On the other hand, the phosphate results of all the line samples showed the expected enhancement from the outside towards the center of the site. Considering the typical makeup of Thessalian tell sites, a buildup of successive layers of occupational debris, including organic matter; the phosphate enhancement; and lack of correlation with magnetic susceptibility could be related to modern inputs of phosphate-rich organic matter from the farm or to thicker enhanced archaeological deposits that have not been as truncated by modern agricultural practices as the structural remains we should expect at this area.
The only clear increasing magnetic-susceptibility pattern towards the center of the site was obtained from Line 3 (Figure 3). The results of the phosphate analysis followed the same pattern. This line crossed the outermost curvilinear anomaly, instead of the concentric ditches mentioned above. The line did not reach the actual center of the main site but reached other positive magnetic anomalies that have been interpreted as possible structures (C16 and C15 in Figure 6). The magnetic-susceptibility and phosphate enhancement here could be related to another potential area of habitation to the south of the targeted longitudinal ditch-like anomaly. Actually, the interpretation of the magnetometer results suggested an earlier site (or satellite settlement) to the east (B5, B6 and C11 in Figure 6).
Whilst the ditch targeted with Line 3 was also characterized by enhanced magnetic susceptibility, the values were lower than those obtained from the concentric ditches (χlf mean = 1.28 × 10⁻⁶ m3/kg, ST1). The χfd results were also significantly lower (mean = 6.90%). These lower values suggested a different type of ditch-like feature and fill material in comparison with the concentric ditches.

3.2. Almyriotiki

3.2.1. Lateral Results (Exploratory Lines 1, 2, 3, 4, 5 and 6)

In Line 1, the lateral results did not show the expected increase in magnetic susceptibility from the outermost of the line towards the center of the site or over Area A or B (Figure 7). This line was collected over the area of the known site and did not extend beyond the surrounding ditch-like enclosure. The only distinctive enhanced χlf value (4.91 × 10⁻⁶ m3 kg−1) with a moderate χfd of 8% was from a sample taken over a positive magnetic anomaly located at the center of the site that correlates with the highest value of the magnetic gradient and a phosphate-concentration peak. Lateral phosphate values were moderately enhanced in the area containing the negative magnetic anomalies (Area B, Figure 7). Line 2 was even shorter and targeted only Area A (possible burnt structures), but the lateral results clearly showed a strong peak in magnetic susceptibility (5.1 × 10⁻⁶ m3 kg−1) with a high χfd of 10% from samples taken at the location of the strong positive magnetic anomalies (Figure 7). This was not the case in Line 1 (Figure 7).
Four lines sampled the net of ditch-like positive magnetic anomalies at different areas: Line 3 at the south across double and parallel ditch-like anomalies; Lines 4 and 5 at the west of the center of the site across a single ditch-like anomaly; and Line 6, the outermost, across two ditch-like anomalies. The results from Line 3 showed a clear magnetic-susceptibility and magnetic-gradient enhancement in the samples located at the center of the targeted anomaly (Figure 7). On the other hand, depleted phosphate values were measured within the targeted feature. Sampling the easternmost of Lines 4 and 5 was difficult. This area, partially located at an olive tree groove, was quite stony, and only shallower samples were collected. Therefore, two parallel lines were sampled here. Whilst the results from this area should be considered with care, the signatures from both lines were coherent with each other. Enhanced magnetic-susceptibility, magnetic-gradient and phosphate-concentration values were measured within the targeted feature in Lines 4 and 5 (Figure 7). Line 6 was the longest line targeting a ditch-like anomaly and the farthest from the center of the site. The lateral results showed a general increase in magnetic susceptibility and phosphate variables, from the farthest sampling point to the closest one of the site center (Figure 7). The results of the samples collected within the targeted (outermost) ditch-like feature produced a slight magnetic-susceptibility and magnetic-gradient peak in Line 6 but not in phosphate concentration.

3.2.2. In-Depth Results (Auger Points)

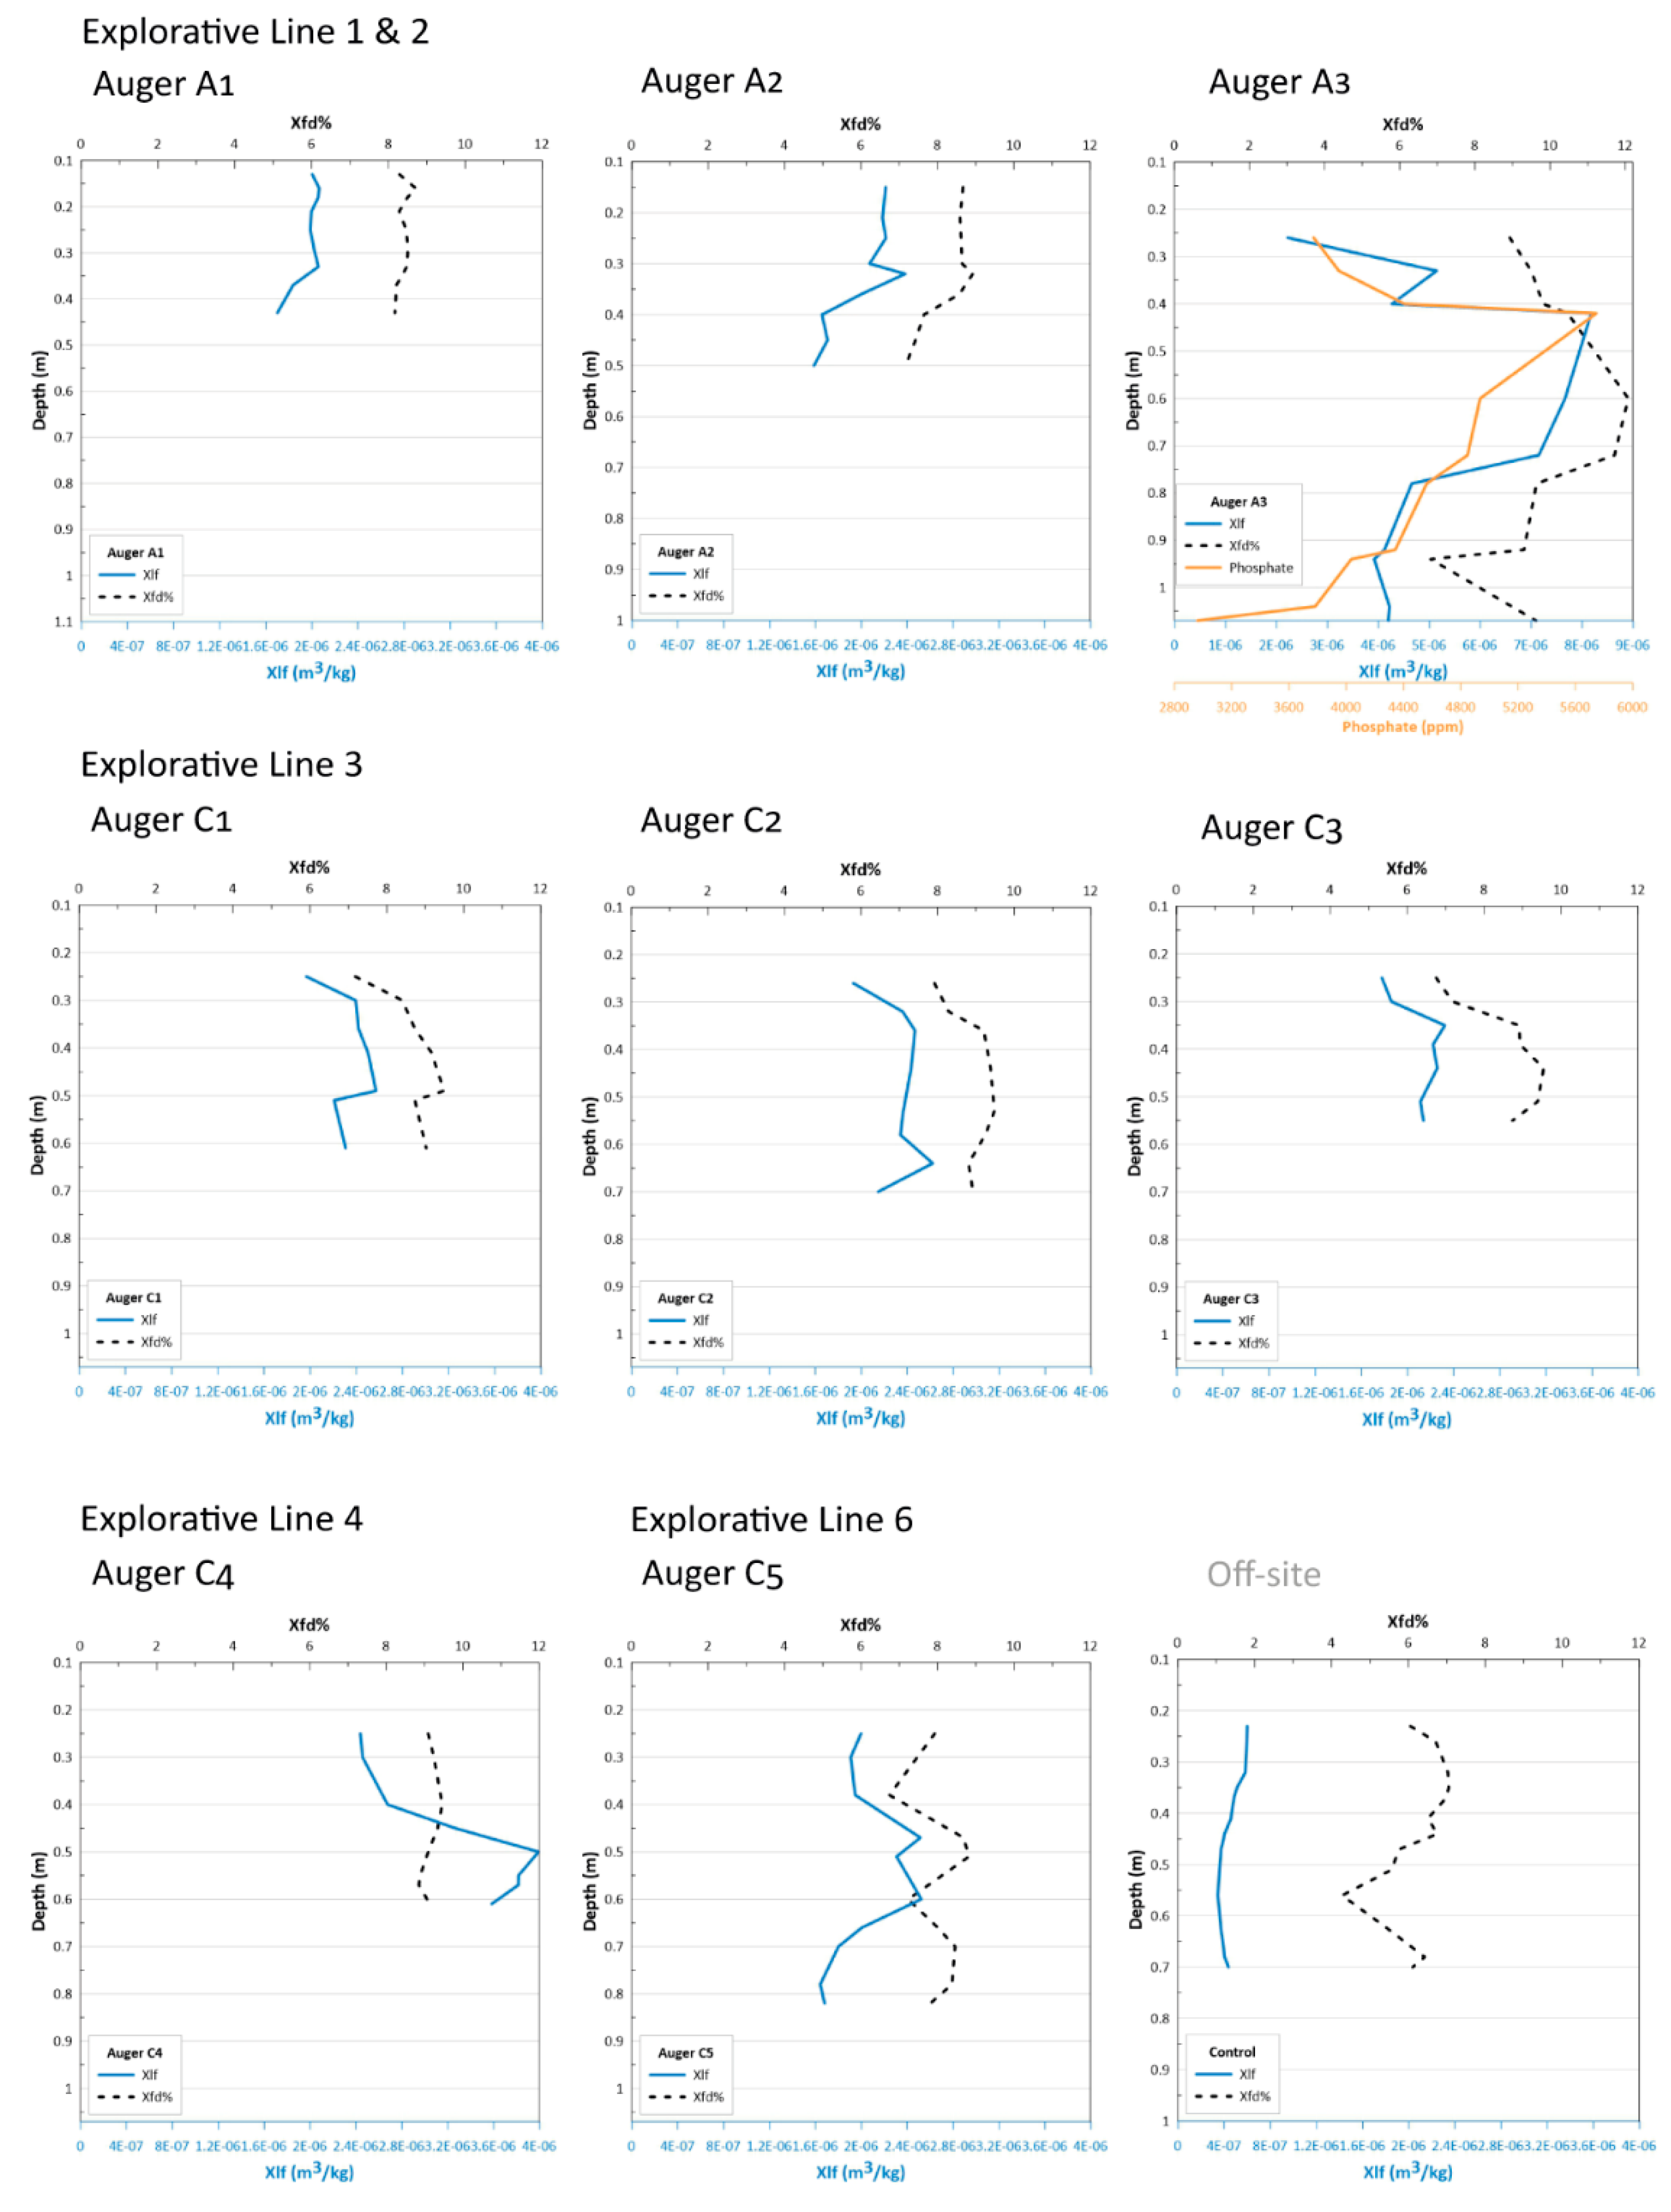
Auger A1 had averaged χlf values of 2.1 × 10⁻⁶ m3/kg up to ~0.33 m in depth, followed by a general decrease of values (Figure 8). Auger A2, targeting the area with strong magnetic responses, resulted in averaged lower χlf values (2.4 × 10⁻⁶ m3/kg up to ~0.33 m depth), followed by a general decrease (Figure 8). Auger A3 also targeted Area A at a different location. This auger was the only one where the phosphate concentration was also measured. The results revealed very high χlf values (7.6–8.2 × 10⁻⁶ m3/kg), χfd (11–12%) and phosphate concentrations (4500–5746 ppm) from 0.32 m to 0.72 m in depth, followed by a steady decrease up to 1 m in depth (Figure 8).
The samples taken within the positive magnetic response in Line 3 had a maximum χlf value of 2.57 × 10⁻⁶ m3/kg (Auger C1) at 0.41–049 m and 2.62 × 10⁻⁶ m3/kg (Auger C2) at 0.64 m in depth (Figure 8). The highest magnetic-susceptibility values were those from C4 in Line 4. These results showed significantly enhanced χlf values, between 3.3 and 4.0 × 10⁻⁶ m3/kg, from 0.40 down to ~0.60 m, with a maximum value at 0.45–0.50 m (Figure 8). Similarly, the samples augured in the ditch-like feature in Line 6 (Auger C5) showed a clear χlf enhancement between 0.38 and 0.60 m, with a maximum value of 2.5 × 10⁻⁶ m3/kg at 0.38–0.47 m in depth (Figure 8). In this case, the values progressively decrease with depth from the range of 0.60 to 0.66 m down to ~0.80 m in depth. The χfd results also showed the highest values (8.68–8.82%) between 0.38 and 0.51 m in depth.

3.2.3. Correlation of the Proxies at Almyriotiki

In general, there was an increase in phosphate and, to a lesser extent, magnetic-susceptibility measures within the proximity to the center of the site between the survey lines (Figure 7).
Line 1 was the longest one sampled in the field containing the nucleus of the site but did not cover the area beyond the enclosing ditch-like magnetic anomalies because of the baling works being carried out at this field. Since the outside of the enclosed site was not sampled, this may be the reason why there was not a significant lateral trend in magnetic-susceptibility enhancement denoting the location of the site. Overall, phosphate concentrations showed a greater enhancement across Line 1 than might have been expected from the site-wide trends between magnetic susceptibility and phosphate concentrations. The phosphate results showed particular enhancement from the easternmost area across the zone with the B structural anomalies, suggesting a clear accumulation of organic matter associated with this area of occupation. Whilst magnetic susceptibility was enhanced relative to the off-site control along the length of Line 1, there was no further enhancement of magnetic susceptibility or the gradient in Area B, which may support the interpretation that the negative magnetic anomalies detected during the magnetometer survey may be derived from the remains of subsurface stone foundations instead of the more organic daub material that characterize the center of the site (Area A).
There was a clear lateral magnetic-susceptibility increase over the ditch-like feature targeted with Line 3 (Figure 7). The magnetic-susceptibility enhancement at Augers C2 and C3 was less significant (Figure 8). There was no lateral phosphate enhancement at Auger C3, and lateral values were depleted at Auger C1 and enhanced at Auger C2. Indeed, phosphate concentrations associated with Augers C1, C2, C3 and C5 show only moderate or no enhancement in phosphate compared to the off-site control sample (control, 429 ppm phosphate concentration; Auger C5, 219–898 ppm phosphate concentration; and Augers C1–C3, 1449–1950 ppm phosphate concentration), and this was largely in line with being in proximity to the site center rather than a specific enhancement associated with the magnetometry anomalies. The samples augured inside all the enclosures showed enhanced χlf values, varying from 2.51 × 10⁻⁶ to 3.99 × 10⁻⁶ m3/kg, with matching high χfd percentages (8.70 and 10%). The highest magnetic-susceptibility values were measured inside Auger C2 (3.80 × 10⁻⁶ m3/kg, from 0.40 up to 0.61 m in depth, with a maximum value of 3.99 × 10⁻⁶ m3/kg at 0.45–0.50 m), followed by Auger C1 (maximum χlf value of 2.57 × 10⁻⁶ m3/kg at 0.41–049 m) and Auger C3 (between 2.45 × 10⁻⁶ m3/kg at 0.38–0.60 m and the maximum values of 2.51 × 10⁻⁶ m3/kg at 0.38–0.47 m). The uppermost deposits of the enclosures seem to be at ∼0.40 m in depth, and none of them were bottomed at least up to ∼1 m.

3.3. Perdika II

3.3.1. Lateral Results (Exploratory Lines 1 and 2)

Line 1 crossed the center of a magnetically noisy central area (A) surrounded by several linear and curvilinear positive ditch-like magnetic anomalies (B) on its longest axis and an outer area (C) with very strong magnetic signatures. If compared to what may be the outermost area of the site (southeast area), the lateral magnetic-susceptibility and phosphate results were highly variable, but there were generally higher values at the center of the site (Figure 9). It was not possible to collect samples beyond the northeastern area of the site (beyond the limits of the area surveyed with the magnetometer). There were relatively enhanced values of all three variables at the locations of the curvilinear positive ditch-like anomalies (B) and the magnetically noisy area (A).
The lateral results of Line 2 showed weak magnetic-susceptibility and phosphate-concentration enhancement towards the easternmost sampling points (Figure 9). The westernmost sample of Line 2 resulted in high χlf and χfd values despite being outside of the outermost enclosure. This sample was taken in a degraded area of the site with very thin soils and a lot of vegetation, some of them burnt, which may be the reason for the relatively high values.

3.3.2. In-Depth Results (Auger Points)

In general, all augers showed enhanced magnetic-susceptibility values compared with the off-site control samples (Figure 10). However, those targeting Area A (magnetically noisy central area) did not show any clear pattern (e.g., a common enhancement at a particular depth). While in Auger A1 there was a general magnetic-susceptibility enhancement with depth, with a huge peak at 0.60 m depth, the trend in Auger A2 was a general decrease of magnetic susceptibility with depth. Other samples from augers extracted near Auger A2 also resulted in enhanced magnetic-susceptibility values with depth, whilst others were decreasing. In the case of Auger A3, the bottomed soil (0.8 m depth) was chalky with light beige/reddish mottling (usually associated with periodic wetting). Auger A4 bottomed flat stone at 0.70 m in depth and Auger A1 at 0.6 m. Near the location of Augers A3 and A4, the soil extracted at Point 4 (ST3) was very clayey and moistened between 0.18 and 0.28 m in depth, and clay was bottomed at 0.44 m in depth with very low χlf (1.9 × 10⁻⁷ m3/kg) but relatively high χfd (10.6%) values.
A more coherent trend was seen in the augers from Area B. All presented enhanced magnetic susceptibility and reached stone at a shallower depth (0.40−0.50 m) than those in Area A (Figure 10). Auger B2 was the profile showing less enhancement with higher magnetic-susceptibility values (~1.26 × 10⁻⁶ m3/kg) at shallower depths (0.22–0.26 m).
The auger located in the area containing the strong magnetic signature (Auger C1) showed general enhanced magnetic susceptibility from 0.24 m in depth until stone was reached at 0.56 m in depth (Figure 10). Whilst χfd values varied between 9 and 10% in most of the samples analyzed from other augers, the Auger C1 samples ranged from 11 to 13%.

3.3.3. Correlation of the Proxies at Perdika II

High- and low-frequency magnetic susceptibility correlated positively with the phosphate concentration, but there was no significant correlation with frequency-dependent magnetic susceptibility.
There was clear phosphate enhancement at the center of the area enclosed by the innermost curvilinear ditch-like magnetic anomaly (Line 1) and easternmost of Line 2 (Figure 9). To a lesser degree, the magnetic-susceptibility analysis also shows a similar enhancement. The magnetic-gradient results did not show a consistent correlation with the magnetic susceptibility, only a discrete peak, which also coincides with a similar phosphate-concentration peak.
The phosphate lateral variations observed in Perdika II suggest that the core of anthropogenic activity was carried out inside the innermost enclosure. Compared with the phosphate results, the magnetic-susceptibility analysis did not show such a clear area of enhancement. The very clear cluster of enhanced phosphate values may be related to the accumulation of organic matter. Typical sources of anomalous phosphorus concentrations in soil include domestic refuse but can also be derived as the product of animal dung and husbandry activities [36,37,38]. These enhancements were correlated with the location of an isolated cluster of structural remains revealed by the GPR survey (Figure 11).
The enclosures targeted with the auger generally reached fairly flat stone between 0.32 and 0.5 m in depth (Figure 10) and resulted in high χlf (e.g., 1.2 × 10⁻⁶ m3/kg in Auger B2) and high χfd values (10% in Auger B2). Taking into consideration the magnetic-susceptibility results and the potential presence of sandstone in the area, the enclosures detected with the magnetometer survey may be the foundations of wall enclosures that were built using the local stone resource. The soil collected at the location of the structures detected with the GPR survey (Figure 11) resulted in slightly higher χlf and χfd values, i.e., >10%. These results suggest that the structures detected may be foundations built by using the same type of local rock, containing also higher quantities of mixed enhanced anthropogenic deposits. The results of Augers A3 and A4, targeting a positive magnetic anomaly, were more difficult to interpret. This feature was significantly deeper and characterized by a sequence of clay–chalk–red-sand deposits. Whilst the main anthropogenic activity seemed to focus within the innermost enclosure, the results of Auger C1 with moderate–high χlf and high χfd suggested another hotspot of activity towards the area immediately outside of the main enclosures.

4. Discussion

4.1. Could Soil Analyses Act as Alternatives for Locating Such Targets If Geophysical Surveys Were Not Possible?

According to the results at these sites, the answer is yes.
In the case of Almyriotiki, the main problem in regard to assessing these variables as proxies for the presence and extension of subsurface archaeology was the impossibility to collect samples across the entire site given the agricultural work being developed during the fieldwork. In the case of Perdika II, it was not possible to sample well beyond the outermost area of the site given the terrain.
However, looking at the general values, significantly higher magnetic-susceptibility and phosphate-concentration values were obtained from the in-site samples than those collected off-site (Table 3). Magnetic-susceptibility values of the in-site samples were increased by 53% in Rizomilos, 122% in Almyriotiki and 159% in Perdika II. The percentage increase value, in terms of the phosphate concentration, was very high in Almyritoki and Perdika (unfortunately control samples from Rizomilos were not measured). Whilst each site has a different geological setting, the magnitude of the enhancements in both phosphate and magnetic susceptibility on-site is much greater than the differences in concentration between the off-site samples. This gives confidence that the enhancements identified along the exploratory lines are anthropogenic, rather than geological, in origin. At Rizomilos, enhancements of phosphate were the general signatures measured on the samples collected over the location of most of the targeted features. This suggests that, in the case of extensive soil prospections using magnetic-susceptibility and phosphate-content soil analysis, the locations of these three sites would have been successfully detected as enhanced areas. The differences of both quantities at the various sites needs to be taken into consideration, as the soil parent material and the agricultural activities within and around the sites may influence the enhancement of them in tandem to the specific characteristics of the sites (e.g., intensity of past habitation, past land usage, etc.). In this sense, while the order of average off-site/in-site values correlates in the case of the magnetic-susceptibility measurements (with Almyriotiki with the highest mean values for in/off-site samples, followed by Rizomilos and Perdika), this is not the case with the phosphate results (Table 3). The samples from Almyriotiki resulted in very high averaged phosphate-concentration values. These values contrast with those from Rizomilos, a similar type of (tell) site and settings (e.g., same soil type and current land use). In this case, the large differences in phosphate enhancements, rather than being determined by the geological input, may be more related to other aspects, such as the intensity of past occupation at the different sites. This is further developed in Section 4.2.3.
The long exploratory lines used to detect the core of the site or mound in this investigation did not provide progressive enhanced magnetic-susceptibility and phosphate values from the outskirts of the mound to its top in the case of Rizomilos. Actually, the samples taken on the top of this site had lower magnetic-susceptibility values. This reversed pattern seems to be a consequence of the truncation of putative and shallow archaeological structures by modern construction/agricultural practices at the top of the site. An alternative interpretation is that this absence of enhancement could reflect the lack of dwellings at the nucleus of the center of the site, as it is observed in most of the settlements prospected by the IGEAN project [19].
In the case of the phosphate analysis, there was a general progressive enhancement towards the mounds. This implies that the clearest anthropogenic footprint detectable at these three sites seems to be related to the thicker organic deposits related to site activities, mound formation and related phosphate concentration and fixation in soils. The same observation applies to Perdika II, even taking into consideration the different site morphology/emplacement in comparison with Rizomilos and Almyriotiki. Whilst the phosphate lateral variations showed a clear enhancement inside the innermost enclosure and northeast area, the magnetic-susceptibility results did not show such a clear pattern.

4.2. Can We Say Anything Else beyond the Information about the Geometry and Spatial Distribution of the Possible Buried Features Provided by the Magnetometer Data?

Yes.

4.2.1. About Enclosures

The soil sampled over and inside the ditch-like anomalies at the three sites was generally characterized by enhanced magnetic-susceptibility mean values and matching high χfd percentages (ST1-2-3). The phosphate results of the explorative lines at the location of these targets produced more inconclusive responses. Unfortunately, none of the augers targeting these anomalies were analyzed for phosphate concentration in this study. Therefore, the assessment of the depth distribution of organic matter could not be performed, and only the results provided by the exploratory lines (at depth 0.25–0.30 m for Almyriotiki and Rizomilos and 0.15–0.20 m for Perdika II) are considered in this section.
Magnetic-susceptibility peaks of 3.99 × 10⁻⁶ m3/kg (at 0.45–0.50 m depth) and 1.82 × 10⁻⁶ m3/kg (at 0.33–0.36 m depth) of enhanced backfill were measured in Almyriotiki and Rizomilos, respectively (Auger A4 in ST 1 and Auger A2 in ST2). Other auger peaks and relatively enhanced magnetic-susceptibility values, in comparison with the depth profile of the control samples, suggest that the targeted enclosures were not bottomed at the maximum depth reached by the auger (~1 m). The enhanced backfill sampled from these targets support their interpretation as ditch-cut features surrounding the mound and remaining deeper than 0.50 m.
Focusing on Almyriotiki, only a few soil samples collected from the interior of the ditched-like enclosure closer to the nucleus of the site provide peak phosphate values (Lines 4 and 5 in Figure 7). The results from the more distant enclosures did not produce high phosphate signatures. The enhanced phosphate values, at least at a depth of 0.25–0.30 m, in Lines 4 and 5 could reflect a higher concentration of organic material, suggesting a different use or function of this enclosure in proximity to the nucleus of the site if we compare it to the more distant enclosures. The mean χlf and χfd% values from the auger (C4) collected here were the highest if compared to the rest (Table 4). Hypothesizing that the core of the site may be related to the earliest period of occupation (considering a later expansion due to population sprawl, as seen by the surrounding structures detected as negative magnetic anomalies), we can suggest that inner and more elevated enclosures were used for disposal of organic material, whereas the outermost ditches were used as counter-flooding earthworks. Evidence of possible past flooding events have been found in Amiriotyki and Rizomilos and have been modeled accordingly based on flooding simulation models [20].
In Rizomilos, the two targeted concentric ditch-like anomalies were also characterized by enhanced magnetic susceptibility but showed lower mean values than in Almyriotiki. The highest value (1.82 × 10⁻⁶ m3/kg) was measured in the outermost of the targets at the north of the survey area (A2 in Figure 3). The mean χfd percentage from these samples was also fairly high (8.07%), with the highest value (8.37%) at 0.58–0.74 m depth. The magnetic-susceptibility enhancement correlated with high gradients in the magnetic datasets (Figure 3). The phosphate results obtained from the explorative lines did not reveal particular enhancements in the samples collected at the locations of the concentric ditches. This could suggest that these ditches were not a focus of heavy accumulation of organic matter, at least at the depth of sampling of the exploratory lines.
The values obtained inside the targeted feature in Line 3 in Rizomilos were ~15% lower χlf and χfd ratios at a shallower depth than the concentric linear magnetic anomalies targeted in Lines 1 and 2 suggesting a non-anthropogenic or geogenic feature (Table 4). This longitudinal feature could represent the remains of a paleochannel or flooding marks from past flooding events as those that have been repeatedly reported in historical periods originating from the nearby Lake Karla.
In the case of Perdika II, during the augering of the targeted enclosures, stone was bottomed relatively shallow (~0.32–0.5 m depth), already suggesting the different nature of these features. Since the site is located on a hilltop, it could be argued that this may be the depth of the natural bedrock. However, other augers did not reach stone beyond 0.75 m depth at neighboring locations. Moreover, the augured points targeting the enclosures bottomed flat and fine-grained stone instead of the angular stone outcropping at the NW of the hilltop (conglomerate). Taking into consideration the magnetic-susceptibility results and the presence of shallow sandstone in the area, the curvilinear anomalies detected with the magnetometer survey may be caused by the presence of stone-based enclosures, which were built using the local and easy to work sandstone.

4.2.2. About Structures and Materials

The very high χlf and χfd values obtained from Auger A3 samples in Almyriotiki (Line 2 in Figure 8) suggest a thermoremanent component (i.e., intense burning). The first peak was fairly shallow (0.32–0.42 m depth in Auger A3, ST2 with 8.18 × 10⁻⁶ m3/kg χlf and 11 χfd%). This auger was the only one analyzed for phosphate concentration and also gave a high peak value at the same depth (5746 ppm). Considering this high magnetic susceptibility and phosphate-concentration values, the high magnetic gradients and the regular shape of the magnetic anomalies support the idea that the collected samples could be correlated to burnt structural remains made of material containing a high component of organic material (e.g., daub).
Despite the fact that high magnetic-susceptibility readings were recorded above similar structures along Line 1, the extreme values were not observed above the burnt structural remains. On the other hand, magnetic-gradient peaks were measured in this Area A in both lines. This difference may be indicative of different daub types used for the construction of the houses. Magnetic gradient is always high above the structures, as it measures both remanent and induced magnetization, but the different signatures of the magnetic susceptibility may indicate different constituents of the daub that allowed a higher or lower induced magnetization.

4.2.3. About Intra-Site Activity

The phosphate enhancements were found in areas immediately inside the innermost concentric ditched enclosures in Rizomilos and Perdika II. In Rizomilos, the highest phosphate values were obtained in the area surrounded by the innermost of the concentric ditches that define the center of the site (Figure 2). In this area, a series of narrower (<2 m) and also concentric anomalies of stronger magnetic intensity were also detected and interpreted as walled enclosures [20]. The phosphate enhancement in the space defined by these (non-built central area) seems to indicate the core of the anthropogenic activity. In contrast, the highest lateral phosphate concentration was found in the side of the Almyriotiki mound, containing the possible stone structures (Area B in Figure 7). In Area A, the phosphate concentration was more variable (Figure 7). However, taking into account the phosphate results in Auger A3 (Figure 8), it seems very likely that this area would have resulted in enhanced values if more samples had been collected at other areas.
Other results obtained within the non-built central areas in Rizomilos and Almyriotiki may be indicative of other buried features. In Almyriotiki, the only distinctive enhanced χlf value (4.91 × 10⁻⁶ m3/kg) with a medium χfd of 8% was from a sample taken in Line 1, over a positive magnetic anomaly (Figure 7). This matched with the highest value of the magnetic gradient and a phosphate-concentration peak, suggesting the presence of a large pit or other type of buried deposit of different character compared to the burnt structural material of Area A (with samples exhibiting χfd of 10–12%). In Rizomilos, the samples collected within the postulated non-built central area resulted in distinct high phosphate values and high magnetic-gradient values, also indicating the presence of pits (Figure 3). Considering the apparent lack of constructions within these spaces, the interpretation of these as non-built communal areas (e.g., used for gathering or storage) seems reasonable.
The samples collected outside the site’s enclosed center in Rizomilos showed enhanced phosphate and magnetic susceptibility, suggesting that the occupation extended further off the core of the site. This is in agreement with the final interpretation of the geophysical surveys, wherein several structural anomalies were identified in the area near Line 3, or within the outer enclosures, or as earlier (or satellite) sites, as shown in Figure 6.
In the case of Perdika II, the phosphate concentration was a clear proxy of human activity location and showed enhancements inside the innermost enclosure, especially in the northeast and the easternmost area containing the structures detected with the GPR survey (Figure 11). In this case, and taking into account the site typology (flat-extended instead of tell-type) and scarce superficial artefacts, we propose that the source of anomalous phosphate concentrations here may have been more influenced by other sources than waste from habitation and perhaps more as a product of animal husbandry. Further multi-element geochemical analysis could provide clues to clarify if Perdika II was a long-term habitation site or a more temporary agropastoral site related with livestock herding practices.
In addition, at Perdika II, the auger located in the area containing the strong magnetic signature (C1) showed general enhanced magnetic susceptibility from 0.24 m in depth until stone was reached at 0.56 m in depth. Whilst the χfd percentages varied between 9 and 10% in most of the samples analyzed from other augers, the C1 samples ranged from 11 to 13%. This suggests the presence of other enhanced anthropogenic soil outside of the concentric enclosures; hence, there is a possibility of other areas of occupation beyond the enclosed central area of the site.
Comparing the total phosphate concentrations at each site, the highest average load was noticed in Almyriotiki (4230 ppm), followed by Rizomilos (1804 ppm) and Perdika II (1795 ppm) (Table 3). This may be indicative of the intensity of population and length of occupation at the sites. Even when considering the limitations posed by the few control samples analyzed and current field use at the time of sampling, this observation seems to agree with other evidence. For example, in Almyriotiki, the results of the magnetometer surveys mapped numerous structures spreading outside from the nucleus of the site, which suggests a long-term occupation of the same site and population growth. At Rizomilos, the magnetometer results revealed an earlier site to the east of the main site, which may fit with comparably less intensive occupation (of the later site). In the case of Perdika II, the lower concentration of phosphate also seems to fit the shorter or more temporary occupation expected at this type of site, as well as the relatively lower abundance of surface artefacts.

4.3. Future Actions

As for further work, continuing with the same ‘minimally invasive’ perspective, the determination of Königsberger (Q) ratios (ratio between remanent and induced magnetization) of the deposits sampled in Area A at Almyriotiki could help to determine the importance of the remanent magnetization, i.e., to know the intensity of burning. A more detailed characterization of the magnetic properties of the daub, as well as a multi-element analysis, could help to clarify potential differences in the makeup of such material that appears to be behind the different signatures in magnetic susceptibility. Multi-element or other mineralogical analyses could provide other insights relating to the function of the enclosures in Almyriotiki and Rizomilos. These types of analyses could also provide more evidence to determine the nature of the activities carried out at these sites (e.g., permanent occupation in Almyriotyki and Rizomilos vs. temporary livestock habitation at Perdika II).

5. Conclusions

The results of this comparative study demonstrate that shallow-buried and long-term-occupied Neolithic sites of different morphologies in Thessaly (tell and extended sites) can be located, generally as enhanced areas, using routinely and relatively ‘low-cost’ soil magnetic-susceptibility and phosphate analyses. The latter can be considered less cost-efficient given the number of reagents and laboratory processing time required to analyze the samples. In combination with large-area-coverage magnetometer surveys and targeted soil sampling using an auger, such analyses can provide complementary information about subsurface features of interest without the need of opening large excavation trenches, thus contributing to the minimally invasiveness character of this methodology.
A phosphate-concentration analysis through exploratory lines (lateral results) can be especially useful as a basic prospection tool to detect tell-type sites given their characteristic formation process (sequential accumulation of anthropogenic deposits or debris with an inherent component of organic matter, resulting in a higher phosphate concentration). The phosphate results can support magnetometer results to identify activity areas within a site that may have happened not only in the nucleus or center of the enclosed site (e.g., Almyriotiki case) but also beyond it, as illustrated in Rizomilos and Perdika II. A comparison of phosphate loads, also in combination with geophysical survey results, can provide hints of the relative intensity of the occupation of the sites.
The soil magnetic-susceptibility analysis also demonstrated potential in this study to detect such sites. However, these may produce unexpected lateral patterns (depletions instead of enhancements at the nucleus of the sites) due to disturbances from modern agricultural activities or lack of habitational structures at the core of the site, as in the case of Rizomilos. High magnetic-susceptibility values and high χfd percentages (together with high phosphate concentration) observed in-depth (auger points) suggest the presence of burnt structural remains with a high component of organic material (e.g., daub). Medium magnetic-susceptibility in-depth values and associated high χfd percentages obtained from the backfill deposits of the enclosures surrounding the core of the sites at Almyriotiky and Rizomilos support the interpretation of the magnetometer results of these features as ditch-cut and deeper than 0.50 m; meanwhile, the results of Perdika II revealed a different character of the enclosures at this site (walled, instead of ditched). The comparison of the magnetic-susceptibility (in-depth) results allowed us to distinguish a geogenic concentric feature (a paleochannel or flooding marks) from the archaeological enclosures.

Supplementary Materials

The following supporting information can be downloaded at https://doi.org/10.5281/zenodo.7133280 (accessed on 1 November 2022). Supplementary Table S1 (ST1_Rizomilos_Lines and Augers); Supplementary Table S2 (ST2_Almyriotiki_Lines and Augers); Supplementary Table S3 (ST3_Perdika_Lines and Augers).

Author Contributions

Conceptualization, C.C.-G. and A.S.; methodology, C.C.-G. and A.S.; formal analysis and investigation, C.C.-G., A.J., E.A., C.W. and A.S.; funding acquisition, A.S.; writing—original draft preparation, C.C.-G.; writing—review and editing, C.C.-G., A.J., E.A., C.W. and A.S. All authors have read and agreed to the published version of the manuscript.

Funding

The fieldwork was carried out as part of the IGEAN (’Innovative Geophysical Approaches for the Study of Early Agricultural Villages of Neolithic Thessaly’) project. IGEAN was implemented under the ARISTEIA action of the ’Operational Programme Education and Lifelong Learning’ and co-funded by the European Social Fund (ESF) and National Greek Resources. The final analysis of the different datasets and OA publication was supported by the COST Action SAGA (CA17131) ‘The Soil Science & Archaeo-Geophysics Alliance’ (www.saga-cost.eu, accessed on 1 November 2022), supported by COST (European Cooperation in Science and Technology, www.cost.eu, accessed on 1 November 2022).

Acknowledgments

The authors would like to acknowledge networking support by the COST Action SAGA: The Soil Science & Archaeo-Geophysics Alliance—CA17131 (www.saga-cost.eu, accessed on 1 November 2022), supported by COST (European Cooperation in Science and Technology, www.cost.eu, accessed on 1 November 2022). The authors especially thank Gianluca Cantoro for his help during the soil sampling campaign, Georgia Karampatsou for the phosphate measurements and the many colleagues of the Laboratory of Geophysics—Satellite Remote Sensing & Archaeoenvironment (GeoSat ReSeArch Lab) that collaborated in the preparation and measurement of the soil samples for the magnetic susceptibility characterization. Thanks also to Meropi Manataki for granting us permission to access all the fantastic photos she took during the geophysical field seasons. Finally, thanks to the two anonymous reviewers for their helpful suggestions.

Conflicts of Interest

The authors declare no conflict of interest.

References

  1. Aidona, E.V.; Sarris, A.; Kondopoulou, D.; Sanakis, I. Application of Magnetic and Spectrometry Methods in the Detection of Human Activity in Soils: A Case Study at the Archaeological Site of Kitros (Northern Greece). Archaeol. Prospect. 2001, 8, 187–198. [Google Scholar] [CrossRef]
  2. Dalan, R.A.; Banerjee, S.K. Solving Archaeological Problems Using Techniques of Soil Magnetism. Geoarchaeology 1998, 13, 3–36. [Google Scholar] [CrossRef]
  3. Eppelbaum, L.V.; Khesin, B.E.; Itkis, S.E. Prompt Magnetic Investigations of Archaeological Remains in Areas of Infrastructure Development: Israeli Experience. Archaeol. Prospect. 2001, 8, 163–185. [Google Scholar] [CrossRef]
  4. Scollar, I.; Tabbagh, A.; Hesse, A.; Herzog, I. Archaeological Prospecting and Remote Sensing, 1st ed.; Cambridge University Press: Cambridge, UK, 2009. [Google Scholar]
  5. Tite, M.S.; Mullins, C. Enhancement of the Magnetic Susceptibility of Soils on Archaeological Sites. Archaeometry 1971, 13, 209–219. [Google Scholar] [CrossRef]
  6. Wilson, C.A.; Davidson, D.A.; Cresser, M.S. Multi-Element Soil Analysis: An Assessment of Its Potential as an Aid to Archaeological Interpretation. J. Archaeol. Sci. 2008, 35, 412–424. [Google Scholar] [CrossRef]
  7. Cuenca-García, C. Inorganic Geochemical Methods in Archaeological Prospection. In Best Practices of GeoInformatic Technologies for the Mapping of Archaeolandscapes; Archaeopress Archaeology: Oxford, UK, 2015. [Google Scholar]
  8. Armstrong, K.; Cheetham, P.; Darvill, T. Tales from the Outer Limits: Archaeological Geophysical Prospection in Lowland Peat Environments in the British Isles. Archaeol. Prospect. 2019, 26, 91–101. [Google Scholar] [CrossRef] [Green Version]
  9. Cuenca-García, C.; Jones, R.; Hall, A.; Poller, T. From the Air to the Atomic Level of a Ditch: Integrating Geophysical and Geochemical Survey Methods at the Prehistoric Cropmark Complex of Forteviot (Perthshire, Scotland). In Proceedings of the Archaeological Prospection: Proceedings of the 10th International Conference, Vienna, Austria, 29 May–2 June 2013. [Google Scholar]
  10. Cuenca-García, C. Soil Geochemical Methods in Archaeo-Geophysics: Exploring a Combined Approach at Sites in Scotland. Archaeol. Prospect. 2019, 26, 57–72. [Google Scholar] [CrossRef] [Green Version]
  11. Dirix, K.; Muchez, P.; Degryse, P.; Music, B.; Poblome, J. Integrating Geochemical Survey and Magnetic Prospection on an Archaeological Site in SW-Turkey. In Proceedings of the Archaeological Prospection: Proceedings of the 10th International Conference on Archaeological Prospection, Vienna, Austria, 29 May–2 June 2013; pp. 110–113. [Google Scholar]
  12. Garcia-Garcia, E.; Andrews, J.; Iriarte, E.; Sala, R.; Aranburu, A.; Hill, J.; Agirre-Mauleon, J. Geoarchaeological Core Prospection as a Tool to Validate Archaeological Interpretation Based on Geophysical Data at the Roman Settlement of Auritz/Burguete and Aurizberri/Espinal (Navarre). Geosciences 2017, 7, 104. [Google Scholar] [CrossRef] [Green Version]
  13. Gustavsen, L.; Cannell, R.J.S.; Nau, E.; Tonning, C.; Trinks, I.; Kristiansen, M.; Gabler, M.; Paasche, K.; Gansum, T.; Hinterleitner, A.; et al. Archaeological Prospection of a Specialized Cooking-Pit Site at Lunde in Vestfold, Norway. Archaeol. Prospect. 2018, 25, 17–31. [Google Scholar] [CrossRef]
  14. Hafez, I.T.; Sorrentino, G.; Faka, M.; Cuenca-García, C.; Makarona, C.; Charalambous, A.; Nys, K.; Hermon, S. Geochemical Survey of Soil Samples from the Archaeological Site Dromolaxia-Vyzakia (Cyprus), by Means of Micro-XRF and Statistical Approaches. J. Archaeol. Sci. Rep. 2017, 11, 447–462. [Google Scholar] [CrossRef]
  15. Jones, R.E.; Challands, A.; French, C.; Card, N.; Downes, J.; Richards, C. Exploring the Location and Function of a Late Neolithic House at Crossiecrown, Orkney by Geophysical, Geochemical and Soil Micromorphological Methods. Archaeol. Prospect. 2010, 17, 29–47. [Google Scholar] [CrossRef]
  16. Schneidhofer, P.; Nau, E.; Leigh McGraw, J.; Tonning, C.; Draganits, E.; Gustavsen, L.; Trinks, I.; Filzwieser, R.; Aldrian, L.; Gansum, T.; et al. Geoarchaeological Evaluation of Ground Penetrating Radar and Magnetometry Surveys at the Iron Age Burial Mound Rom in Norway. Archaeol. Prospect. 2017, 24, 425–443. [Google Scholar] [CrossRef]
  17. Verhegge, J.; Missiaen, T.; Crombé, P. Exploring Integrated Geophysics and Geotechnics as a Paleolandscape Reconstruction Tool: Archaeological Prospection of (Prehistoric) Sites Buried Deeply below the Scheldt Polders (NW Belgium). Archaeol. Prospect. 2016, 23, 125–145. [Google Scholar] [CrossRef]
  18. Verhegge, J.; Mendoza Veirana, G.; Cornelis, W.; Crombé, P.; Grison, H.; De Kort, J.-W.; Rensink, E.; De Smedt, P. Working the Land, Searching the Soil: Developing a Geophysical Framework for Neolithic Land-Use Studies: Project Introduction, Methodology, and Preliminary Results at ‘Valther Tweeling’. Notae Praehist. 2021, 41, 187–197. [Google Scholar]
  19. Cuenca-Garcia, C.; Armstrong, K.; Aidona, E.; De Smedt, P.; Rosveare, A.; Rosveare, M.; Schneidhofer, P.; Wilson, C.; Faßbinder, J.; Moffat, I. The Soil Science & Archaeo-Geophysical Alliance (SAGA): Going beyond Prospection. Res. Ideas Outcomes 2018, 4, e31648. [Google Scholar] [CrossRef]
  20. Alram-Stern, E.; Sarris, A.; Vouzaxakis, K.; Almatzi, K.; Arachoviti, P.; Rondiri, V.; Efstathiou, D.; Stamelou, E.; García, C.C.; Kalayci, T.; et al. Visviki Magoula Revisited: Comparing Past Excavations’ Data to Recent Geophysical Research. In Communities, Landscapes, and Interaction in Neolithic Greece; International Monographs in Prehistory; Berghahn Books: New York, NY, USA, 2018; Volume 20, pp. 137–148. [Google Scholar]
  21. Sarris, A.; Kalayci, T.; Simon, F.-X.; Donati, J.; García, C.C.; Manataki, M.; Cantoro, G.; Moffat, I.; Kalogiropoulou, E.; Karampatsou, G.; et al. Opening a New Frontier in the Study of Neolithic Settlement Patterns of Eastern Thessaly, Greece. In Communities, Landscapes, and Interaction in Neolithic Greece; Berghahn Books: New York, NY, USA, 2018; pp. 27–48. [Google Scholar]
  22. Simon, F.-X.; Kalayci, T.; Donati, J.C.; Cuenca-García, C.; Manataki, M.; Sarris, A. How Efficient Is an Integrative Approach in Archaeological Geophysics? Comparative Case Studies from Neolithic Settlements in Thessaly (Central Greece). Near Surf. Geophys. 2015, 13, 633–643. [Google Scholar] [CrossRef] [Green Version]
  23. Fassbinder, J.W.E.; Stanjekt, H.; Vali, H. Occurrence of Magnetic Bacteria in Soil. Nature 1990, 343, 161–163. [Google Scholar] [CrossRef]
  24. Sarris, A. Processing and Analysing Geophysical Data. In Archaeological Spatial Analysis: A Methodological Guide; Routledge: London, UK, 2020; pp. 376–407. [Google Scholar]
  25. Mullins, C. Magnetic Susceptibility of the Soil and Its Significance in Soil Science—A Review. Eur. J. Soil Sci. 1977, 28, 223–246. [Google Scholar] [CrossRef]
  26. Batt, C.; Fear, S.; Heron, C. The Role of Magnetic Susceptibility as a Geophysical Survey Technique: A Site Assessment at High Cayton, North Yorkshire. Archaeol. Prospect. 1995, 2, 179–196. [Google Scholar] [CrossRef]
  27. Dearing, J.A. Environmental Magnetic Susceptibility: Using the Bartington MS2 System; Chi Pub: Kenilworth, UK, 1994. [Google Scholar]
  28. Dearing, J.A.; Dann, R.J.L.; Hay, K.; Lees, J.A.; Loveland, P.J.; Maher, B.A.; O’Grady, K. Frequency-Dependent Susceptibility Measurements of Environmental Materials. Geophys. J. Int. 1996, 124, 228–240. [Google Scholar] [CrossRef] [Green Version]
  29. Clark, A. Seeing Beneath the Soil; B.T. Batsford: London, UK, 1990. [Google Scholar]
  30. Jordanova, N.; Petrovsky, E.; Kovacheva, M.; Jordanova, D. Factors Determining Magnetic Enhancement of Burnt Clay from Archaeological Sites. J. Archaeol. Sci. 2001, 28, 1137–1148. [Google Scholar] [CrossRef]
  31. Jordanova, N.; Jordanova, D.; Lesigyarski, D.; Kostadinova-Avramova, M. Imprints of Paleo-Environmental Conditions and Human Activities in Mineral Magnetic Properties of Fired Clay Remains from Neolithic Houses. J. Archaeol. Sci. Rep. 2020, 33, 102473. [Google Scholar] [CrossRef]
  32. Holliday, V.T.; Gartner, W.G. Methods of Soil P Analysis in Archaeology. J. Archaeol. Sci. 2007, 34, 301–333. [Google Scholar] [CrossRef]
  33. Schmidt, A. Electrical and Magnetic Methods in Archaeological Prospection. In Seeing the Unseen. Geophysics and Landscape Archaeology; CRC Press: Boca Raton, FL, USA, 2008. [Google Scholar]
  34. Nanoglou, S. Social and Monumental Space in Neolithic Thessaly, Greece. Eur. J. Archaeol. 2001, 4, 303–322. [Google Scholar] [CrossRef]
  35. Manzetti, M.C.; Sarris, A. A Methodological Approach for Intra—Site Analysis of Prehistoric Settlements. Stud. Digit. Herit. 2021, 5, 88–106. [Google Scholar] [CrossRef]
  36. Chernysheva, E.; Korobov, D.; Khomutova, T.; Fornasier, F.; Borisov, A. Soil Microbiological Properties in Livestock Corrals: An Additional New Line of Evidence to Identify Livestock Dung. J. Archaeol. Sci. Rep. 2021, 37, 103012. [Google Scholar] [CrossRef]
  37. Elliott, S.; Bendrey, R.; Whitlam, J.; Aziz, K.R.; Evans, J. Preliminary Ethnoarchaeological Research on Modern Animal Husbandry in Bestansur, Iraqi Kurdistan: Integrating Animal, Plant and Environmental Data. Environ. Archaeol. 2015, 20, 283–303. [Google Scholar] [CrossRef] [Green Version]
  38. Shahok-Gross, R.; Marshall, F.; Weiner, S. Geo-Ethnoarchaeology of Pastoral Sites: The Identification of Livestock Enclosures in Avandoned Maasai Settlements. J. Archaeol. Sci. 2003, 30, 439–459. [Google Scholar] [CrossRef]
  39. Manataki, M.; Sarris, A.; Donati, J.; Cuenca-García, C.; Kalaicy, T. GPR: Theory and Practice in Archaeological Prospection. In Best Practices of GeoInformatic Technologies for the Mapping of Archaeolandscapes; Archaeopress Archaeology: Oxford, UK, 2015. [Google Scholar]
Figure 1. General location of the three case studies in the Thessalian plain (top). The red pins mark the location of (1) Rizomilos, (2) Almyriotiki and (3) Perdika II. The yellow pin marks the location of the main city of Thessaly, Volos. Results of the large area magnetometer surveys (middle) carried out before the test study reported here. The grayscale image shows positive magnetic anomalies in black and negative anomalies in white. Views of the field during the magnetometer surveys at the three sites (bottom). The fields surveyed at Rizomilos and Perdika were fallow. Most of the fields that were surveyed in Almyriotiki were burnt after the crop’s collection (photos credit: Meropi Manataki).
Geosciences 13 00003 g001
Figure 2. General location of the soil sample lines over the magnetometer results (top). General views of the fields during soil sampling (bottom). The grayscale image shows positive magnetic anomalies in black and negative anomalies in white.
Geosciences 13 00003 g002
Figure 3. Bubble plots (overlying the magnetometer survey results) showing the lateral low frequency magnetic susceptibility (χlf, in blue) and phosphate (P, in orange) distribution along the exploratory lines at Rizomilos, overlying the magnetometer survey results. The grayscale image shows positive magnetic anomalies in black and negative anomalies in white. The grayscale image is shown at 70% opacity of Figure 1 and Figure 2 to facilitate visualization of the bubble plots. The x–y graphs also show the lateral variation of the χlf (blue line) and P (orange line), including the magnetic-gradient intensity (Gr, purple line). In the graphs, the location of the two targeted ditch-like positive magnetic anomalies is indicated in green (A = outer and B = inner). The location of the in-depth augered points is indicated as reference for Figure 4, where the in-depth results are shown. The location of the lines is shown in Figure 2.
Geosciences 13 00003 g003
Figure 4. In-depth results of the low-frequency magnetic susceptibility (χlf) and frequency-dependent susceptibility of the ‘auger’ samples and off-site controls at Rizomilos. The location of the auger points in each exploratory line is shown in Figure 3.
Geosciences 13 00003 g004
Figure 5. Bivariate plot of phosphate concentration and χlf showing correlation between parameters at the three sites.
Geosciences 13 00003 g005
Figure 6. Annotation of the anomalies of interest detected by the geophysical survey at Rizomilos (modified from [19]). The inset at the top shows the related magnetometer results. The grayscale range is the same as that plotted in Figure 1 and Figure 2.
Geosciences 13 00003 g006
Figure 7. Bubble plots (overlying the magnetometer survey results) showing the lateral low-frequency magnetic susceptibility (χlf, in blue) and phosphate (P, in orange) distribution along the exploratory lines at Almyriotiki. The grayscale image shows positive magnetic anomalies in black and negative anomalies in white. The grayscale image is shown at 70% opacity in Figure 1 and Figure 2 to facilitate visualization of the bubble plots. The x–y graphs also show the lateral variation of the χlf (blue line) and P (orange line), including the magnetic-gradient intensity (Gr, purple line). In the graphs, the location of the targeted features is indicated in green (the labels A and B indicate the two areas in Lines 1 and 2). The location of the in-depth augered points is indicated as a reference for Figure 8, where the in-depth results are shown. The location of the lines is shown in Figure 2.
Geosciences 13 00003 g007
Figure 8. In-depth results of the low-frequency magnetic susceptibility (χlf) and frequency-dependent susceptibility (and phosphate only for A3) of the ‘auger’ samples and off-site controls at Almyriotiki. The location of the auger points in each exploratory line is shown in Figure 7.
Geosciences 13 00003 g008
Figure 9. Bubble plots (overlying the magnetometer survey results) showing the lateral low-frequency magnetic susceptibility (χlf, in blue) and phosphate (P, in orange) distribution along the exploratory lines at Perdika II. The grayscale image shows positive magnetic anomalies in black and negative anomalies in white. The grayscale image is shown at 70% opacity in Figure 1 and Figure 2 to facilitate visualization of the bubble plots. The x–y graphs also show the lateral variation of the χlf (blue line) and P (orange line), including the magnetic-gradient intensity (Gr, purple line). In the graphs, the location of the targeted features is indicated in green (the labels A, B and C indicate the different areas). The location of the in-depth augered points is indicated as reference for Figure 10, where the in-depth results are shown. The location of the lines is shown in Figure 2.
Geosciences 13 00003 g009
Figure 10. In-depth results of the low-frequency magnetic susceptibility (χlf) and frequency-dependent susceptibility of the ‘auger’ samples and off-site controls at Perdika II. The location of the auger points in each exploratory line is shown in Figure 9. The squares indicate the solid materials reached with the augers.
Geosciences 13 00003 g010
Figure 11. Georeferenced GPR time slice at 0.7, 0.8 m depth (a) and related annotations of the reflections of interest in pink and high-resistance anomalies in dark blue (b) overlying the magnetometer survey data (modified from [39]). The text in yellow indicates the different features identified in the geophysical data (e.g., A1, A2 and A4 refer to the enclosures and A21–A22 notes the structures). The inset at the top shows the related magnetometer results and grid location. The grayscale range is the same as that plotted in Figure 1 and Figure 2.
Geosciences 13 00003 g011
Table 1. General characteristics of the three study sites.
SiteDateGeomorphology/Current Land UseGeologySoil
RizomilosEarly Neolithic 6500 B.C.—Early Bronze Age ~3300 B.C.Circular low hill/A farm is located at the top of the hill
surrounded by arable land.
Pleistocene (marine
deposits: marl, clay, sand and conglomerate,
marine terraces).
Cambisol
AlmyriotikiEarly Neolithic ~6500 B.C.—Late Bronze Age ~1100 B.C.Fairly low elevation with a circular top/
Covers several
agricultural fields.
Holocene (recent deposits on valleys, plains and coasts.Cambisol
Perdika IIMiddle Neolithic ~6000–5500 B.C.Top of a steep high hill/Fallow.Neogene (lacustrine and marine deposits:
conglomerates,
sandstone, marl, clay
occasionally with lignite beds). Close to
Cretaceous flysch.
Luvisol
Table 2. General description of the soil samples collected and archaeological targets at the three sites. The location of the sampled lines is in Figure 2.
RizomilosAlmyriotikiPerdika II
Lines3 (122 soil samples)6 (140 soil samples)2 (95 soil samples)
Targeted
anomalies
Concentric ditch-like positive magnetic
anomalies and similar linear ditch-like anomaly
Strong positive magnetic anomalies of possible burnt structures, possible structures of negative
magnetic contrast, and ditch-like magnetic anomalies
Different positive magnetic anomalies of possible enclosures and structures
Augers8 (87 soil samples, to a
depth of 1 m). Features
augured were not
bottomed
22 (117 soil samples)49 (106 soil samples), some augers reached the feature’s bottom/solid
geology (most enclosure targets were bottomed at 0.32–0.5 m)
Field useMostly a fallowfield, with some ploughed areasHarvested field (wheat, cotton and corn). Bailing works at the field containing the nucleus of the site limited the soil samplingFallow
TextureGrayish brown, silty loam. Soil was quite moist during sampling but dried quicklyGeosciences 13 00003 i001Brown clay loam (the soil texture in Line 9 was
especially clayey)Geosciences 13 00003 i002
Reddish brown sandy loam and very organic topsoil. South area had very sandy soil with lenses of chalk and clayGeosciences 13 00003 i003
Controls1 auger (14 soil
samples)
2 augers (20 soil samples)2 augers (11 soil samples)
Table 3. Mean (average) values and % increase of magnetic susceptibility (χ 10−6 m3kg−1) and phosphate (P, ppm) at the three sites at the sampling depth of the exploratory lines.
Rizomilos
(0.25–0.30 m Depth)
Almyriotiki
(0.25–0.30 m Depth)
Perdika II
(0.15–0.20 m Depth)
χlfPχlfPχlfP
Mean (Lines)1.55 × 10−618042.30 × 10 −642301.28 × 10−61795
Mean (Controls)1.01 × 10⁻⁶-1.04 × 10−64294.93 × 10−7453
% Increase53%-122%886%159%296%
Table 4. Mean values of the low-frequency magnetic susceptibility (10−6 m3 kg−1) and frequency dependence (%) at Rizomilos and Almyriotiki.
RizomilosAlmyriotiki
AugersA1A2B1C1C2ControlsC1C2C3C4C5Controls
Mean χlf1.71.81.71.41.29.0 × 10−72.32.32.13.32.57.6 × 10−7
Mean χfd7.58.17.36.96.76.638.678.918.499.147.956.63
Disclaimer/Publisher’s Note: The statements, opinions and data contained in all publications are solely those of the individual author(s) and contributor(s) and not of MDPI and/or the editor(s). MDPI and/or the editor(s) disclaim responsibility for any injury to people or property resulting from any ideas, methods, instructions or products referred to in the content.