1. Introduction
On 6 February 2023, two major earthquakes struck the southeastern part of Turkey and the northwestern part of Syria. The first earthquake of Mw = 7.8 struck at night (04:17, local time) [
1] and 9 h later a second earthquake of Mw = 7.5 [
2] caused widespread impact on the local population and the natural and built environment in 11 provinces of southeastern Turkey, home to nearly 14 million Turks and 2 million refugees from neighboring Syria. Human casualties amounted to 50,399 and injuries to 107,204, according to the latest official announcements [
3]. Nearly 2.5 million earthquake-affected residents live in temporary settlements, while 1.6 million of them are staying in unofficial settlements [
3].
These impressive numbers of impacts on the local population are among the largest recorded with a major earthquake in recent decades worldwide and the largest since the 2010 Haiti Mw = 7.0 earthquake. As for Turkey, the first major Mw = 7.8 earthquake is the largest, the most destructive and the deadliest since the 26 December 1939 Erzincan Mw = 7.9 earthquake [
4] generated along the North Anatolian Fault Zone. This seismic event produced a 330-km-long multi-segment surface rupture [
4] resulting in 116,000 seriously damaged buildings and almost 33,000 casualties [
5,
6].
These high numbers of casualties and injured and homeless people are attributed to the extensive heavy and very heavy structural damage corresponding to damage grades 4 and 5 in terms of the European Macroseismic Scale EMS-98 [
7] that were caused in the earthquake-affected area. Until 6 March 2023, i.e., 1 month after the occurrence of the devastating earthquakes, 1,712,182 buildings in the 11 affected provinces were checked by competent authorities. In total, 35,355 buildings collapsed, 17,491 had to be demolished immediately, 179,786 suffered severe damage, 40,228 suffered moderate damage and 431,421 were slightly damaged [
3]. This damage resulted in hundreds of millions of tons of collapse and demolition debris, which is considered the largest debris volume of all disasters induced with natural hazards since the 1994 Northridge earthquake and emergence of several challenges related to environmental and public health [
8].
In regards to the impact of the earthquakes on public health during the emergency response and recovery periods, based on the disaster-related field data collected by Mavrouli et al. [
9], it was revealed that many risk factors favoring the emergence of infectious diseases are present in the devastated areas. These factors comprised collapse of many health facilities including state hospitals, adverse weather conditions, destruction of lifelines, infrastructures, overcrowding in inadequately equipped emergency shelters, poor sanitation and adverse socioeconomic conditions along with the other parallel evolving crises and disasters, such as conflicts, the pandemic and epidemics [
9].
The obvious reasons that contributed to the disaster comprise the large magnitude of the earthquakes, the generation of the first earthquake during the night that found the majority of the population in their homes, the demographic characteristics of the region that include densely built-up and populated areas as well as the proximity of many residential areas to the ruptured faults. Furthermore, the synergy of significant factors, which are strongly related to the seismotectonic setting of the area, the earthquake environmental effects (EEEs) and the characteristics of the affected structures resulted in one of the largest earthquake disasters in the modern history of the country.
The aim of this research is to highlight the factors related to building properties and the generation of EEEs that control the grade and the spatial distribution of building damage in the studied earthquake-affected areas of southeastern Turkey. This aim is achieved through the presentation of typical examples of primary effects such as coseismic surface ruptures and secondary effects including mainly liquefaction and lateral spreading phenomena and their destructive impact on the built environment. Furthermore, examples of areas with instability conditions attributed to high liquefaction potential and high landslide susceptibility are also presented along with cases where the synergy of the active faults and intense morphology contributed to devastation within large residential areas of southeastern Turkey. The examples used for this aim come mainly from areas located along the main strand of the East Anatolian Fault Zone (EAFZ), which were affected by the Mw = 7.8 earthquake, and secondarily from areas located along its northern strand, which were affected by the second earthquake.
2. Methodology
The data presented in this study were obtained during the scientific mission of the Department of Geology and Geoenvironment of the National and Kapodistrian University of Athens (NKUA). In the frame of this mission, two post-event field surveys were conducted by the authors in the earthquake-affected area of Eastern Anatolia. The first one was conducted shortly after the earthquakes and lasted from 7 to 11 February, while the second one was conducted almost 2 months after and lasted from 31 March to 6 April. During these field surveys, the authors collected data in the disaster field, which are related to primary and secondary EEEs and their impact on the built environment, aiming to reveal the factors controlling the spatial distribution and the grade of building damage in the earthquake-affected area.
The field survey was expanded to many segments of the devastated area including not only the affected urban parts, such as large cities and towns suffering with extensive damage and human losses, but also rural parts, where primary and secondary EEEs were initially identified and recorded.
The scientific team of the NKUA initially used conventional methods of geological mapping and detection of EEEs. Furthermore, the team exploited the advantages of modern and innovative methodologies such as Unmanned Aerial Systems (UAS) in the field. Flights were carried out at several sites of interest. Primary and secondary EEEs were identified and recorded along with damage to buildings in an attempt to realize and interpret their triggering mechanisms and their spatial distribution.
All data obtained from the field mapping of the effects of the major earthquakes were evaluated by the scientific team, and the main factors that contributed to the disaster and largely determined the type, the degree and the spatial distribution of the generated damage in the affected urban and rural areas of Eastern Anatolia were extracted.
In this context, the main geological and geomorphological properties of these areas and their tectonic structure are also discussed, with emphasis on active and seismic faults. In addition, it was considered important to report on the dominant building categories of the earthquake-affected area and their properties that affected their performance during the earthquakes, their pre-seismic use and the main types of the observed structural and non-structural building damage, as well as several issues related to the seismic design of structures that contributed to the extended human and economic losses.
3. Geodynamic and Seismotectonic Setting of the Earthquake-Affected Area
3.1. Regional Tectonics and Seismicity
The EAFZ is one of the major transform fault zones in the Eastern Mediterranean region and dominates the eastern part of Turkey [
10,
11,
12,
13]. It extends from the Karlıova region in the north to the Antakya region in the south (
Figure 1). It constitutes a complex left-lateral strike-slip fault zone with a length of about 580 km that separates the Anatolian plate located northwestwards from the Arabian plate located southeastwards [
12,
13]. The eastern part of the EAFZ extended from Karlıova to Çelikhan is composed of a single fault trace, while its western part constitutes a 65-km-wide deformation zone, which comprises two strands, the northern and the main, which are also segmented (
Figure 1) [
13].
The main strand of the EAFZ is composed of seven segments, namely the following [
14,
15,
16] (
Figure 1): (i) the N50° E striking Karlıova segment (KS in
Figure 1) extending from Karlıova to Göynük, (ii) the N40° E striking Ilıca segment (IS) extending from Göynük to Ilıca with a length of about 40 km, (iii) the N62° E striking Palu segment (PALS) extending from Palu to Sivrice with a length of 77 km, (iv) the N60° E striking and 96-km-long Pütürge segment (PS) extending from Sivrice to the east of Malatya, (v) the N75° E striking Erkenek segment (ES) extending with a length of 62 km from Çelikhan to Gölbaşı, (vi) the N60° E striking Pazarcık segment (PAZS) extending with a length of 82 km from Gölbaşı to Türkoğlu and (vii) the N35° E striking Amanos segment (AMS) from Türkoğlu to Kırıkhan.
Characteristic examples of fault jogs along the EAFZ comprise [
13,
14] the Gökçedere restraining bend (GRSB in
Figure 1) between the Ilıca and the Palu segments, the Lake Hazar releasing bend (LHRB) between the Palu and the Pütürge segments, the Gölbaşı releasing stepover (GRS) between the Erkenek and the Pazarcık segments and the Türkoğlu releasing bend (TRB) between the Pazarcık and Amanos segments (
Figure 1). Their width varies from 2 to 25 km and their length from 4 to 16.5 km.
The northern strand of the EAFZ develops from Çelikhan to Göksun with an average E-W direction, while its direction changes from E-W to NE-SW at the Göksun bend located west of Çardak up to the Kozan area, where it terminates [
14] (
Figure 1). The E-W striking fault system is structured with the Sürgü and Çardak segments located east and west of the Nurhak restraining bend, respectively [
14] (
Figure 1). The western part of the northern strand comprises eight segments according to Duman and Emre [
13]. These segments are characterized as left-lateral strike-slip structures based on the existing linear offset geomorphic features identified in the field, such as offset stream channels, shutter ridges and fault scarps.
The EAFZ is responsible for the generation of several devastating earthquakes during not only the antiquity and the historical period [
16,
17,
18,
19], but also the period of instrumental recordings [
11,
20,
21,
22]. The above segments have been active at different times, producing strong and destructive earthquakes with significant and extensive impact on the natural environment and the building stock and consequently on the population of the affected areas. The most recent seismic events along the EAFZ are the 27 June 1998 Mw = 6.3 Adana-Ceyhan earthquake [
23], the 1 May 2003 Mw = 6.4 Bingöl earthquake [
24], the 8 March 2010 Mw = 6.1 Başyurt (Elazığ) earthquake [
25], the 23 October 2011 Mw = 7.1 Van earthquake [
26] and the 24 January 2020 Mw = 6.8 Elazığ earthquake [
27]. The most destructive events of the instrumentally recorded seismic activity in the EAFZ are the earthquakes of 6 February 2023 with Mw = 7.8 and Mw = 7.5, respectively.
Regarding the distribution and recording of seismic events in the earthquake-affected area, relevant research about historical sources of macroseismic data shows that the area had not experienced a strong earthquake with extensive damage and human losses for 200 years [
19]. The last such earthquake occurred on 13 August 1822 with Ms = 7.0 and 20,000 human losses [
28]. Based on the above data, the Amanos segment was classified as a seismic gap along the main strand of the EAFZ until the occurrence of the catastrophic earthquakes of early February 2023.
3.2. The 6 February 2023 Earthquakes
On 6 February 2023, at 04:17 (local time), an Mw = 7.8 earthquake struck Eastern Anatolia. Its epicenter was located at a distance of 37 km west-northwest of Gaziantep city (
Figure 1), according to the related information provided by the US Geological Survey [
1]. It was a shallow event, with a focal depth of 12 km [
29] and it was caused by the rupture of a NE-SW striking near-vertical left-lateral strike-slip fault according to the related information provided by several seismological institutes and observatories [
30]. An Mw = 6.7 aftershock followed 11 min after the generation of the mainshock.
The properties of the Mw = 7.8 earthquake as well as its focal mechanism are consistent with the events that occurred along or close to the EAFZ and the Dead Sea Fault Zone, which accommodate the westward extrusion of the Anatolia plate into the Aegean Sea region and the northward motion of the Arabian plate relative to the Africa and Eurasia plates, respectively [
31].
A new major earthquake was generated along the EAFZ 9 h after the Mw = 7.8 event. Its magnitude was Mw = 7.5 and its epicenter was located along the northern strand of the EAFZ (
Figure 1), at a distance of 33 km south of Elbistan [
2].
Taking into account the spatial distribution of the aftershocks of both major events generated in different segments of the EAFZ, it is concluded that all events were distributed along the southwestern part of the fault zone and more specifically along the southwestern part of its main strand and the eastern part of its northern strand. In regards to the distribution of these events in depth, it is concluded that the entire crust between 3 and 25 km suffered deformation, which has been distributed mainly along major faults [
29].
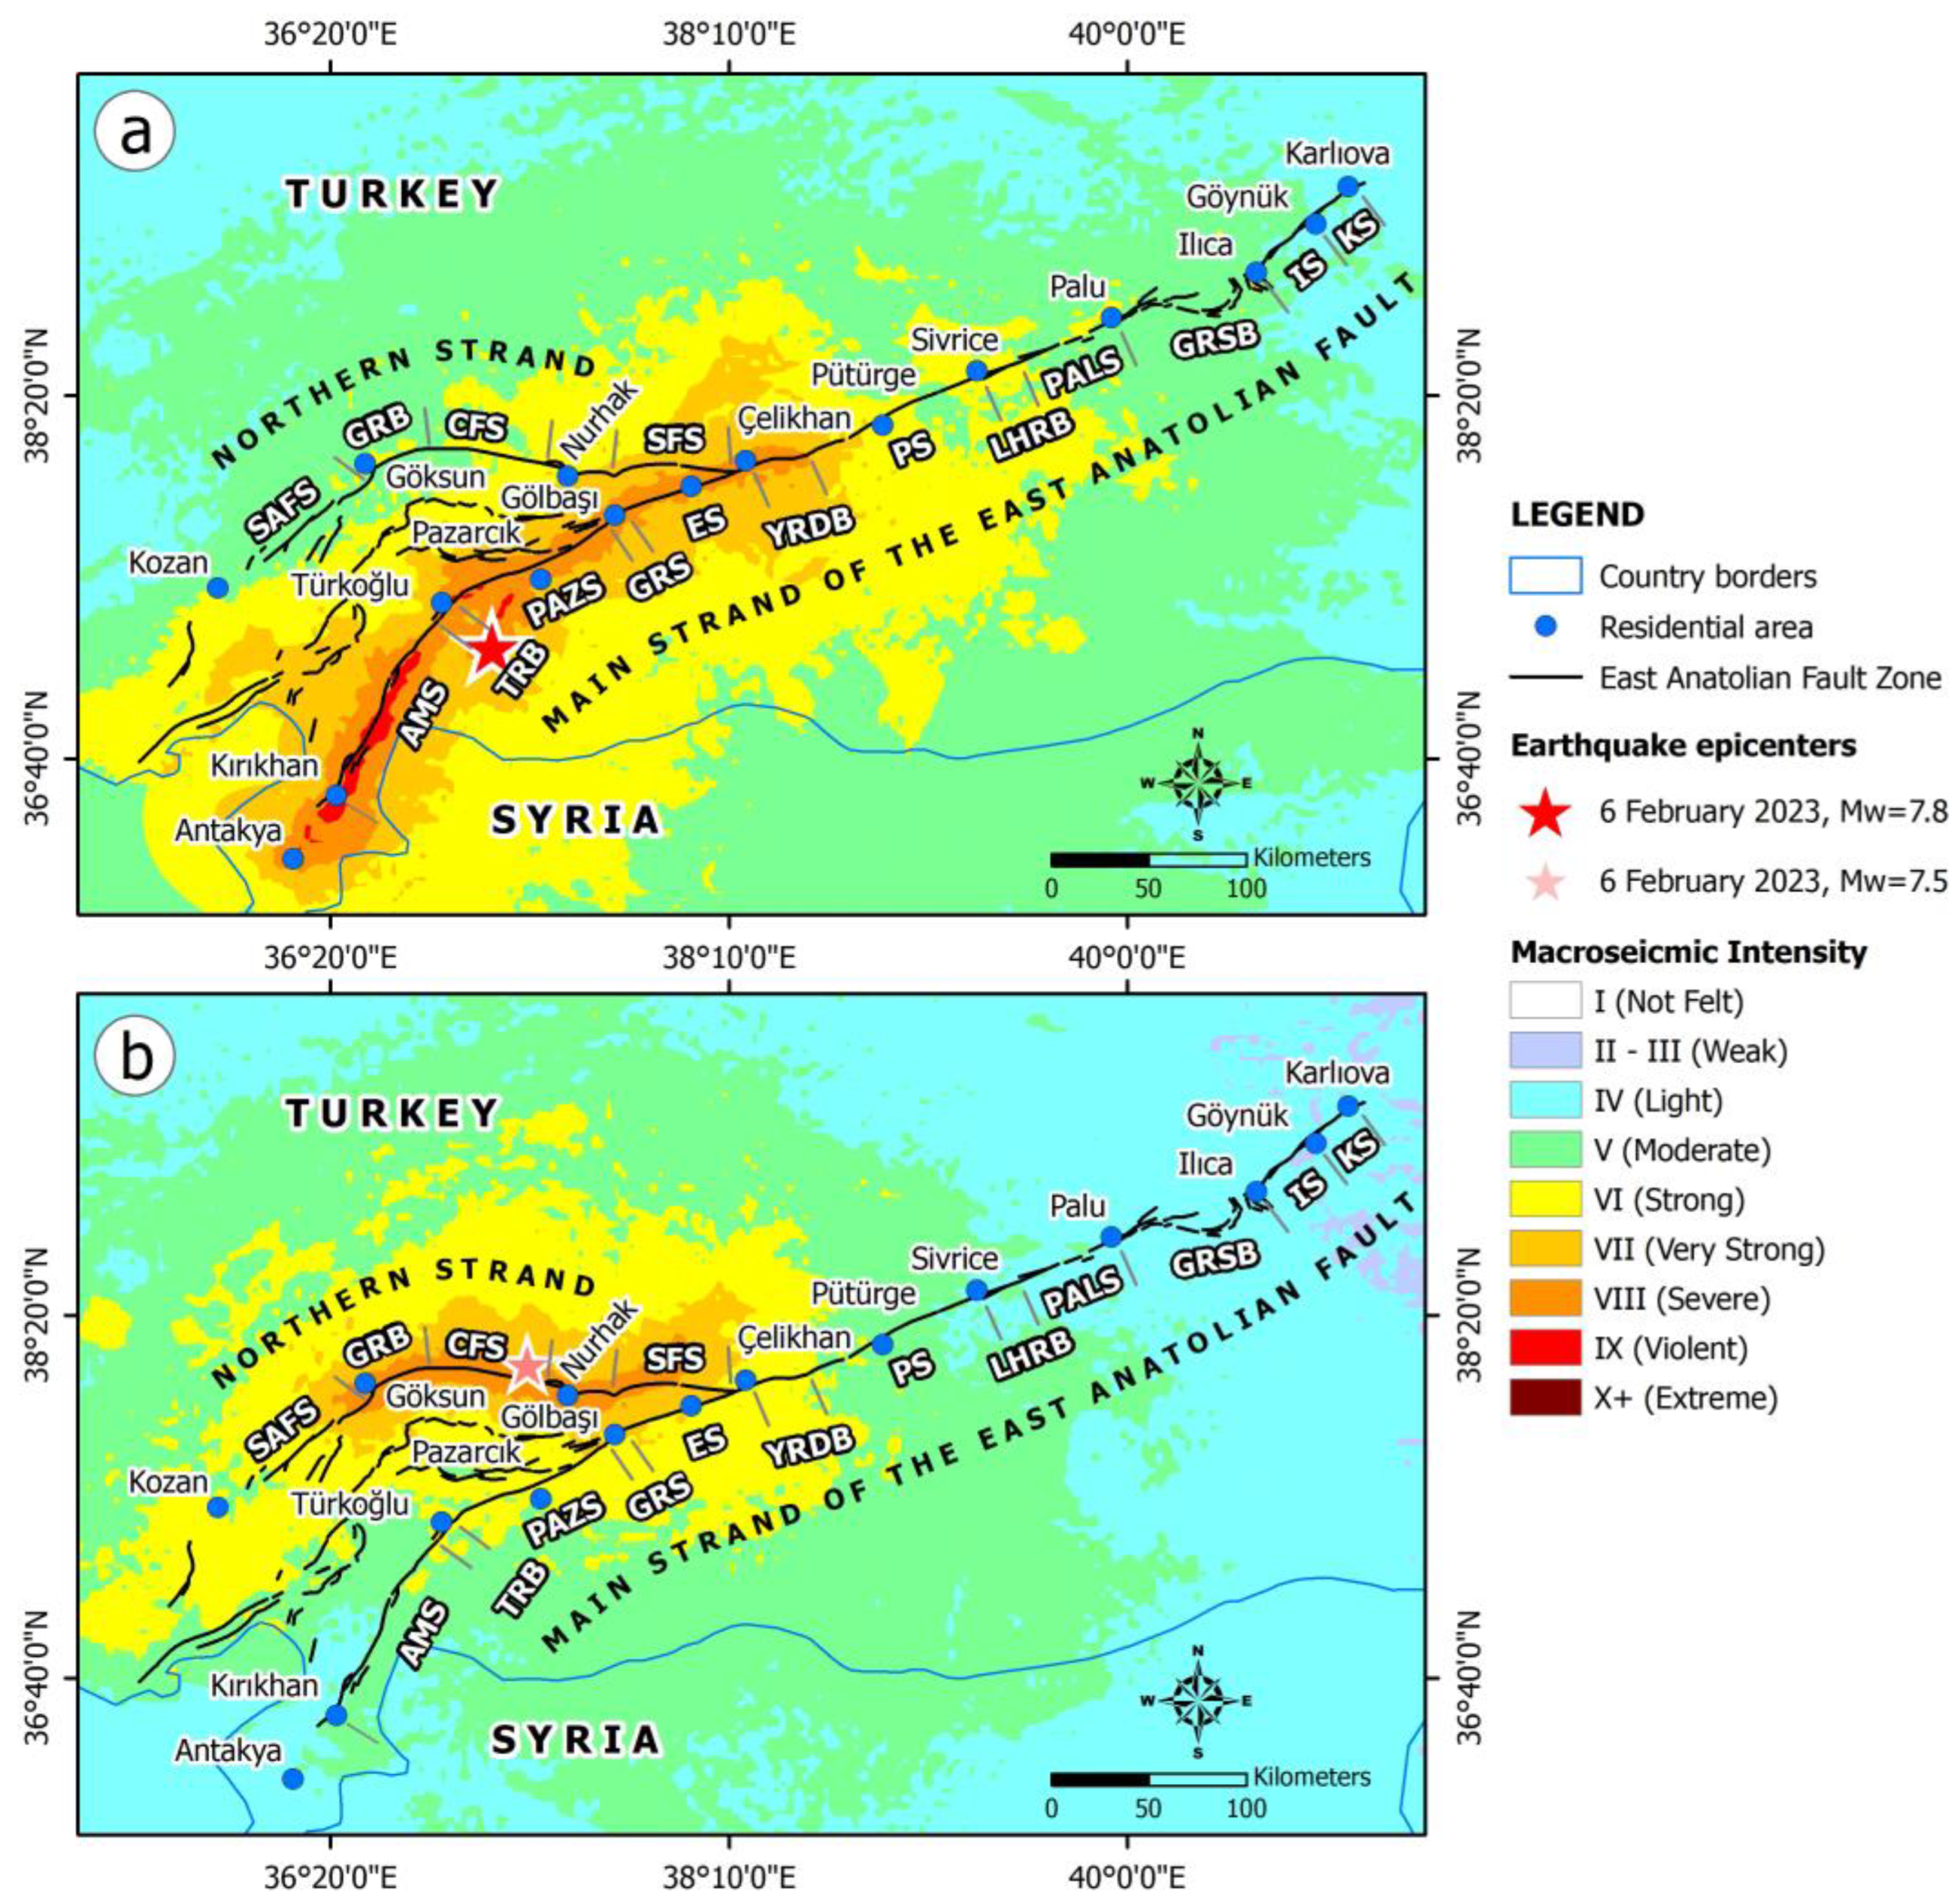
Both 6 February 2023 earthquakes caused extensive primary and secondary EEEs in the earthquake-affected area. The first comprised mainly coseismic surface ruptures (
Figure 2) along with typical structures in strike-slip deformation zones comprising pull-apart basins and pop-up ridges, while the latter included ground cracks, slope failures, liquefaction phenomena and tsunami and hydrological anomalies in affected Eastern Anatolia [
31,
32,
33]. These effects along with the strong ground motion [
34,
35] caused extensive impact on the buildings and infrastructures of the affected residential areas, resulting in not only structural and non-structural damage but mainly heavy loss of life [
3]. In the following maps (
Figure 2), the distribution of the coseismic surface ruptures along the main and the northern strand of the EAFZ is presented along with the distribution of the large residential areas founded along the zone and visited by the authors during their post-event field surveys. The visited areas presented herein include, from northeast to southwest, the areas of Gölbaşı, Kahramanmaras, Balkar, Türkoğlu, Beyoğlu, Şekeroba, Yeşilyurt, Nurdağı, İslahiye, Hassa, Antakya and İskenderun along the main strand of the EAFZ and the areas of Göksun and Saylan along the northern strand of the EAFZ.
4. Dominant Building Types and Building Damage in the Earthquake-Affected Area
4.1. Dominant Building Types and Construction Factors Leading to Devastation in the Earthquake-Affected Area
The dominant structural type not only in Turkey but also in the earthquake-affected area of Eastern Anatolia comprises buildings with a reinforced concrete (RC) load-bearing structure [
36]. According to the Ministry of the Interior’s data on the types of load-bearing systems in the earthquake-affected area, 86.7% of buildings were constructed with reinforced concrete [
3]. The prefabricated buildings follow with 3.6%, masonry buildings with 3.5% and steel buildings with 2.4% [
3]. The remaining percentage is occupied by wooden, mixed or unspecified load-bearing systems. As for the apartments, 95.4% are made of reinforced concrete, while the other types occupy very low percentages [
3]. The above percentages refer to buildings and apartments for which there is a building permit.
After the 1999 Marmara earthquake that caused great loss of life and property, many actions were taken to minimize the impact of future earthquakes. One of the most important is the compulsory earthquake insurance. Until the February 2023 earthquakes, insurance rates in the 11 earthquake-affected provinces of Eastern Anatolia ranged from 40.10% (in Hatay province) to 70.30% (in Gaziantep province). In particular, in three provinces, the insurance rate was below 50%, in five provinces, it ranged between 50% and 60% and in three provinces, between 60% and 70% [
37] (
Figure 3).
A large part of the RC buildings in Turkey have several deficiencies such as low-quality concrete, non-seismic reinforced detailing and inappropriate structural systems that include several structural irregularities, among others [
36]. Because most of the buildings in Turkey were constructed before the 2007 Turkish Earthquake Code, their seismic behavior and strength characteristics are limited and inadequate, and irregularities constitute a significant risk. Furthermore, the fact that many of the buildings with structural irregularities are multi-story structures increases the already existing risk.
Since 1960, the Turkish government has regularly granted so-called construction amnesties [
38]. This policy involves exempting builders and building owners from the obligation to comply with regulations in return for a fee. The last amnesty was granted in 2018 [
38]. Under the 2018 law, a construction registration certificate could be issued for buildings in rural and urban areas that were not licensed or registered before 31 December 2017 for a certain fee [
38]. In addition, the earthquake resistance of buildings that had a registration certificate was the responsibility of the building owner [
38]. The situation conflicts with the purpose of the law to reduce the disaster risk since buildings that were not licensed according to the seismic regulation had a high vulnerability in case of an earthquake. According to Turkey’s Ministry of Environment, Urbanization and Climate Change [
3], 7,085,969 building permits were issued across Turkey and 294,165 illegal buildings were legalized after 2018 in the February-2023-earthquake-affected area (
Figure 4).
By 6 March 2023, post-earthquake inspections had been completed for 1,929,313 buildings in 11 earthquake-affected provinces. Buildings, which collapsed, that suffered very heavy structural damage and required immediate demolition amounted to 518,009 [
3] (
Figure 5). Those that had suffered moderate damage amounted to 131,577 and those with light damage amounted to 1,279,727 [
3] (
Figure 5).
Most of the buildings that had collapsed or required immediate demolition were recorded in Hatay province located in the southwestern part of the earthquake-affected area and comprise 215,255 buildings with Kahramanmaras and Adiyaman provinces following with 99,326 buildings and 56,256 buildings, respectively (
Figure 5). Considering the similarities in the dominant types and uses of buildings and construction deficiencies between the affected provinces, it could be concluded that the low percentages are attributed to their larger distance from the ruptured strands of the EAFZ.
From the above data and the corresponding maps of the distribution of the insurance rate and applications for the construction registration certificate in the 11 affected provinces, it can be seen that the devastated provinces have recorded the highest number of applications for legalization of illegal buildings and the lowest rates of building insurance. A typical example is Hatay province, which ranks first among the provinces with the most buildings that collapsed during the earthquakes or needed urgent demolition after the destructive events (
Figure 5). This province was found to have the lowest rate of insuring buildings against earthquakes (
Figure 3) and the highest number of applications for the construction registration certificate (
Figure 4) among all provinces. The coexistence of large numbers of construction registration certificates and low insurance rates reveals that the population has low perception of seismic risk among other factors including high premiums and socio-demographic features of the homeowners and the affected communities [
40,
41]. Furthermore, the high number of applications for legalization of structures may have contributed to the low coverage rate, as insurance companies are less likely to cover the risk of buildings that do not meet technical criteria.
4.2. Dominant Types of Structural Failure in the Earthquake-Affected Area
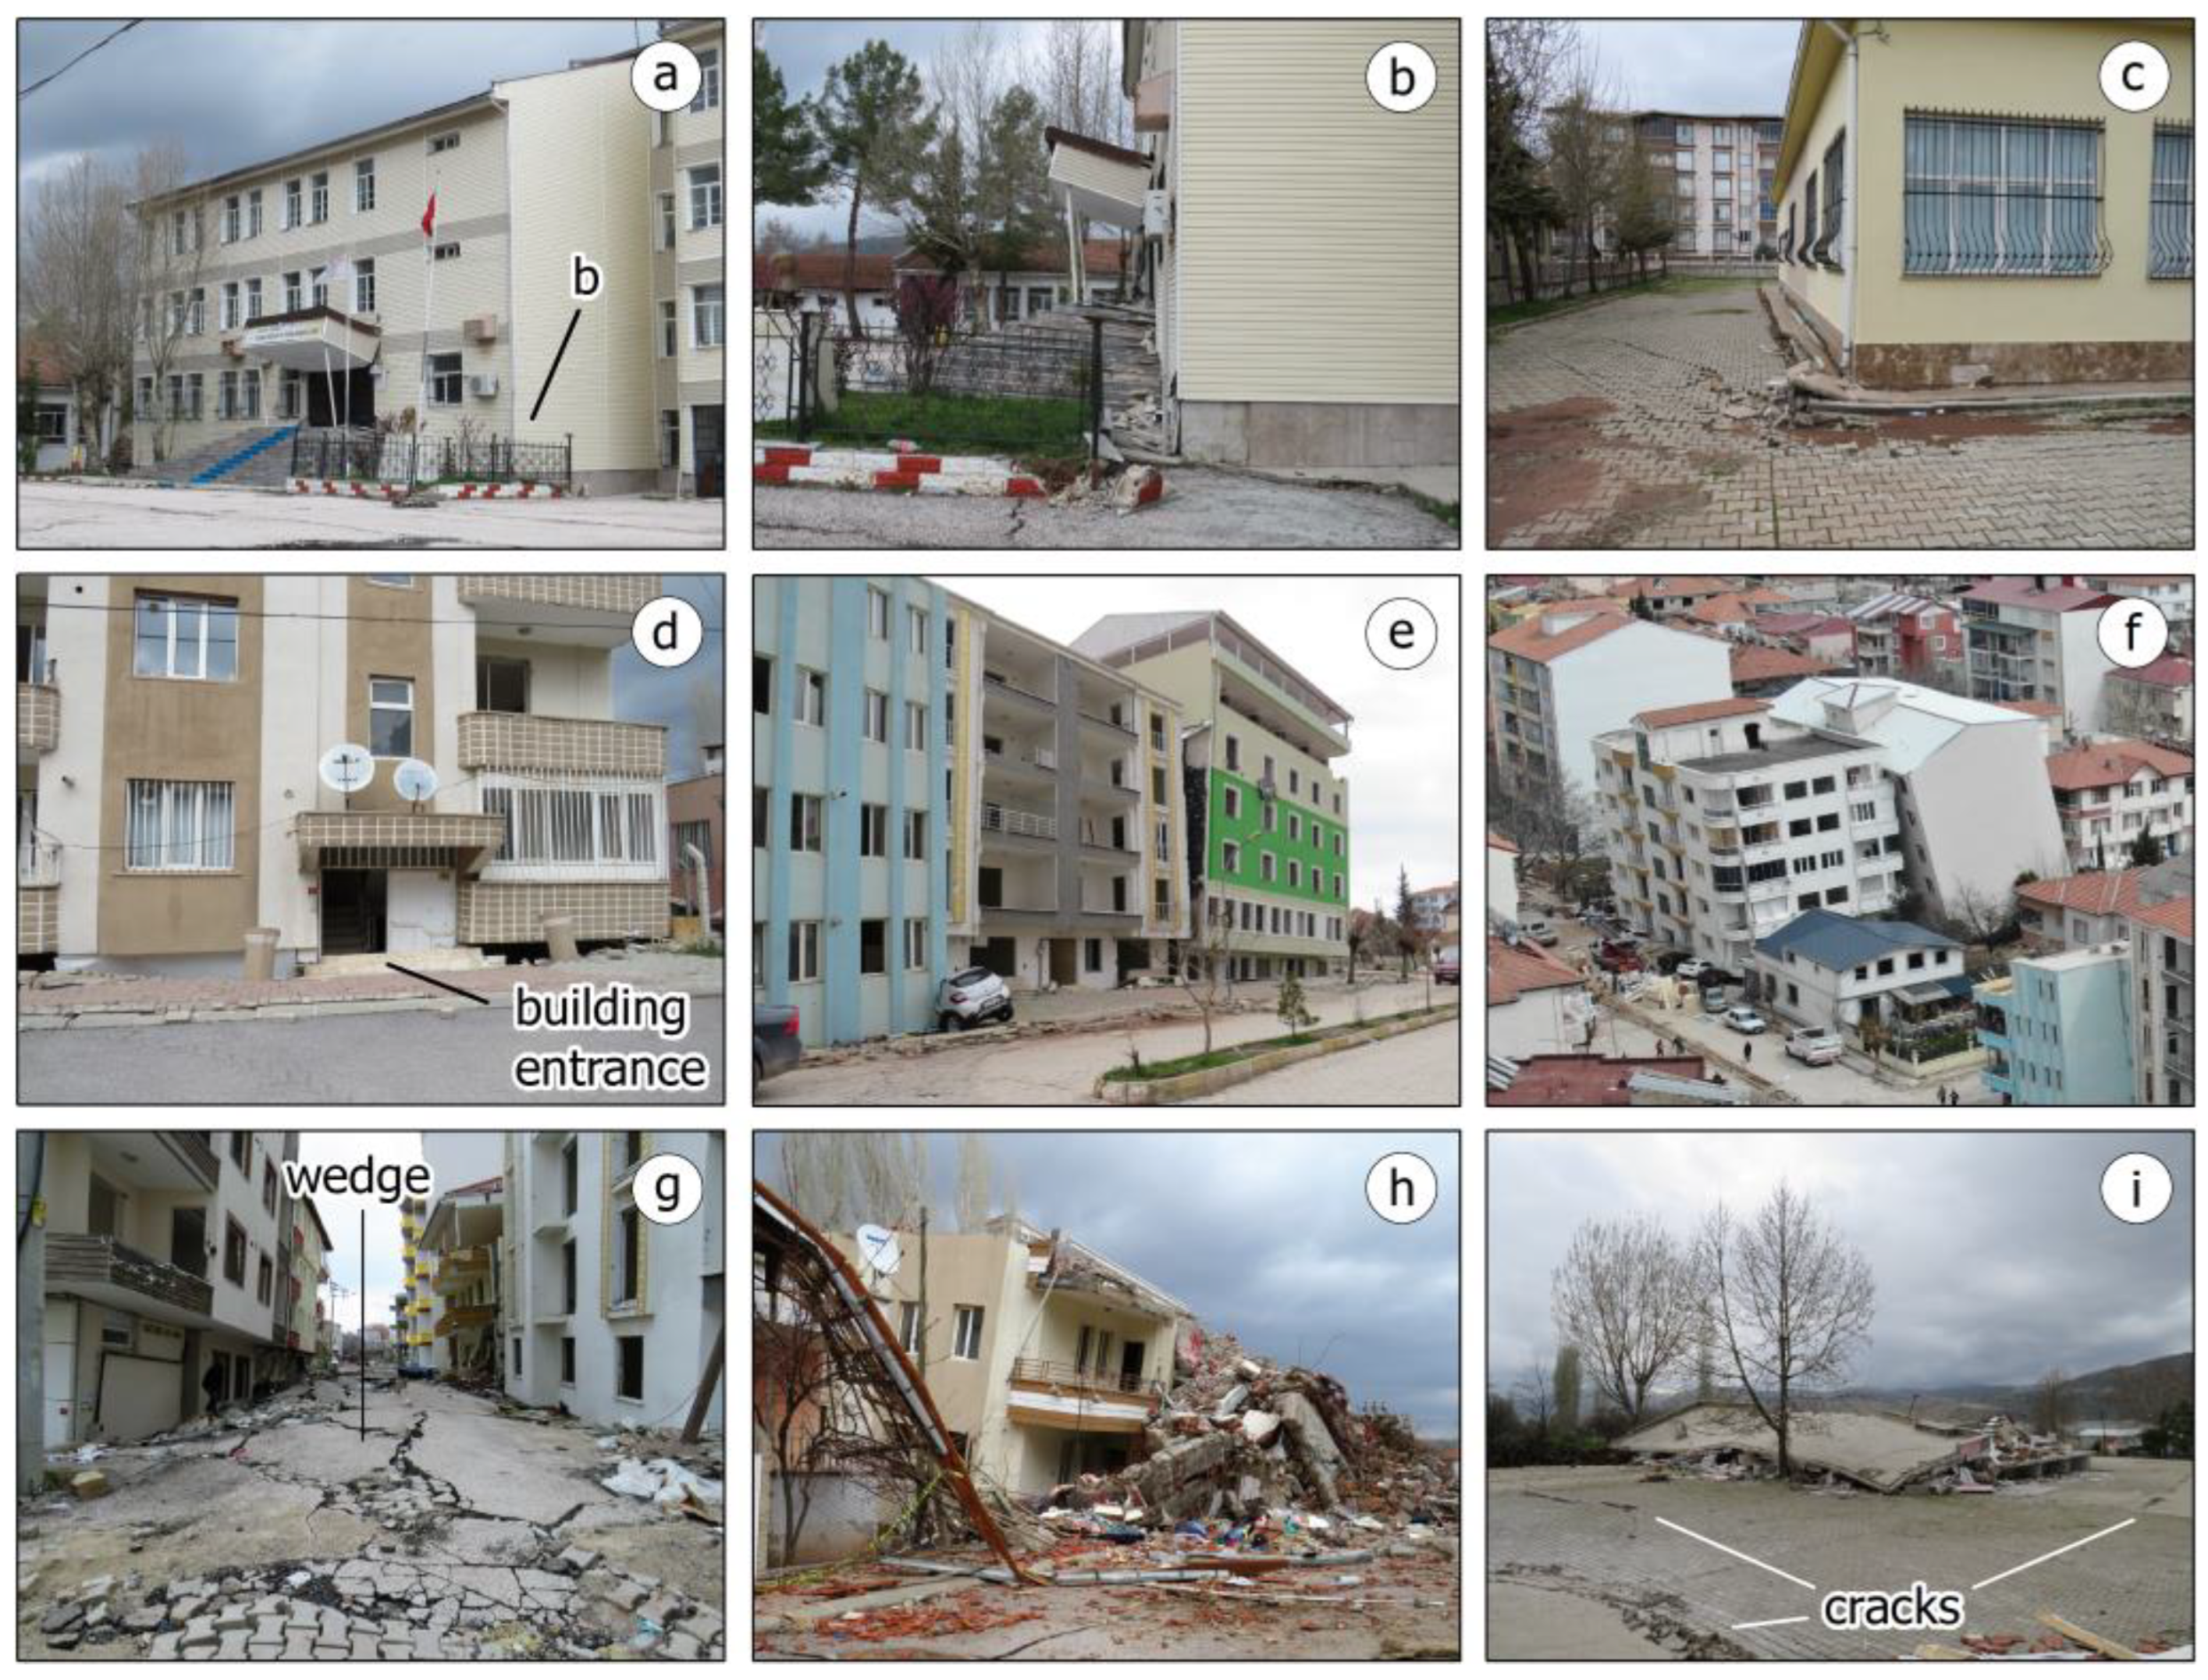
The performance of residential buildings during the early February 2023 earthquakes is of greater importance and will be further studied. Apart from structures that remained completely unaffected by the earthquake (a fairly rare case), the others suffered damage, which are presented below in increasing order of damage grade (
Figure 6):
Capillary and/or medium-sized cracks (damage grade 1 in EMS-98), which in most cases do not raise cause for concern (
Figure 6a).
Large-sized or even penetrating cracks (damage grades 2 and 3), which require further investigation (
Figure 6b).
Partial and/or total collapse of constructions’ entire sections, which are, however, related to secondary structural elements such as cantilevers, infill walls, canopies, etc. (damage grade 4;
Figure 6c).
Damage to the structures’ load-bearing system, with partial (irreversible) and/or total collapse of the structure (damage grade 5;
Figure 6d).
4.3. Assessment and Justification of the Recorded Structural Failures
A significantly large number of buildings (especially high-rise ones) have collapsed within the perimeter that was defined with the projection of their ground-floor plans. This type of collapse is nearly vertical, without significant lateral displacements or rotations around the vertical axis, and it was observed primarily at the epicentral area, regardless of structural properties (design, height, orientation, construction and materials’ quality, ground conditions, etc.).
The seismic performance of single buildings in the epicentral area was in general more unfavorable compared to the cases where similar buildings were located next to each other, forming a building complex. Due to the vertical motion in the epicentral areas, these building complexes worked in favor of their structural performance, which is something that might not have been the case outside the epicentral area, where the horizontal motion prevailed. Interesting examples of these two extreme cases include the rhythmic destruction, a phenomenon detected by Carydis et al. [
42,
43] in the areas affected by the February-March 1981 Athens (Central Greece) earthquake sequence and the 1 October 1995 Dinar (Turkey) earthquake, and the lethal domino-type progressive collapse [
44,
45,
46]. The first is observed in rows of either similar or identical buildings constructed within a small distance, on the same soil conditions and characterized with a great variation in the observed damage, from an almost intact structure up to partial or total collapse. The second effect occurs when the structural elements are loaded beyond their ultimate capacity and fail with the initial local failure spreading from element to element, eventually resulting in the collapse of either the whole structure or a disproportionately large part of it [
44,
45,
46] (
Figure 7a).
After observing earthquake collapse and demolition debris (sand, gravel and rebar) in several sites of the disaster field, it was apparent that smooth, practically frictionless and round riverbed material was used in the concrete mix. Furthermore, it was obvious that the concrete was of poor quality with an inadequate amount of cement, since the observed steel reinforcement bars that had been uncovered were remarkably clean, without any cement paste detected on their surface (
Figure 7b), with the same concept also being observed for the aggregates.
Following our field observations, the collapse and demolition debris uncovered an alarming situation concerning the steel bars of the longitudinal reinforcement that were considerably reduced in size (with smaller cross-section areas) and in number (lesser amount), while the stirrups were even smaller in size and irregularly spaced in rather long distances. In many cases, non-ribbed steel (St_37 grade) was used, even in newer structures, overlooking the use of ribbed steel rebars, which provide higher tensile strength and greater bond friction, and it had already been universally implemented in construction. Furthermore, the crucial aspects of the steel reinforcement bars, comprising the anchoring, the overlap and the tying, were in the majority of the collapsed or heavily damaged cases incorrectly placed and/or joined/welded, revealing the sketchiness of the construction techniques, which can be attributed to either a low level of expertise or an attempt to reduce the construction time and cost (or both of them). Such deficiencies are observed not only in the disaster field of East Anatolia but also to RC buildings worldwide designed and constructed without the application of seismic regulations. A typical example comes from Italy, where plain reinforcing bars, inappropriate anchorage solutions and the lack of joint horizontal hoops are widespread [
47,
48].
Another important factor that portrayed a significant role in the performance of buildings during the earthquakes was the poorly designed composition of the load-bearing system (i.e., the conceptual design). This crucial parameter, accompanied with a series of harmful constructional practices (poor workmanship and low-quality construction materials), vastly contributed to the extent of the structural failures that were observed and hence towards the tragically increased number of the human losses all over the earthquake-affected area. The primary structural elements (columns and beams) were placed incorrectly, in terms of both their position and orientation in the building’s floor plan, in addition to being inadequately designed (small cross-sections or/and poorly reinforced). The beam or slab-column joints were also proved to be inadequately detailed and reinforced, with their supposed resistance having been reduced—or even eradicated—resulting in structural insufficiency (
Figure 7c). In some cases, after the collapse and/or overturning of multistoried buildings, it was observed that their foundation was geometrically inadequate, in relation to the height of the building and the rather poor quality of the ground.
A designing/construction norm that was observed mainly in recently constructed buildings imposed the construction of large cantilevers (as balconies) on the perimeter of the residential buildings. The issue arises when the stakeholders decide to convert these balconies into living (enclosed) spaces, which means that most of them had been built (on the outer perimeter) with masonry walls. Due to the fact that the cantilevers’ vertical oscillation is greater (compared to the main structure) and taking into consideration the dominant vertical seismic vibration within mainly the rather abundant epicentral areas (as already mentioned), the parts of the structure that were constructed in order to cover these spaces were heavily loaded and damaged, adversely affecting the seismic performance of the entire building (
Figure 7d). It can also be noted that most of the observed damage on the cantilevers/balconies were pronounced on the lower floors, while decreasing towards the upper floors, revealing an interesting damage distribution.
To recapitulate, it is worth mentioning that all the aforementioned conclusions on the properties, the seismic performance and the triggered damage of buildings arose solely from field observations. Furthermore, based on studies on strong ground motions and building response estimations [
35], it is concluded that the structures were overloaded far beyond their normal design levels during the early February 2023 earthquakes. This fact along with considerable vertical seismic components was a significant factor affecting the seismic performance of the buildings and resulting in heavy and very heavy structural damage including partial or total collapse, respectively, in the earthquake-affected area of East Anatolia [
35].
Nevertheless, it must be emphasized that well-designed, constructed and maintained structures sustained, with no or minor and/or secondary damage, the strong ground motions caused by the earthquakes.
5. Results—Geological Factors Affecting the Distribution and Type of Building Damage
5.1. Impact of the Coseismic Surface Ruptures on Buildings
A characteristic feature of the coseismic surface ruptures in almost all studied sites was the left-lateral offset and the ground deformation associated with strike-slip faulting such as local-scale uplift and subsidence corresponding to pop-up ridges and pull-apart basins, respectively. In addition, it was found that either in close proximity to or along the ruptures several secondary EEEs were triggered. They mainly comprise liquefaction and lateral spreading phenomena; landslides including mainly rockfalls and slides; as well as hydrological anomalies such as increased water turbidity, water table changes and inundation of extensive areas with groundwater.
In many cases, surface ruptures intersected with residential areas, resulting in major impact on the performance of buildings and infrastructure during the earthquake. In order to understand the impact of surface ruptures on the built environment, we will report separately on different areas in more detail regarding the characteristics of surface ruptures and their impact on the built environment. Examples from the main strand of the EAFZ will be mentioned first, followed by examples from its northern strand (
Figure 2).
5.1.1. Balkar Area along the Pazarcik Segment
The Balkar area is the northernmost location at which we have observed coseismic surface ruptures along the main strand of the EAFZ. The NE-SW striking Pazarcik segment has been formed in this area along with a pull-apart basin, on the eastern margin of which Balkar town was founded. Within this basin, Lake Azapli is located north of Balkar. From our field survey, we detected NE-SW striking coseismic surface ruptures with a total length of 2 km. The maximum left-lateral offset observed in the area was of the order of 6 m, an offset equal to the one measured by Karabacak et al. [
49]. The post-seismic surface ruptures deformed fields north of the city, causing offset of rural roads, perimeter fences, rows of olive trees and other crops (
Figure 8a–d). However, their most destructive effect was observed on the main road network and the building stock of the city. The section of the Malatya–Kahramanmaraş road located north of the town was ruptured and displaced (
Figure 8e), causing traffic difficulties until repair. Regarding the building stock, there was heavy structural damage to many buildings in the western part of Balkar (
Figure 8f) due to the offset along the surface rupture. Almost all the buildings in the western part of the city that suffered severe structural damage, including partial collapse, were reinforced concrete buildings with infill walls.
5.1.2. Beyoğlu, Şekeroba and Yeşilyurt Areas along the Amanos Segment
In this area, we identified the southward continuation of the previous system of coseismic surface ruptures. We detected ruptures with a total length of about 10 km and NE-SW strike, similar to the left-lateral Amanos segment occurring in the area [
14]. This system was initially perceived in the agricultural land east of the residential area of Beyoğlu. In the first 5 km of its occurrence, they ruptured fields, displaced irrigation canals, caused cracks in rural roads and destroyed agricultural facilities and buildings. After the first 5 km, the rupture intersected with the state road D.825 passing east of Beyoğlu residential area. Its offset caused a collapse of a road bridge over a stream flowing through the Şekeroba area, resulting in difficulties in traffic and transportation. A detour was created to ensure traffic continuation.
The coseismic ruptures crossed the residential area of Şekeroba town in a NE-SW direction (
Figure 9a) and caused the total or partial collapse of buildings founded along or close to them (
Figure 9b). Pop-up ridges were also identified along the coseismic ruptures such as the one formed at the intersection of Akcakoyunlu and Beiediye roads (
Figure 9c), resulting in the destruction of the roadway (
Figure 9d) and collapses of buildings constructed near this structure or along the rupture. This rupture was detected again southwest of Şekeroba towards the Yeşilyurt settlement.
In the Yeşilyurt area, an elongated valley has been formed in a NE-SW direction within which a system of two surface ruptures was observed in parallel arrangement (
Figure 9a). The westernmost was observed towards the middle of the valley while the easternmost was detected towards its eastern margin, both with an average NE-SW strike (
Figure 10a). These ruptures intersect southwest of Yeşilyurt Köyü road, causing the total destruction of two RC houses that happened to be founded at the intersection point (
Figure 10b,c), as well as the collapse of warehouse houses and other farm structures along or close to the ruptures.
This section of the parallel surface ruptures is approximately 2.5 km long. They have caused left-lateral offset of all surface morphological features of the area such as stream beds and other human-made features such as fences, rows of olive trees and vineyards, rural roads, etc. (
Figure 10d–f). The left-lateral offset was 2.80 m based on field measurements. Along these ruptures, secondary EEEs were triggered and comprised liquefaction including ejection of liquefied material from the generated ruptures and covering of adjacent fields, as well as landslides along steep slopes that could be characterized with high susceptibility even before the occurrence of the early February 2023 earthquakes.
South of the aforementioned intersection, the surface expression of the seismic fault continues for about 1.6 km to the Bademli settlement where the trace gradually disappears. The impact of the surface ruptures on the fields is similar to the previous occurrences in Beyoğlu, Şekeroba and Yeşilyurt areas. This last section from southeast of Yeşilyurt to northeast of Bademli is characterized with an absence of impact on buildings and major infrastructure.
5.1.3. Nurdağı Area along the Amanos Segment
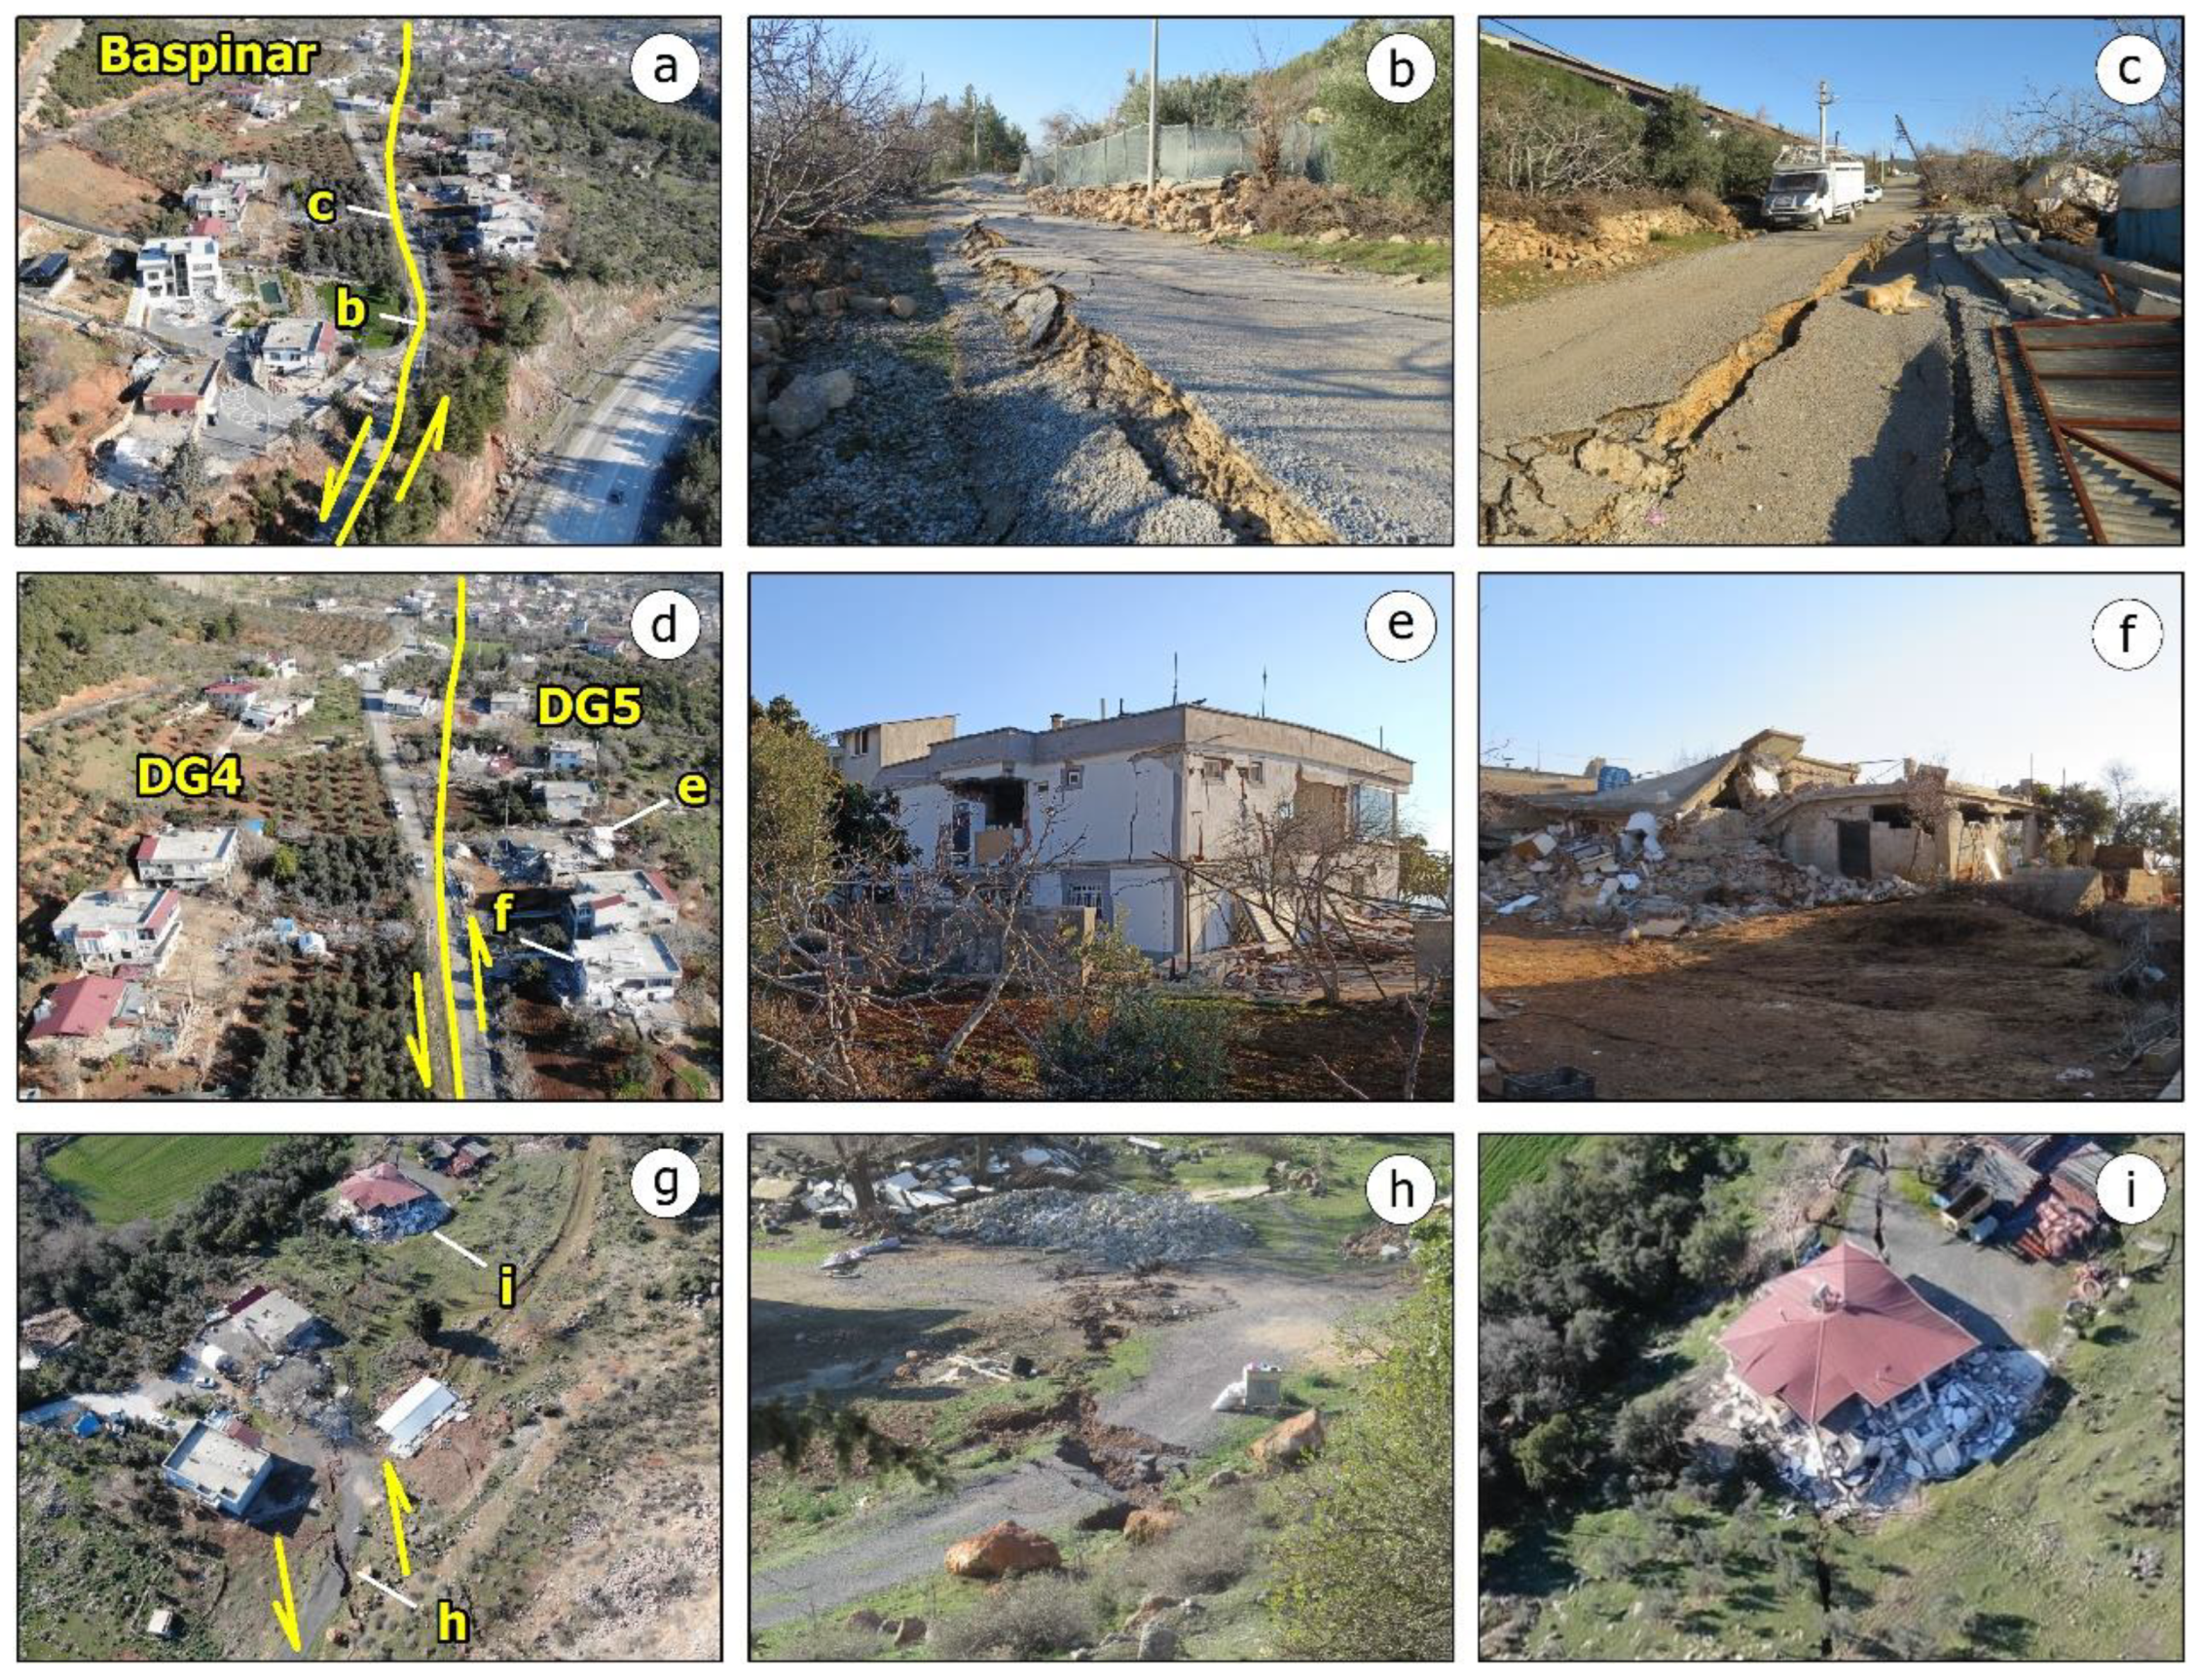
The southward continuation of the previous system of coseismic surface ruptures was identified in the western suburbs of Nurdağı city. This occurrence extends from Başpınar to Gökçedere settlements, located approximately 1 km from the northern and the southwestern edge of Nurdağı, respectively.
In the Başpınar area (
Figure 11), ground deformation and offset ranging from 2.0 to 3.2 m along the observed coseismic surface ruptures (
Figure 11a–c) resulted in heavy and very heavy structural damage to buildings (
Figure 11d–f). Those houses that were founded either a few or tens of meters from the rupture suffered structural damage that was milder than the previous ones and did not collapse (
Figure 11g–i). The observed left-lateral offset resulted also in cracking and destruction of road sections, displacement of perimeter walls of houses and field fences as well as deformation of fields. At other sites located along or close to the coseismic ruptures, rockfalls and slides occurred along slopes, which were either already highly susceptible to a landslide triggering even before the generated earthquakes or were mobilized due to the deformation observed along the rupture.
In Gökçedere settlement, the NE-SW striking coseismic surface ruptures caused ground deformation and offset affecting all elements of the natural and built environment comprising fields, streams, buildings and roads (
Figure 12a). Several buildings suffered damage of grade 4 and 5 in terms of the EMS-98 scale corresponding to heavy and very heavy structural damage, respectively (
Figure 12b). Urban streets and dirt roads were displaced (
Figure 12b). At various sites along the fault lines, structures typical for strike–slip faults were identified. Such a structure was revealed with a bulge on the road immediately south of a road construction site located north of the settlement of Gökçedere (
Figure 12c). This bulge corresponds to a pop-up ridge that deformed the road leading to the slopes of a construction site (
Figure 12d), resulting in traffic interruption until damage restoration. No collapse was recorded at the construction site as the ruptures were observed under container-type warehouses with road construction material and equipment (
Figure 12e). The only issue created was disturbed stacks of construction material. No failures were reported in the adjacent tunnels [
50]. Secondary EEEs were observed at the same site, such as liquefaction along the stream banks arranged parallel to the construction site and subsequent inundation of an adjacent field (
Figure 12f).
5.1.4. İslahiye Area along the Amanos Segment
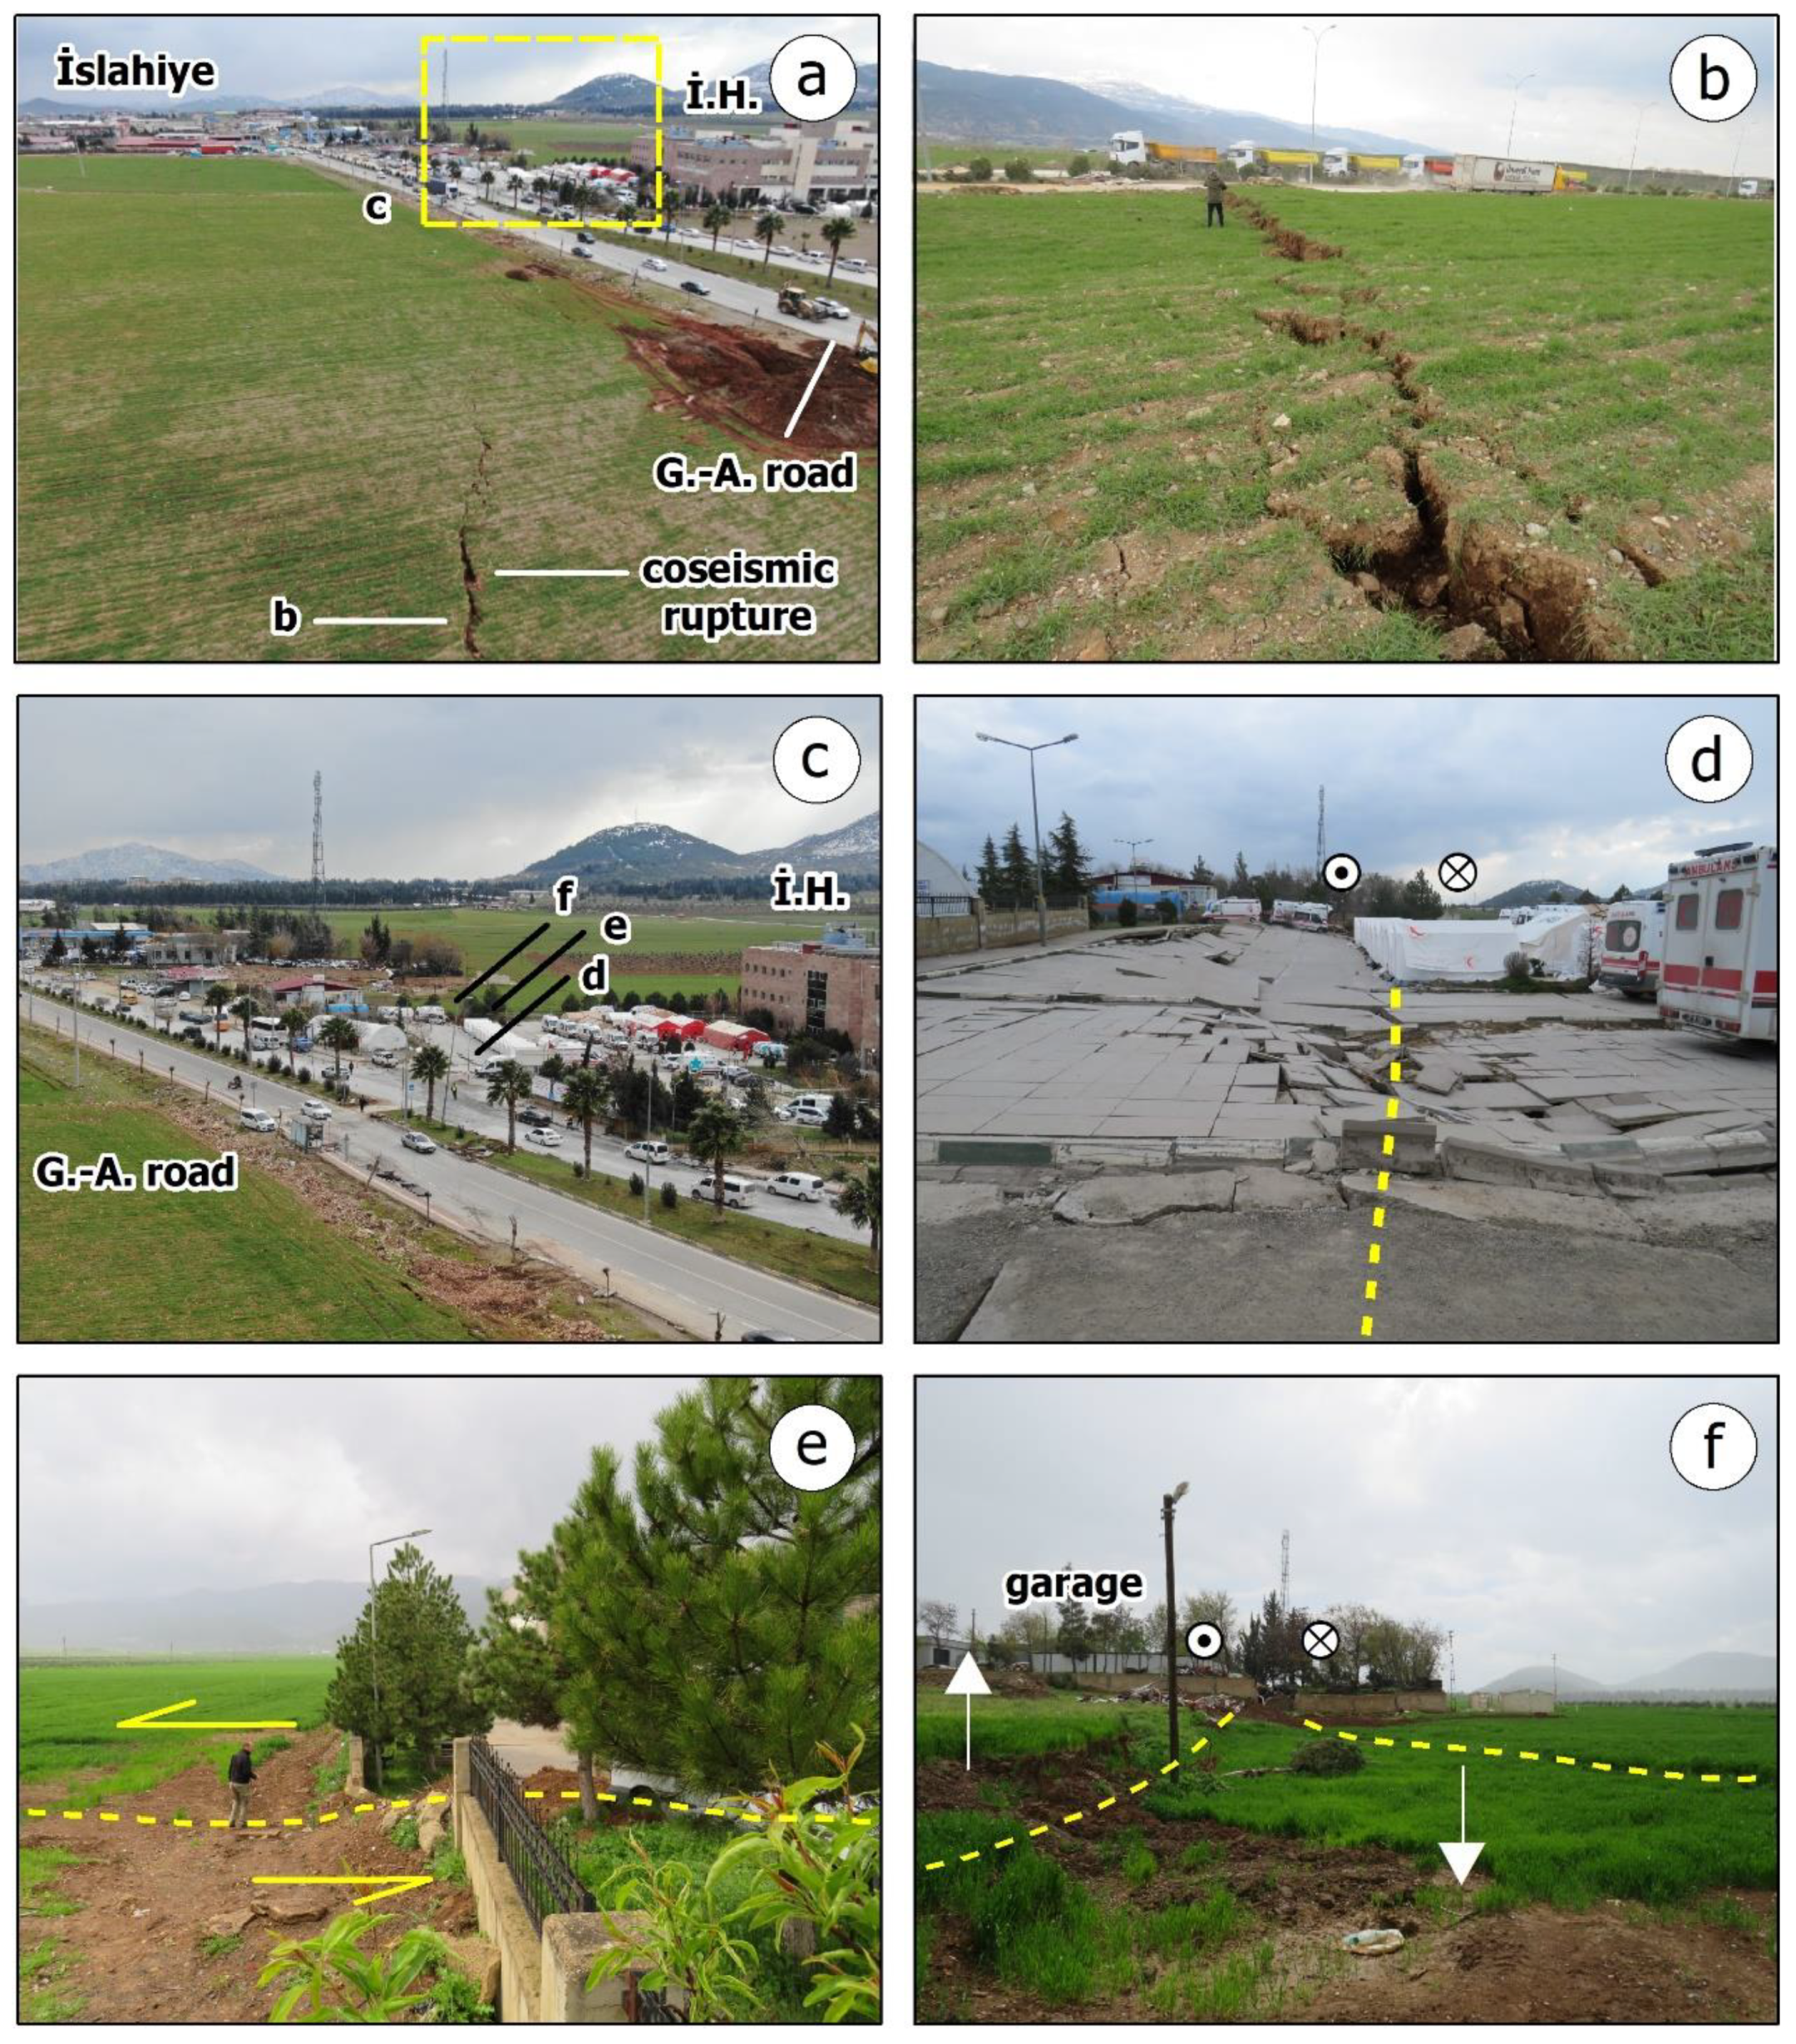
In the İslahiye area, we identified the southward continuation of the coseismic surface ruptures that occurred in Nurdağı area. This NNE-SNW striking occurrence is 6 km long. Its northern N-S striking part develops within agricultural land. It extends from the area east of Türkbahçe, at a distance of 1 km east of the settlement, to the İslahiye hospital area in the south (
Figure 13a–c). The primary effect in this section has deformed fields, ruptured parts of the road network north and east of the hospital, destroyed the hospital’s ambulance parking yard (
Figure 13d) and displaced the hospital’s perimeter wall to the south of the health facilities (
Figure 13e), as well as the perimeter wall of a neighboring workshop. Based on the field observations, the left-lateral offset was 1.90 m.
A subsided part corresponding to a small-scale pull-apart basin within the main deformation zone has been formed between the perimeter wall of the hospital and the adjacent workshop to the south (
Figure 13f). Further south, this rupture has NNE-SW strike, and ruptures rural land without affecting structures passing west of İslahiye town and the Değirmencik settlement located south of the town. The only infrastructure that was found to be affected by the offset are parts of the road network in the area, and more specifically the Gaziantep–Antakya main road (G.-A. road in
Figure 13a), which was displaced and cracked, resulting in destruction of the road surface without traffic disruption.
The hospital located at a minimum distance of 30 m west of the surface rupture was not affected by the left-lateral offset and remained operational during the aftershock period suffering only slight non-structural damage [
51]. It is very important to mention here that the İslahiye hospital was constructed to the strictest seismic standards with the aim to remain unaffected and operational even in the aftermath of destructive events. Its performance contrasts with other RC buildings founded either along or close to ruptures observed in the previous examples and highlights the importance of the strict application of the seismic code to all structures.
5.1.5. Hassa Area along the Amanos Segment
Another typical case of impact from surface ruptures formed within a residential area is the damage observed within Hassa town located in the southern part of the earthquake-affected area. This rupture was detected in the western part of the city (
Figure 14a). It has a NNE-SSW strike and is about 850 m long. Houses founded on the rupture were completely destroyed with most of them suffering total collapse (
Figure 14b,c). Sections of the city’s road network with which the rupture intersected were cracked with traffic being temporarily disrupted. Perimeter walls of houses and fences were also destroyed by the offset. The rupture displaced a stream bed crossing Hassa town in an E-W direction (
Figure 14d). Based on field observations and UAS imagery, the left-lateral offset was of the order of 3 m.
5.1.6. Saylan Area along the Çardak Segment
As part of the post-event field survey in the northern strand of the EAFZ, where the epicenter of the second major earthquake was determined, we identified and mapped coseismic surface ruptures in the Çardak and Sügü segments. The surface ruptures that developed along the Çardak segment were initially detected in Saylan village (
Figure 15a,b) between Kaleköy village and Gücüksu town. This rupture had a NE-SW strike, a length of 12 km and presented a left-lateral offset of about 2 m. The deformation and the offset in this part of the Çardak segment caused severe structural damage at its intersection with buildings, which razed to the ground (
Figure 15c). The left-lateral offset in the built-up area of the village was accompanied with a vertical offset of about 1 m (
Figure 15d).
5.2. Impact of the Secondary EEEs on Damage Type, Grade and Distribution
5.2.1. Gölbaşı Area
A typical case of the impact of secondary EEEs on the building damage type, grade and distribution is the Gölbaşı city. It was founded just south of the eponymous lake, which is developed within a releasing stepover of the EAFZ, between the Erkenek segment in the northeast and the Pazarcik segment in the southwest. The Gölbaşı basin is a typical pull-apart basin, which has been formed within the recently active stepover area [
13].
The deposits that occur within the basin are highly susceptible to liquefaction considering the lithology of the deposits, the proximity to the lake, the peak ground acceleration expected within the basin and the ground motion that can be amplified within the basin. This susceptibility was confirmed during the 6 February 2023 earthquakes when the area experienced extensive liquefaction phenomena. These phenomena included lateral spreading along its eastern and southern shores (
Figure 16a). The triggered ground cracks resulted in deformation of fields and railways passing through the area (
Figure 16b), making it impossible to restore rail transport in the area even 2 months after the earthquakes occurred, as well as subsidence along the lake shore (
Figure 16c) with destructive impact on facilities such as roads and structures. Buildings constructed along the lakefront before the earthquakes were inundated after the earthquake-triggered liquefaction and the subsequent subsidence, while others were totally collapsed (
Figure 16d). Entertainment facilities such as a playground constructed near the lakefront were also destroyed by ground cracks attributed to lateral spreading.
The most significant impact identified and recorded during our field survey in the earthquake-affected area of Gölbaşı city comprises the damage caused to many of the buildings due to the soil–foundation interaction (
Figure 17). The liquefaction phenomena that extended south of the lake within the city resulted in typical damage observed also in areas affected by past earthquakes and subsequent liquefaction, for example, in Adaparazzi city after the 1999 Izmit (Turkey) earthquake [
52,
53] and in Christchurch city after the 2010–2011 New Zealand earthquakes [
54]. Overall, the following damage was observed to buildings in the city and attributed to liquefaction phenomena and loss of load-bearing capacity of the foundation (
Figure 17):
Uniform vertical displacement with many buildings suffering sinking without noticeable tilt of the structure and no damage to its upper part (
Figure 17a–d);
Non-uniform vertical displacement comprising tilting without suffering any other structural or non-structural damage to the upper part of the structure (
Figure 17e);
Tilting of buildings and damage attributed to pounding of adjacent structures (
Figure 17f);
Lateral displacement of buildings over liquefied soil directly beneath its foundation accompanied with the formation of a passive resistance wedge in the surrounding soil (
Figure 17g);
The aforementioned damage was detected during the post-event field survey with the synergy of field mapping and the use of UAS as a large part of the city was inaccessible due to roads being blocked either with collapsed debris or with ongoing SAR operations. This type of damage allows for the possibility of recovering some of the buildings’ equipment at a later stage when the aftershock activity has been lowered and when all evidence rules out further collapse.
5.2.2. İskenderun
Iskenderun is located at the eastern coastal part of the eponymous offshore basin and bay. It was founded on a Quaternary alluvial plain lying parallel to the Amanos Mountains located eastwards. The prevailing lithologies comprise mainly silt and sand layers, while the water level in the area is high [
55]. Existing studies on the liquefaction susceptibility and the settlement suitability had already pointed out that the soil in the coastal part of Iskenderun is characterized with significant potential for earthquake-triggered liquefaction and for this reason a large part of it has already been classified as unsuitable for settlement [
55]. Before 1940, the town had extensive and admirable beaches. In the following decades, there was a great demand for housing and as a result the coastline began to fill up with buildings and the beaches eventually disappeared.
During the 6 February 2023 earthquakes, the pre-earthquake information on the liquefaction susceptibility and the settlement suitability of Iskenderun was confirmed with its coastal part suffering the most from the synergy of the intense ground deformation and the induced EEEs. More specifically, liquefaction phenomena were triggered and comprised sand boils in several sites, ejection of liquefied material from ground cracks, lateral spreading and subsidence along the coast, as well as subsequent inundation of the coastal area. The inundation distance reached a maximum of about 200 m in several sites. The inundated part could not be drained for several days due to the destruction of the coastal drainage infrastructure. Ground cracks were also formed in several sites of the coastal part of the city, attributed to the liquefaction-related lateral spreading. As a result, the pier was collapsed, subsided and submerged at its largest extent. Many boulders, which had been placed to protect the pier from erosion, were found under the sea level. Many movable objects comprising vehicles, boats and container-type structures located along the affected coastal part were found either submerged or surrounded by the sea. Many tourist and sports facilities, monumental structures, green and recreational areas and port facilities were also found within the submerged and inundated zone. The coastal road also suffered subsidence and subsequent inundation. When the water receded from parts of the road, extensive liquefied material was deposited on the road and many vehicles were stuck. Liquefied material was also observed in several sites along the coastal area. This material comprises sand and silt as well as coarser elements, mainly gravel, probably from the road foundation. Details and related imagery are mainly provided by Aldemir et al. [
56] and Çetin et al. [
50] after field reconnaissance in the affected Iskenderun area. Furthermore, the coastal zone of the city was unstable after the occurrence of the earthquakes. Several times, even 2 months after the devastating earthquakes, the coastal roads were flooded with seawater, which created additional problems for vehicles and residents.
The structures founded in the coastal zone proved to be particularly vulnerable to strong ground motion and the surface deformation related to liquefaction phenomena. In particular, they were affected by liquefaction-related settlement due to loss of the foundation bearing capacity without suffering other structural damage. As for the buildings most affected by the earthquake and that sustained very heavy structural damage including collapse, the majority is located in the Çay district, in particular, in the first row of buildings south of Ataturk Avenue and in the rows of buildings immediately north of state road D817 and the city railway line (
Figure 18a). This zone comprises the old city beach and many areas of artificial deposits created for the purpose of constructing new buildings on the new created land. It is significant to note that the area is referred to by many locals as a swamp. The type of collapses observed mostly in this zone are pancake-type and outspread multi-layer collapse (
Figure 18b–d), typical of liquefaction-induced building damage.
5.2.3. Antakya
Another typical case in which secondary EEEs determined the nature and distribution of the building damage is the case of Antakya. This city is located at the southern end of the earthquake-affected area, within the NE-SW trending Antakya-Samandag corridor. The main geomorphological feature in the area is the Orontes River, which flows in a similar direction up to its estuary in southern Samandağ. In regards to the prevailing lithologies in Antakya city, the most recent part of the sedimentary fill includes Holocene alluvial deposits on either side of the Orontes River, comprising pebbles, sands and clays [
57]. Furthermore, Pleistocene-age river terraces are also developed, which are composed of alternations of pebbles and coarse sands [
57].
Taking into account the age and the lithology of the Holocene deposits observed on both sides of the Orontes River [
55], the high water saturation of deposits due to the proximity to the river and the high values of peak ground acceleration in the area [
35,
58], it is concluded that the Holocene alluvial deposits, on which a large part of the new city of Antakya has been constructed, are highly susceptible to earthquake-triggered liquefaction. This was amply demonstrated in the southern part of the Amik Basin, where extensive liquefaction was manifested as ground cracks and ejection of liquefied material, sand boils and lateral spreading along or close to the Orontes River bed [
32].
Based on field observations in Antakya city, we detected that massive building collapses were generated in a zone of the new city west of the Orontes River with a maximum width of about 2 km from the Orontes River bed and a part of the old city east of the river with a maximum width of about 1.5 km from the riverbed (
Figure 19).
As mentioned above, this area heavily affected by the early February 2023 earthquakes is built up by Holocene alluvial deposits [
56]. Based on previous research and reports dealing with the seismic hazard and site effect in Antakya city, it is concluded that the Quaternary units in Antakya can cause variation at the ground motion amplification [
59]. Despite the fact that liquefaction in this area has not been presented in the research of Taftsoglou et al. [
32], the arrangement of collapses along the western bank of the Orontes River and the distribution of liquefaction phenomena in an area close to the city with similar geological and geomorphological conditions (near the meanders of the Orontes River at the southern boundary of the old Amik Lake) makes the occurrence of liquefaction phenomena under the most affected part of Antakya city a certainty.
These suggestions are further supported with the fact that the part of the city immediately west of the Orontes River, where the extensive collapses were observed, was founded on old fluvial features. These features include ancient channels and meanders, as has been deduced from studies on the foundation, the growth and the extent of the ancient Antioch [
60], which revealed various changes of both the river course and its flood plain, among others. These features are now covered by the expanded modern city devastated by the 2023 seismic events. A typical example of such old fluvial features is the ancient course of the Orontes River that separates the old city of Antioch from the island of Orontes [
61].
Such areas are particularly vulnerable to the triggering of liquefaction phenomena, as has been demonstrated and highlighted in cases of other recent earthquakes in the Balkan Peninsula, where lateral spreading and sand boils have occurred in abandoned meanders and old riverbeds. Similar examples of liquefaction manifestations have been recently presented by Mavroulis et al. [
62] in the earthquake-affected area of Durrës (Albania) due to the 26 November 2019 Mw = 6.4 earthquake and by Papathanassiou et al. [
63] in the Pineios and Titarissios River beds due to the 2021 Thessaly (central Greece) Mw = 6.3 earthquake. In both cases, based mainly on field observations and mapping of the earthquake-triggered liquefaction phenomena, it is concluded that most of them were generated where river channels had been reclaimed or in abandoned and filled channels.
Regarding collapses found east of the Orontes River, they are attributed to the age and construction properties of structures, since the old Antakya city has been constructed on Pleistocene terraces, which are characterized with low liquefaction susceptibility.
5.2.4. Kahramanmaras
Kahramanmaras city is located in the transition zone from the Ahir Mt located northwards to the Maras plain located southwards (
Figure 20). The northern part of the city is founded on limestone of the Ahir Mt, the middle part on Lower Miocene formations and the southern part on Quaternary-aged alluvium comprising mainly silt, clay, gravel and sand lain uncomformably over the aforementioned formations [
64,
65,
66] (
Figure 20). The thickness of the alluvium increases from N to S and from E to W according to AFAD [
64]. Furthermore, the streams flowing from the Ahir Mt towards the Maraş Plain have formed small alluvial fans with a slope greater than 5° [
64]. Additionally, scree is also presented in areas with a large slope along the mountain front [
64]. Regarding hydrogeology, the area is characterized with a high groundwater level ranging from 0–6 m to 15 m or more [
62]. From the active tectonics viewpoint, the residential area of the Ahir Mt front is disrupted by E-W striking faults that have produced surface ruptures during the last 11,000 years, while the northern boundary of the city has also been disrupted by faults that are suspicious for Holocene activity [
14] (
Figure 20).
The synergy of the aforementioned geological, geomorphological, hydrogeological and geotechnical characteristics of disrupted, soft and loose soils along a mountain front affected by active faults contributes to the increase in seismic intensity by two or three degrees in the Kahramanmaras built-up area [
66]. This is further evidenced with related soil studies revealing a high potential for earthquake-triggered liquefaction in the southern part of the city [
64] as well as with the spatial distribution of related landslide susceptibility and landslide hazard indices in the southern part of the Kahramanmaras province [
65], including the city. More specifically, taking into account the spatial distribution of the landslide susceptibility and hazard indices, as presented in related maps compiled with AFAD [
66] and by Biçer and Ercanoglu [
65], it is revealed that the landslide susceptibility and hazard indices within Kahramanmaras city increase from E to W. In particular, its western half is characterized with high to very high values of both indices, while the eastern half with very low to medium ones. By comparing the spatial distribution of the landslide susceptibility and hazard indices and the distribution of damaged buildings in Kahramanmaras city, it is revealed that the majority of damage is concentrated in an area of high values of landslide susceptibility and hazard (
Figure 21a). Taking into account the liquefaction potential maps of Cabalar et al. [
64], it is revealed that the areas that suffered the most with the February 2023 earthquakes coincide with areas characterized with high potential for liquefaction of formations at various depths (
Figure 21b). Based on the aforementioned, it can be said that the synergy of the aforementioned properties of the formations in the Kahramanmaras area contributed to the destruction.
5.3. Impact of Landslides on the Built Environment
Regarding landslides triggered by the earthquakes in early February 2023, they were mainly classified as rockfalls and secondarily as slides. They were distributed along steep slopes formed in the marginal areas of and within macrostructures of the affected area. The landslides did not have extensive impact on the buildings of the large residential complexes of cities and towns of the earthquake-affected area. They only affected buildings and infrastructures in semi-mountainous and mountainous settlements, resulting in heavy structural building damage and induced fatalities due to the impact with the mobilized material. The detected landslide building damage includes distortion and differential settlement of the structures, comprising cracking of non-structural elements of the structures as well as partial or total collapse of the impacted structures.
Cases of settlements that suffered landslide impact on their built environment and residents were recorded in the majority of the 11 provinces of southeastern Turkey. Typical examples were detected in provinces presented in
Figure 22.
More specifically, they are the following settlements:
Buyuknacar (Pazarcik district), Avcılar, Şahinkayası and Çevrepınar (Onikisubat district) areas of Kahramanmaraş province;
Alidam (Kâhta district), Kemerkaya (Adıyaman district) and İncirli (Çelikhan district) areas of Adıyaman province;
Bektasli area in Kirikhan district of Hatay province;
Ceritler area in Aladağ district of Adana province;
Fevzipaşa area in İslahiye district of Gaziantep province;
Karayiğit area in Hasanbeyli district of Osmaniye province.
However, the majority of the landslide impact on the built environment in the earthquake-affected area comprises damage to infrastructure and mainly to segments of the road network. They affected roads in two ways. The first one, which was common in the affected area, comprises the accumulation of the mobilized material on the road surface, resulting in temporary traffic disruption until debris removal, backfilling and concreting where necessary (
Figure 22). The second one includes total road destruction due to its location within the activated landslide zone (
Figure 22).
6. Discussion
This study is crucial for several reasons, all aiming at hazard mitigation and disaster risk reduction. The information provided through the aforementioned examples of residential areas in southeastern Turkey should be taken into account for the development of building codes, construction practices and urban planning regulations. Building codes can be updated to ensure that structures are better equipped to withstand seismic forces. Urban planning decisions can be guided with knowledge of areas prone to the generation of EEEs, leading to more resilient and safer urban environments. Factors that control earthquake damage influence the design of infrastructure. Incorporating earthquake-resistant features ensures that these structures remain functional even after a seismic event, reducing disruption to essential services and the economy.
The provided information could contribute to the effective resource allocation and emergency preparedness comprising emergency response, search and rescue operations, medical assistance and aid distribution, as well as to increasing public awareness. Knowledge about the factors that control earthquake damage can be disseminated to the general public through educational activities. This empowers individuals to take prevention measures for their families and properties.
Summarizing, understanding the factors controlling earthquake damage is essential for minimizing loss of life, protecting infrastructure and building resilient communities. The knowledge gained from such studies informs policy making, urban planning, construction practices and emergency response strategies, ultimately contributing to a safer and more prepared society in earthquake-prone regions.
A suggestion for future research is the application of methods to assess in high resolution and detail the liquefaction and landslide susceptibility, hazard and risk of the residential areas in earthquake-affected Eastern Anatolia in order to highlight the vulnerable areas and to adopt measures and approaches for disaster risk reduction.
7. Conclusions
On 6 February 2023, two major earthquakes struck Eastern Anatolia, resulting in extensive heavy structural damage to buildings in many large residential areas including cities and towns of 11 provinces of southeastern Turkey. Based on field observations, it is concluded that the dominant building type of the affected cities and towns comprise RC buildings with infill walls. Despite their recent construction, this building type suffered the most with the earthquakes and their primary and secondary environmental effects, resulting in destruction. The loose enforcement of the building code, the random urban planning solutions and the poor construction standards are the main construction deficiencies that led along with other geological factors to one of the largest disasters in terms of human casualties and economic losses in Turkey’s recent history.
The geological factors that have affected the type and distribution of building damage have to do with the EEEs, in particular, the primary ones, which include coseismic surface ruptures, and the secondary ones, which include mainly liquefaction and secondarily landslides.
Where coseismic surface ruptures crossed the built fabric of cities, towns and settlements, they caused heavy to very heavy structural damage to buildings corresponding to damage grades 4 and 5 of the EMS-98, including partial or total collapse.
The contribution of secondary EEEs was also important in shaping the disaster field. In areas already characterized with a high susceptibility to liquefaction before the earthquake, extensive damage to buildings occurred due to the synergy of several triggering factors, such as the recent age of the formations, their lithology, the high water table and the water saturation of recent deposits. The observed structural damages are typical examples attributed to liquefaction phenomena and they have also been recorded and reported after past destructive seismic events.
The areas characterized with both high susceptibility to landslides and high potential for liquefaction also suffered extensive severe structural damage to buildings.
Cases of damage to buildings solely from landslides were recorded in several semi-mountainous and mountainous settlements, resulting in not only injuries but also human losses. The impact of landslides on infrastructure and especially on the road network was widespread, resulting in disruption affecting the evolution and outcome of critical actions during emergency response, such as the implementation of search and rescue actions and aid distribution to the affected people.
Regarding the applied methodology, it highlights the importance of field reconnaissance surveys including mapping of the destructive primary and secondary earthquake environmental effects on the built environment. Through such approaches, it is possible to identify the factors that either contribute significantly or prevail in shaping the type, the intensity and the distribution of damage in densely built-up and populated areas. Furthermore, these studies reveal and highlight urban and rural areas characterized with a high susceptibility to the occurrence of earthquake-accompanying phenomena, which have a high potential to severely affect elements of the built environment including buildings and infrastructure. In regards to the applicability of the followed approach, it can be applied to all areas affected not only by geological hazards but also by different types of hazards, such as hydrometeorological (floods, fires, etc.), with considerable impact on the built environment.
Author Contributions
Conceptualization, S.M.; methodology, S.M., I.A. and E.V.; validation, S.M., I.A. and E.V.; formal analysis, S.M. and I.A.; investigation, S.M., I.A., E.V., P.C. and E.L.; resources, E.L.; data curation, S.M.; writing—original draft preparation, S.M., I.A. and P.C.; writing—review and editing, S.M., I.A., P.C. and E.V.; visualization, S.M.; supervision, S.M.; project administration, E.L.; funding acquisition, E.L. All authors have read and agreed to the published version of the manuscript.
Funding
This research received no external funding.
Data Availability Statement
Data are contained within the article.
Conflicts of Interest
The authors declare no conflict of interest.
Correction Statement
This article has been republished with a minor correction to the reference 48. This change does not affect the scientific content of the article.
References
- United States Geological Survey (USGS). M 7.8—Pazarcik Earthquake, Kahramanmaras Earthquake Sequence. Available online: https://earthquake.usgs.gov/earthquakes/eventpage/us6000jllz/executive (accessed on 15 April 2023).
- United States Geological Survey (USGS). M 7.5—Elbistan Earthquake, Kahramanmaras Earthquake Sequence. Available online: https://earthquake.usgs.gov/earthquakes/eventpage/us6000jlqa/executive (accessed on 15 April 2023).
- Türkiye Recovery and Reconstruction Assessment (TERRA). Türkiye Earthquakes Recovery and Reconstruction Assessment. Report with the Support of the United Nations and the European Union, with Select Inputs from World Bank Staff. Available online: https://www.sbb.gov.tr/wp-content/uploads/2023/03/Turkiye-Recovery-and-Reconstruction-Assessment.pdf (accessed on 20 April 2023).
- Emre, Ö.; Kondo, H.; Özalp, S.; Elmacı, H. Fault geometry, segmentation and slip distribution associated with the 1939 Erzincan earthquake rupture along the North Anatolian Fault Zone. In Characterization of Modern and Historical Seismic–Tsunamic Events, and Their Global–Societal Impacts; Dilek, Y., Ogawa, Y., Okubo, Y., Eds.; Geological Society, Special Publications: London, UK, 2020; p. 501. [Google Scholar] [CrossRef]
- Pamir, H.N.; Ketin, İ. Das Anatolische Erdbeden Ende 1939. Geol. Rundsch. 1941, 32, 278–287. [Google Scholar] [CrossRef]
- Parejas, E.; Akyol, İ.H.; Altınlı, E. Le tremblement de terre d’Erzincan du 17 Decembre 1939. Rev. Fac. Sci. Univ. Istanb. 1942, NVI, 77–222. [Google Scholar]
- Grünthal, G. (Ed.) European Macroseismic Scale 1998 EMS-98; Conseil de l’Europe, Cahiers du Centre Européen de Géodynamique et de Séismologie: Luxembourg, 1998; Volume 15. [Google Scholar]
- Mavroulis, S.; Mavrouli, M.; Vassilakis, E.; Argyropoulos, I.; Carydis, P.; Lekkas, E. Debris Management in Turkey Provinces Affected by the 6 February 2023 Earthquakes: Challenges during Recovery and Potential Health and Environmental Risks. Appl. Sci. 2023, 13, 8823. [Google Scholar] [CrossRef]
- Mavrouli, M.; Mavroulis, S.; Lekkas, E.; Tsakris, A. An Emerging Health Crisis in Turkey and Syria after the Earthquake Disaster on 6 February 2023: Risk Factors, Prevention and Management of Infectious Diseases. Healthcare 2023, 11, 1022. [Google Scholar] [CrossRef]
- Barka, A.A.; Kadinsky-Cade, K. Strike-slip fault geometry in Turkey and its influence on earthquake activity. Tectonics 1988, 7, 663–684. [Google Scholar] [CrossRef]
- Taymaz, T.; Eyidoğan, H.; Jackson, J. Source parameters of large earthquakes in the East Anatolian Fault Zone (Turkey). Geophys. J. Int. 1991, 106, 537–550. [Google Scholar] [CrossRef]
- Saroğlu, F.; Emre, Ö.; Kuşçu, İ. The East Anatolian Fault Zone of Turkey. Ann. Tecton. 1992, 6, 99–125. [Google Scholar]
- Duman, T.Y.; Emre, Ö. The East Anatolian Fault: Geometry, segmentation and jog characteristics. Geol. Soc. Lond. Spec. Publ. 2013, 372, 495–529. [Google Scholar] [CrossRef]
- Emre, Ö.; Duman, T.Y.; Özalp, S.; Elmacı, H.; Olgun, Ş.; Saroğlu, F. Active Fault Map of Turkey with an Explanatory Text 1:1,250,000 Scale; General Directorate of Mineral Research and Exploration (Maden Tetkik ve Arama Genel Müdürlüğü–MTA) Special Publication Series 30; MTA: Ankara, Türkiye, 2012. [Google Scholar]
- Emre, Ö.; Duman, T.Y.; Özalp, S.; Saroğlu, F.; Olgun, Ş.; Elmacı, H.; Can, T. Active fault database of Turkey. Bull. Earthq. Eng. 2018, 16, 3229–3275. [Google Scholar] [CrossRef]
- Çetin, H.; Güneyli, H.; Mayer, L. Paleoseismology of the Palu-Lake Hazar segment of the East Anatolian Fault Zone, Turkey. Tectonophysics 2003, 374, 163–197. [Google Scholar] [CrossRef]
- Karabacak, V.; Onder, Y.; Altunel, E.; Yalçıner, C.C.; Akyuz, H.S.; Kıyak, N.G. Dogu Anadolu Fay Zonunun guney batı uzanımının paleosismolojisi ve ilk kayma hızı (Palaeoseismology and initial slip rate of the south-west extension of the Eastern Anatolian Fault Zone). In Proceedings of the Aktif Tektonik Araştırma Grubu Onbeşinci Çalıştayı (Fifteenth Workshop of the Active Tectonic Research Group) (ATAG-15), Çukurova Üniversitesi, Karatş-Adana, Turkey, 19–22 October 2011. [Google Scholar]
- Ambraseys, N.N. Engineering seismology. J. Earthq. Eng. Struct. Dyn. 1988, 17, 51–105. [Google Scholar] [CrossRef]
- Ambraseys, N. Earthquakes in the Mediterranean and Middle East, a Multidisciplinary Study of Seismicity up to 1900; Cambridge University Press: Cambridge, UK, 2009; p. 970. [Google Scholar] [CrossRef]
- Tan, O.; Tapirdamaz, M.C.; Yörük, A. The earthquake catalogues for Turkey. Turk. J. Earth Sci. 2008, 17, 405–418. [Google Scholar]
- Kalafat, D.; Güneş, Y.; Kekovali, K.; Kara, M.; Deniz, P.; Yilmazer, M. A Revised and Extended Earthquake Catalogue for Turkey since 1900 (M ≥ 4.0); Boğaziçi University, Kandilli Observatory and Earthquake Research Institute: Istanbul, Türkiye, 2011; p. 640. (In Turkish) [Google Scholar]
- Taymaz, T.; Ganas, A.; Yolsal-Çevikbilen, S.; Vera, F.; Eken, T.; Erman, C.; Keleş, D.; Kapetanidis, V.; Valkaniotis, S.; Karasante, I.; et al. Source mechanism and rupture process of the 24 January 2020 Mw 6.7 Doğanyol-Sivrice earthquake obtained from seismological waveform analysis and space geodetic observations on the East Anatolian Fault Zone (Turkey). Tectonophysics 2021, 804, 228745. [Google Scholar] [CrossRef]
- Lekkas, E.; Vassilakis, E. The Adana Earthquake (Turkey)—Seismotectonic Framework, Geodynamic Phenomena, Impact on the Structured Environment. In Proceedings of the 12th World Congress of Earthquake Engineering, Auckland, New Zealand, 30 January–4 February 2000; p. 0480. [Google Scholar]
- Lozios, S.; Lekkas, E.; Danamos, G. The Bingöl, Eastern Turkey, Earthquake. Co-seismic Phenomena and Damage Distribution. In Proceedings of the 13th World Conference on Earthquake Engineering, Vancouver, BC, Canada, 1–6 August 2004; p. 3010. [Google Scholar]
- Tan, O.; Pabuçcu, Z.; Tapırdamaz, M.C.; Inan, S.; Ergintav, S.; Eyidoğan, H.; Aksoy, E.; Kuluöztürk, F. Aftershock study and seismotectonic implications of the 8 March 2010 Kovancılar (Elazığ, Turkey) earthquake (MW = 6.1). Geophys. Res. Lett. 2011, 38, L11304. [Google Scholar] [CrossRef]
- Carydis, P.; Lekkas, E.; Papaioannou, C.; Tsokos, A.; Delakouridis, J. The October 23 (Mw = 7.2) and November 9 (Mw = 5.7), 2011 Van, Turkey earthquakes. A geoscientific and engineering report. Ing. Sismica 2012, 29, 13–36. [Google Scholar]
- Lekkas, E.; Carydis, P.; Mavroulis, S. The January 24, 2020 Mw 6.8 Elazig (Turkey) Earthquake. Newsl. Environ. Disaster Cris. Manag. Strateg. 2020, 16, 1–84. [Google Scholar] [CrossRef]
- Darawcheh, R.; Abdulwahed, M.K.; Hasan, A. The 13th-August-1822 Aleppo Earthquake: Implications for the Seismic Hazard Assessment at the Antakia Triple Junction. In On Significant Applications of Geophysical Methods. CAJG 2018. Advances in Science, Technology & Innovation; Sundararajan, N., Eshagh, M., Saibi, H., Meghraoui, M., Al-Garni, M., Giroux, B., Eds.; Springer: Cham, Switzerland, 2018; pp. 179–181. [Google Scholar]
- Melgar, D.; Taymaz, T.; Ganas, A.; Crowell, B.; Öcalan, T.; Kahraman, M.; Tsironi, V.; Yolsal-Çevikbilen, S.; Valkaniotis, S.; Irmak, T.S.; et al. Sub- and super-shear ruptures during the 2023 Mw 7.8 and Mw 7.6 earthquake doublet in SE Türkiye. Seismica 2023, 2, 1–10. [Google Scholar] [CrossRef]
- European-Mediterranean Seismological Centre (EMSC). M 7.8—CENTRAL TURKEY—2023-02-06 01:17:36 UTC. Available online: https://www.emsc-csem.org/Earthquake/earthquake.php?id=1218444#summary (accessed on 3 April 2023).
- Lekkas, E.; Carydis, P.; Vassilakis, E.; Mavroulis, S.; Argyropoulos, I.; Sarantopoulou, A.; Mavrouli, M.; Konsolaki, A.; Gogou, M.; Katsetsiadou, K.-N.; et al. The 6 February 2023 Turkey-Syria Earthquakes. Newsl. Environ. Disaster Cris. Manag. Strateg. 2023, 29, 1–202. [Google Scholar] [CrossRef]
- Taftsoglou, M.; Valkaniotis, S.; Papathanassiou, G.; Karantanellis, E. Satellite Imagery for Rapid Detection of Liquefaction Surface Manifestations: The Case Study of Türkiye–Syria 2023 Earthquakes. Remote Sens. 2023, 15, 4190. [Google Scholar] [CrossRef]
- Görüm, T.; Tanyaş, H. Less than expected? Landslides triggered by the 2023 Mw 7.7 and 7.6 Kahramanmaras (Türkiye) earthquake sequence. In Proceedings of the EGU General Assembly 2023, EGU23-17606, Vienna, Austria, 24–28 April 2023. [Google Scholar] [CrossRef]
- Mai, P.M.; Aspiotis, T.; Aquib, T.A.; Cano, E.V.; Castro-Cruz, D.; Espindola-Carmona, A.; Li, B.; Li, X.; Liu, J.; Matrau, R.; et al. The Destructive Earthquake Doublet of 6 February 2023 in South-Central Türkiye and Northwestern Syria: Initial Observations and Analyses. Seism. Rec. 2023, 3, 105–115. [Google Scholar] [CrossRef]
- Papazafeiropoulos, G.; Plevris, V. Kahramanmaraş—Gaziantep, Türkiye Mw 7.8 Earthquake on 6 February 2023: Strong Ground Motion and Building Response Estimations. Buildings 2023, 13, 1194. [Google Scholar] [CrossRef]
- Cogurcu, M.T. Construction and design defects in the residential buildings and observed earthquake damage types in Turkey. Nat. Hazards Earth Syst. Sci. 2015, 15, 931–945. [Google Scholar] [CrossRef]
- Natural Disaster Insurance Institution DASK. Interactive Earthquake Map. Available online: https://dask.gov.tr/en/interactive-earthquake-map (accessed on 15 June 2023).
- Polat, Z.A. Analysis of the Regulation of “Zoning Reconciliation” in Local Governments. Planning 2019, 29, 202–209. [Google Scholar]
- Republic of Turkey Ministry of Environment, Urbanization and Climate Change. Available online: https://webdosya.csb.gov.tr/db/kastamonu/webmenu/webmenu14377.pdf (accessed on 11 June 2020).
- Gizzi, F.T.; Kam, J.; Porrini, D. Time windows of opportunities to fight earthquake under-insurance: Evidence from Google Trends. Humanit. Soc. Sci. Commun. 2020, 7, 61. [Google Scholar] [CrossRef]
- Palm, R.; Hodgson, M. Earthquake Insurance: Mandated Disclosure and Homeowner Response in California. Ann. Assoc. Am. Geogr. 1992, 82, 207–222. [Google Scholar] [CrossRef]
- Carydis, P.G.; Tilford, N.R.; Brandow, G.E.; Jirsa, J.O. The Central Greece Earthquakes of February–March 1981, a Reconnaissance and Engineering Report; National Academy Press: Washington, DC, USA, 1982; p. 162. [Google Scholar]
- Carydis, P.G.; Lekkas, E.; Ersoy, U.; Uzumeri, S.M.; Ozcebe, G.; Polat, U.; Tankut, T.; Erdik, M. The Dinar, Turkey, Earthquake of October 1, 1995; Earthquake Engineering Research Institute (EERI) special earthquake report; EERI: Oakland, CA, USA, 1995; p. 8. [Google Scholar]
- ASCE/SEI 7-05; Minimum Design Loads for Buildings and Other Structures. American Society of Civil Engineers/Structural Engineering Institute: Reston, VA, USA, 2005; pp. 1–388.
- Salem, S.H.; El-Fouly, A.K.; Tagel-Din, H.S. Toward an economic design of reinforced concrete structures against progressive collapse. Eng. Struct. 2011, 33, 3341–3350. [Google Scholar] [CrossRef]
- Starossek, U. Progressive Collapse of Structures: Nomenclature and Procedures. Struct. Eng. Int. 2006, 16, 113–117. [Google Scholar] [CrossRef]
- Di Marco, C.; Frappa, G.; Sabbà, M.F.; Campione, G.; Pauletta, M. Shear strength formula for interior beam-column joints with plain bars in existing buildings. Eng. Struct. 2023, 293, 116656. [Google Scholar] [CrossRef]
- Frappa, G.; Pauletta, M. Seismic retrofitting of a reinforced concrete building with strongly different stiffness in the main directions. In Proceedings of the 14th fib PhD Symposium in Civil Engineering, Rome, Italy, 5–7 September 2022; pp. 499–508. [Google Scholar]
- Karabacak, V.; Özkaymak, Ç.; Sözbilir, H.; Tatar, O.; Aktuğ, B.; Özdağ, Ö.C.; Çakir, R.; Aksoy, E.; Koçbulut, F.; Softa, M.; et al. The 2023 Pazarcık (Kahramanmaraş, Türkiye) earthquake (Mw 7.7): Implications for surface rupture dynamics along the East Anatolian Fault Zone. J. Geol. Soc. Lond. 2023, 180, jgs2023-020. [Google Scholar] [CrossRef]
- Çetin, K.Ö.; Ilgaç, M.; Can, G.; Çakır, E. Preliminary Reconnaissance Report on February 6, 2023, Pazarcık Mw = 7.7 and Elbistan Mw = 7.6, Kahramanmara¸s-Türkiye Earthquakes. Middle East Technical University, Earthquake Engineering Research Center, Report No: METU/EERC 2023-01, Ankara, Turkey. 2023. Available online: https://eerc.metu.edu.tr/en/system/files/documents/DMAM_Report_2023_Kahramanmaras-Pazarcik_and_Elbistan_Earthquakes_Report_final_ENG.pdf (accessed on 25 April 2023).
- Qu, Z.; Wang, F.; Chen, X.; Wang, X.; Zhou, Z. Rapid report of seismic damage to hospitals in the 2023 Turkey earthquake sequences. Earthq. Res. Adv. 2023, in press. [Google Scholar] [CrossRef]
- Mollamahmutoglu, M.; Kayabali, K.; Beyaz, T.; Kolay, E. Liquefaction-related building damage in Adapazari during the Turkey earthquake of August 17, 1999. Eng. Geol. 2003, 67, 297–307. [Google Scholar] [CrossRef]
- Sancio, R.B.; Bray, J.D.; Durgunoglu, T.; Onalp, A. Performance of Buildings over Liquefiable Ground in Adapazari, Turkey. In Proceedings of the 13th World Conference on Earthquake Engineering, Vancouver, BC, Canada, 1–6 August 2004; p. 935. [Google Scholar]
- van Ballegooy, S.; Malan, P.; Lacrosse, V.; Jacka, M.E.; Cubrinovski, M.; Bray, J.D.; O’Rourke, T.D.; Crawford, S.A.; Cowan, H. Assessment of Liquefaction-Induced Land Damage for Residential Christchurch. Earthq. Spectra 2014, 30, 31–55. [Google Scholar] [CrossRef]
- Toktaniş, A.; Över, V.S. Liquefaction Pilot Study in Konarlı Neighbourhood (Iskenderun). Geosound 2021, 54, 1–14. [Google Scholar]
- Aldemir, A.; Unutmaz, B.; Koçkar, M.K.; Erkal, B.G.; Şahin, U.; Sandıkkaya, M.A.; Şahmaran, M.; Öztürk, B.; Küçükali, S.; Çiçek, E.; et al. 06 ŞUBAT 2023–Kahramanmaraş Pazarcık (Mw = 7.7) ve Kahramanmaraş Elbistan (Mw = 7.6) Depremleri İnceleme Raporu; Hacettepe Üniversitesi, İnşaat Mühendisliği Bolumu: Ankara, Türkiye, 2023; pp. 1–170. [Google Scholar]
- Tarı, U.; Tüysüz, O.; Genç, Ş.C.; İmren, C.; Blackwell, B.A.B.; Lom, N.; Tekeşin, Ö.; Üsküplü, S.; Erel, L.; Altıok, S.; et al. The geology and morphology of the Antakya Graben between the Amik Triple Junction and the Cyprus Arc. Geodin. Acta 2013, 26, 27–55. [Google Scholar] [CrossRef]
- AFAD. Turkish Accelerometric Database and Analysis System. Available online: https://tadas.afad.gov.tr/login (accessed on 25 June 2023).
- Över, S.; Büyüksaraç, A.; Bekta, Ö.; Filazi, A. Assessment of potential seismic hazard and site effect in Antakya (Hatay Province), SE Turkey. Environ. Earth Sci. 2011, 62, 313–326. [Google Scholar] [CrossRef]
- De Giorgi, A. Ancient Antioch: From the Seleucid Era to the Islamic Conquest; Cambridge University Press: Cambridge, UK, 2016; pp. 1–226. [Google Scholar] [CrossRef]
- Kaplan, K. Real-Time Rendering Engines Help Visualize, Model, and Animate Ancient Cities: An Example in Antioch. Appl. Sci. 2022, 12, 12316. [Google Scholar] [CrossRef]
- Mavroulis, S.; Lekkas, E.; Carydis, P. Liquefaction Phenomena Induced by the 26 November 2019, Mw = 6.4 Durrës (Albania) Earthquake and Liquefaction Susceptibility Assessment in the Affected Area. Geosciences 2021, 11, 215. [Google Scholar] [CrossRef]
- Papathanassiou, G.; Valkaniotis, S.; Ganas, A.; Stampolidis, A.; Rapti, D.; Caputo, R. Floodplain evolution and its influence on liquefaction clustering: The case study of March 2021 Thessaly, Greece, seismic sequence. Eng. Geol. 2022, 298, 106542. [Google Scholar] [CrossRef]
- Cabalar, A.F.; Canbolat, A.; Akbulut, N.; Tercan, S.H.; Isika, H. Soil liquefaction potential in Kahramanmaras, Turkey. Geomat. Nat. Hazards Risk 2019, 10, 1822–1838. [Google Scholar] [CrossRef]
- Biçer, Ç.T.; Ercanoglu, M. A semi-quantitative landslide risk assessment of central Kahramanmaraş City in the Eastern Mediterranean region of Turkey. Arab. J. Geosci. 2020, 13, 732. [Google Scholar] [CrossRef]
- AFAD. Kahramanmaras Provincial Disaster Risk Reduction Plan. Available online: https://kahramanmaras.afad.gov.tr/kurumlar/kahramanmaras.afad/e-kutuphane/IL-PLANLARI/KAHRAMANMARAS%CC%A7-IL-AFET-RISK-AZALTMA-PLANI2022.pdf (accessed on 15 June 2023).
Figure 1.
The macroseismic intensity maps of East Anatolia for the Mw = 7.8 (
a) and the Mw = 7.5 (
b) earthquakes on 6 February 2023 based on data provided by the United States Geological Survey [
1,
2]. The main and the northern strands of the EAFZ with their segments and fault jogs as well as densely populated residential areas located along the EAFZ are also presented. KS: Karlıova segment; IS: Ilıca segment; GRSB: Gökçedere restraining bend; PALS: Palu segment; LHRB: Lake Hazar releasing bend; PS: Pütürge segment; YRDB: Yarpuzlu restraining double bend; ES: Erkenek segment; GRS: Gölbaşı releasing stepover; PAZS: Pazarcik segment; TRB: Türkoğlu releasing bend; AMS: Amanos segment; SFS: Sürgü fault system; CFS: Çardak fault system; GRB: Göksun releasing bend; SAFS: Savrun fault system. Faults from Duman and Emre [
13] and earthquake epicenters from USGS [
1,
2].
Figure 2.
The primary environmental effects of the early 6 February 2023 earthquakes include extensive coseismic surface ruptures (a,b) generated along the main and the northern strand of the EAFZ. The areas visited by the authors and mentioned in this study are also presented.
Figure 2.
The primary environmental effects of the early 6 February 2023 earthquakes include extensive coseismic surface ruptures (a,b) generated along the main and the northern strand of the EAFZ. The areas visited by the authors and mentioned in this study are also presented.
Figure 3.
Map showing the results of Jenks natural breaks classification of the insurance rate (%) of the provinces in southeastern Turkey affected by the 6 February 2023 earthquakes. The data are derived from the Natural Disaster Insurance Institution of Turkey [
37].
Figure 3.
Map showing the results of Jenks natural breaks classification of the insurance rate (%) of the provinces in southeastern Turkey affected by the 6 February 2023 earthquakes. The data are derived from the Natural Disaster Insurance Institution of Turkey [
37].
Figure 4.
Map showing the results of Jenks natural breaks classification of the numbers of the applications for construction registration certificates (CRCs) in the provinces of southeastern Turkey affected by the 6 February 2023 earthquakes. Data are derived from the Ministry of Environment, Urbanization and Climate Change of Turkey [
39].
Figure 5.
Map showing the results of Jenks natural breaks classification of the numbers of buildings heavily damaged, collapsed and to be demolished in the provinces of southeastern Turkey affected by the 6 February 2023 earthquakes. Τhe data are derived from the Ministry of Environment, Urbanization and Climate Change of Turkey [
3].
Figure 6.
(a) Sparse capillary cracks on the façade. (b) Large and penetrating cracks. (c) Collapse of secondary structural elements. (d) Partial yet irreversible collapse of a house.
Figure 6.
(a) Sparse capillary cracks on the façade. (b) Large and penetrating cracks. (c) Collapse of secondary structural elements. (d) Partial yet irreversible collapse of a house.
Figure 7.
(a) Domino-type progressive collapse of an RC building in Iskenderun city (Hatay province). (b) Total collapse of an RC building in Türkoğlu town (Kahramanmaraş province). The uncovered reinforcement bars were remarkably clean, revealing the poor quality and amount of the used cement. (c) The beam or slab-column joints in an RC building in Antakya city (Hataly province) were also proved to be inadequately detailed and reinforced, resulting in structural insufficiency. (d) Parts of a structure with conversion of balconies to rooms were heavily loaded and damaged.
Figure 8.
(a) Drone view from S to N of the area north of Balkar, where coseismic surface ruptures were detected. The area is located in the eastern margin of a pull-apart basin, where Balkar was founded. Azapli Lake is located in the western part of the basin. The coseismic surface ruptures caused displacement of rural roads and streams (b), fences and tree rows (c) and irrigation canals (d); destruction of the Malatya–Kahramanmaras road (M.-K.M. road) (e); and heavy building damage in the western part of Balkar including collapse (f). The yellow arrows show the left lateral strike-slip direction, while the white arrows in (e) point to the position of the surface ruptures.
Figure 9.
(a) Drone view from N to S presenting the central and southern part of Sekeroba town. Coseismic surface ruptures (yellow dotted line) were observed within the residential area, resulting in many collapses (b) due to the lateral offset and the formation of associated structures. The yellow arrows in (a) show the left lateral strike-slip direction. At a crossroads of Sekeroba (c), a large bulge was detected (red frame in (c)) corresponding to the formation of a pop-up ridge (d) within the principal deformation zone. In (d), the upward arrow corresponds to uplift, and the downward arrow to subsidence. Buildings adjacent to this bulge sustained heavy to very heavy damage including partial and total collapse, while other structures including roads and adjacent pavements were heavily deformed.
Figure 10.
(a) Coseismic surface ruptures within an elongated valley southwest of Sekeroba. (b) Buildings along the coseismic surface ruptures suffered collapse. (c) The collapse house at the intersection point suffered not only with the left-lateral offset but also with vertical displacement along the ruptures. The left-lateral offset was clearly detected in several sites along the ruptures with impact on cultivated fields and tree rows (d), rural roads and fences (d–f). The symbol (+) corresponds to uplift, while the symbol (−) corresponds to subsidence. The yellow arrows show the left lateral strike-slip direction.
Figure 11.
(a–c) Views of the coseismic surface ruptures (yellow lines) in Başpınar area located at the western suburbs of Nurdağı. (d–f) RC buildings with infill walls founded close to the surface ruptures sustained damage grade 4 (DG4) and 5 (DG5) in terms of the EMS-98, respectively. RC buildings located along the ruptures totally collapsed (g–i). The yellow arrows show the left lateral strike-slip direction.
Figure 12.
(a) Coseismic surface ruptures (yellow lines) in the area of Gökçedere settlement. The ruptures caused ground deformation resulting in (b) partial or total collapse of buildings (DG4: damage grade 4, DG5: damage grade 5 based on EMS-98) and offset of urban streets in the area. The yellow arrows show the left lateral strike-slip direction. (c) The ruptures crossed a road construction site. (d) A road leading to the site suffered bulge and cracking attributed to a pop-up ridge. (e) No damage was observed to structures and warehouses of the road construction site as well as to the adjacent tunnels. (f) Liquefaction was also triggered close to the coseismic ruptures.
Figure 13.
(a,b) Coseismic surface ruptures in İslahiye hospital (İ.H) area located at the northern end of İslahiye town. They affected fields and caused damage to part of the Gaziantep–Antakya (G.-A.) road. (c) The hospital located at a small distance west of the observed ruptures remained unaffected and operational during the aftershock period. (d) The surface ruptures (yellow dotted lines) have also affected the ambulance parking yard at the hospital entrance and (e) displaced the concrete perimeter wall south of the hospital. (f) A small-scale pull-apart basin was observed just outside the southern perimeter wall of the hospital. The upward white arrow corresponds to uplift, and the downward white arrow to subsidence. The yellow arrows show the left lateral strike-slip direction.
Figure 14.
(a) Drone view of the southwestern part of Hassa town presenting the coseismic surface ruptures (yellow lines) formed within the built-up area. Several empty spaces along the rupture (b) correspond either to collapse due to the earthquake or to subsequent demolition and debris removal (DR in (c)), revealing heavy and very heavy building damage along and close to the ruptures. They also caused displacement of a road (c) white lines correspond to the road edges and the red line corresponds to a red brick line in the middle of the road). The coseismic surface ruptures caused the displacement of the main E-W trending stream (d) that divides the town in two. The yellow arrows show the left lateral strike-slip direction.
Figure 15.
(a–d) Views of the coseismic surface ruptures (yellow lines) in the Saylan area located along the Çardak segment of the northern strand of the EAFZ. (a) View of the coseismic surface ruptures from NW to SE and (b) from SE to NW. (c) Buildings founded along the ruptures suffered total collapse due to the left-lateral offset accompanied with a vertical offset (d). The yellow arrows show the left lateral strike-slip direction.
Figure 16.
(a) Drone view of the eastern part of the Gölbaşi Lake from NE to SW presenting areas affected by lateral spreading along the lakeshore. The red frame includes the part of the city that sustained damage due to the lateral spreading in this lakeside environment. (b) Ground cracks resulted in deformation of fields and railways passing through the area. (c) A part of the lakeshore suffered subsidence and the subsequent inundation resulted also in impact on vegetation. (d) Ground cracks triggered by lateral spreading and subsidence along the lakeshore resulted in heavy damage to buildings and facilities and subsequent inundation.
Figure 17.
Views of damage to RC buildings attributed to liquefaction and lateral spreading within the residential area of Gölbaşı town. (a–d) Buildings suffering sinking without tilting. (e) Tilting of buildings without damage to the upper part of the structure. (f) Tilting of buildings and damage attributed to pounding of adjacent structures. (g) Lateral displacement of buildings on either side of the road accompanied with formation of a passive resistance wedge in the surrounding soil. (h) Outspread multi-layer collapse and (i) pancake-type collapse.
Figure 18.
The most affected area of Iskenderun city is the Çay district (a) extending from the coastline to the D817 state road. Heavy and very heavy damage corresponding to partial and total collapses (red dots) of RC buildings, respectively, was detected within three segments of this district (yellow dotted boxes in b–d).
Figure 19.
Antakya city (a) before (December 2022) and (b) after (May 2023) the early February 2023 earthquakes. The empty spaces in the built-up area of Antakya were created after the removal of collapse and demolition debris. They reveal that the most affected area of Antakya city with very heavy structural damage in buildings (red polygon) comprises a part of the new city west of the Orontes River with maximum width of about 2 km and a part of the old city east of the river with maximum width of about 1.5 km.
Figure 20.
(
a) Kahramanmaras city (black polygon) is located along the front of Ahir Mt. The largest part of the city is founded on Quaternary deposits (yellow polygon). This mountain front is disrupted by active faults that produced surface rupture during Holocene (red lines) and Pleistocene (purple lines) according to Emre et al. [
14]. The heavily affected part comprises the city center (light blue frame). (
b) View of Kahramanmaras from S (Maras Plain) to N (Ahir Mt) and (
c) from W (Sir Dam Lake) to E. An eastern section of the Sir Dam Lake has been formed close to the southwestern part of the city.
Figure 21.
Maps of the Kahramanmaras city (white polygon) illustrating the parts with high and very high landslide hazard (
a) as revealed with relevant research of Biçer and Ercanoglu [
65] and with high liquefaction potential (
b) based on the relevant research of Cabalar et al. [
64]. The heavily affected area presented high liquefaction potential and high landslide hazard, factors contributing to instability conditions and large damage in the city center.
Figure 22.
(a) Location map of landslides with impact on buildings and population (fatalities and injuries). (b,c) Characteristic view of landslide impact on residential buildings in Bektasli village (Kirikhan district, Hatay province).
Figure 22.
(a) Location map of landslides with impact on buildings and population (fatalities and injuries). (b,c) Characteristic view of landslide impact on residential buildings in Bektasli village (Kirikhan district, Hatay province).
| Disclaimer/Publisher’s Note: The statements, opinions and data contained in all publications are solely those of the individual author(s) and contributor(s) and not of MDPI and/or the editor(s). MDPI and/or the editor(s) disclaim responsibility for any injury to people or property resulting from any ideas, methods, instructions or products referred to in the content. |
© 2023 by the authors. Licensee MDPI, Basel, Switzerland. This article is an open access article distributed under the terms and conditions of the Creative Commons Attribution (CC BY) license (https://creativecommons.org/licenses/by/4.0/).


 ,
, 
