Abstract
Previous tsunami numerical model results show that the 1755 tsunami reached the Figueirinha beach 35 min after the earthquake, resulting in the inundation of the beach, the parking lot, and two sections of the road on the beach. Thus, an effective evacuation plan for the beach must be identified. However, conducting drills and evacuation exercises is costly and time-consuming. As an alternative, this study develops an agent-based model (ABM) to simulate the evacuation of beach users. The findings from this study reveal that, across the six considered scenarios, it is not feasible to evacuate all beach users in less than 35 min. The results also show there are only two routes available for evacuation—the left and right sides—with the left side offering a shorter evacuation time. However, both evacuation options come with advantages and disadvantages. The results of this study will be disseminated to local stakeholders.
1. Introduction
The role of stakeholders and policymakers is extremely important in disaster risk reduction, and, for this reason, a number of guidelines and tools have been created at the international, national, and local levels [1]. These instruments have been elaborated so that local stakeholders can collaborate with academic institutions, NGOs, and other non-governmental organizations, companies, and industries, as well as the local population. At the international level, the United Nations Office for Disaster Risk Reduction (UNDRR) has provided many recommendations and guidelines to be applied at the local level (municipalities), with the Sendai Framework for Disaster Risk Reduction 2015–2023 being the most relevant [2]. At the national level, each country has its own legislation and scientific and technical reports, which provide further tools to cope with disasters. In Portugal, the National Authority of Emergency and Civil Protection provides several decree laws [3], and the National Platform for Disaster Risk Reduction was created to provide national response strategies for disasters [4].
At the local level, Portugal has legal instruments that offer general guidelines for all types of risks that could impact its territory, including natural hazards and pandemics. The Setubal municipality (Figure 1) has a highly diversified territory, with a variety of land-use patterns [5], including SEVESO industries (Figure 1), which have very specific directives [6]. A recent paper reviewed the challenges of and solutions to building resilient urban communities in Setubal [1], finding that a local strategy has been defined [7]. Regarding previous hazards that have occurred at Figueirinha beach, forest fires, landslides, and rock-fall hazards have been mitigated mainly through the use of local strategies [1]. However, the 1969 earthquake, with a magnitude of Ms 8.0 [8], hit Setubal, and previous tsunami numerical model results [8] showed that the first tsunami wave arrived at Figueirinha beach 44 min after the earthquake. In addition, the same study [8] indicated that the 1755 earthquake, with a magnitude of Mw 8.7, also hit Setubal. The tsunami numerical model results [8] showed that Figueirinha beach, its parking lot, and the lower parts of its road were inundated (Figure 1c). This study also showed that there were two sections of the road with a low topography of 6–8m and 5–8m that could be partially inundated, thus trapping people on low-ground areas. In addition, this study showed that the first tsunami wave arrived 35 min [8] after the earthquake.
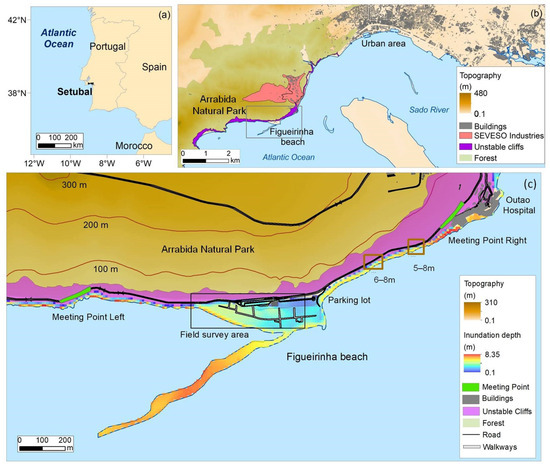
Figure 1.
Location of the study area: (a) location of Setubal municipality; (b) Figueirinha beach located on the west part of Setubal municipality; and (c) details of Figueirinha beach. Data on tsunami inundation depth were adapted from [8]. Meeting Point Right was proposed by [8], and Meeting Point Left is a new area proposed in this study that should be used in addition to Meeting Point Right. Setubal land-use data were adapted from [5].
For these reasons, it is very important to identify an effective evacuation plan for Figueirinha beach. Moreover, the regular practice of drills and evacuation exercises is an important component in testing such a plan, improving it, and enabling people to memorize the selected procedures. Although such recommendations have been published in the literature for quite some time [9,10,11], this topic remains very relevant. To achieve this, the Setubal municipality has organized many drills over the years, including some large-scale drills with more than 800 participants [12,13], to raise awareness and provide education on disasters, including tsunamis [1]. However, this is a costly activity, and its organization takes time and significant effort in terms of both equipment and human resources.
As an alternative to real drills and evacuation exercises, agent-based simulations are an important tool since they provide useful information to improve the implementation of evacuation strategies. The benefits of this technique stem from its rapid information processing and the possibility of considering different types of scenarios in an exploratory way, thus enabling the assessment of human or crowd behaviors and the characteristics of risky zones [14,15]. For example, by using computer simulations, new safe areas and strategies can be identified. The use of computer simulations, thus, constitutes a supplementary approach to collecting information that can lead to improvements.
Since the 1980s, several agent-based models (ABMs) have been developed [16], ranging from the most abstract models to more descriptive ones that seek to represent real-world scenarios; for example, the abstract model developed by [17] consisted of a social simulation in which individuals interacted in a neighborhood arranged in a grid and had to follow the rules of behavior. ABMs allow the modeling of complex social and environmental systems by representing individuals or agents with their own decision-making rules and interactions. ABMs have been applied to various domains, where they have been utilized to simulate the behaviors and interactions of individuals in an environment [18,19]. For example, ABMs have been used to simulate the dynamics of evacuation from volcanoes [20] and coastal communities in response to tsunami events [21,22]. Some studies were based on past events [23], while others were aimed at risk analysis [24]. A comprehensive overview of research in this field is provided in another work [22], which discusses the strengths and limitations of various evaluated models. This review highlights the significant contributions of ABMs to understanding tsunami evacuation but acknowledges the ongoing need for further research to refine and validate such models. Overall, ABMs have shown promise in simulating the complex interactions between social and environmental systems during tsunami events, and further research in this area could provide valuable insights into the design of effective disaster management strategies [24].
The objective of this study is to use an ABM to simulate the evacuation of beach users at Figueirinha beach during a tsunami event (Figure 1c), to understand whether it is possible to evacuate all beach users in less than 35 min [8], which corresponds to the time of the first tsunami wave’s arrival after the 1755 earthquake. The final outputs are fragility functions to estimate the probability of casualties at the beach due to a tsunami similar to the 1755 event (worst-case scenario). This study aims to make a valuable contribution to the improvement of the current evacuation plan for Figueirinha beach in the event of a tsunami, and to raise tsunami awareness and provide education for the local population. Furthermore, this study is intended to contribute to strategies for disaster risk reduction, not only for Setubal but also for other municipalities.
2. Materials and Methods
2.1. Study Area
Figueirinha beach (Figure 1) is the largest beach of the Setubal municipality, spanning approximately 530 m in length and 90 m in width, and it is very popular among residents and tourists, especially during the summer months from June to September. However, this area has several problems that constitute a significant challenge to stakeholders in terms of risk management and spatial planning. One of the problems is access to the shoreline: due to its wide sandy beach, several temporary walkways (2–4 m wide) are installed every year to allow easy access from the parking lot to the shoreline. These walkways must be removed due to winter storm surges, and, for this reason, it requires constant maintenance. Another problem is the transportation of the population: since the beach is located approximately 7 km from the Setubal urban area, beach users travel to the beach mostly by car or public bus. However, this constant flow of vehicles creates severe traffic congestion in the area. To solve this problem, some measures have been undertaken and are still in place [1]: since 2018, and during the summer months, the number of cars is restricted, the parking lot requires payment, and four shuttle buses are available for free. In addition, during the months of June and July, some children travel to the beach by school buses, but these buses do not remain in the area and park somewhere else.
While forest fires, landslides, and rock-fall hazards are mitigated mainly through the use of local strategies for emergency planning [1], one situation that has not yet been solved is related to beach evacuation. As mentioned in the Introduction, previous tsunami numerical modeling [8] showed that Figueirinha beach, its parking lot, and the low-ground area of its road were completely inundated (Figure 2), and, for this reason, people should not remain at the beach. Furthermore, the only access to higher ground is by using one narrow road. Due to unstable high cliffs [5], which are more than 100 m high, in the vicinity of the beach (Figure 1), there is constant work and countermeasures to contain rock falls [1], and no other escape route exists, except for the aforementioned road.
Nevertheless, a tsunami Meeting Point has been proposed near the Outao Hospital [8], which is indicated as Meeting Point Right (Figure 1c) and is located 29–40 m above the mean sea level. Since this area is not sufficient to accommodate all beach users, as well as hospital staff and patients, Meeting Point Left (Figure 1c) is proposed in this study, which is located at approximately 22 m above the mean sea level. Thus, Meeting Point Left should be used in addition to Meeting Point Right.
2.2. Field Survey
A field survey was conducted at Figueirinha beach on several occasions in 2022 and 2023. It was found that a female approximately 1.5 m in height and 75 kg in weight, thus being classified in the obesity category, took approximately 2 min and 30 s to walk the path of Route 1 (red line in Figure 2). It was not possible to walk through the tunnel because this road was closed due to the danger of rock falls (Figure 3a).
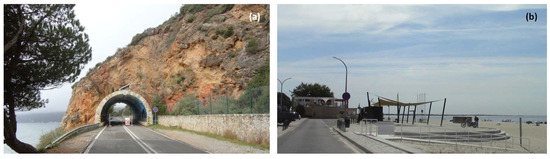
Figure 3.
Field survey photos. (a) The entrance of the small tunnel has been closed since at least 3 March 2023 due to rock-fall hazards. (b) Beach Exit 3 has a large ramp and stairs.

Figure 2.
Field survey conducted in the study area and the tsunami numerical model results. Data on tsunami inundation depth were adapted from [8].
Figure 2.
Field survey conducted in the study area and the tsunami numerical model results. Data on tsunami inundation depth were adapted from [8].

The length of Route 1 is approximately 180 m, which corresponds to an average walking speed of approximately 1.2 m/s (4.3 km/h). In addition, the results from the tsunami numerical model [8] indicate that the road near the tunnel experiences an inundation depth of up to 1.1 m in height, while the road after the tunnel remains outside the inundation zone, being situated at 8.5 m above the mean sea level (Figure 2). Thus, while walking on the road from this point onwards in the direction of Meeting Point Left (Figure 1c), beach users are already safe from tsunami waves. However, they must continue walking to reach Meeting Point Left because this route is too narrow to accommodate all beach users at once.
The same female participant conducted a second experiment by walking only on sand and completed the path of Route 2 (purple line in Figure 2) in approximately 1 min and 30 s. The path spanned approximately 90 m long, which resulted in an average walking speed of 1.0 m/s (3.6 km/h). The field survey also showed that the beach has six exits, all of which are equipped with walkways, except for Exit 4 (Figure 2). These exits have ramps and large stairs (Figure 3b) that allow easier mobility. Upon exiting the beach, people should evacuate to a safe area that is located on high ground and outside the inundation zone. Table 1 summarizes the distance between the Meeting Points and each beach exit, illustrating that the Meeting Points are at a considerable distance from the beach.

During the field survey, a school group was observed arriving at the beach, and the children took approximately 60 s to walk the 60-m walkway along Route 3 (blue line in Figure 2), resulting in a walking speed of 1.0 m/s (3.6 km/h). Furthermore, the results of the tsunami numerical model [8] show that the inundation depth on this road, which is situated on the right side of the beach and is near trees and the parking lot, reaches up to 1.4 m in height (Figure 2); in this area, the road is 7.5 m above the mean sea level, and by walking on the road from this point onwards in the direction of Meeting Point Right (Figure 1c), beach users are already safe from tsunami waves. Nevertheless, they must continue walking to reach the Meeting Point Right due to the road’s limited capacity to accommodate all beach users as it is too narrow. Unlike Meeting Point Left, which does not have any emergency infrastructure, Meeting Point Right is located near the Outao Hospital (Figure 1c), which can provide help and assistance to injured individuals.
2.3. Data
The data on the present population of beach users at Figueirinha beach were provided by the Municipal Civil Protection and Fire Service of Setubal (SMPCB), which were compiled during the summer months (June to September) of 2022. To simplify the simulations, two daily periods were considered: morning (7 a.m. to 12 p.m.) and afternoon (12 p.m. to 7 p.m.). The authors had several meetings with Civil Protection to discuss the data, as well as the preliminary results of the model. Moreover, in each period, the simulations considered the maximum number of the present population (worst-case scenario), as summarized in Table 2. Thus, there were a total of six scenarios. The details of each type of transportation used by beach users are presented below, as well as the census data.
Table 2.
Data on the population of beach users at Figueirinha beach in 2022, who were transported by public buses, cars, and school buses to the beach during the months of June, July, August, and September. Abbreviations: C—average number of children; A—average number of adults; T—total number of beach users.
The number of cars was obtained based on parking lot payments registered from 10 June to 30 September 2022. The parking lot operates daily from 7 a.m. to 7 p.m., and it is assumed that, on average, each car transports 2.5 people. Local knowledge and the parking lot records show that, on average, there is a constant flow of cars entering and leaving the parking lot approximately every 20 min; this means that there is a constant flow of people entering and leaving the beach. In June 2022, the flow was approximately 50 people; in July, it was 54 people; in August, it was 65 people; and in September, it was 38 people.
Previous studies that recorded daily beach users in Portugal from June to September [25] show that during the night-time period, there are people at the beach. However, during the night-time period (from 7 p.m. to 7 a.m. of the next day), the parking lot at Figueirinha beach is free and there are no locally available data. For this reason, the night-time scenario was not considered in this study.
There are four lines of public buses that transport people from the city’s urban area to the beach. They operate daily from 7 a.m. to 7 p.m., arriving and leaving Figueirinha beach, on average, every 20 min. The total number of transported people in June was 17,059; in July, it was 92,257; in August, it was 101,681; and in September, it was 16,849.
Children travel to the beach in the morning period (from 9 a.m. to 12 p.m.) during the months of June and July and are transported by school buses. There were 163 buses and 40 minivans to transport children in June, and 668 buses and 352 minivans in July. In addition, there was, on average, one adult for approximately 20 children, but the adults walked at the same velocity as the children.
Since the exact number of adults and children transported by public buses and cars is unknown, the ratios according to the 2022 Census data [26] were considered, and it was assumed that there were two age groups: 0–9 years and 10 years or older. The data show a ratio of 8.6% for children and a ratio of 91.4% for adults. These two age groups were chosen due to different walking velocities, as described in more detail in Section 2.4.3.
2.4. The Model
The model is an ABM programmed in Python. It was developed by the authors [27] using Mesa [28], an open-source Python library for agent-based modeling. A GIS extension called Mesa-Geo [29] was utilized, which implements a GeoSpace that can host GIS-based GeoAgents. These GeoAgents are regular agents but with geometric attributes imported from a shapefile and a coordinate reference system. We can view the model as consisting of three tiers: the geographical information, the algorithm, and the visualization tiers.
The geographical information is imported from a shapefile that includes spatial data related to Figueirinha beach, encompassing sand areas, walkways, stairs, buildings, the parking lot, and roads (Figure 1c and Figure 2). The algorithm processes the geospatial data representing the environment of Figueirinha beach and governs the behavior of the agents, which represent beach users. The role of the algorithm is mainly to determine the movement and navigation of the agents. Agent navigation is based on landmarks, which are virtual or natural features embedded in the geographical information layer and processed by the algorithm to guide the agents through appropriate routes. The visualization tier displays the simulation, allowing for the observation of beach users’ behavior in the environment.
2.4.1. Agents
Agents can be seen as autonomous entities that interact with their environment and other agents, each having a goal. In this case, the agents are the beachgoers present at the beach, with the goal of escaping to a safe area in the context of an evacuation exercise or a drill. There are two types of agents: adults and children. Adults can be alone or in groups with other adults or children. In the case of schools, a group consists of 1 adult and 20 children, which is in line with the previously mentioned data (Section 2.3). Initially, agents are uniformly distributed across the sandy areas. The adults and children of each school group are assigned to the same neighborhood.
2.4.2. Landmark-Based Routes
Algorithms that calculate an optimal nearest-path route for each agent tend to become increasingly demanding as the number of agents increases. Stern (2019) [30] discussed the challenges that algorithms like A* face in solving the nearest-path problems, considering the size of the search space and its branching factor. Landmark-based routing approaches [31,32] provide an alternative for the simulation of evacuation exercises and drills due to their lower computational demands.
A landmark is a reference point that captures visual attention, such as a naturally salient reference point or a location in the architectural layout that can serve as the object of the decision-making navigation process [33]. One advantage of landmark-based algorithms is that they do not require each agent to maintain a set of possible routes in memory while searching for the most suitable one [31]. In this model, landmarks are natural features or user-defined virtual objects in the geographic information system layer, which guide agents along appropriate routes.
Three types of landmarks were defined: safe areas (Figure 1c), beach exits (Figure 2), and basic landmarks. The last type includes auxiliary references that are densely arranged throughout selected walking areas to facilitate the building of a network of possible routes to the beach exits and, from there, to the Meeting Points.
The algorithm that establishes the set of possible routes consists of two phases. Initially, a reference to the nearest beach exit (Figure 2) is established at each basic landmark on the beach. In the second step, each is linked to the nearest basic landmark that shares the same beach exit. This leads to an interconnected mesh of landmarks, forming a network of possible paths to the beach exits. Landmarks on the beach walkways (Figure 2) undergo a specific treatment to maintain coherent routes if the agents choose to evacuate in this way. The same process is then applied to the basic landmarks along the road, which connects the six beach exits to the Meeting Points, with the distances varying between approximately 760 m and 1090 m, as indicated in Table 1. Therefore, agents who leave the beach using Exits 1 to 4 travel to Meeting Point Left, and those who leave the beach using Exits 5 and 6 travel to Meeting Point Right, since these are the shortest distances to travel.
2.4.3. Agent Navigation, Walking Speed, and Collision Management
To leave the beach, agents either choose the closest walkway or ignore the walkways and walk on the sand toward the beach exits. The proportion of agents who choose the walkways is configurable. The walking speed on these walkways is higher than on the sand, but walking on the latter can avoid the congestion that may occur on the walkways. For convenience and due to the lack of data, it is assumed that if there are school groups at the beach (in the scenarios during the mornings of June and July, as presented in Table 2), the walkways are used exclusively to evacuate these groups, while the rest of the beach users should walk directly on the sand to the nearest beach exit. In the four scenarios with no school groups (June and July afternoons, and August and September mornings and afternoons), in which everyone arrives by car and public bus, it is assumed that 50% would walk on the sand, and 50% would use the walkways.
The walking speeds of pedestrians vary widely depending on intrinsic and extrinsic conditions, such as their physical condition, gender, age, country, surface, and slope [34,35,36]. A normal distribution with an average walking speed of 1.12 m/s (4.0 km/h) and 1 m/s (3.6 km/h) is adopted for adults and children, respectively, both with a standard deviation of 0.17 m/s (0.6 km/h), which agrees with the field survey data. On the other hand, a penalty of 13% is applied when walking on sand [37]. Moreover, considering the average gradient of the road leading up to the safe areas located on high ground, a 30% penalty is applied to agents walking up the road [38].
Collision avoidance refers to the phenomenon of people changing their direction of movement to prevent collisions with others. In the model, we observed the need to manage the prevention of two types of collision, which could be classified as glancing and away collisions [39,40]. Glancing occurs when two agents move toward the same place. In this case, the agent closest to the destination has priority, while the other slows down or stops. Away collisions refer to the possibility of colliding from behind with another agent. When an agent is close behind another agent with a higher walking speed than the later, if both are heading toward the same basic landmark, the former overtakes the latter using adjoining basic landmarks.
2.4.4. Group Management
In the case of school groups, each group is assumed to comprise one adult and 20 children to be in line with the provided data, as described in Section 2.3. However, due to the unavailability of data for other groups, certain criteria have to be assumed. Adults may be either alone or with other adults or children. Children are never alone. For individuals arriving by car or bus, the census data mentioned earlier indicate that 8.6% are children, and it is assumed that groups can have up to a maximum of five individuals.
For school groups, the algorithm initially assigns a leader to each group, who must be an adult-type agent. At the beginning of the simulation, followers meet with their respective leaders. The leader searches within a certain influence area to check if the group is reunited, and, once all followers are gathered, the leader starts the evacuation. If followers have a lower walking speed, such as child-type agents, they can fall behind. When a follower falls behind for more than a certain distance, the leader stops and waits.
3. Results and Discussion
In this study, the calculated casualties correspond to the number of people who may be dead or injured, either by remaining in the tsunami inundation zone of the study area or at the road (Figure 1c and Figure 2), at 35 min after the earthquake. In the opposite situation, people who reach Meeting Points Left and Right are considered to be safe. This study also considers the orderly evacuation of beach users and assumes that they start to move immediately after the earthquake.
For each of the six scenarios presented in Table 2, five runs were carried out. The output results of the number of agents that were at the beach and at the Meeting Points for each of the five runs were recorded, and then the mean and standard deviation were calculated. These results are presented in Appendix A. In general, the standard deviation is less than 5%, which shows that the results of the mean of the five runs are acceptable. Higher standard deviation values were obtained for the four day-time scenarios without school groups (June and July afternoons, and August and September mornings and afternoons) because the number of children was considerably lower when compared to the number of adults.
The results also show that the first adults and children leave the beach within a few minutes (Appendix A and Figure 4), which is consistent with the data recorded during the field survey. However, in all of the six scenarios, the total population of beach users takes approximately 15–20 min to leave the beach. These long evacuation times are related to the large number of agents at the beach, all of whom have to evacuate by using the six beach exits. Thus, we recommend increasing the number of walkways, as well as increasing the width of these pathways, since it is easier to walk on hard floor than on sand. The shape of the sandy beach and the distribution of people on the beach should also be evaluated so that people can use the six beach exits evenly.
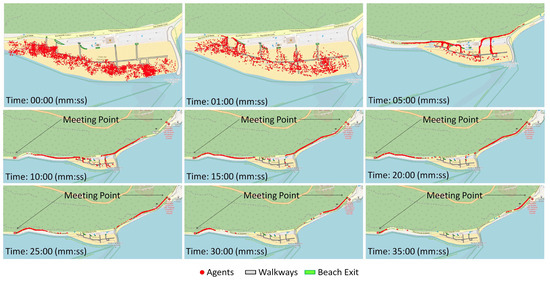
Figure 4.
Simulation results showing snapshots of agents’ movement. These are the results of one of the five runs carried out in the July morning scenario.
In addition, the results show that in all scenarios, adults begin to reach Meeting Points Left and Right at 15 min, while children reach them at 20 min (Appendix A and Figure 4 and Figure 5). At these times, there are still people remaining on the beach (Appendix A and Figure 4). These results hold significant importance as they highlight the need for people to evacuate in an orderly and quick manner to the Meeting Points and refrain from lingering on the road, because the area is not sufficient to accommodate all beach users. Furthermore, people should evacuate by walking and not using their cars. Moreover, people may delay starting their evacuation, which may lead to more casualties [41]. For this reason, beach users must begin to leave the beach for higher ground immediately after an earthquake.
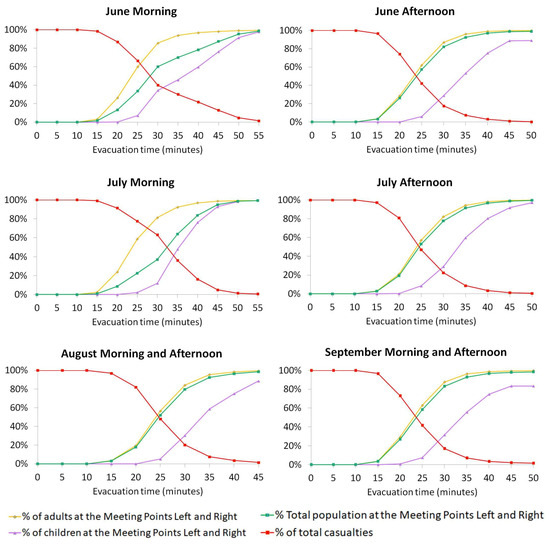
Figure 5.
Fragility functions: results of the simulation of the six scenarios presented in Table 2 (means of the 5 runs for each scenario, as presented in Appendix A). The calculated time refers to the time that beach users take to reach Meeting Points Left and Right (Figure 1c) and are, therefore, considered to be safe.
A fragility function is defined as a function describing the probability of exceeding different limit states (such as damage or injury levels), given a certain level of a limit state—for example, a function that relates earthquake intensities with the probability of exceeding a certain ground-shaking level or the probability of damage to buildings [42]. Previous tsunami studies have related the inundation depth with the probability of exceeding certain thresholds for damaging houses or saving people [43]. The case study presented in this research relates the evacuation time to the probability of exceeding certain limits for saving people, or the percentage of people who may be saved, as opposed to the percentage of casualties (Figure 5).
At 35 min after the earthquake, the time that corresponds to the arrival of the first tsunami waves [8], there are no people left at the beach or the parking lot in all the scenarios (Figure 4).
In fact, the large majority of adults reach the Meeting Points (Appendix A, Figure 5 and Figure 6), with a mean of 92.3% and a standard deviation of 1.7% in the scenario of July mornings, and a mean of 96.3 % and a standard deviation of 1.0% in the scenario of September mornings and afternoons. On the other hand, approximately half of the children reach the Meeting Points, with a mean of 45.8% and a standard deviation of 7.5% in the scenario of June mornings, and a mean of 59.8% and a standard deviation of 9.6% in the scenario of July afternoons. These results yield a mean total population of 63.9% at the Meeting Points and a standard deviation of 5.7% in the scenario of July mornings, and a mean of 92.4% and a standard deviation of 0.0% in the scenario of September mornings and afternoons.
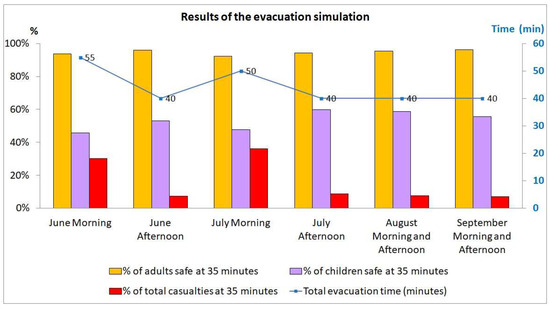
Figure 6.
Percentages of safe adults and children and total casualties at 35 min after the earthquake, and total evacuation time, considering that 98% of total beach users reach the Meeting Points (Figure 1c).
In addition, by analyzing Figure 6, we observe a correlation of −0.73 between the total evacuation time and the percentage of saved adults, and a correlation of −0.91 with the percentage of saved children, both indicating strong negative correlations. On the other hand, there is a strong positive correlation of 0.93 between the total evacuation time and the percentage of total casualties. These results are robust enough to accept the simulation outcomes. In addition, as the total evacuation time increases, the percentage of safe individuals decreases, while the percentage of casualties increases. In other words, the faster the evacuation is conducted, the fewer casualties there will be due to the tsunami, which is consistent with real-world expectations and observations.
However, 35 min after the earthquake, there are some people remaining on the road. As mentioned earlier, the path to Meeting Point Left is prone to forest fires and rock-fall hazards, making it an unsafe option to take. The path to Meeting Point Right is also prone to forest fires and rock-fall hazards, along with two sections of the road that could be inundated by the tsunami (Figure 1c). In light of this, we considered four new scenarios to simulate the situations in which people need to evacuate either to the left or to the right of the beach (Figure 7). For these scenarios, we utilized the June morning data (approximately 1000 agents with school groups) and the July afternoon data (approximately 1000 agents without school groups) as the input.
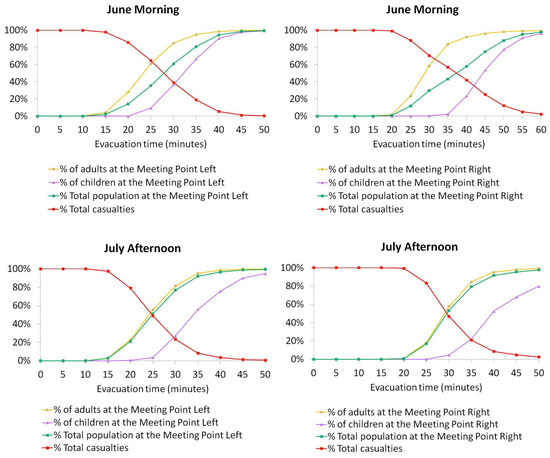
Figure 7.
Fragility functions: simulation results (means of 5 runs) in the scenarios of June morning (929 agents, with school groups) and July afternoon (1070 agents, without school groups), depicting evacuation to the left and right of the beach to reach Meeting Points Left and Right, respectively (Figure 1c).
A comparison of the results presented in Figure 5 and Figure 7 shows that evacuation to Meeting Point Left is faster than evacuation to both sides or to Meeting Point Right: the first children arrive at the safe area within 25 min (9.4% to the left and 7.1% if they evacuate to both sides) and within 30 min if they evacuate to the right (0.3%). On the other hand, the first adults arrive at the safe area within 15 min (4.4% to the right and 3.1% if they evacuate to both sides) and within 20 min (1.8% to the right).
The comparison of the results presented in Figure 5 and Figure 7, at 35 min after the earthquake, is summarized in Table 3, highlighting that evacuating only to Meeting Point Right causes more casualties. In fact, this situation occurred in 2023 during the period when access to Meeting Point Left was closed due to rock-fall hazards (Figure 3a). One of the reasons for the discrepancies in the results may be the considerable distances between each beach exit and Meeting Points Left and Right (Table 1). Furthermore, evacuating to Meeting Point Left may expose beach users to the danger of rock falls, while evacuating to Meeting Point Right may lead to beach users being trapped by tsunami waves due to the low topography of the road (Figure 1c). On the positive side, the right side offers the advantage of having a large area to accommodate people, and the Outao Hospital will be relocated (the construction of the new hospital at the new location is already underway). Thus, we recommend that preventive measures to contain rock-fall hazards continue, along with measures to increase the topography of the two stretches of the road and reinforce the coastlines of these areas.
Table 3.
Probability of casualties at 35 min after the earthquake, considering approximately 1000 agents with and without school groups.
Therefore, there is no perfect solution, and both Meeting Points (Left and Right) have their own advantages and disadvantages that need to be addressed. While the tsunami warning system in Japan has been developed with significant recent progress [44,45], Portugal still does not have a national tsunami warning system. This lack of an early warning system clearly highlights the importance of the preparedness of the population, including updating current emergency plans and conducting evacuation exercises to train beach users and stakeholders in disaster management.
4. Conclusions
The Setubal municipality faces multiple hazards that need to be continuously evaluated and addressed by stakeholders. Especially at Figueirinha beach, which is mostly susceptible to forest fires and rock-fall hazards, a safe place to remain is the beach. However, if a large earthquake occurs, followed by a tsunami, the beach becomes the most dangerous area to remain. Consequently, beach users must evacuate immediately by walking to the Meeting Points that are located outside of the inundation areas and on high ground. The best option related to the fastest route is to evacuate everybody to Meeting Point Left. Moreover, the Outao Hospital in this area will be relocated (the construction of the new hospital at the new location is already underway).
Based on the simulation results of this study, we suggest that preventive measures to contain rock-fall hazards continue and there should be measures to increase the topography of the two stretches of the road, as well as reinforcement of the coastlines of these areas. We recommend that the number of temporary walkways should be increased, as well as their width; the shape of the sandy beach and the distribution of people on the beach should also be evaluated. These parameters could be incorporated in future simulations as a follow-up of this study.
The results of this study will be disseminated to Civil Protection to assess which measures may be taken to mitigate the local multi-hazards and to update the current emergency plans and evacuation exercises to train beach users and stakeholders in disaster management.
Author Contributions
Conceptualization, A.S. and N.D.; methodology, A.S., N.D., N.P. and E.C.; software and calculations, E.C. and N.P.; formal analysis, A.S. and N.D.; writing—original draft preparation, A.S. and N.P.; writing—review and editing, A.S. and N.D.; visualization, A.S., N.D., and N.P.; funding acquisition, A.S. All authors have read and agreed to the published version of the manuscript.
Funding
This research was supported by Portuguese national funds through the Fundação para a Ciência e a Tecnologia (FCT, I.P.), under the funding “UIDB/GEO/00295/2020” and “UIDP/GEO/00295/2020”, and TERRA funding “LA/P/0092/2020”.
Data Availability Statement
Data are contained within this article.
Acknowledgments
The authors would like to thank the Municipal Civil Protection and Fire Service of Setubal (SMPCB) for providing the data related to the present population at Figueirinha beach.
Conflicts of Interest
The authors declare no conflict of interest. The funders had no role in the design of the study; in the collection, analyses, or interpretation of data; in the writing of the manuscript; or in the decision to publish the results.
Appendix A
Table A1.
Results of June morning.
Table A1.
Results of June morning.
| % of Adults | % of Children | % of Total Population | ||||||||||
|---|---|---|---|---|---|---|---|---|---|---|---|---|
| At the Beach | At the Meeting Point | At the Beach | At the Meeting Point | At the Beach | At the Meeting Point | |||||||
| Time (Minutes) | Mean | Stand. Dev. | Mean | Stand. Dev. | Mean | Stand. Dev. | Mean | Stand. Dev. | Mean | Stand. Dev. | Mean | Stand. Dev. |
| 0 | 100.0 | 0.0 | 0.0 | 0.0 | 100.0 | 0.0 | 0.0 | 0.0 | 100.0 | 0.0 | 0.0 | 0.0 |
| 5 | 6.3 | 1.1 | 0.0 | 0.0 | 36.8 | 4.0 | 0.0 | 0.0 | 22.2 | 1.2 | 0.0 | 0.0 |
| 10 | 2.3 | 0.8 | 0.0 | 0.0 | 6.6 | 3.2 | 0.0 | 0.0 | 3.7 | 2.1 | 0.0 | 0.0 |
| 15 | 0.1 | 0.2 | 3.1 | 0.3 | 2.1 | 2.1 | 0.0 | 0.0 | 0.6 | 0.6 | 1.6 | 0.2 |
| 20 | 0.0 | 0.0 | 26.3 | 1.3 | 0.0 | 0.0 | 0.0 | 0.1 | 0.0 | 0.0 | 13.2 | 0.6 |
| 25 | 0.0 | 0.0 | 59.9 | 2.0 | 0.0 | 0.0 | 7.1 | 3.1 | 0.0 | 0.0 | 33.6 | 2.2 |
| 30 | 0.0 | 0.0 | 85.5 | 1.3 | 0.0 | 0.0 | 34.3 | 4.6 | 0.0 | 0.0 | 60.0 | 2.7 |
| 35 | 0.0 | 0.0 | 93.8 | 1.4 | 0.0 | 0.0 | 45.8 | 7.5 | 0.0 | 0.0 | 69.9 | 4.0 |
| 40 | 0.0 | 0.0 | 96.8 | 0.6 | 0.0 | 0.0 | 59.7 | 5.5 | 0.0 | 0.0 | 78.3 | 2.8 |
| 45 | 0.0 | 0.0 | 98.1 | 0.7 | 0.0 | 0.0 | 76.2 | 3.8 | 0.0 | 0.0 | 87.2 | 2.0 |
| 50 | 0.0 | 0.0 | 99.1 | 0.6 | 0.0 | 0.0 | 91.5 | 3.6 | 0.0 | 0.0 | 95.3 | 2.1 |
| 55 | 0.0 | 0.0 | 99.4 | 0.5 | 0.0 | 0.0 | 97.7 | 2.3 | 0.0 | 0.0 | 98.6 | 1.2 |
Table A2.
Results of June afternoon.
Table A2.
Results of June afternoon.
| % of Adults | % of Children | % of Total Population | ||||||||||
|---|---|---|---|---|---|---|---|---|---|---|---|---|
| At the Beach | At the Meeting Point | At the Beach | At the Meeting Point | At the Beach | At the Meeting Point | |||||||
| Time (Minutes) | Mean | Stand. Dev. | Mean | Stand. Dev. | Mean | Stand. Dev. | Mean | Stand. Dev. | Mean | Stand. Dev. | Mean | Stand. Dev. |
| 0 | 100.0 | 0.1 | 0.0 | 0.0 | 100.0 | 0.0 | 0.0 | 0.0 | 100.0 | 0.0 | 0.0 | 0.0 |
| 5 | 5.1 | 2.1 | 0.0 | 0.0 | 91.7 | 7.0 | 0.0 | 0.0 | 12.4 | 2.5 | 0.0 | 0.0 |
| 10 | 2.0 | 0.9 | 0.0 | 0.0 | 31.2 | 10.0 | 0.0 | 0.0 | 4.5 | 1.6 | 0.0 | 0.0 |
| 15 | 0.2 | 0.3 | 3.5 | 0.8 | 6.8 | 6.1 | 0.0 | 0.0 | 0.8 | 0.8 | 3.2 | 0.7 |
| 20 | 0.0 | 0.0 | 28.7 | 4.5 | 0.0 | 0.0 | 0.0 | 0.0 | 0.0 | 0.0 | 26.3 | 4.2 |
| 25 | 0.0 | 0.0 | 62.0 | 3.8 | 0.0 | 0.0 | 5.9 | 5.6 | 0.0 | 0.0 | 57.2 | 3.9 |
| 30 | 0.0 | 0.0 | 87.0 | 3.1 | 0.0 | 0.0 | 28.8 | 13.7 | 0.0 | 0.0 | 82.1 | 3.9 |
| 35 | 0.0 | 0.0 | 96.0 | 1.3 | 0.0 | 0.0 | 53.2 | 19.5 | 0.0 | 0.0 | 92.4 | 2.5 |
| 40 | 0.0 | 0.0 | 99.0 | 0.5 | 0.0 | 0.0 | 75.1 | 12.6 | 0.0 | 0.0 | 96.9 | 1.5 |
| 45 | 0.0 | 0.0 | 99.7 | 0.2 | 0.0 | 0.0 | 88.8 | 8.9 | 0.0 | 0.0 | 98.8 | 0.9 |
| 50 | 0.0 | 0.0 | 99.8 | 0.3 | 0.0 | 0.0 | 89.0 | 12.1 | 0.0 | 0.0 | 98.9 | 1.3 |
Table A3.
Results of July morning.
Table A3.
Results of July morning.
| % of Adults | % of Children | % of Total Population | ||||||||||
|---|---|---|---|---|---|---|---|---|---|---|---|---|
| At the Beach | At the Meeting Point | At the Beach | At the Meeting Point | At the Beach | At the Meeting Point | |||||||
| Time (Minutes) | Mean | Stand. Dev. | Mean | Stand. Dev. | Mean | Stand. Dev. | Mean | Stand. Dev. | Mean | Stand. Dev. | Mean | Stand. Dev. |
| 0 | 100.0 | 0.0 | 0.0 | 0.0 | 100.0 | 0.0 | 0.0 | 0.0 | 100.0 | 0.0 | 0.0 | 0.0 |
| 5 | 10.9 | 2.3 | 0.0 | 0.0 | 42.7 | 6.3 | 0.0 | 0.0 | 31.2 | 4.9 | 0.0 | 0.0 |
| 10 | 4.1 | 1.5 | 0.0 | 0.0 | 9.4 | 2.5 | 0.0 | 0.0 | 7.5 | 2.0 | 0.0 | 0.0 |
| 15 | 0.7 | 0.5 | 2.5 | 0.5 | 2.6 | 1.1 | 0.0 | 0.0 | 1.9 | 0.8 | 0.9 | 0.2 |
| 20 | 0.0 | 0.0 | 23.8 | 2.0 | 0.1 | 0.1 | 0.0 | 0.1 | 0.0 | 0.1 | 8.6 | 0.7 |
| 25 | 0.0 | 0.0 | 58.7 | 1.7 | 0.1 | 0.1 | 2.2 | 1.3 | 0.0 | 0.1 | 22.6 | 1.1 |
| 30 | 0.0 | 0.0 | 81.3 | 1.5 | 0.0 | 0.0 | 11.9 | 2.7 | 0.0 | 0.0 | 36.9 | 2.0 |
| 35 | 0.0 | 0.0 | 92.3 | 1.7 | 0.0 | 0.0 | 47.8 | 8.1 | 0.0 | 0.0 | 63.9 | 5.7 |
| 40 | 0.0 | 0.0 | 96.9 | 0.8 | 0.0 | 0.0 | 76.2 | 6.0 | 0.0 | 0.0 | 83.7 | 4.1 |
| 45 | 0.0 | 0.0 | 98.7 | 0.2 | 0.0 | 0.0 | 92.9 | 2.6 | 0.0 | 0.0 | 95.0 | 1.7 |
| 50 | 0.0 | 0.0 | 99.2 | 0.1 | 0.0 | 0.0 | 98.3 | 0.4 | 0.0 | 0.0 | 98.6 | 0.3 |
| 55 | 0.0 | 0.0 | 99.3 | 0.0 | 0.0 | 0.0 | 99.3 | 0.7 | 0.0 | 0.0 | 99.3 | 0.5 |
Table A4.
Results of July afternoon.
Table A4.
Results of July afternoon.
| % of Adults | % of Children | % of Total Population | ||||||||||
|---|---|---|---|---|---|---|---|---|---|---|---|---|
| At the Beach | At the Meeting Point | At the Beach | At the Meeting Point | At the Beach | At the Meeting Point | |||||||
| Time (Minutes) | Mean | Stand. Dev. | Mean | Stand. Dev. | Mean | Stand. Dev. | Mean | Stand. Dev. | Mean | Stand. Dev. | Mean | Stand. Dev. |
| 0 | 100.0 | 0.0 | 0.0 | 0.0 | 100.0 | 0.0 | 0.0 | 0.0 | 100.0 | 0.0 | 0.0 | 0.0 |
| 5 | 13.6 | 3.0 | 0.0 | 0.0 | 93.3 | 3.6 | 0.0 | 0.0 | 20.4 | 2.9 | 0.0 | 0.0 |
| 10 | 2.5 | 0.5 | 0.0 | 0.0 | 38.9 | 10.5 | 0.0 | 0.0 | 5.6 | 1.2 | 0.0 | 0.0 |
| 15 | 0.3 | 0.3 | 3.0 | 0.6 | 6.7 | 2.8 | 0.0 | 0.0 | 0.9 | 0.4 | 2.7 | 0.6 |
| 20 | 0.0 | 0.0 | 21.1 | 1.0 | 1.5 | 2.3 | 0.2 | 0.5 | 0.1 | 0.2 | 19.3 | 0.9 |
| 25 | 0.0 | 0.0 | 57.2 | 1.6 | 0.0 | 0.0 | 8.5 | 5.5 | 0.0 | 0.0 | 53.0 | 1.7 |
| 30 | 0.0 | 0.0 | 82.2 | 1.9 | 0.0 | 0.0 | 28.9 | 4.9 | 0.0 | 0.0 | 77.6 | 2.1 |
| 35 | 0.0 | 0.0 | 94.3 | 0.7 | 0.0 | 0.0 | 59.8 | 9.6 | 0.0 | 0.0 | 91.3 | 0.5 |
| 40 | 0.0 | 0.0 | 98.2 | 0.4 | 0.0 | 0.0 | 80.2 | 3.3 | 0.0 | 0.0 | 96.6 | 0.6 |
| 45 | 0.0 | 0.0 | 99.4 | 0.4 | 0.0 | 0.0 | 91.7 | 2.6 | 0.0 | 0.0 | 98.8 | 0.6 |
| 50 | 0.0 | 0.0 | 99.8 | 0.3 | 0.0 | 0.0 | 97.2 | 2.7 | 0.0 | 0.0 | 99.5 | 0.4 |
Table A5.
Results of August morning and afternoon.
Table A5.
Results of August morning and afternoon.
| % of Adults | % of Children | % of Total Population | ||||||||||
|---|---|---|---|---|---|---|---|---|---|---|---|---|
| At the Beach | At the Meeting Point | At the Beach | At the Meeting Point | At the Beach | At the Meeting Point | |||||||
| Time (Minutes) | Mean | Stand. Dev. | Mean | Stand. Dev. | Mean | Stand. Dev. | Mean | Stand. Dev. | Mean | Stand. Dev. | Mean | Stand. Dev. |
| 0 | 100.0 | 0.0 | 0.0 | 0.0 | 100.0 | 0.0 | 0.0 | 0.0 | 100.0 | 0.0 | 0.0 | 0.0 |
| 5 | 12.0 | 2.8 | 0.0 | 0.0 | 87.7 | 3.7 | 0.0 | 0.0 | 18.5 | 2.9 | 0.0 | 0.0 |
| 10 | 2.8 | 1.9 | 0.0 | 0.0 | 36.5 | 9.0 | 0.0 | 0.0 | 5.7 | 2.4 | 0.0 | 0.0 |
| 15 | 0.6 | 0.4 | 3.2 | 0.4 | 7.9 | 5.7 | 0.0 | 0.0 | 1.2 | 0.9 | 3.0 | 0.4 |
| 20 | 0.1 | 0.1 | 19.6 | 1.1 | 1.3 | 1.9 | 0.0 | 0.0 | 0.2 | 0.2 | 17.9 | 1.0 |
| 25 | 0.0 | 0.0 | 56.5 | 1.7 | 0.2 | 0.4 | 5.2 | 4.3 | 0.0 | 0.0 | 52.1 | 1.6 |
| 30 | 0.0 | 0.0 | 84.2 | 0.9 | 0.0 | 0.0 | 30.4 | 5.4 | 0.0 | 0.0 | 79.6 | 1.2 |
| 35 | 0.0 | 0.0 | 95.5 | 0.5 | 0.0 | 0.0 | 58.7 | 3.0 | 0.0 | 0.0 | 92.3 | 0.7 |
| 40 | 0.0 | 0.0 | 98.4 | 0.2 | 0.0 | 0.0 | 75.0 | 8.2 | 0.0 | 0.0 | 96.4 | 0.8 |
| 45 | 0.0 | 0.0 | 99.5 | 0.1 | 0.0 | 0.0 | 88.8 | 0.6 | 0.0 | 0.0 | 98.6 | 0.1 |
Table A6.
Results of September morning and afternoon.
Table A6.
Results of September morning and afternoon.
| % of Adults | % of Children | % of Total Population | ||||||||||
|---|---|---|---|---|---|---|---|---|---|---|---|---|
| At the Beach | At the Meeting Point | At the Beach | At the Meeting Point | At the Beach | At the Meeting Point | |||||||
| Time (Minutes) | Mean | Stand. Dev. | Mean | Stand. Dev. | Mean | Stand. Dev. | Mean | Stand. Dev. | Mean | Stand. Dev. | Mean | Stand. Dev. |
| 0 | 100.0 | 0.0 | 0.0 | 0.0 | 100.0 | 0.0 | 0.0 | 0.0 | 100.0 | 0.0 | 0.0 | 0.0 |
| 5 | 4.7 | 0.9 | 0.0 | 0.0 | 87.3 | 7.8 | 0.0 | 0.0 | 11.5 | 1.3 | 0.0 | 1.3 |
| 10 | 1.2 | 0.6 | 0.0 | 0.0 | 27.9 | 9.9 | 0.0 | 0.0 | 3.4 | 1.3 | 0.0 | 1.3 |
| 15 | 0.4 | 0.3 | 3.6 | 0.7 | 10.3 | 4.1 | 0.0 | 0.0 | 1.2 | 0.6 | 3.3 | 0.6 |
| 20 | 0.1 | 0.1 | 29.4 | 2.0 | 2.4 | 5.4 | 0.6 | 1.4 | 0.3 | 0.6 | 27.0 | 0.6 |
| 25 | 0.0 | 0.0 | 62.9 | 2.2 | 0.0 | 0.0 | 7.3 | 7.6 | 0.0 | 0.0 | 58.3 | 0.0 |
| 30 | 0.0 | 0.0 | 87.6 | 2.0 | 0.0 | 0.0 | 31.5 | 14.8 | 0.0 | 0.0 | 83.0 | 0.0 |
| 35 | 0.0 | 0.0 | 96.3 | 1.0 | 0.0 | 0.0 | 55.8 | 13.0 | 0.0 | 0.0 | 92.9 | 0.0 |
| 40 | 0.0 | 0.0 | 98.7 | 0.4 | 0.0 | 0.0 | 74.5 | 9.7 | 0.0 | 0.0 | 96.7 | 0.0 |
| 45 | 0.0 | 0.0 | 99.3 | 0.6 | 0.0 | 0.0 | 83.3 | 12.5 | 0.0 | 0.0 | 98.0 | 0.0 |
| 50 | 0.0 | 0.0 | 99.7 | 0.4 | 0.0 | 0.0 | 83.3 | 10.7 | 0.0 | 0.0 | 98.4 | 0.0 |
References
- Santos, A.; Sousa, N.; Kremers, H.; Bucho, J.L. Building resilient urban communities: The case study of Setubal Municipality. Portugal. Geosciences 2020, 10, 243. [Google Scholar] [CrossRef]
- United Nations Office for Disaster Reduction UNDRR. Sendai Framework for Disaster Risk Reduction 2015–2030; UNISDR: Geneva, Switzerland, 2015; p. 32. Available online: https://www.undrr.org/publication/sendai-framework-disaster-risk-reduction-2015-2030 (accessed on 15 July 2023).
- National Authority of Emergency and Civil Protection. General Law. 2023. Available online: https://prociv.gov.pt/pt/legislacao/ (accessed on 15 July 2023). (In Portuguese)
- National Platform for Disaster Risk Reduction. 2023. Available online: https://www.pnrrc.pt/ (accessed on 15 July 2023). (In Portuguese).
- Aleluia, A. Digital Cartography of the Setubal Municipality at Scale 1:10,000; Department of Urbanism, Cabinet of Geographical Information System; Setubal City Hall: Setubal, Portugal, 2011. (In Portuguese) [Google Scholar]
- Sousa, N. The Civil Planning of Emergency in the New Paradigm of Safety. Master’s Thesis, University of Lisbon, Lisbon, Portugal, 2016. Available online: https://www.repository.utl.pt/handle/10400.5/11567 (accessed on 15 July 2023). (In Portuguese).
- European Commission. Seveso Directive. 2019. Available online: https://ec.europa.eu/environment/seveso/legislation.htm (accessed on 15 July 2023).
- Santos, A.; Fonseca, N.; Queirós, M.; Zêzere, J.L.; Bucho, J.L. Implementation of Tsunami Evacuation Maps at Setubal Municipality. Portugal. Geosciences 2017, 7, 116. [Google Scholar] [CrossRef]
- Kobes, M.; Helsloot, I.; de Vries, B.; Post, J.G.; Oberijé, N.; Groenewegen, K. Way finding during fire evacuation; an analysis of unannounced fire drills in a hotel at night. Build. Environ. 2010, 45, 537–548. [Google Scholar] [CrossRef]
- Bird, D.K.; Chagué-Goff, C.; Gero, A. Human Response to Extreme Events: A review of three post-tsunami disaster case studies. Aust. Geogr. 2011, 42, 225–239. [Google Scholar] [CrossRef]
- Dengler, L.; Goltz, J.; Fenton, J.; Miller, K.; Wilson, R. Building tsunami-resilient communities in the United States: An example from California. TsuInfo Alert 2011, 13, 2. [Google Scholar]
- SMPCB. MITREX Exercise; Setubal City Hall: Setubal, Portugal, 2012; p. 487. (In Portuguese) [Google Scholar]
- Setubal City Hall. Bocage 2013. 2013. Available online: https://www.youtube.com/watch?v=Z5tRO0ldcrY (accessed on 15 July 2023). (In Portuguese).
- Gu, Z.; Liu, Z.; Shiwakoti, N.; Yang, M. Video-based analysis of school students’ emergency evacuation behavior in earthquakes. Int. J. Disaster Risk Reduct. 2016, 18, 1–11. [Google Scholar] [CrossRef]
- David, N.; Fachada, N.; Rosa, A.C. Verifying and Validating Simulations. In Simulating Social Complexity. Understanding Complex Systems, 1st ed.; Edmonds, B., Meyer, R., Eds.; Springer Nature: Cham, Switzerland, 2017; pp. 173–204. [Google Scholar] [CrossRef]
- Edmonds, B.; Meyer, R. Simulating Social Complexity; Springer Nature: Cham, Switzerland, 2017; p. 409. [Google Scholar] [CrossRef]
- Axelrod, R. The Evolution of Cooperation; Basic Books: New York, NY, USA, 1984; ISBN 978-0-465-02121-5. Available online: http://bert.stuy.edu/pbrooks/spring2015/materials/HumanReasoning-2/Axelrod_Robert_The_Evolution_of_Cooperation.pdf (accessed on 15 July 2023).
- Antelmi, A.; Cordasco, G.; D’Ambrosio, G.; De Vinco, D.; Spagnuolo, C. Experimenting with Agent-Based Model Simulation Tools. Appl. Sci. 2022, 13, 13. [Google Scholar] [CrossRef]
- Filomena, G.; Verstegen, J.A. Modelling the effect of landmarks on pedestrian dynamics in urban environments. Comput. Environ. Urban Syst. 2021, 86, 101573. [Google Scholar] [CrossRef]
- Jumadi; Heppenstall, A.; Malleson, N.; Carver, S.; Quincey, D.; Manville, V. Modelling Individual Evacuation Decisions during Natural Disasters: A Case Study of Volcanic Crisis in Merapi. Indonesia. Geosciences. 2018, 8, 196. [Google Scholar] [CrossRef]
- Goto, Y.; Affan, M.; Agussabti; Nurdin, Y.; Yuliana, D.K.; Ardiansyah. Tsunami evacuation simulation for disaster education and city planning. J. Disaster Res. 2012, 7, 92–101. [Google Scholar] [CrossRef]
- Mls, K.; Kořínek, M.; Štekerová, K.; Tučník, P.; Bureš, V.; Čech, P.; Husáková, M.; Mikulecký, P.; Nacházel, P.; Ponce, D.; et al. Agent-based models of human response to natural hazards: Systematic review of tsunami evacuation. Nat. Hazards 2023, 115, 1887–1908. [Google Scholar] [CrossRef] [PubMed]
- Mas, E.; Koshimura, S.; Imamura, F.; Suppasri, A.; Muhari, A.; Adriano, B. Recent Advances in Agent-Based Tsunami Evacuation Simulations: Case Studies in Indonesia, Thailand. Japan and Peru. Pure Appl. Geophys. 2015, 172, 3409–3424. [Google Scholar] [CrossRef]
- Wang, Z.; Jia, G. Simulation-Based and Risk-Informed Assessment of the Effectiveness of Tsunami Evacuation Routes Using Agent-Based Modeling: A Case Study of Seaside. Oregon. Int. J. Disaster Risk Sci. 2022, 13, 66–86. [Google Scholar] [CrossRef]
- ANPC. Estudo do Risco Sísmico e de Tsunami do Algarve. 2010; 85p. Available online: https://prociv.gov.pt/pt/home/ (accessed on 15 July 2023). (In Portuguese)
- INE. Preliminary Census Data of the Resident Population in Setubal in 2020 and 2021. 2022. Available online: https://www.ine.pt (accessed on 15 July 2023). (In Portuguese).
- Cândido, E. Modelação Baseada em Agentes da Evacuação da Praia da Figueirinha. Master’s Thesis, Iscte—Instituto Universitário de Lisboa, Lisboa, Portugal, 2022. Available online: http://hdl.handle.net/10071/27712 (accessed on 15 July 2023).
- Kazil, J.; Masad, D.; Crooks, A. Utilizing Python for Agent-Based Modeling: The Mesa Framework. In Social, Cultural, and Behavioral Modeling, Proceedings of the 13th International Conference, SBP-BRiMS 2020, Washington, DC, USA, 18–21 October 2020; Thomson, R., Bisgin, H., Dancy, C., Hyder, A., Hussain, M., Eds.; Lecture Notes in Computer Science; Springer: Cham, Switzerland, 2020; Volume 12268. [Google Scholar] [CrossRef]
- Wang, B.; Hess, V.; Crooks, A. Mesa-Geo: A GIS Extension for the Mesa Agent Based Modeling Framework in Python. In Proceedings of the 5th ACM SIGSPATIAL International Workshop on GeoSpatial Simulation, Seattle, WA, USA, 1 November 2022. [Google Scholar] [CrossRef]
- Stern, R. Multi-Agent Path Finding—An Overview. In Artificial Intelligence; Osipov, G., Panov, A., Yakovlev, K., Eds.; Springer Nature: Cham, Switzerland, 2019; Volume 11866, pp. 96–115. [Google Scholar] [CrossRef]
- Sohn, S.S.; DeStefani, S.; Kapadia, M. Dynamic cognitive maps for agent landmark navigation in unseen environments. In Proceedings of the 11th ACM SIGGRAPH Conference on Motion Interaction and Games, Limassol, Cyprus, 8–10 November 2018. [Google Scholar] [CrossRef]
- Yesiltepe, D.; Conroy Dalton, R.; Ozbil Torun, A. Landmarks in wayfinding: A review of the existing literature. Cogn. Process. 2021, 22, 369–410. [Google Scholar] [CrossRef]
- Röser, F.A. Cognitive Observer-Based Landmark-Preference Model. KI-Künstliche Intell. 2017, 31, 169–171. [Google Scholar] [CrossRef]
- Schimpl, M.; Moore, C.; Lederer, C.; Neuhaus, A.; Sambrook, J.; Danesh, J.; Ouwehand, W.; Daumer, M. Association between walking speed and age in healthy. free-living individuals using mobile accelerometry—A cross-sectional study. PLoS ONE 2011, 6, e23299. [Google Scholar] [CrossRef]
- Silva, A.M.; da Silva, J.P.; da Cunha, J.R. Estimation of pedestrian walking speeds on footways. In Proceedings of the Institution of Civil Engineers-Municipal Engineer; Thomas Telford Ltd.: London, UK, 2014; Volume 167, pp. 32–43. [Google Scholar] [CrossRef]
- Nazir, M.; Razi, K.; Hossain, Q.; Adhikary, S. Pedestrian Flow Characteristics at Walkways in Rajshahi Metropolitan City of Bangladesh. In Proceedings of the 2nd International Conference on Civil Engineering for Sustainable Development (ICCESD-2014), KUET, Khulna, Bangladesh, 14–16 February 2014; ISBN 978-984-33-6373-2 (CD-ROM). Available online: https://www.researchgate.net/publication/321759346_Pedestrian_Flow_Characteristics_at_Walkways_in_Rajshahi_Metropolitan_City_of_Bangladesh (accessed on 15 July 2023).
- Leicht, A.; Crowther, R. Pedometer Accuracy during Walking over Different Surfaces. Med. Sci. Sports Exerc. 2007, 39, 1847–1850. [Google Scholar] [CrossRef]
- Aghabayk, K.; Parishad, N.; Shiwakoti, N. Investigation on the impact of walkways slope and pedestrians physical characteristics on pedestrians normal walking and jogging speeds. Saf. Sci. 2021, 133, 105012. [Google Scholar] [CrossRef]
- Yu, J.; Petnga, L. Space-based Collision Avoidance Framework for Autonomous Vehicles. Procedia Comput. Sci. 2018, 140, 37–45. [Google Scholar] [CrossRef]
- Foudil, C.; Djedi, N.; Sanza, C.; Duthen, Y. Path Finding and Collision Avoidance in Crowd Simulation. J. Comput. Inf. Technol. 2009, 3, 217–228. [Google Scholar] [CrossRef][Green Version]
- Fraser, S.A.; Wood, N.J.; Johnston, D.M.; Leonard, G.S.; Greening, P.D.; Rossetto, T. Variable population exposure and distributed travel speeds in least-cost tsunami evacuation modelling. Nat. Hazards Earth Syst. Sci. 2014, 14, 2975–2991. [Google Scholar] [CrossRef]
- Kohns, J.; Stempniewski, L.; Stark, A. Fragility Functions for Reinforced Concrete Structures Based on Multiscale Approach for Earthquake Damage Criteria. Buildings 2022, 12, 1253. [Google Scholar] [CrossRef]
- Koshimura, S.; Oie, T.; Yanagisawa, H.; Imamura, F. Developing Fragility Functions for Tsunami Damage Estimation Using Numerical Model and Post-tsunami Data from Banda Aceh Indonesia. Coast. Eng, J. 2009, 51, 243–273. [Google Scholar] [CrossRef]
- Mizutani, A.; Yomogida, K.; Tanioka, Y. Early tsunami detection with near-fault ocean-bottom pressure gauge records based on the comparison with seismic data. J. Geophys. Res Ocean. 2020, 125, e2020JC016275. [Google Scholar] [CrossRef]
- Wang, Y.; Tsushima, H.; Satake, K.; Navarrete, P. Review on recent progress in near-field tsunami forecasting using offshore tsunami measurements: Source inversion and data assimilation. Pure Appl. Geophys. 2021, 178, 5109–5128. [Google Scholar] [CrossRef]


Disclaimer/Publisher’s Note: The statements, opinions and data contained in all publications are solely those of the individual author(s) and contributor(s) and not of MDPI and/or the editor(s). MDPI and/or the editor(s) disclaim responsibility for any injury to people or property resulting from any ideas, methods, instructions or products referred to in the content. |
© 2023 by the authors. Licensee MDPI, Basel, Switzerland. This article is an open access article distributed under the terms and conditions of the Creative Commons Attribution (CC BY) license (https://creativecommons.org/licenses/by/4.0/).