Article

Geocryological Structure of a Giant Spring Aufeis Glade at the Anmangynda River (Northeastern Russia)

by
Vladimir Olenchenko
1,
Anastasiia Zemlianskova
2,3,
Olga Makarieva
2,3,* and
Vladimir Potapov
1
1
Trofimuk Institute of Petroleum Geology and Geophysics of Siberian Branch Russian Academy of Sciences, 630090 Novosibirsk, Russia
2
Laboratory of Monitoring and Forecasting Climate Change and the Environment, North-Eastern State University, 685000 Magadan, Russia
3
Earth Science Institute, St. Petersburg State University, 199034 St. Petersburg, Russia
*
Author to whom correspondence should be addressed.
Geosciences 2023, 13(11), 328; https://doi.org/10.3390/geosciences13110328
Submission received: 4 August 2023 / Revised: 17 October 2023 / Accepted: 23 October 2023 / Published: 26 October 2023
(This article belongs to the Special Issue Mass Transfer and Phase Transformations in Permafrost)

Abstract

:
Gigantic aufeis fields serve as indicators of water exchange processes within the permafrost zone and are important in assessing the state of the cryosphere in a changing climate. The Anmangynda aufeis, located in the upstream of the Kolyma River basin, is present in the mountainous regions of Northeast Eurasia. Recent decades have witnessed significant changes in aufeis formation patterns, necessitating a comprehensive understanding of cryospheric processes. The objective of the study, conducted in 2021–2022, was to examine the structure of the Anmangynda aufeis and its glade, aiming to understand its genesis and formation processes. The tasks included identifying above- and intra-frozen taliks, mapping groundwater (GW) discharge channels, determining permafrost base depth, and assessing ice thickness distribution. Soundings using ground-penetrating radar (GPR), capacitively coupled electrical resistivity tomography (CCERT), and the transient electromagnetic (TEM) method were employed. GW discharge channels originating from alluvial deposits and extending to the aufeis surface within river channels were identified through GPR and verified through drilling. Deep-seated sources of GW within the bedrock were inferred. CCERT data allowed us to identify large and localized frozen river taliks, from which water is forced onto the ice surface. According to the TEM data, the places of GW outlets spatially coincide with the zones interpreted as faults.

Graphical Abstract

1. Introduction

The formation of spring aufeis is a characteristic feature of water exchange processes in the permafrost zone of Arctic, subarctic, and mountainous regions of the Northern Hemisphere [1,2,3,4,5]. The most pronounced processes of aufeis formation occur in Northeast Eurasia, where aufeis fields can reach sizes of tens of square kilometers. The dynamics of giant aufeis, easily identifiable in satellite images, can be used as an indicator of the transformation processes of inaccessible permafrost territories in the modern climate. The transformation of permafrost–hydrogeological structures and a reduction in the flow of springs or their disappearance can be the cause of the extinction of icing processes up to their complete cessation. A decrease in aufeis resources in the region may also occur as a result of the transition of aufeis-forming waters coming to the surface to the category of transit, i.e., filtering through the alluvial sediments. However, the response of aufeis to climatic factors largely depends on their genesis [6]. In study [7], it is argued that the degradation of permafrost, especially in the zone of their discontinuous and sporadic distribution, will lead to a reduction in the number of aufeis and their almost complete disappearance. At the same time, in the continuous permafrost zone, climate warming of 2–3 °C, predicted for Northeast Siberia at the end of the 21st century, will not lead to a fundamental change in the regime of permafrost, but will increase the volume of open and closed taliks. This can cause large aufeis to disperse and new small aufeis to form [8]. As recent studies have shown, the general trend of increasing air temperature and liquid precipitation in Arctic regions has contributed to the increase in the number of aufeis in Northeast Russia, the reduction in their maximum sizes before the onset of ablation, and the migration of individual aufeis fields [9].
The issue of aufeis genesis was raised as early as the 1930s and still remains unresolved. According to the theories proposed by Zonov (1944) [10], aufeis are formed as a result of the freezing of river and floodplain taliks, in which suprapermafrost GW accumulates during the warm period. On the other hand, Shvetsov (1951) [11] suggests that the source of water forming giant aufeis is the subpermafrost waters of fractured tectonic faults. Despite the fact that the classification of giant aufeis according to genesis and formation mechanism was developed in the last century [6,12,13,14,15], there is very little actual data from geophysical studies (electrical prospecting, seismic, exploration drilling) confirming these theories.
In recent years, there has been significant development in geophysical technologies for studying the geological environment. The use of new equipment based on modern components and software for data processing and solving inverse problems in geophysics has substantially increased the informativeness of geophysical studies. These advancements have demonstrated high efficiency in studying aufeis, employing methods such as ground-penetrating radar (GPR), electrical resistivity tomography (ERT) with galvanic and capacitive grounding, nuclear magnetic resonance (NMR), and thermal imaging [16,17]. GPR is used to determine ice thickness and the depth of seasonal freezing. ERT data can help to distinguish between the frozen or thawed state of bedrock beneath the reflective boundaries observed in radar images [16]. The application of NMR allows for the estimation of gravitational water content in the pore space and the identification of thawed and frozen rock layers beneath the ice [17].
Giant aufeis at the Anmangynda river (upper reaches of the Kolyma River basin), which reached an area from 3.5 to 6.8 km2 in the period from 1962 to 2021, is unique in the presence of a long-term series (1962–1990) of observational data on icing processes [18]. It is considered to be representative for spring aufeis of the northeast of Russia [19]. The main objective of this geophysical research was to investigate the structure of the Anmangynda aufeis and its glade in order to refine its genesis and formation processes. The primary tasks involved identifying suprapermafrost and isolated taliks, mapping GW drainage channels, determining the depth of permafrost base, and assessing the thickness distribution of the aufeis. To solve the given tasks, ground-penetrating radar (GPR) and capacitively coupled electrical resistance tomography (CCERT) methods were applied. Additionally, soundings using the transient electromagnetic (TEM) method were carried out to detect the location of subpermafrost GW spring, which presumably may feed the Anmangynda aufeis [20], and to determine the geoelectric structure of the aufeis glade and its immediate surroundings to depths of 300 m.

2. Study Area

The Anmangynda aufeis field is located in the Magadan region (Figure 1), within the basin of the Anmangynda River, which is a right tributary of the Detrin River, ultimately flowing into the Kolyma River. The average annual air temperature in the research area, based on data from the Ust-Omchug meteorological station, is approximately −11 °C (1967–2021). The annual precipitation at the same station is about 340 mm. The maximum snow cover height, according to data from the Ust-Omchug meteorological station (2000–2021), varies from 27 to 75 cm, with an average of 43 cm. The highest recorded snow height in the Anmangynda aufeis field during 2021–2022 was 59 cm.
The basin of the Anmangynda River, downstream of the aufeis field, covers an area of 376 km2 with an elevation ranging from 700 to 1850 m a.s.l. The vegetation in the area consists primarily of larch forests with a moss and lichen understory. There are also patches of cedar groves and open tundra, while the upper reaches exhibit a dwarf shrub tundra landscape. The valley bottom of the Anmangynda River is composed of alluvium and, in areas where the aufeis field persists for extended periods, small hummocky landforms. Dense willow thickets, dwarf birch, bilberry, and crowberry can be found in these areas.
According to our year-round field observations in 2020–2023, the Anmangynda River does not freeze in some sections and flows year-round. In the winter period (December–March) of 2021–2022, the average flow rate was 0.5 m3/s at a location 200 m upstream of the aufeis field and 0.1 m3/s in the central part of the aufeis field. The average annual water discharge of the Anmangynda River downstream of the aufeis field was 3.7 m3/s (1962–1987) [21]. The annual water discharge volume averaged 314 mm, with the contribution of aufeis melt accounting for approximately 23 mm, equivalent to 5–10% of the total (1963–1979) [18].
In geological terms, the research area is composed of Permian and Triassic deposits, with the river valleys consisting of Quaternary alluvium [22]. The Permian deposits are represented by the Neryuchinskaya and Kulinskaya formations. The Neryuchinskaya formation primarily consists of clayey shales. The overlying Kulinskaya formation is characterized by the significant presence of aleurolites, sandstones, fine-grained conglomerates, and tuffaceous shales.
The research area is characterized by the presence of continuous permafrost, with thickness reaching up to 300 m at mountain slopes and decreasing to 80–100 m in river valleys. The mean annual ground temperature in the mid-20th century in the layer of zero annual temperature fluctuations ranged from −1.7 to −3.5 °C [22]. The folded structures of the study area are complicated by numerous tectonic faults of sublatitudinal and northwest orientation, with thickness ranging from a few meters to 35 m or more. These faults typically exhibit steep dips of 70–90 degrees.
The GW in the area can be classified into two types: subpermafrost and suprapermafrost. Suprapermafrost waters are associated with thaw zones in river valleys and form sub-riverbed flow within loose alluvial deposits and fractured zones in bedrock. Below permafrost in the fracture zone, subpermafrost fissure and fissure-vein waters are common. Subpermafrost waters come to the surface in the form of permanent springs through open taliks in fault zones and the valleys of large rivers. They are fed by surface waters and the infiltration of precipitation and are discharged mainly at the intersections of river valleys with tectonic faults [23]. According to commonly accepted views, when sub-riverbed flows freeze, the GW emerges to the surface above the freezing point and forms aufeis [1,19].
The aufeis glade, with an area of 7.6 km2 (2% of the Anmangynda River basin area), has formed in the valley of the Anmangynda River as a result of the annual accumulation of ice. It consists of two rounded ice fields connected by a small saddle.
The average thickness of the aufeis field at the period of its maximum development in 1962–1990 ranged from 1.1 to 1.8 m, with an average value of 1.5 m. The maximum thickness reported from field observations was 5.9 m [18]. Analysis of historical observations indicates a tendency of decreasing maximum aufeis field sizes from 1962 to 1990 [24]. A recent assessment based on remote sensing data also confirms a significant reduction in the maximum size of the Anmangynda aufeis field and changes in the seasonal ice formation regime. As such, in the historical period (1963–1990), the aufeis maximum pre-ablation area ranged from 4.3 to 6.8 km2, with a volume of 5.3 to 11.7 million m3. In 2000–2022, these figures decreased to 3.5–5.4 km2 and 5.0–8.2 million m3, respectively [25].

3. Materials and Methods

In March–April 2021, areal GPR surveys were conducted at the aufeis glade using a network of 30 transverse profiles located about 200 m apart and one longitudinal profile, to study the distribution of ice thickness, determine the total volume of aufeis and search for the sources (springs) feeding the aufeis (Figure 1a). In addition, GPR surveys were carried out at 6 profiles located about 50 m apart at the upper part of the aufeis field (Figure 1a). As a result, anomalous areas (the hyperbolas of intense diffraction at the GPR sections) pointing to potential sites for discharging springs feeding the aufeis were discovered (designation 7 in Figure 1a). In spring 2021 TEM soundings were also carried out (Figure 1b) aiming to detect the location of GW outlet, which presumably feeds the Anmangynda aufeis, and to determine the geoelectric structure of the aufeis glade and its immediate surroundings to depths of 200–300 m.
In spring 2022, the GPR method was applied again at two key sites selected based on the data from the previous year. Profile surveys and detailed ground investigations using GPR and CCERT methods were carried out at the identified anomalous areas (Figure 1c). Key Site #1 (study area size 70 × 50 m) was chosen at the location of the frost mound to study the structure of the water drainage channel around it (Figure 1c,d). Areal GPR surveys were conducted at a network of profiles spaced 5 m apart, and up to 2.5 m at the frost mound. The depth of the reflecting boundary from the bottom of the seasonal freeze layer (SFL, Hsfl) was determined at each profile, and a contour map of Hsfl was developed based on the survey results (see later figures). A CCERT profile was conducted along a 270 m distance across the frost mound using dipole–dipole sounding with an axial array. Key Site #2 (study area size 50 × 20 m) is located in the main river channel (Figure 1c,d). Within this area, GPR surveys and multi-space CCERT profiling with a 5 m step along 11 profiles spaced 2 m apart were conducted to study the specific features of the alluvium seasonal freezing.

3.1. GPR Surveys

GPR surveys were conducted using the OKO-3 radar with a 250 MHz antenna [26]. The radar was moved along the ice surface or in a plastic box when there was a layer of water on the ice. The profiling step was 0.05 m. Data processing was performed using the Geoscan32 ver. 2021.09.30.688 software [27]. The processing graph included subtraction of the mean and adjustment of the gain by depth. Conversion of the time section to depth was carried out for the average values of the freshwater ice dielectric permittivity (DP), equal to 3.2, which corresponds to a radar velocity of 0.3 m/ns [28]. The value of DP was determined using the tools of the Geoscan32 program based on hyperbolas of diffraction of the reflected wave from local objects. In 2021, the snow height in the forested areas of the aufeis glade reached a maximum of 30 cm, while at the aufeis itself, the snow was practically absent. The data on snow depth were not used during the interpretation of the GPR sections since the height of the snow cover was included in the first phase of the probing signal. To verify the GPR survey, boreholes were manually drilled along the profiles to determine the actual thickness of the ice. The error was less than 5%.

3.2. Capacitively Coupled Electrical Resistivity Tomography (CCERT)

Measurements using the CCERT method were conducted in modifications of sounding with an axial dipole–dipole array and multispacing electric profiling. Measurements were carried out using VEGA equipment [29,30] operating at a frequency of 16 kHz. The size of the capacitive lines was 5 m for electrical profiling and 10 m for dipole axial sounding. The distance between the centers of the generator and receiver lines during multispacing profiling was 5, 15, 25, and 35 m for dipole sizes of 5 m. For axial sounding, AB and MN dipoles with a size of 10 m were used, with the distance between their centers increasing from 5 to 80 m with a step of 5 m. The current strength in the power line was 3 or 10 mA. The voltage in the receiver lines varied from 4 V to 0.12 mV depending on the spacing. Two-dimensional automatic inversion of the data was performed using the Res2Dinvx64 ver. 4.08 program [31]. The Res3Dinvx64 ver. 3.14 program was used to obtain a 3D geoelectric model (Supplementary Materials).

3.3. Transient Electromagnetic (TEM) Method

In the period 29 March–20 April 2021, profile soundings were carried out using the TEM method along 9 profiles of various lengths; the total number of soundings was 98. The profiles crossed the aufeis field and the riverbed upstream and downstream of the aufeis field. Soundings were also conducted at profile #9 along the stream bed within the aufeis field. The layout of the profiles is shown in Figure 1c. Profile #1 was located 8 km downstream from the place of aufeis formation (not shown in the figures). The transient responses were measured using the Fast-Snap electrical survey station [32]. The size of the transmission loop was 71 × 71 m. The receiver single-turn loop was 20 × 20 m in size with a spacing of 100 m from the center of the transmission loop. For high-quality measurements over the entire time range, the current in the transmission loop varied from 0.5 to 22 A. The generator was powered by three car batteries with a capacity of 75 Ah and a voltage of 12 V. The duration of the current pulse was 20 ms with pauses of 20 ms. Most of the TEM signals had a duration from 10 µs to 1 ms; however, there were a small number of curves with a duration of up to 4–5 ms, which is associated with a decrease resistivity in the geological section at these points. There were also curves in which the final time was only 300–400 µs; these curves were characteristic at the sounding locations with increased resistivity of rocks.

3.4. Thermometric and Hydrogeological Monitoring at the Aufeis Field

In August 2021, a thermometric borehole (13.1 m depth) and hydrogeological (8 m depth) well were drilled at the aufeis glade 500 m away from one of the main channels of the Anmangynda River at 744 m a.s.l. (Figure 1). The percussion drilling method without core sampling was applied. The vegetation of the aufeis glade at the location of the boreholes consisted of sparse blueberry, dwarf willow shrubs, and sporadic green moss cover. The alluvium comprised gravelly pebble deposits with a sandy–silty filler. The thermometric borehole was lined with plastic pipes with an internal diameter of 30 mm. Inside the plastic pipe, a 16 m length string of 38 sensors was installed at various intervals: 0.1 m in the range up to 0.5 m, 0.25 m from 0.5 to 1.5 m, and from 1.5 to 5 or 15 m with 0.5 m spacing and an additional sensor placed at a depth of 14.75 m. The measurements were conducted every 4 h using “Impedans” automatic loggers. The measurement accuracy was 0.1 °C in the temperature range from −3 °C to +3 °C, 0.2 °C in the ranges from −10 °C to −3 °C and from +3 °C to +10 °C, and 0.3°C in the temperature range from −40 °C to −10 °C and from +10 °C to +85°C [33]. As per historical data, the ice depth at this location could reach up to 2 m [34]; to isolate the borehole from water entering from above, the head was made 2.66 m high. Therefore, only 28 of 38 sensors were used to measure ground temperature, starting from a depth of 0.1 m. The hydrogeological well had been equipped with an iron pipe with an outer diameter of 169 mm. A Hobo sensor recording the water level and temperature (the measurement accuracy was 12 mbar and 0.44 °C) was installed at the depth of 5.5 m [35].

4. Results and Interpretation

4.1. Distribution of Ice Thickness and Aufeis Volume

Based on the results of the areal GPR survey, the ice thickness was determined along the GPR profiles, and a distribution diagram of the ice thickness was developed using linear interpolation. During the study period (25 March–5 April 2021), the maximum ice thickness at the upper aufeis reached 4.4 m with an average value of 1.4 m, while at the lower aufeis, it was 3.5 m with an average value of 1.3 m (Figure 2). It was observed that the thickest ice was formed locally, presumably in the areas where sources feeding the aufeis are discharged. According to the results of the GPR survey, the area and volume of the aufeis in early April 2021 was 3.7 km2 and 3.6 ± 0.2 million m3, while in 1963–1967, it reached 5.7 km2 and 8.8 million m3, respectively (1.5 and 2.4 times larger) [34].

4.2. Investigation of the Areas of the GW Springs Discharging under the Ice

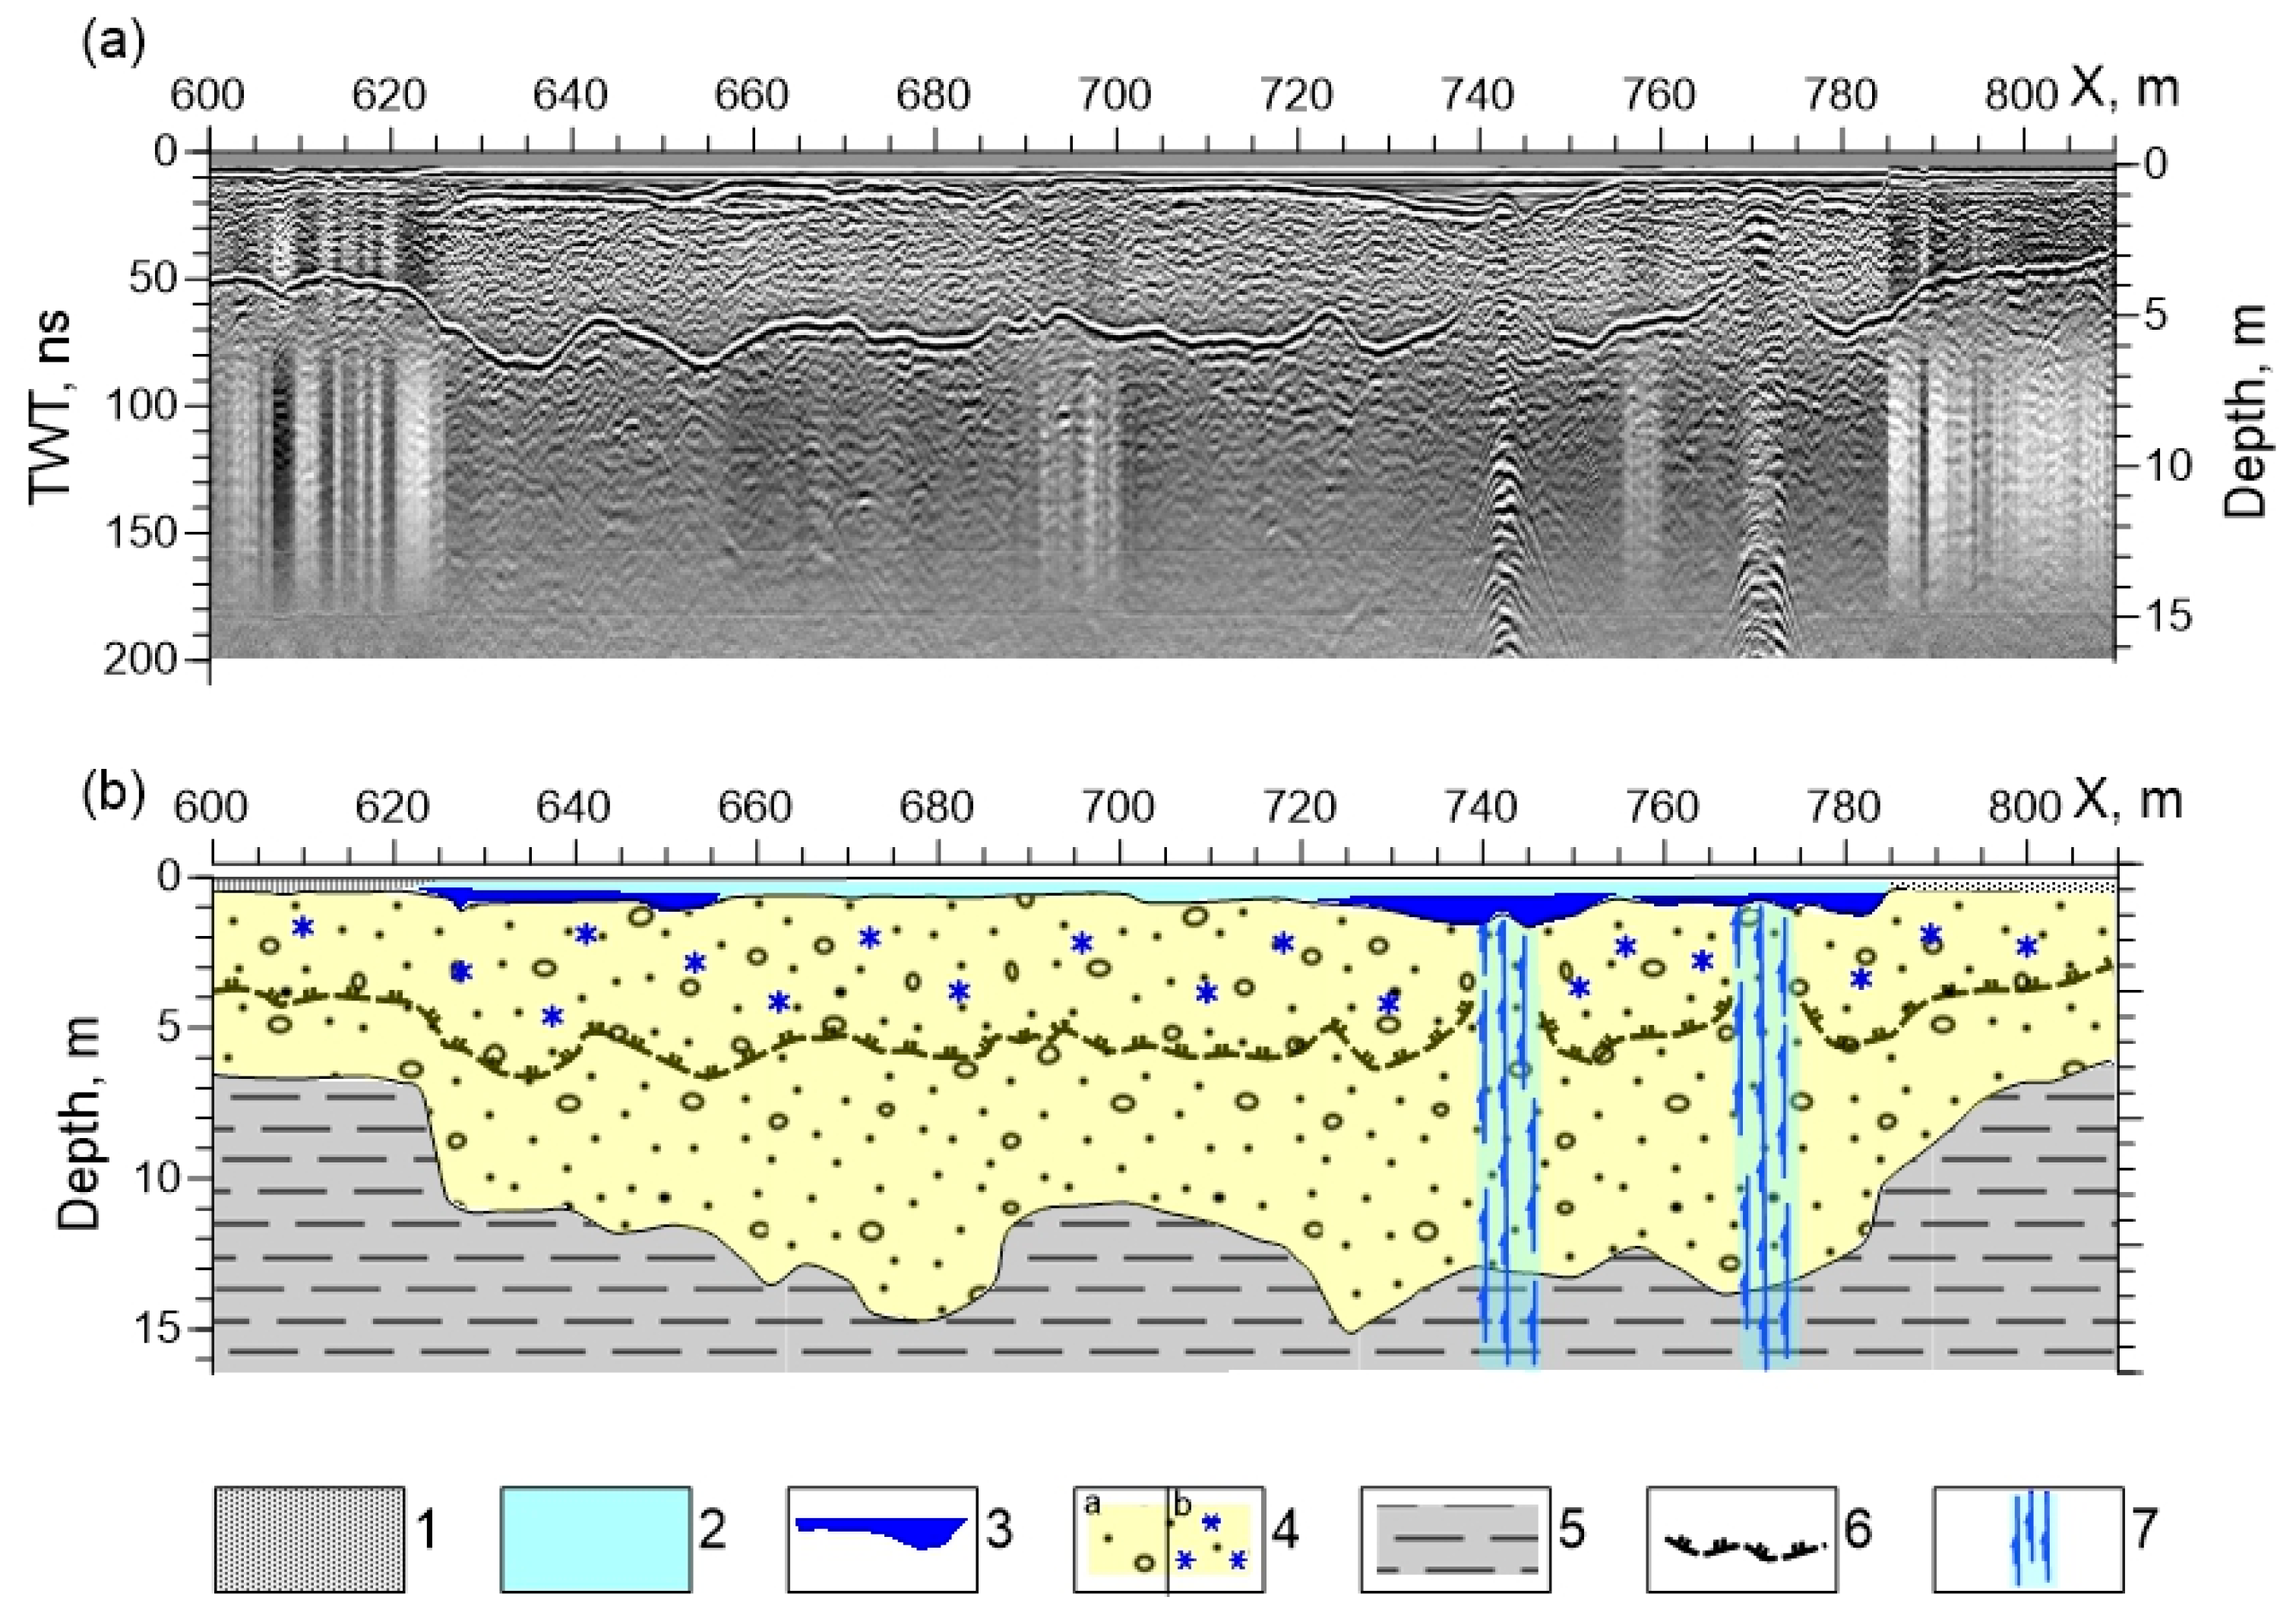
Analysis of the GPR sections from all the profiles in 2021 showed that in many amplitude profiles, in addition to the ice-rock and the seasonal freezing boundaries, large diffraction hyperbolas with very intense reflected waves are distinguished (Figure 3a). At the same time, at the point of hyperbola formation, a sharp reduction of seasonal freezing depth is noted (Figure 3), up to the disappearance of the reflecting boundary from the base of the seasonal frozen layer. Such hyperbolas are observed over river channel beds, presumably in the locations where GW is discharged into the channel. For example, vertical anomalies are clearly manifested in the GPR sections at the milestones of 743 and 770 m (Figure 3).
In 2022, a sounding survey was carried out again at profile #6 (see Figure 1c) along a 190 m section where intense diffraction hyperbolas were identified based on the results of the GPR survey in 2021. At the GPR section from 2022, a series of cracks and a frost mound between the 135–160 m milestones were noted in the form of intense signal reflections (Figure 4a), which are usually associated with the presence of water in the rocks. This means that there was liquid water inside the frost mound, and fresh cracks (visually observed) were formed as a result of water pressure.
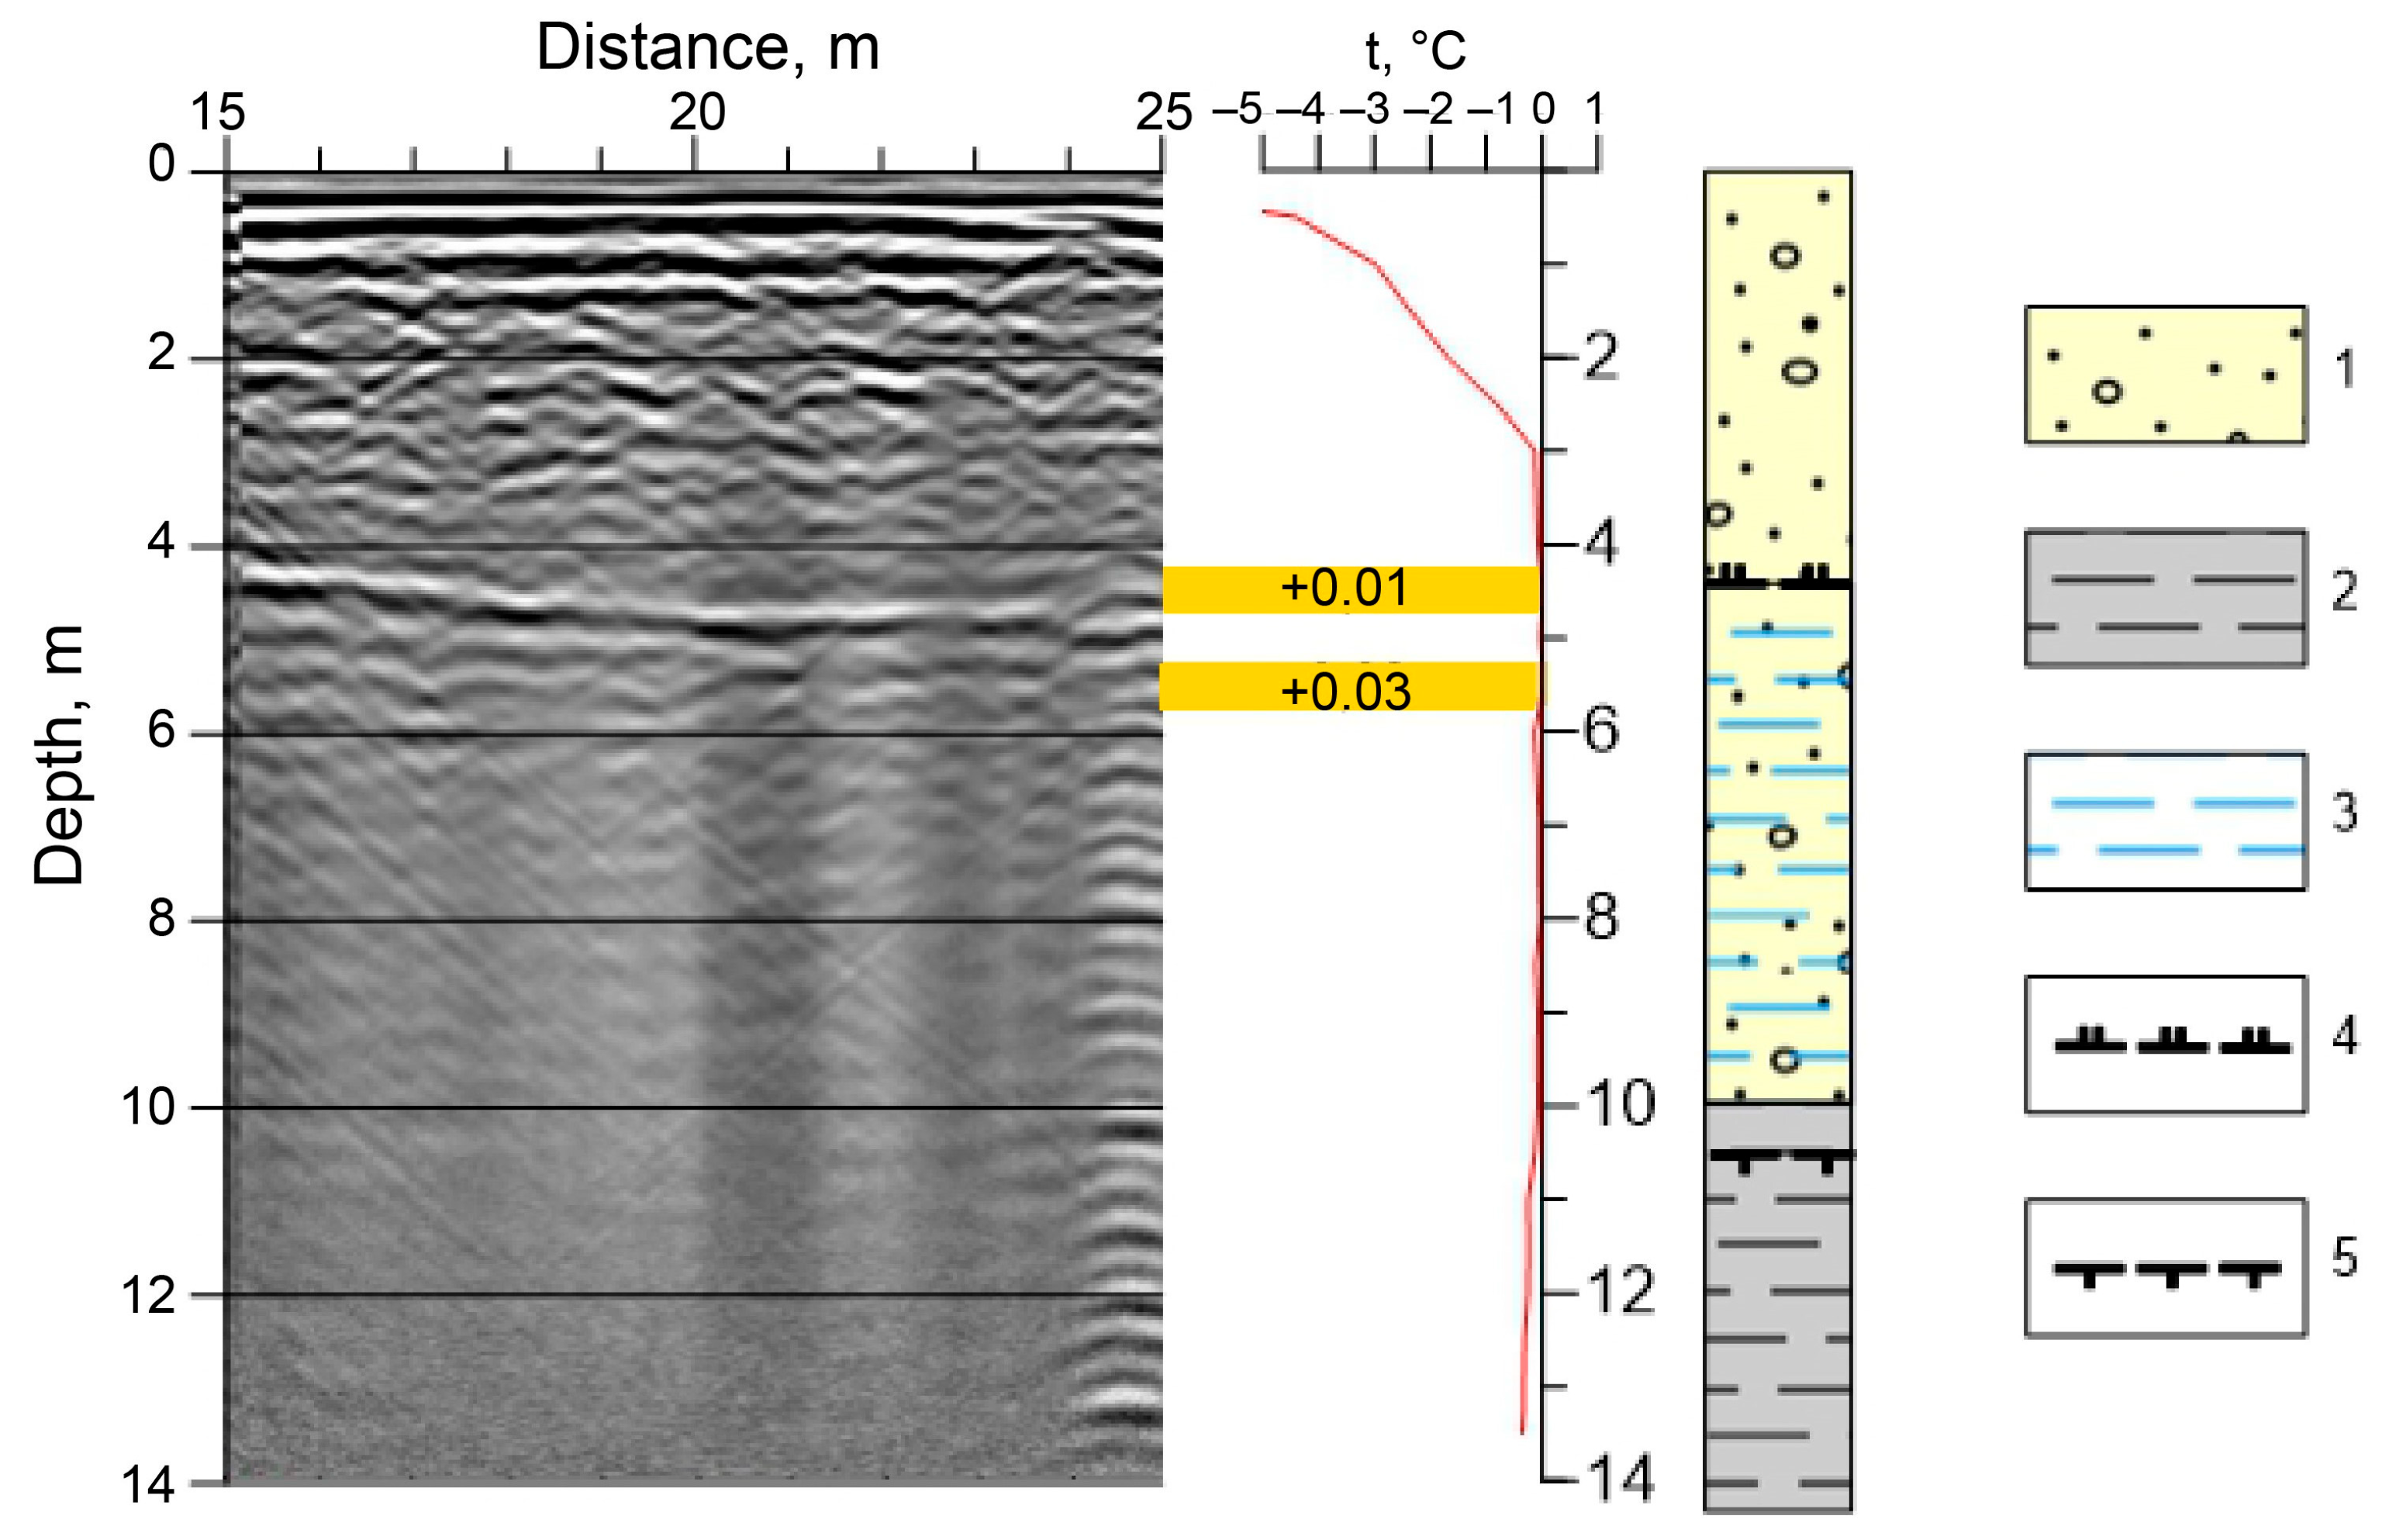
The position of the intense reflecting boundary, which we interpret as the base of the seasonal freezing layer (Figure 4a), coincides with the temperature transition through 0 °C according to the data of thermometric borehole located at the aufeis glade (Figure 5). In the interval 165–180 m along the transect, the reflecting boundary from the base of SFL disappears, which we explain as a confluent type of permafrost in this area.
At the same section of profile #6, electrical sounding surveys were conducted using the CCERT method with an axial dipole–dipole array. Two-dimensional inversion was performed to construct a geoelectric section at which reflecting radar boundaries are marked (Figure 4b). Ice and seasonally frozen alluvium are characterized by very high electrical resistivity (ER), reaching 800,000 Ohm·m. According to GPR data, the thickness of the ice was 2–3 m, and the depth of seasonal freezing of the alluvium was 2.8–3.8 m. At the geoelectric section between the milestones of 0 and 125 m, there is a decrease in the rocks’ ER to 500–1000 Ohm·m, with some local areas reaching 350–450 Ohm·m. It is assumed that such local areas of reduced ER correspond to channels of GW infiltration in the alluvium. In the northeastern end of the section, in the interval of milestones 125–180 m, the rock ER is predominantly high, more than 10,000 Ohm·m, which corresponds to a frozen state. At 140–155 m, under a frost mound at a depth of 6–10 m, a local anomaly of reduced ER is distinguished; it is interpreted as a freezing river talik. Analysis of the obtained data shows that the frost mound was formed as a result of water squeezing from the talik to the surface.
Between the milestones at 80 and 100 m, there are two intense diffraction hyperbolas that, according to the analysis of summer satellite imagery, correspond to the river channel. At this section, there is also a discontinuity of the reflecting boundary from the base of the SFL. All of the above features indicate an area of GW discharge from the alluvium under the ice (Figure 4c). Under the presumed discharge channel of GW at a depth of 12–18 m, a vertical area of low ER (Figure 4b) is identified, which may be associated with a water-bearing fault in the basement rocks. Similar vertical anomalies of low ER were identified in the profile intervals of 0–10 m, 25–35 m, 85–95 m, 115–125 m, 140–150 m, and 165–175 m. It is possible that, in addition to horizontal drainage in the alluvium, there is also upward infiltration through narrow zones of tectonic fracturing in the bedrock. It should be noted that the anomaly at the GPR section, interpreted as a drainage channel for subpermafrost waters, spatially coincides with the anomaly of low ER in the bedrock (Figure 4b). On 25 March 2022, a well (0.2 m in diameter) in the ice was drilled with a hand drill to verify the anomaly at the 90 m milestone. Confined aquifer waters were encountered at a depth of 2.4 m, while the top of the alluvial deposits was found at 3.0 m. A water column approximately 0.25 m high was observed to discharge for two days without a decrease in head. As such, the above interpretation of geophysical data was confirmed through field observations.

4.3. The Structure of GW Spring Discharging from the Frost Mound

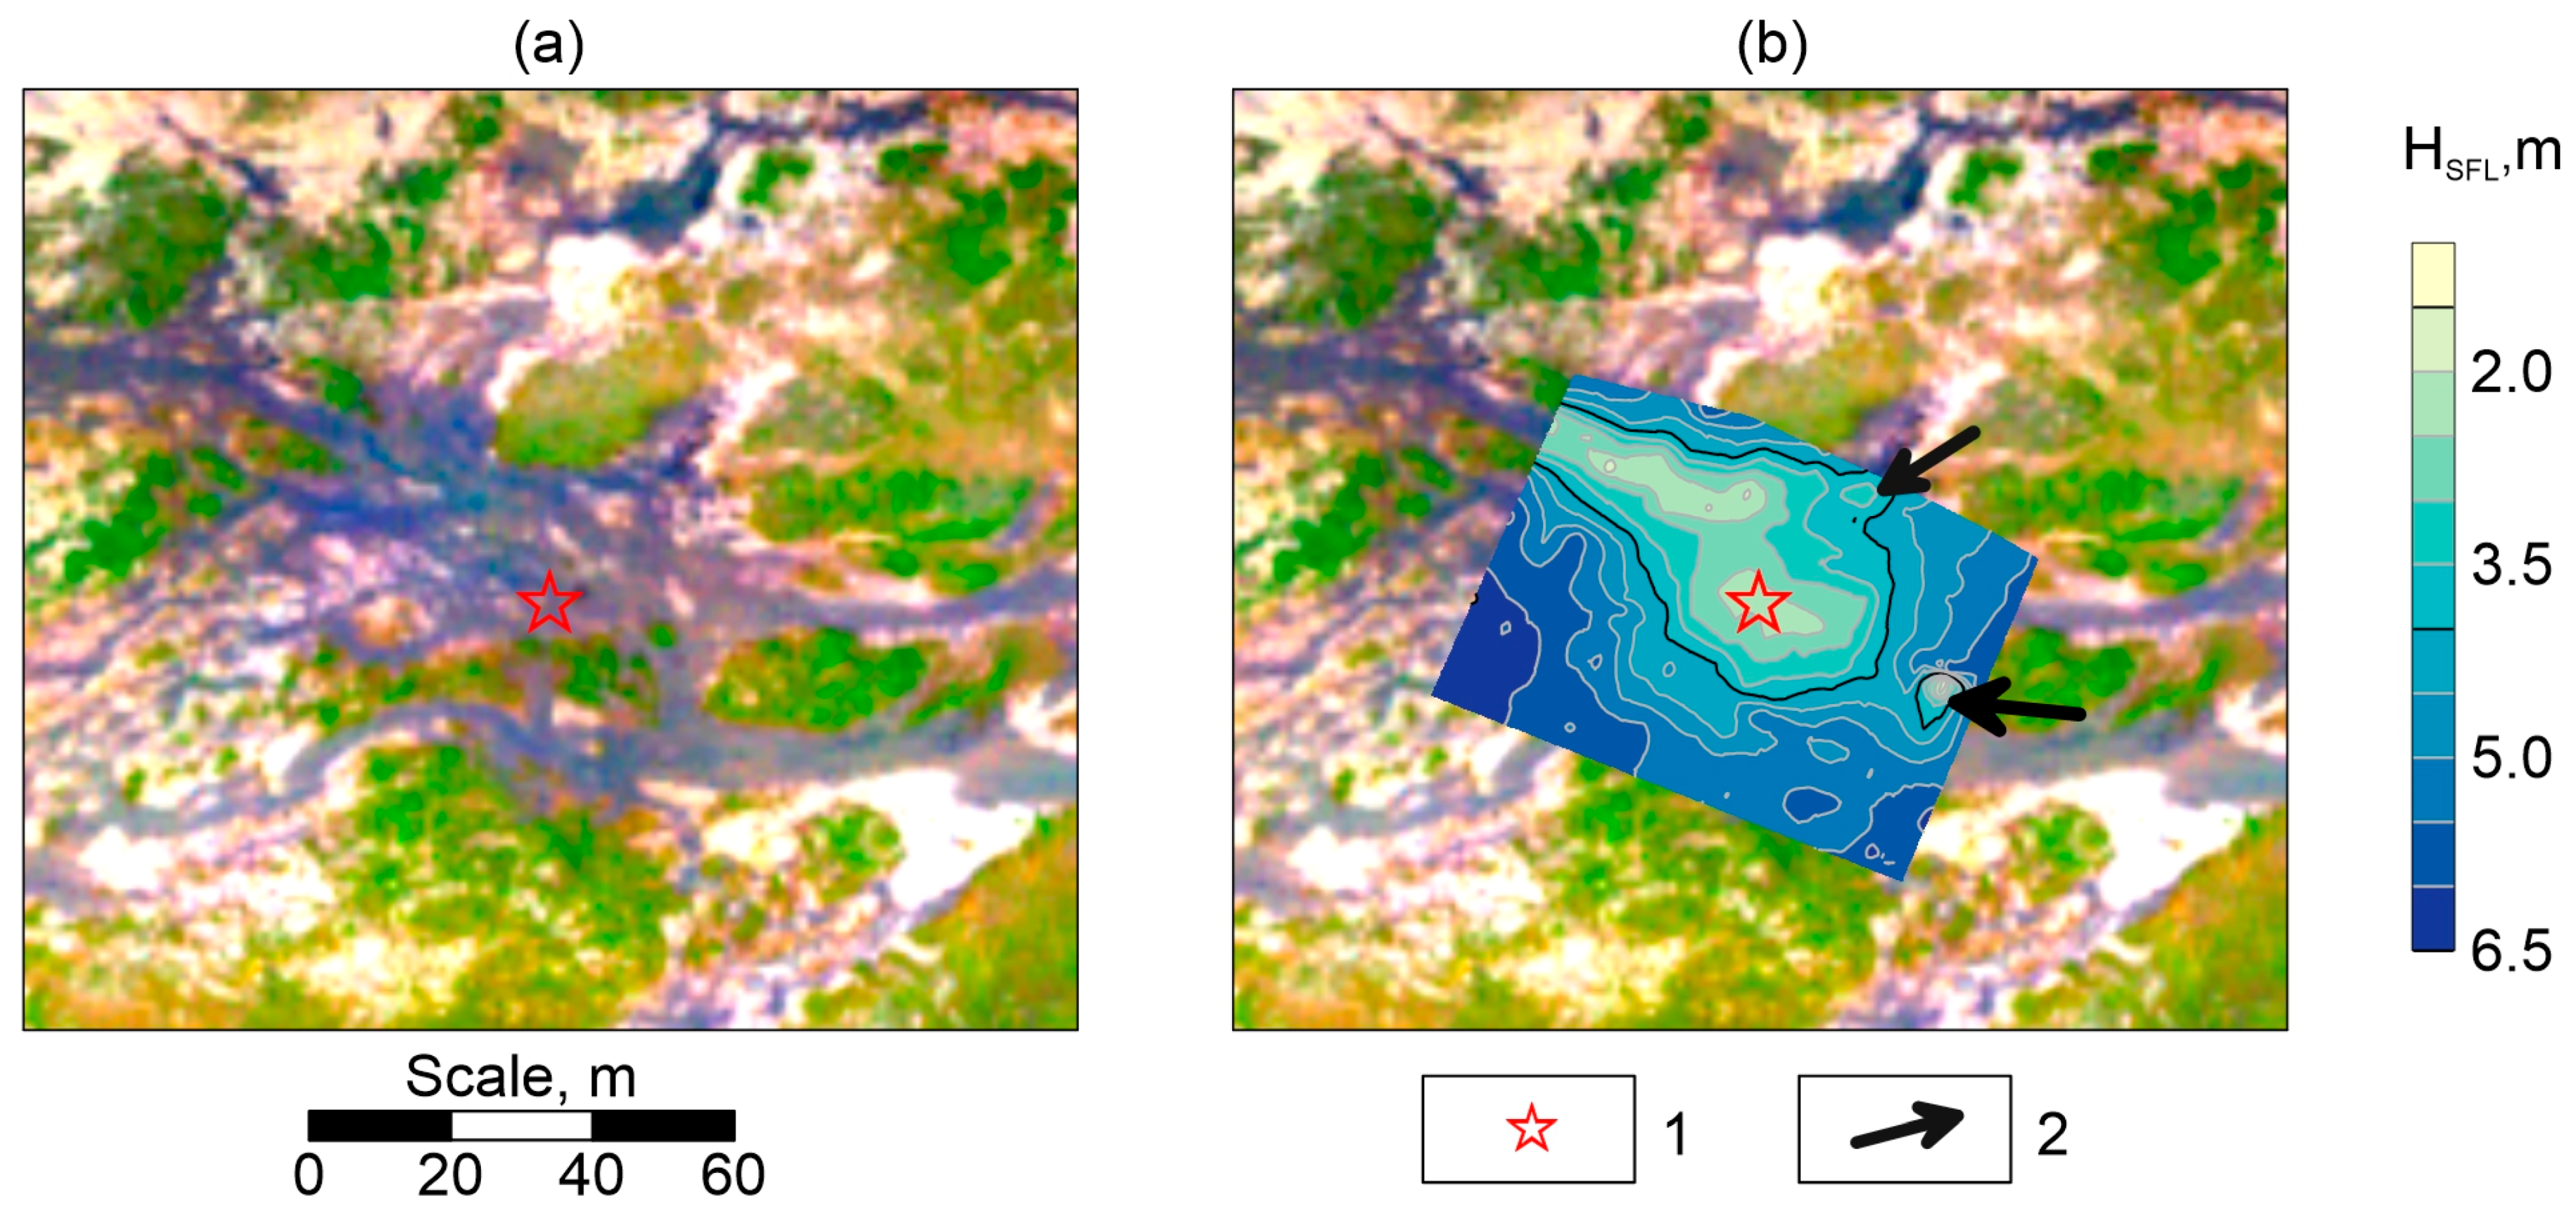
At the key site #1 (see Figure 1c) within the frost mound, according to GPR data, a significant reduction in the depth of seasonal freezing from 4.5 m to 0 m was established at the location of the spring discharging into aufeis (Figure 6b). The channel for the discharge of GW in the alluvium and water-saturated sand and gravel deposits are distinguished at the GPR section by the increased intensity of the reflected signal (Figure 7a).
A comparison of the orthophotomap and the map of SFL depth showed that the source of aufeis-feeding waters is located in one of the branching channels of the river (Figure 6a). There is a regular decrease in SFL depth under the channel in the form of a linear anomaly of low SFL values. At the same time, at the location of frost mound formation, an area of low values of the seasonal freezing depth of an oval shape 5 × 15 m in size is noted. This means that the discharge of GW, preventing seasonal freezing, occurs in a limited area, and probably through a vertical channel. In addition, local anomalies of shallower seasonal freezing were identified (Figure 6b). It is assumed that in these areas, there is also a discharge of GW in the form of springs, representing vertical ascending flows of water in the alluvium.
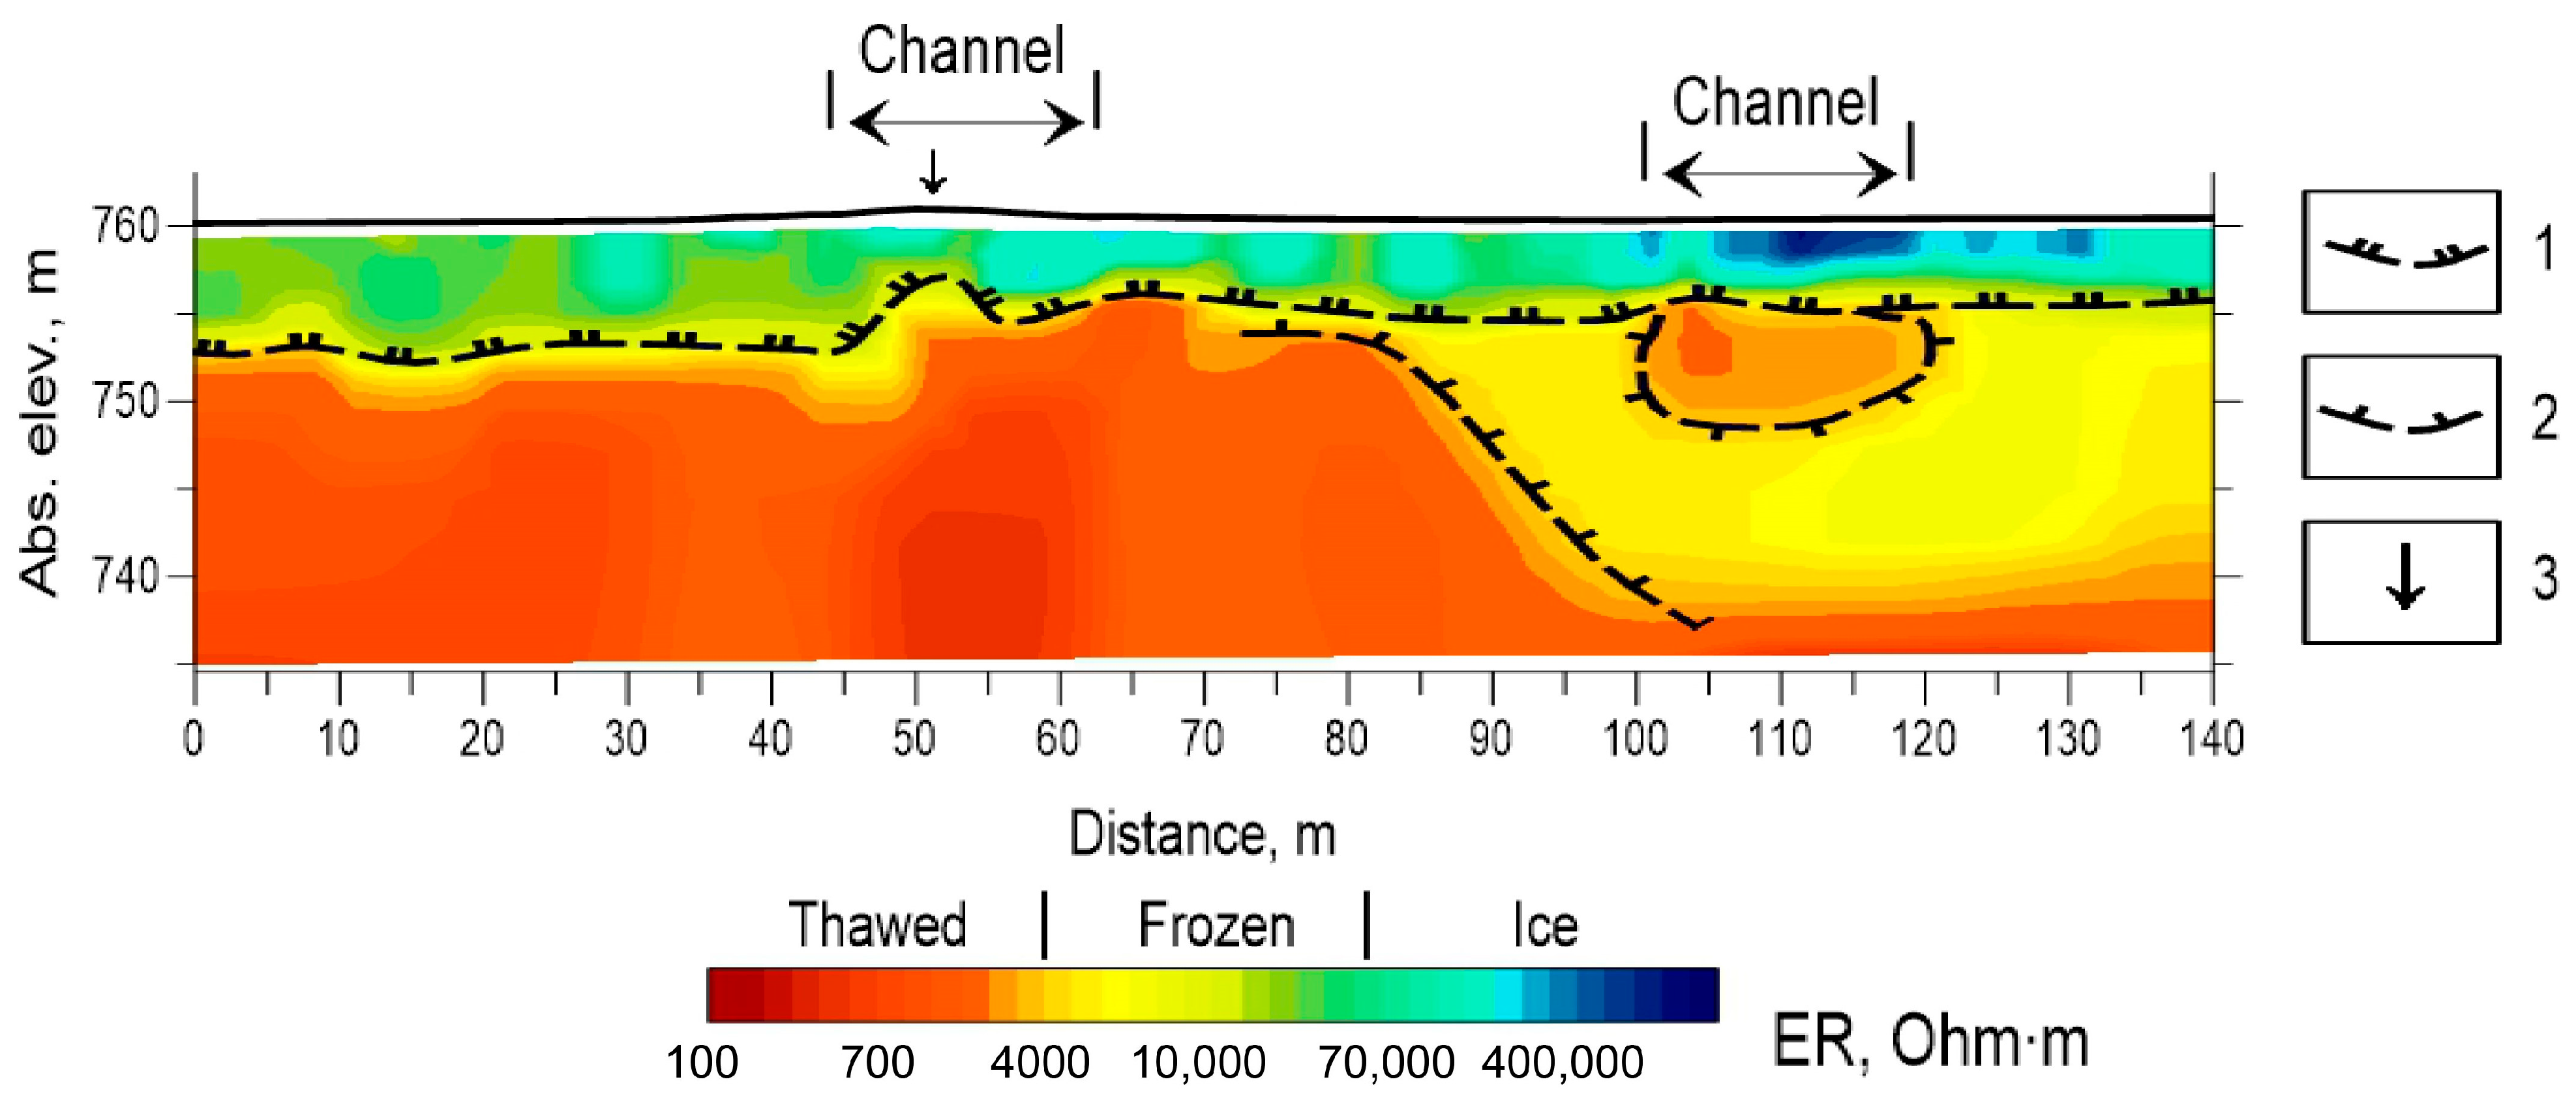
The CCERT results along the profile crossing the frost mound showed that the ice and the seasonally frozen alluvium have very high ER (Figure 8). Ice ER is about 300,000–600,000 Ohm·m. At the GW discharge site into aufeis at a depth of 6–7 m, ER of the alluvial deposits is about 1000 Ohm·m with local anomalies down to 500–700 Ohm·m, indicating the thawed state of the rocks. In the profile interval of 100–130 m under the channel, a local anomaly of low ER of the rocks is distinguished, it is interpreted as a freezing river talik. When this talik freezes, GW is squeezed out to the surface along a crack in the ice, which manifests itself in the upper part of the resistivity section in the form of a narrow vertical zone of reduced ER in the profile interval of 100–105 m (Figure 8).
A local subvertical low-ER zone 18 m wide is noted at the geoelectric section from a depth of 12 m under the site where GW comes out onto the ice (milestone 50 m). It is assumed that this anomaly is associated with a GW infiltration channel in the alluvium (Figure 8). Previously, we found that the channels of concentrated GW infiltration in flooded sandy deposits are distinguished by local low-resistance anomalies and, in a 3D geoelectric model, in the form of a “pipe” with low ER [36]. It is not possible to trace the connection of this anomaly with faults in the bedrock due to the limited depth of sounding. The comparison of the geoelectric section and the GPR section showed a satisfactory coincidence of the reflecting radar boundaries with the boundaries of rocks with different ER (Figure 7b). Moreover, an increase in the intensity of the reflected radar signal is observed above flooded taliks identified by ER. Formation of the frost mound (where GW is discharged onto the aufeis) is observed above an anomaly of low ER, interpreted as a channel for the infiltration of GW.

4.4. Seasonal Freezing along the River Channel and the Formation of Water Lenses inside the Ice

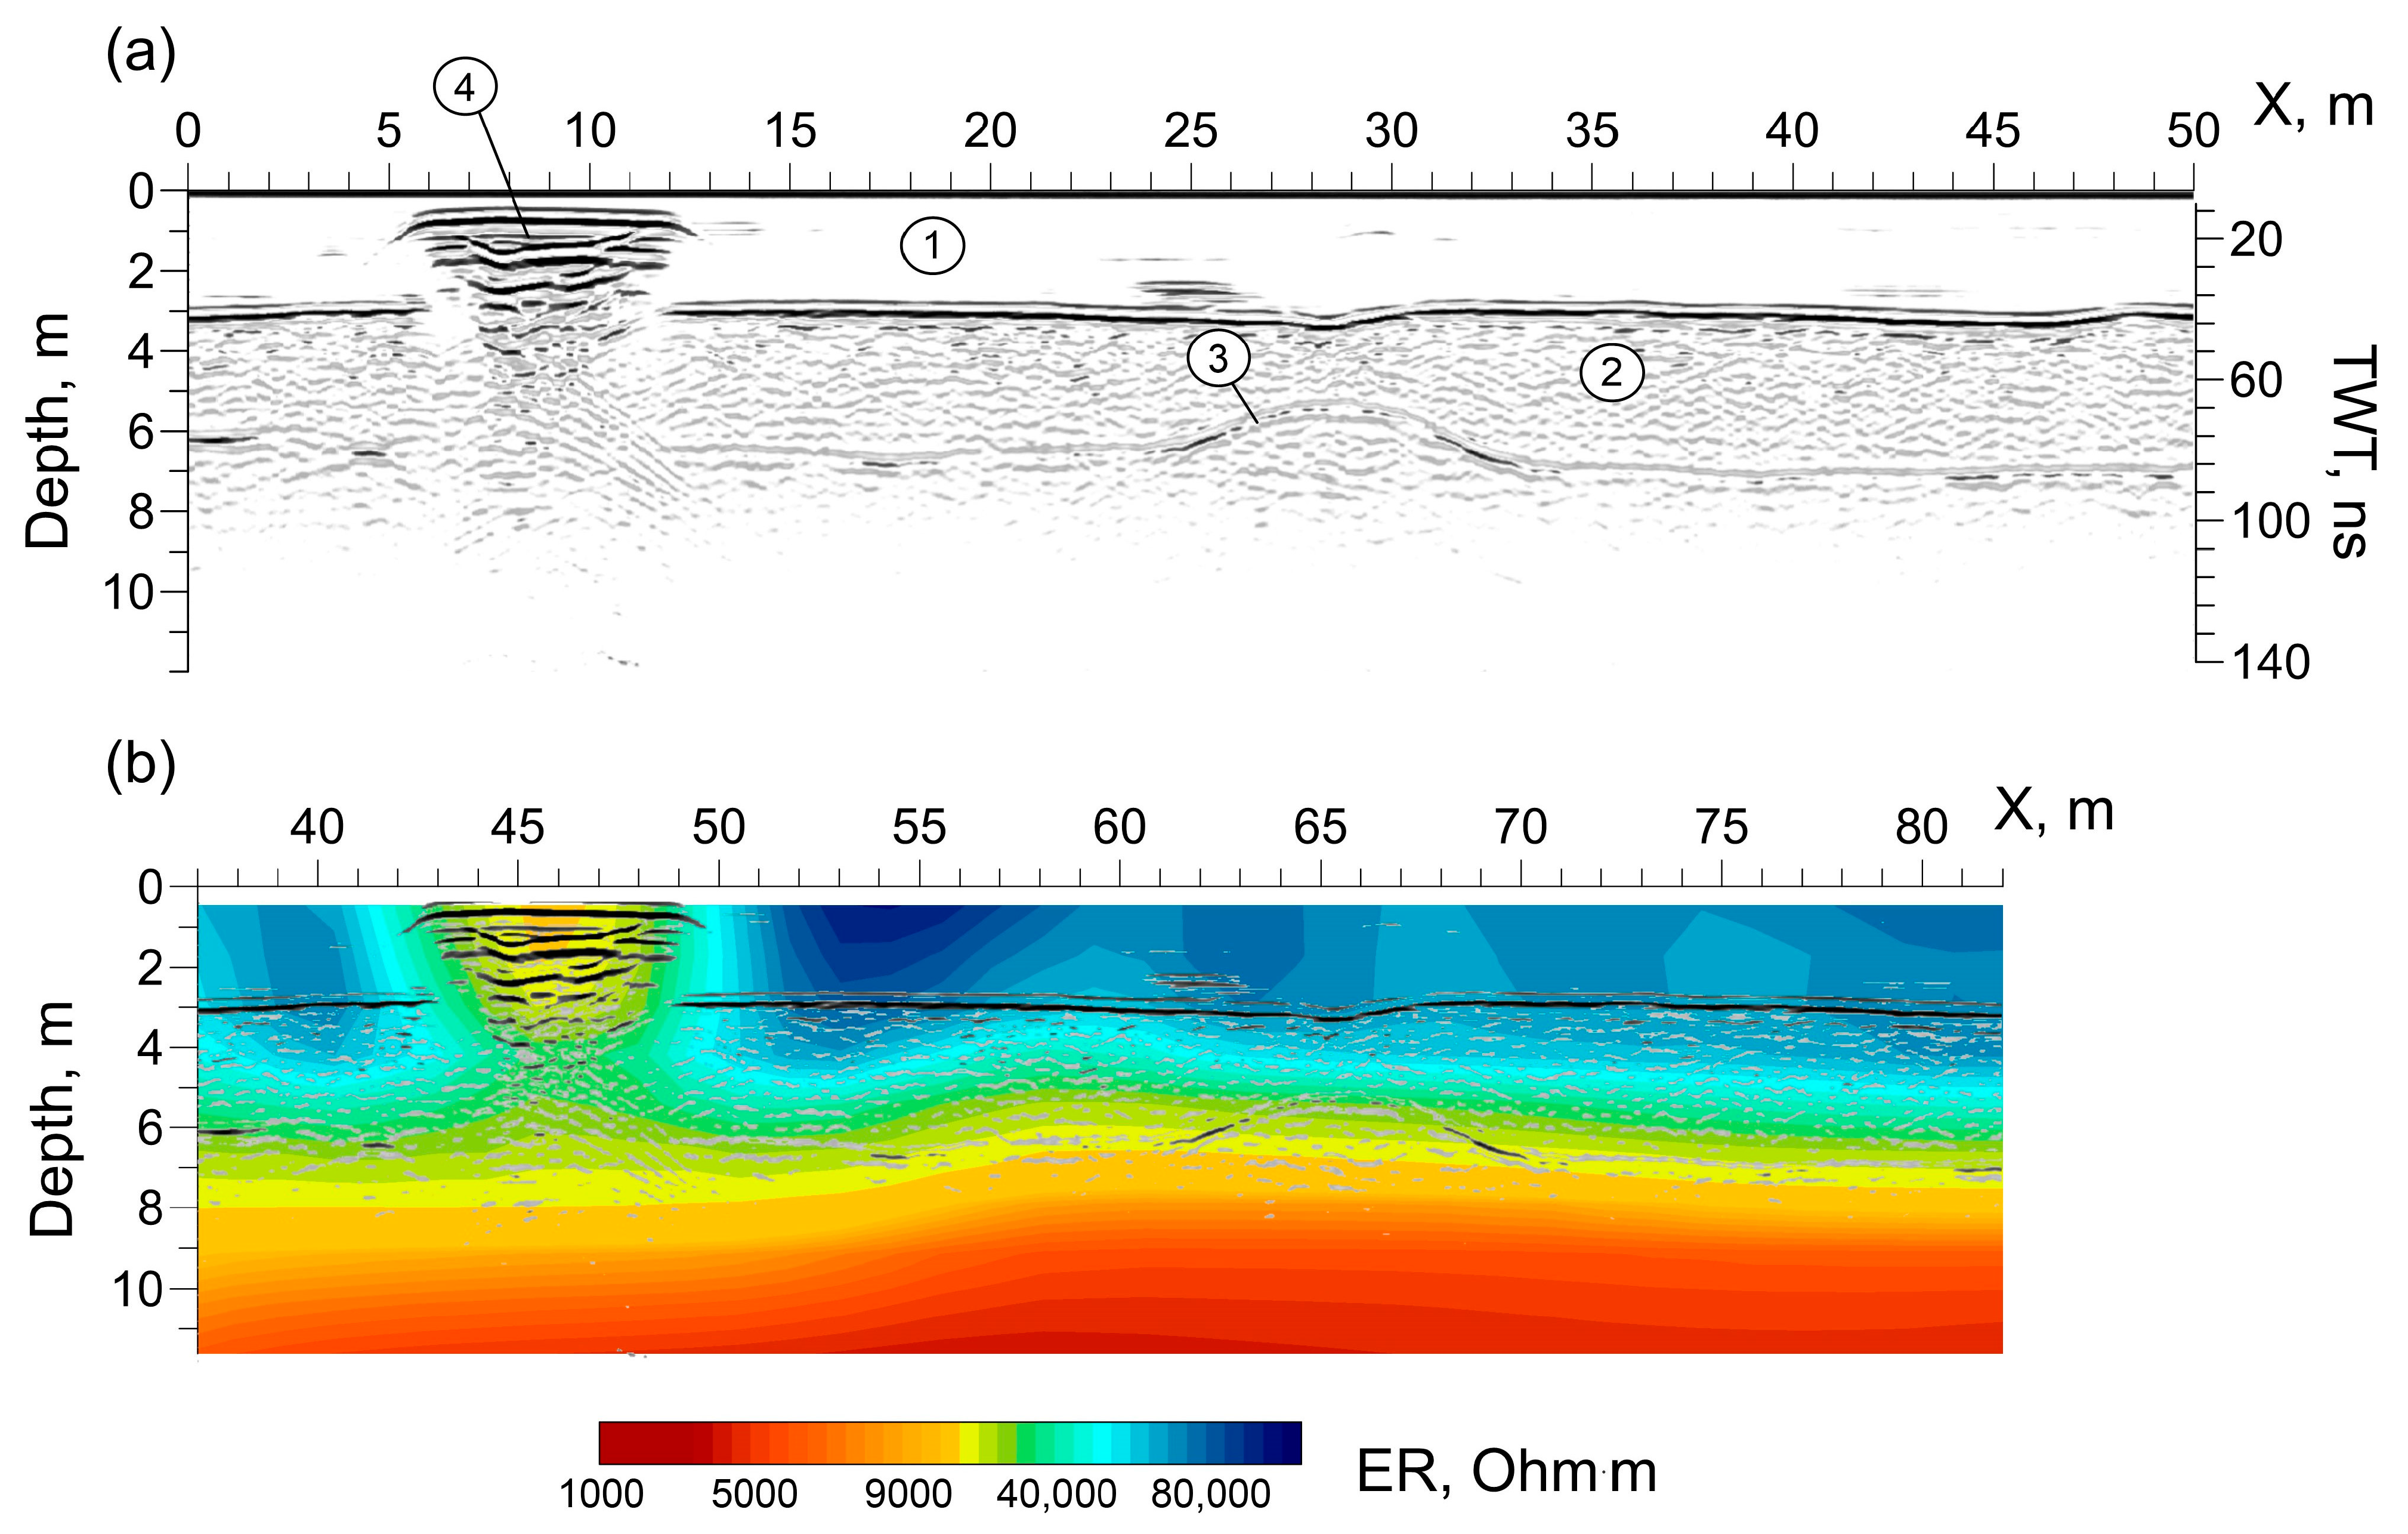
At key site #2 (see Figure 1c,d) according to the GPR data from 2022, it was established that there is a reduction in SFL depth along the river channel from 4 to 2 m (Figure 9a). In addition, a local intense anomaly of the reflected radar signal was accidentally detected in the ice, under which the boundary of the SFL was not visible. As a result of the 3D inversion of the CCERT data, a volumetric geoelectric model was constructed (Supplementary Materials). The layer of ice and frozen alluvium is manifested as a high-resistivity layer with ER of more than 30,000 Ohm·m. Within the high-ER layer (ice), a local isometric anomaly of low ER with a diameter of about 6 m is distinguished.
The intense reflection of the radar signal and the lowered ER in the zone of the local anomaly were interpreted as a water lens (Figure 9b) which was confirmed at depths of 0.5–1.0 m by the well drilled at the milestone at 45 m. It is likely that it was formed after one of the channels discharging water into aufeis stopped functioning.

4.5. Investigation of the Geology Structure of the Aufeis Glade Based on TEM Results

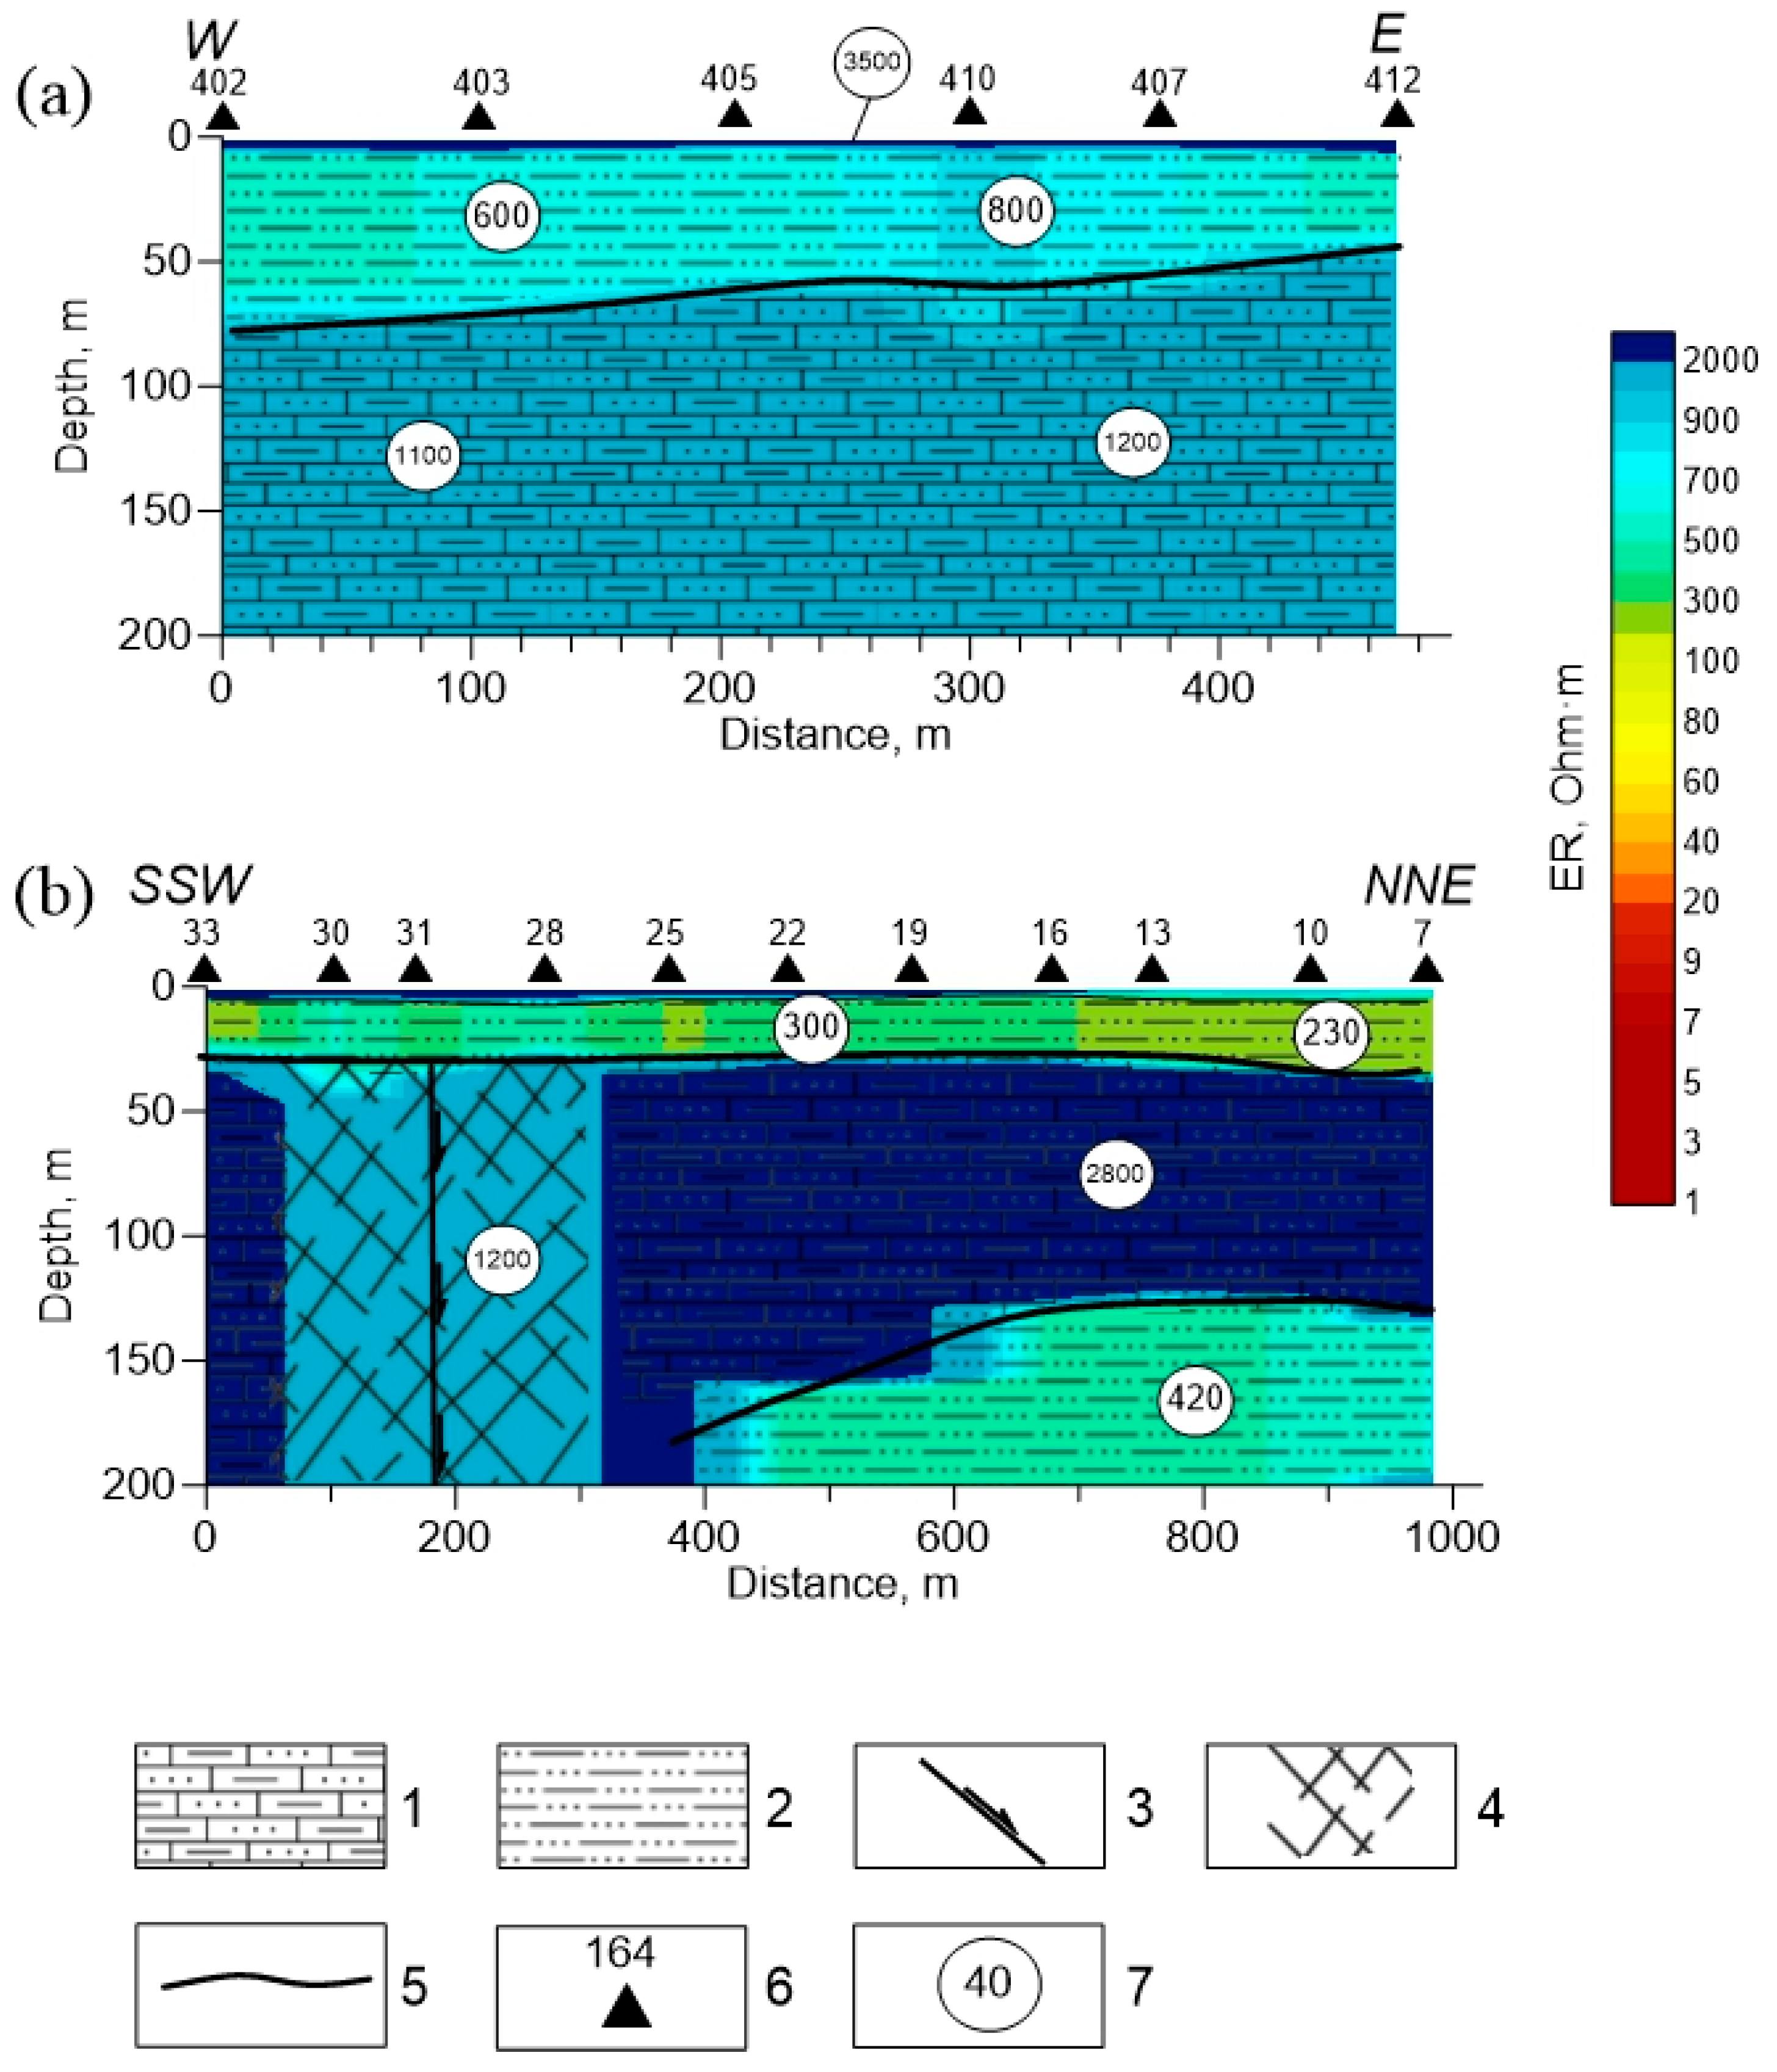
On sections along TEM profiles 1 and 2 (see Figure 1b), located in the area of development of Permian shales and silty sandstones of the Neryuchinskaya and Kulinskaya suites, ER varies from 6–12 to 125 Ohm∙m. Low ER values of 6–12 Ohm∙m are most likely associated with the pyritization of clay shales, which is often found in the study area (Figure 10).
In sections along TEM profiles 3 and 4 (Figure 11), the rocks have a very high ER and are located in the area of occurrence of clayey and sandy-clayey shales of the Lower Triassic. TEM profile 4 (Figure 11b) crossed the river floodplain at the location of aufeis formation (Figure 1b). In the section at a depth of about 25 m, a layer with ER of 300–400 Ohm∙m is traced. This layer is underlain by rocks with ER of 1600–2800 Ohm∙m and a polarizability of 16–44% with a transient time constant τ in the range of 10−3–10−4 s. The TEM-IP program determines, in addition to the electrical resistivity of the layers, their polarizability. Polarizability is a temporal process characterized by the tau time constant.
At a depth of about 150 m, a geoelectric boundary was established, which is interpreted as a lithological boundary, but it may also be the permafrost base. In the profile interval of 100–300 m, there is a vertical area of reduced ER of 1300 Ohm∙m against a background of 2900 Ohm∙m, which is interpreted as a fault zone. According to the Sentinel-2 satellite image obtained during the period of TEM soundings downstream of profile 4, ice accumulated, and upstream at 400 m, GW emerged to the surface. This means that below the point where the GW emerges to the surface, the upper part of the section freezes, which is expressed in a high ER of the rocks.
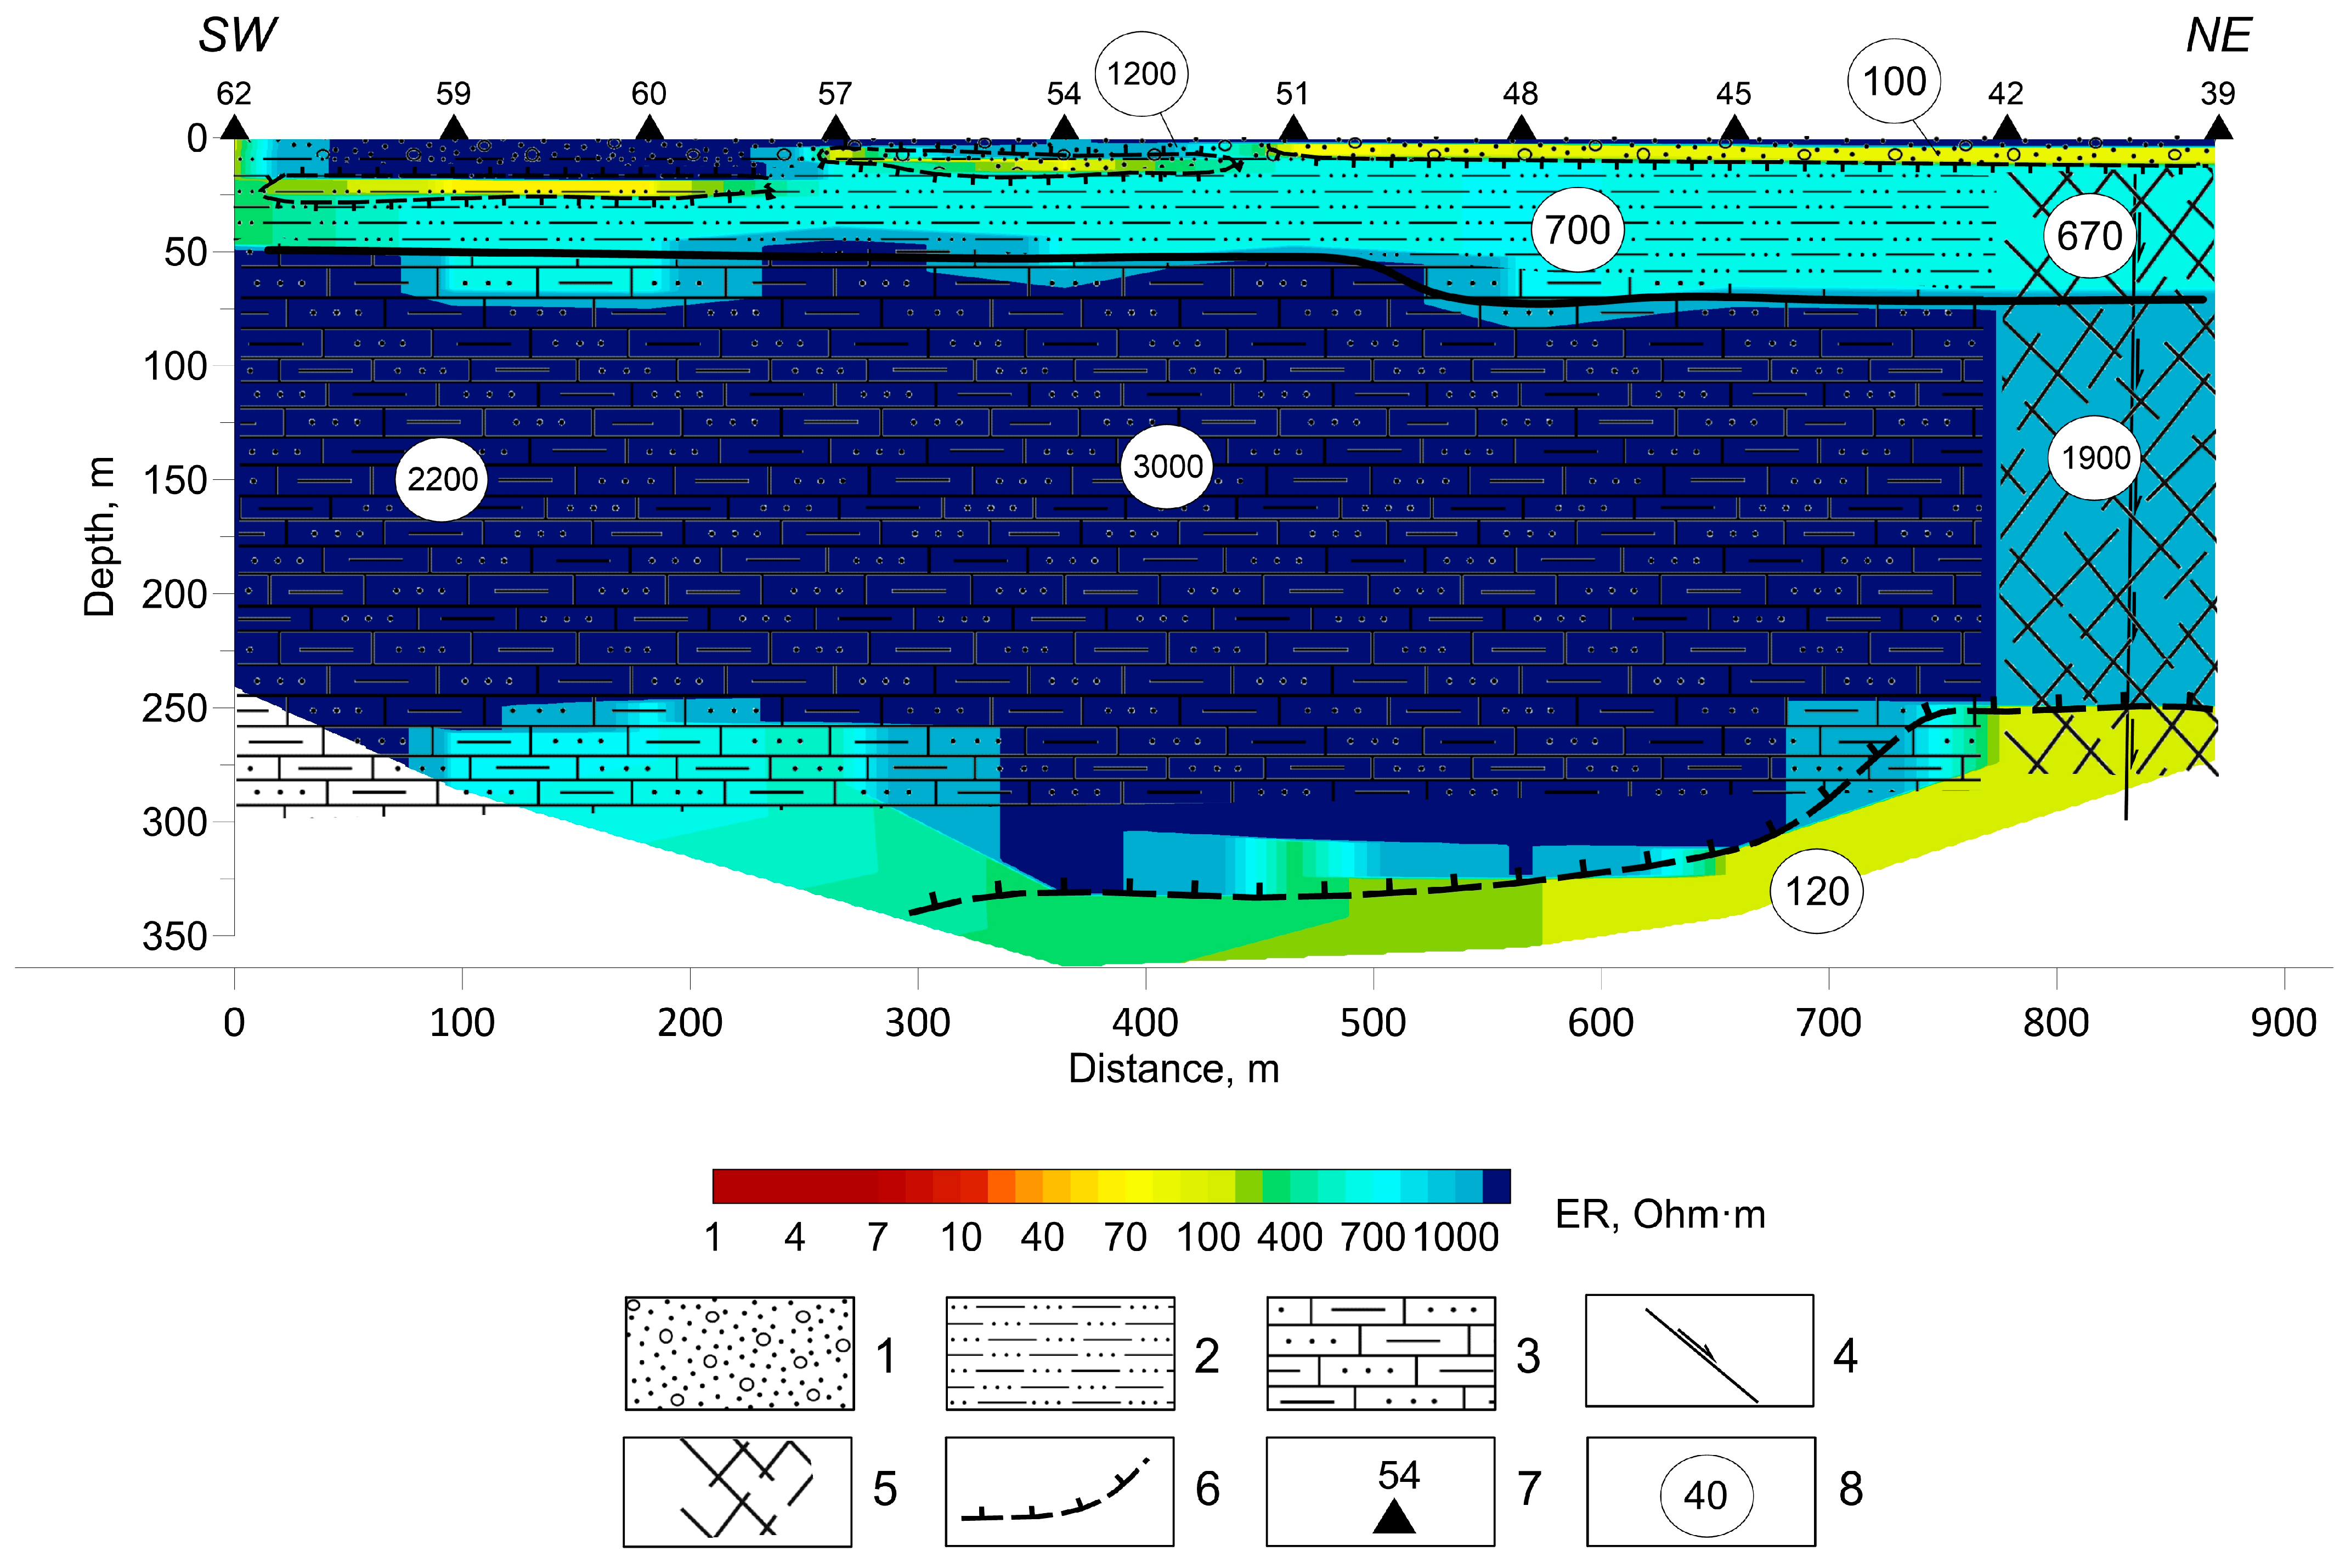
TEM profile 5 (Figure 12) crosses the river floodplain, in the area where aufeis does not form. At the upper part of the geoelectric section along profile 5, thin layers of low ER of 60–150 Ohm∙m are distinguished, which are interpreted as non-freezing taliks, along which the underchannel flow of GW occurs. The top of the talik layer varies from 2–3 m to 8 m. In intervals 0–250 m, a layer of reduced ER is established at a depth of 16–18 m. From a depth of 50 m, a layer of rocks with an ER of 2000–3000 Ohm∙m is distinguished and interpreted as frozen silty sandstones. At the end of the profile, the ER of the silty sandstones decreases to 1900 Ohm∙m against a background of 2400 Ohm∙m, which is explained by their increased fracturing along the fault.
At the geoelectric section along TEM profile 6 (Figure 13) from a depth of 2–3 to 10–12 m, a layer of low ER at 90–150 Ohm∙m is also distinguished, which probably represents a suprapermafrost talik. The thickness of this layer varies from 10 to 20 m in the southwestern part of the section to 65 m in the northeastern part of the section near the right bank of the river. Below, up to a depth of 170–250 m, there are rocks of high ER (more than 1000 Ohm∙m). It is assumed that the base of the permafrost is located at a depth of 170–250 m (not shown in Figure 13).
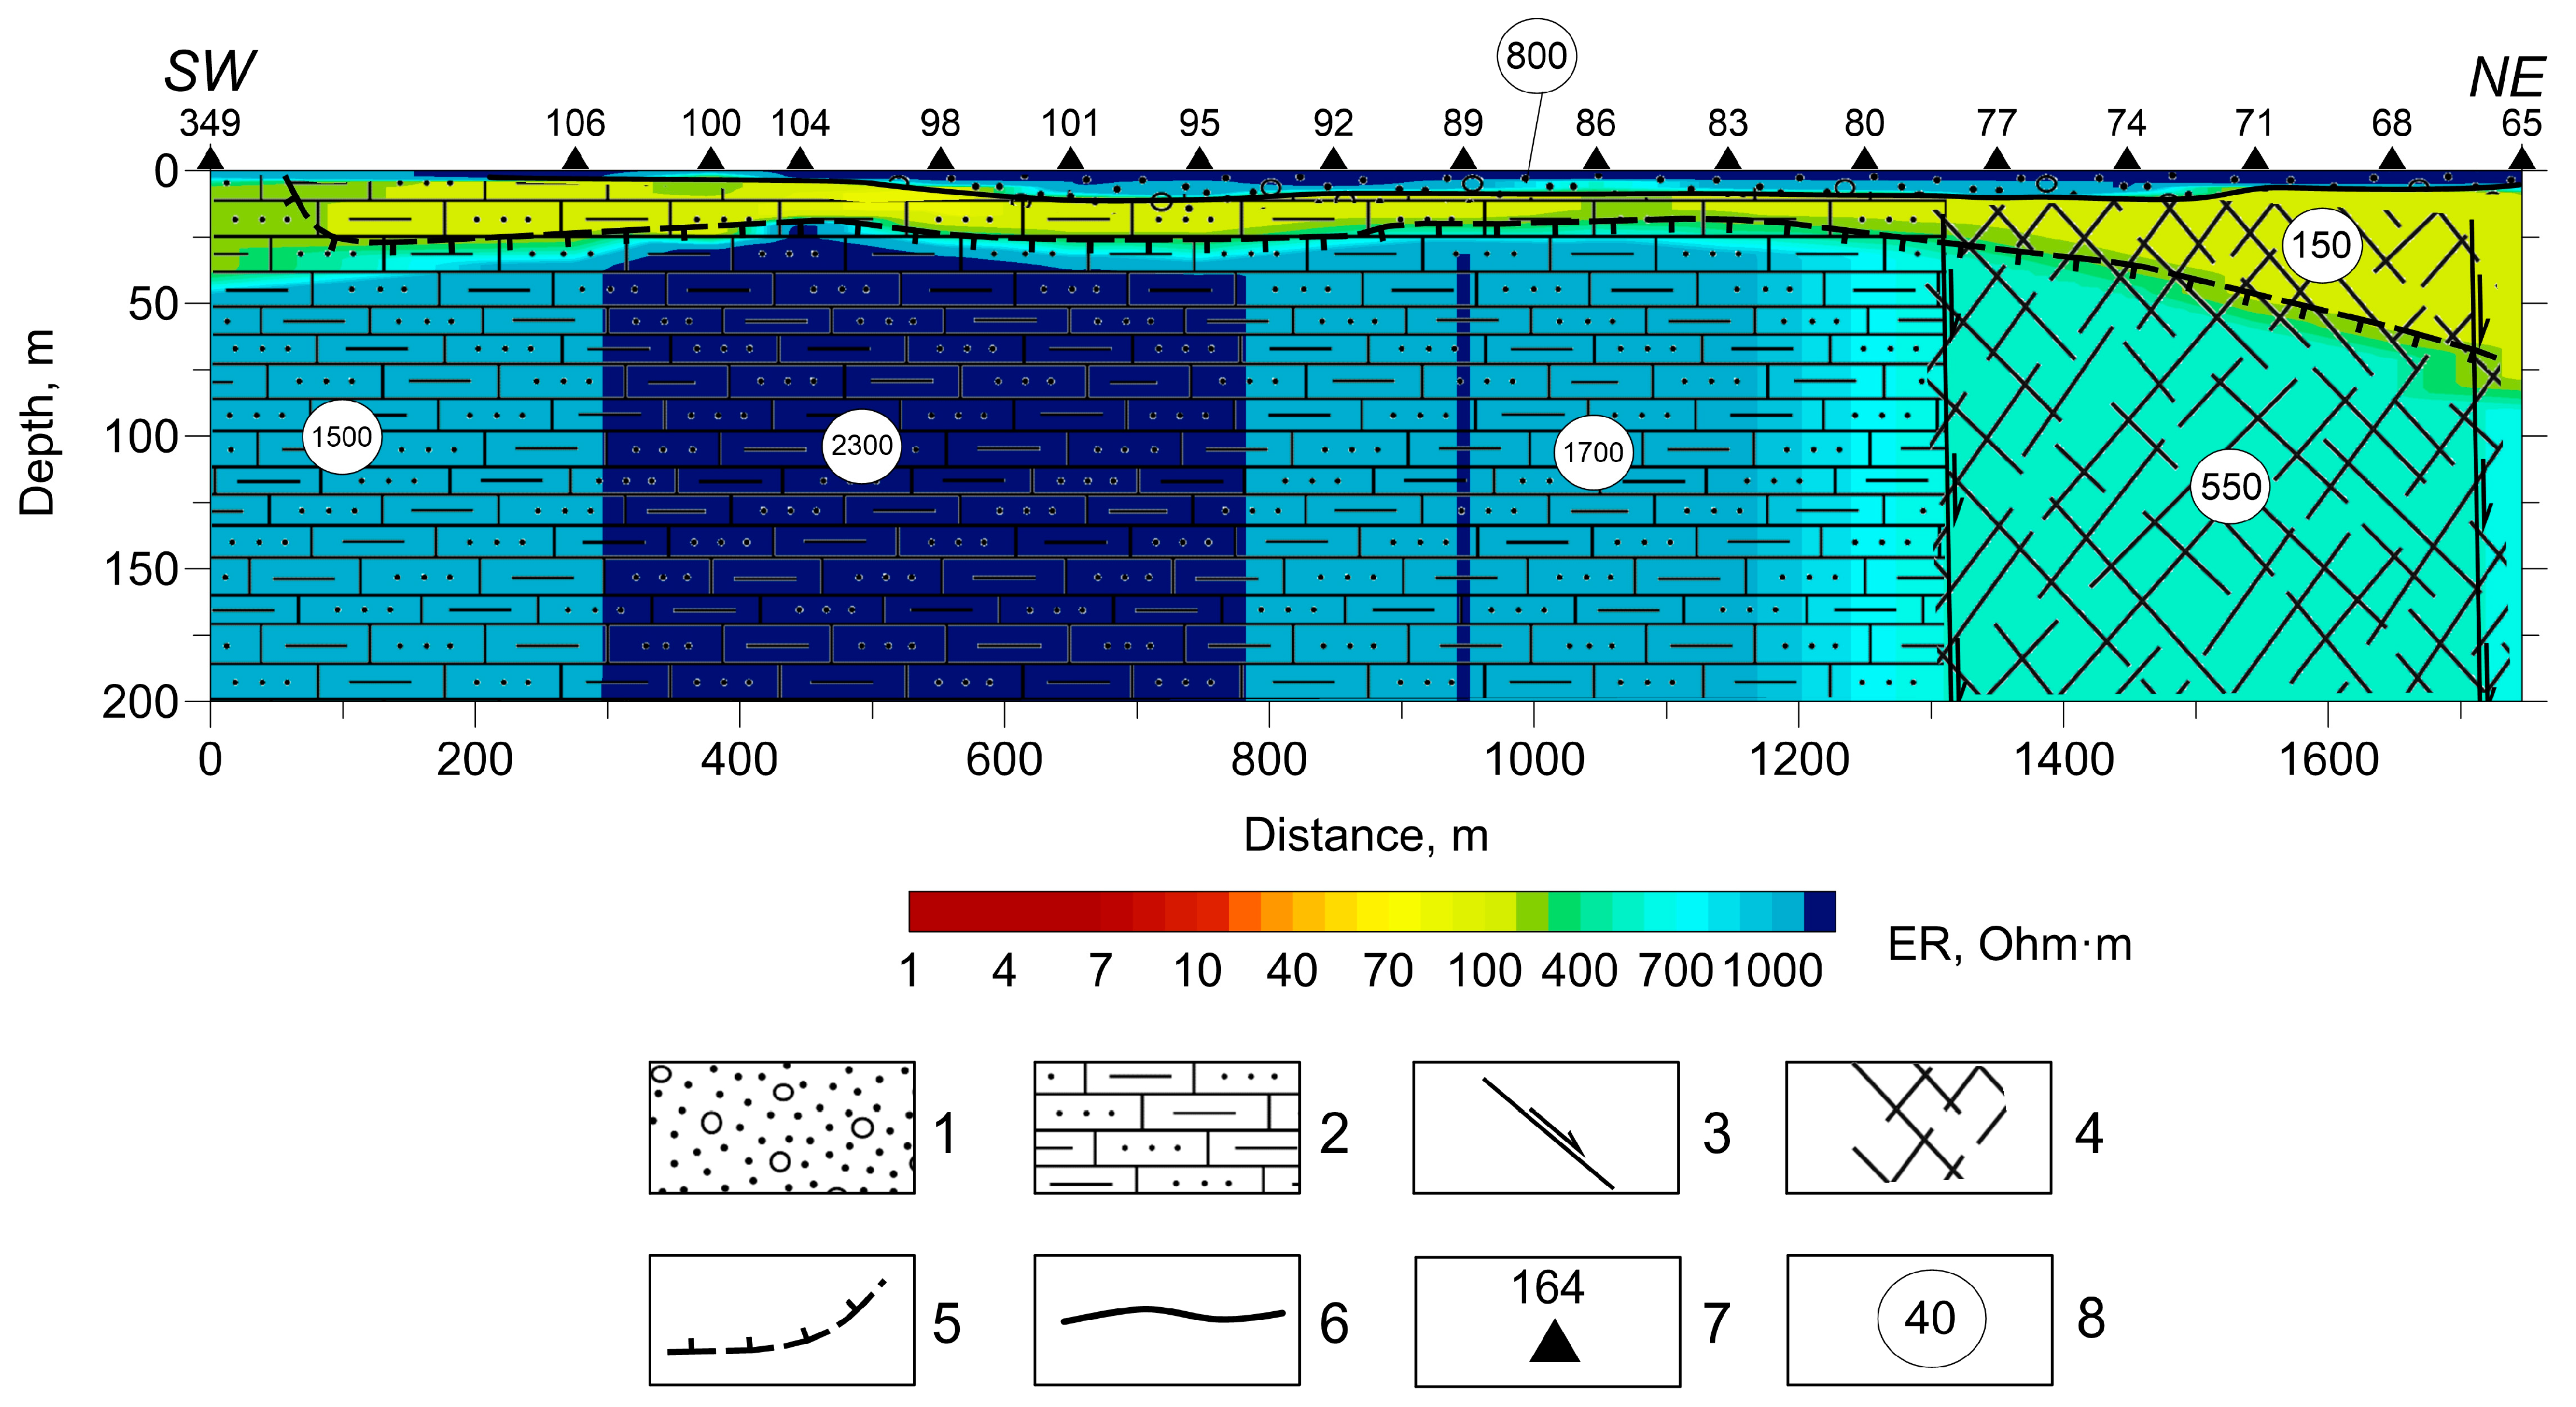
The geoelectrical structure of the section along TEM profile 7 (Figure 14) differs significantly from the resistivity section along TEM profile 6, although the profiles are located at a distance of 1200 m. High ER is observed only in the uppermost part of the section to a depth of 2.5–5.0 m in frozen Quaternary alluvial deposits. Changes in the characteristics of the section at TEM profile 7 compared to the section of TEM profile 6 indicate a change in the geological situation. Here we are faced with the impact of lithology on ER distribution, when a decrease in ER of the section is associated not with a change in permafrost temperature but with an increase in the clay content of the rocks. We assume that between TEM profiles 6 and 7, there is a lithological replacement of silty sandstone by clayey shale [22]. In the profile interval of 500–700 m from a depth of 5.5 to 25 m, an area of rock with ER reduced to 60 Ohm∙m was established. This area is interpreted as a talik in fractured bedrock, through which GW is filtered. A local anomaly of reduced ER was also identified at point 133. In the profile interval of 700–980 m, from a depth of 20–35 m, a zone of reduced (60–90 Ohm∙m) resistivity is identified, interpreted as a fracturing zone.
At the geoelectric section along TEM profile 8 (Figure 15), the upper part of the section to a depth of 50–80 m has a high ER from 400 to 1200 Ohm·m. Judging by ER, these rocks are mainly represented by sandstones in a frozen state. Inside this high ER layer, at point 150, a local area of ER reduced to 250 Ohm·m, about 50 m deep, is distinguished. This area is located under the branch channel of the river and, possibly, represents a subchannel talik. Another area of reduced ER is identified at points 162, 159, and 156, at depths from a few meters to 30 m. It is assumed that the identified taliks do not freeze over in winter due to their deep occurrence, which ensures unhindered GW flow without ice formation at this section of the river valley. Below the layer of high ER, rocks with low ER (110–160) are found, which are probably composed of clayey shales. At a depth of about 200 m, the top of the layer with ER of 50–60 Ohm·m can be traced. It is quite possible that this boundary is the base of permafrost. In the southwestern part of the profile, in the interval of 0–50 m, a subvertical conductive zone is distinguished, interpreted as a fracture zone.
The geoelectric section along TEM profile 9 (Figure 16) shows that rocks under the aufeis formation area have a very high ER, reaching 1400 Ohm·m (Figure 11). Approximately at the border of aufeis field, in the area of points 279–282, there is a sharp change in the characteristics of the geoelectric section. The rocks’ ER decreases to a few hundred Ohm·m, and steeply falling anomalies of ER reduced to 50–60 Ohm·m, as well as false local anomalies of high ER caused by polarization effects of the medium or the influence of 3D inhomogeneities (steep contacts), appear. At the contact of geoelectric complexes of high and low ER in the area of point 285, it is assumed that there is a fault along which the deep GW discharges. In addition, the existence of fault zones under loose Quaternary deposits is expected at points 300 and 306–309.

5. Discussion

Disputes about the genesis of the Anmangynda aufeis were raised during the period of its active research. Some assumptions were based on an analysis of the chemical composition of the water of the supposed spring source and its flow rate, located above the aufeis, and river waters forming below the aufeis. V.M. Lebedev [37] concluded that the main role in feeding the aufeis belongs to the upper GW aquifers (superpermafrost water), which, in the spring and summer, are replenished by melting snow and rainfall. He suggested that they had no connection with intrapermafrost and subpermafrost waters; in the winter, they are spent on maintaining the under-channel flow and exhaust by spring [38]. Another opinion is that in the Anmangynda river valley, a single powerful flow of GW moves, whose speed gradually decreases with depth as the fracturing of bedrock decreases [39]. N.A. Bukaev [20] assumed that 90–92% of the aufeis is formed by deep GW. He mentioned the aufeis spring source, located on the fault line at the confluence of the Solontsovy stream and the Anmangynda river. Constant water temperature and the spread of dark green algae in the area of the spring, which developed throughout the winter period, was the sign of subpermafrost GW. In [6], based on data on the flow rate of aufeis-forming springs and the measured volume of the aufeis from November to March, it was concluded that under the Anmangynda aufeis, ground-filtration taliks with a small cross-section are located, the throughput of which is very small.
In 1966, geophysical survey was carried out at the aufeis glade to determine the thickness and properties of frozen rocks. Interpretation of vertical electrical sounding data showed the presence of permafrost under the alluvium layer, 2–20 m thick, below which water-saturated bedrocks were identified. However, the results have been called into question due to the insufficient geological and hydrogeological interpretation of the obtained data [40]. We have shown that subaqueous GW discharge channels in alluvial deposits that feed the aufeis are distinguished according to GPR data by narrow vertical lines of high-amplitude reflections (Figure 3). In areas of GW discharge, the depth of seasonal freezing of alluvium decreases, which is clearly visible at the GPR sections. Similar high-amplitude reflections above the channels of GW recharge were identified but not interpreted at the Kuparuk aufeis field on the North Slope of Alaska [17]. Identical anomalies pointing to aufeis springs discovered in Siberia and Alaska refer to universal signs of identifying discharge channels in any regions where aufeis form.
During the study, it was important to establish whether there is a connection between the areas of aufeis-feeding GW discharge with faults and hydrogeogenic pressure-filtration taliks. Through combining GPR and CCERT data, it was found that the areas where GW is discharged onto the aufeis field spatially coincide with the anomalies of low ER in the alluvial deposits or the top of the bedrock. Two types of low ER anomalies are distinguished. The first type is local isometric ones with a size of up to 20 m among high-ER rocks, which we explain as freezing suprapermafrost taliks (Figure 4b, intervals 140–150; Figure 8, intervals 105–120). The second type of low ER anomalies are local or horizontally extended areas among rocks with reduced ER, which we interpret as channels of GW filtration in alluvial deposits (Figure 4b, point 90; Figure 8, point 50). In some cases, such anomalies coincide with vertical zones of reduced ER in the bedrock (Figure 7, point 50). It is likely that the aufeis is being fed by water from the alluvial complex, which in turn is replenished by fractured bedrock aquifers. However, the insufficient depth (several tenths of a m) of the CCERT method did not allow for the detection of vertical anomalies of low ER in deep bedrock. This was not detected using TEM data, since the step between the sounding points was too large. Data analysis suggests the possibility of alluvial recharge by GW from the bedrock through narrow zones of fracturing. Local isometric or oval-shaped anomalies of minimum SFL depth, which may form at the locations of upwelling flows in the alluvium (springs) from the bedrock, support this hypothesis (Figure 6b).
According to historical geophysical data [40], above the aufeis glade, under a high ER layer of relatively low thickness, there are rocks with an ER of less than 100 Ohm·m, and in some places, less than 30 Ohm·m. Our TEM data confirm these results—directly under the aufeis glade, rocks have an ER of more than 1000 Ohm·m to a depth of about 300 m, and above the aufeis glade along the river, approximately 400 m from the edge of the aufeis, the ER of the rocks is 55–150 Ohm·m over 800 m (Figure 16). Surface springs of GW above the aufeis glade spatially coincide with the surface outlet of steeply dipping zones of low ER, interpreted as faults, along which the discharge of GW is likely to occur (TEM profile 9, Figure 16). In the same place, according to geological data, there is a junction of faults, one of which cuts the river valley. One is across the Anmangynda, and the other is at an angle of 30–35° relative to the first fault. A permanent non-freezing spring is located at the fault node [20].
The discovery of a water lens inside the ice shows that the aufeis is a highly dynamic system, in which sources of aufeis-feeding water appear and disappear. The cessation of spring activity may be related to a decrease in pressure in the GW aquifer due to changes in hydrogeological conditions, such as the freezing of a talik or a decrease in water reserves in the alluvium. Therefore, at those sections where the alluvial GW aquifer is supplied by deep fractured-rock aquifers, water discharge onto the aufeis occurs continuously. This may explain the local areas of maximum ice thickness, marking deep sources of GW. It is likely that aufeis-forming waters of various geneses are part of a single hydrodynamic system. Alluvial aquifers are replenished by water from faults of different orders. Signs of narrow fault zones in the form of vertical anomalies of reduced ER in bedrock are identified according to CCERT data (Figure 7 and Figure 8).
A comparison of the data obtained on the distribution of ice thickness in 2021 and 1963 [20] shows that the greatest ice thickness is concentrated in different parts of the aufeis glade. According to historical observations, the first maximum was in the middle (on the isthmus), and the second, in the upper part of the aufeis. A GPR survey in 2021 showed the absence of ice on the isthmus (Figure 2); the maximum ice thickness located in the upper part of the aufeis was 1.3 times lower than historical values. It means that there is a shift in GW sources and a change in the overall configuration of the aufeis.

6. Conclusions

Based on the data of geophysical research, the following results were found.
Within the study area, the rocks’ ER is determined primarily by their lithological features, degree of fracturing, and material composition. This significantly complicates the geocryological interpretation of the sections and makes it practically impossible to identify taliks in the conditions of low-ER shales.
Intensive diffraction hyperbolas are distinguished at the GPR sections, indicating the areas of GW discharge from the alluvium under the ice (Figure 3 and Figure 4). Usually, they are located in river channels. It is assumed that some channels are connected to deep GW sources in the bedrock.
The CCERT data showed that the permafrost layer up to a depth of 20 m has a complex structure with large and small river taliks. The channels of GW discharge from freezing taliks are identified by local or horizontally extended low ER anomalies among rocks of reduced ER.
For the first time, the CCERT method was used to obtain a volumetric geoelectric model of ice, which revealed a lens of unfrozen water (Supplementary Materials). Such a result could not be achieved previously using ERT with galvanic contact electrodes, due to the impossibility of grounding in ice, or electromagnetic methods, due to the high ER of ice and water. Only the use of the CCERT method allowed for the identification of the heterogeneous structure of ice. The combination of CCERT and GPR methods opens up wide prospects for solving similar hydrological or glaciological problems.
In the case of high-ER rocks, in the upper part of the section, according to the TEM data, anomalies of low ER were identified in alluvium and the fractured top of bedrocks (Figure 16). Such anomalies are interpreted as taliks. They occur at depths from 2–3 m to 16–18 m. The bottom of permafrost is determined by the lower boundary of rocks of high and low ER at depths around 250 m (Figure 11). Directly under the Anmangynda aufeis field, the rocks have a very high ER (Figure 16).
The combination of several geophysical techniques has proven to be an effective tool in studying aufeis formation and has significantly contributed to our understanding of the genesis of aufeis fields. The integration of these methods with traditional field observations and geological analyses can lead to more comprehensive insights into the processes governing aufeis formation and evolution. It is important, as aufeis fields result from the interaction between permafrost, surface flow, and GW. They are well-detected using remote sensing images. Changes in their characteristics may serve as indicators of cryosphere transformation in remote ungauged areas in the conditions of a warming climate.

Supplementary Materials

The following supporting information can be downloaded at: https://www.mdpi.com/article/10.3390/geosciences13110328/s1, Video S1: A result of 3D inversion of the CCERT data, the zone of the local anomaly was interpreted as a water lens.

Author Contributions

Conceptualization, O.M. and V.O.; methodology, V.O. and V.P., field data collection, V.O., O.M., V.P. and A.Z.; ground-penetrating radar data acquisition and analysis, V.O. and A.Z.; transient electromagnetic method data acquisition and analysis, V.P.; data curation, A.Z.; writing, O.M. and A.Z.; visualization, A.Z.; supervision, O.M.; project administration, O.M.; funding acquisition, O.M. All authors have read and agreed to the published version of the manuscript.

Funding

The analysis of the data was conducted with the support of the Government of the Magadan region and the Russian Science Foundation (project 23-17-20011).

Data Availability Statement

All data is available by the request to corresponding author.

Acknowledgments

The authors sincerely thank Denis Revutsky, the Head of Tenkinsky Municipal District in the Magadan Region, for his assistance in conducting the research and providing support to the scientific team.

Conflicts of Interest

The authors declare no conflict of interest. The funders had no role in the design of the study; in the collection, analyses, or interpretation of data; in the writing of the manuscript, or in the decision to publish the results.

References

  1. Ensom, T.P.; Makarieva, O.M.; Morse, P.D.; Kane, D.L.; Alekseev, V.R.; Marsh, P. The distribution and dynamics of aufeis in permafrost regions. Permafr. Periglac. Process. 2020, 31, 383–395. [Google Scholar] [CrossRef]
  2. Morse, P.; Wolfe, S. Long-Term River icing dynamics in discontinuous permafrost, subarctic Canadian Shield: River icing dynamics in discontinuous permafrost, subarctic Canada. Permafr. Periglac. Process. 2016, 28, 580–586. [Google Scholar] [CrossRef]
  3. Brombierstäudl, D.; Schmidt, S.; Nüsser, M. Distribution and relevance of Aufeis (icing) in the upper Indus Basin. Sci. Total Environ. 2021, 780, 146604. [Google Scholar] [CrossRef] [PubMed]
  4. Makarieva, O.; Nesterova, N.; Shikhov, A.; Zemlianskova, A.; Luo, D.; Ostashov, A.; Alexeev, V. Giant Aufeis—Unknown Glaciation in North-Eastern Eurasia According to Landsat Images 2013–2019. Remote Sens. 2022, 14, 4248. [Google Scholar] [CrossRef]
  5. Turcotte, B.; Dubnick, A.; McKillop, R.; Ensom, T. Icing and aufeis in cold regions I: The origin of overflow. Can. J. Civil Eng. 2023. e-First. [Google Scholar] [CrossRef]
  6. Romanovsky, N.N. Underground Waters in Cryolithozone; Moscow State University: Moscow, Russia, 1983; 231p. (In Russian) [Google Scholar]
  7. Gavrilova, M.K. Changes in the current climate in the permafrost region in Asia. In Overview of the State and Trends of Climate Change in Yakutia; SB RAS: Yakutia, Russia, 2003; pp. 13–18. (In Russian) [Google Scholar]
  8. Pomortsev, O.A.; Kashkarov, E.P.; Popov, V.F. Aufeis: Global warming and processes of aufeis formation (rhythmic basis of long-term prognosis). Bull. Yakutsk. State Univ. 2010, 7, 40–48. (In Russian) [Google Scholar]
  9. Alekseev, V.R.; Makarieva, O.M.; Shikhov, A.N.; Nesterova, N.V.; Ostashov, A.A.; Zemlyanskova, A.A. Atlas of Giant Aufeis-Taryn of the North-East of Russia; SB RAS: Novosibirsk, Russia, 2021; 302p, ISBN 978-5-6046428-2-5. (In Russian) [Google Scholar]
  10. Zonov, B.N. Aufeis and polynyas in the rivers of the Yana-Kolyma upland. In Transactions of the Obruchev Permafrost Institute of the USSR Academy of Sciences; Publishing House of the USSR Academy of Science: Moscow, Russia, 1944; Volume 44, pp. 33–92. (In Russian) [Google Scholar]
  11. Shvetsov, P.F. Groundwater of the Verkhoyansk-Kolyma Folded Area and Specific Features of Its Manifestation Related to Low Permafrost Temperatures; Publishing House of the USSR Academy of Science: Moscow, Russia, 1951; 279p. (In Russian) [Google Scholar]
  12. Koreisha, M.M. Some features of the study of glaciers and aufeis in the North-East of the USSR. Data Glaciol. Stud. 1972, 19, 245–247. (In Russian) [Google Scholar]
  13. Kane, D.L.; Slaughter, C. Seasonal regime and hydrological significance of stream icings in central Alaska. In Role of Snow and Ice in Hydrology: Proceedings of the Banff Symposia; Unesco-WMO-IAHS: Montpellier, France, 1973; Volume 1, pp. 528–540. [Google Scholar]
  14. Yoshikawa, K.; Hinzman, L.D.; Kane, D.L. Spring and aufeis (icing) hydrology in Brooks Range, Alaska. J. Geophys. Res. Space Phys. 2007, 112, 1–14. [Google Scholar] [CrossRef]
  15. Carey, K.L. Icings developed from surface water and ground water. In Cold Regions Science and Engineering Monograph III-D3; U.S. Army Cold Regions Research and Engineering Laboratory: Hanover, NH, USA, 1973. [Google Scholar]
  16. Liu, W.; Fortier, R.; Molson, J.; Lemieux, J.-M. A Conceptual Model for Talik Dynamics and Icing Formation in a River Floodplain in the Continuous Permafrost Zone at Salluit, Nunavik (Quebec), Canada. Permafr. Periglac. Process. 2021, 32, 468–483. [Google Scholar] [CrossRef]
  17. Terry, N.; Grunewald, E.; Briggs, M.; Gooseff, M.; Huryn, A.D.; Kass, M.A.; Tape, K.D.; Hendrickson, P.; Lane, J.W., Jr. Seasonal Subsurface Thaw Dynamics of an Aufeis Feature Inferred from Geophysical Methods. J. Geophys. Res. Earth Surf. 2020, 125, e2019JF005345. [Google Scholar] [CrossRef]
  18. Kolyma Territorial Administration for Hydrometeorological and Environmental Monitoring. Report on the Results of the Water Balance Studies with the Aufeis Component in the Anmangynda River Basin; Kolyma Territorial Administration for Hydrometeorological and Environmental Monitoring: Magadan, Russia, 1977; 62p. (In Russian) [Google Scholar]
  19. Tolstikhin, O.N. Icings and Ground Waters of North-East of USSR; Nauka: Novosibirsk, Russia, 1974; 164p. (In Russian) [Google Scholar]
  20. Bukaev, N.A. Main Peculiarities of Regime of Giant Aufeis in the upper Part of Kolyma River (the Anmangynda Aufeis as an Example); Aufeis of Siberia; Nauka: Moscow, Russia, 1969; pp. 62–78. (In Russian) [Google Scholar]
  21. USSR State Committee for Hydrometeorology and Environmental Control. State Water Cadastre: Main hydrological Characteristics (for 1971–1975 and the Whole Period of Observation); 19 (North-East); Gidrometeoizdat: Leningrad, Russia, 1978. (In Russian) [Google Scholar]
  22. Pavlyuchenko, L.A. Geological Map of the USSR. Verkhnekolymskaya Series. Scale 1:200000. Sheet P-55-XXX. Explanatory Note; Nedra: Moscow, Russia, 1968; 67p. (In Russian) [Google Scholar]
  23. Tolstikhin, O.N. Hydrogeology of the USSR. Volume XXVI. North-East of the USSR; Nedra: Moscow, Russia, 1972; 297p. (In Russian) [Google Scholar]
  24. Alekseev, V.R.; Boyarintsev, E.L.; Dovbysh, V.N. Long-term dynamics of dimensions of the Amangynda aufeis in the conditions of climate change. In Proceeding of the All-Russia Scientific Conference Devoted to the Memory of A.V. Rozhdestvensky, Outstanding Hydrology Researcher “Current Problems of Stochastic Hydrology and Runoff Regulation”, Moscow, Russia, 10–12 April 2012; pp. 298–305. (In Russian). [Google Scholar]
  25. Zemlianskova, A.A.; Alekseev, V.R.; Shikhov, A.N.; Ostashov, A.A.; Nesterova, N.V.; Makarieva, O.M. Long-term dynamics of the huge Anmangynda aufeis in the North-East of Russia (1962–2021). Led I Sneg. Ice Snow 2023, 63, 71–84. (In Russian) [Google Scholar] [CrossRef]
  26. Logical Systems Company. Radio Engineering Device for Subsurface Sensing (Georadar) “OKO-3”. TECHNICAL Description. Operating Instructions; LLC “LOGICAL SYSTEMS”: Moscow, Russia, 2018; 42p. [Google Scholar]
  27. Geoscan32 Software. Available online: https://www.geotech.ru/programmnoe_obespechenie_geoscan32/ (accessed on 25 May 2023).
  28. Glen, J.W.; Paren, J.G. The electrical properties of snow ice. J. Glaciol. 1975, 151, 15–37. [Google Scholar] [CrossRef]
  29. Gruzdev, A.I.; Bobachev, A.A.; Shevnin, V.A. The determination of usability area for capacitive resistivity measurements. Mosc. Univ. Bull. 2020, 4, 100–106. (In Russian) [Google Scholar] [CrossRef]
  30. High-Frequency Electrical Exploration Station “VEGA”. Available online: https://www.geotech.ru/vega/ (accessed on 25 May 2023).
  31. Loke, M.H. Tutorial: 2-D and 3-D Electrical Imaging Surveys; Geotomo Software: Penang, Malaysia, 2014; 216p. [Google Scholar]
  32. FastSnap Digital Electrical Survey Station. Operation and Software Manual; Sigma-Geo LLC: Irkutsk, Russia, 2017; 177p. [Google Scholar]
  33. Impedans Company and in Temp Data Loggers. Available online: https://impedance-bio.ru/ (accessed on 25 May 2023).
  34. Zemlianskova, A.; Makarieva, O.; Shikhov, A.; Alekseev, V.; Nesterova, N.; Ostashov, A. The impact of climate change on seasonal glaciation in the mountainous permafrost of North-Eastern Eurasia by the example of the giant Anmangynda aufeis. CATENA 2023, 233, 107530. [Google Scholar] [CrossRef]
  35. Onset HOBO and in Temp Data Loggers. Available online: https://www.onsetcomp.com/ (accessed on 25 May 2023).
  36. Olenchenko, V.V.; Gagarin, L.A.; Khristoforov, I.I.; Kolesnikov, A.B.; Efremov, V.S. The Structure of a Site with Thermo-Suffosion Processes within Bestyakh Terrace of the Lena River, according to Geophysical Data. Earth’s Cryosphere 2017, XXI, 14–23. [Google Scholar] [CrossRef]
  37. Lebedev, V.M. Monitoring of Aufeis in the Anmangynda River Basin. Magadan GMO Collect. Work. 1969, 2, 122–137. (In Russian) [Google Scholar]
  38. Lebedev, V.; Ipateva, A. Anmangynda Aufeis, Its Regime and Role in Water Balance of the River Basin. Tr. Dvnigmi 1980, 84, 86–93. (In Russian) [Google Scholar]
  39. Mikhailov, V.M. Through taliks in the valleys of small rivers. Kolyma 2001, 4, 31–34. (In Russian) [Google Scholar]
  40. Solovyova, G.V. Aufeis Regulation of Groundwater Runoff in the Areas of Widespread Occurrence of Permafrost; Final Report; VSEGINGEO: Moscow, Russia, 1967; Volume 1, 447p. (In Russian) [Google Scholar]
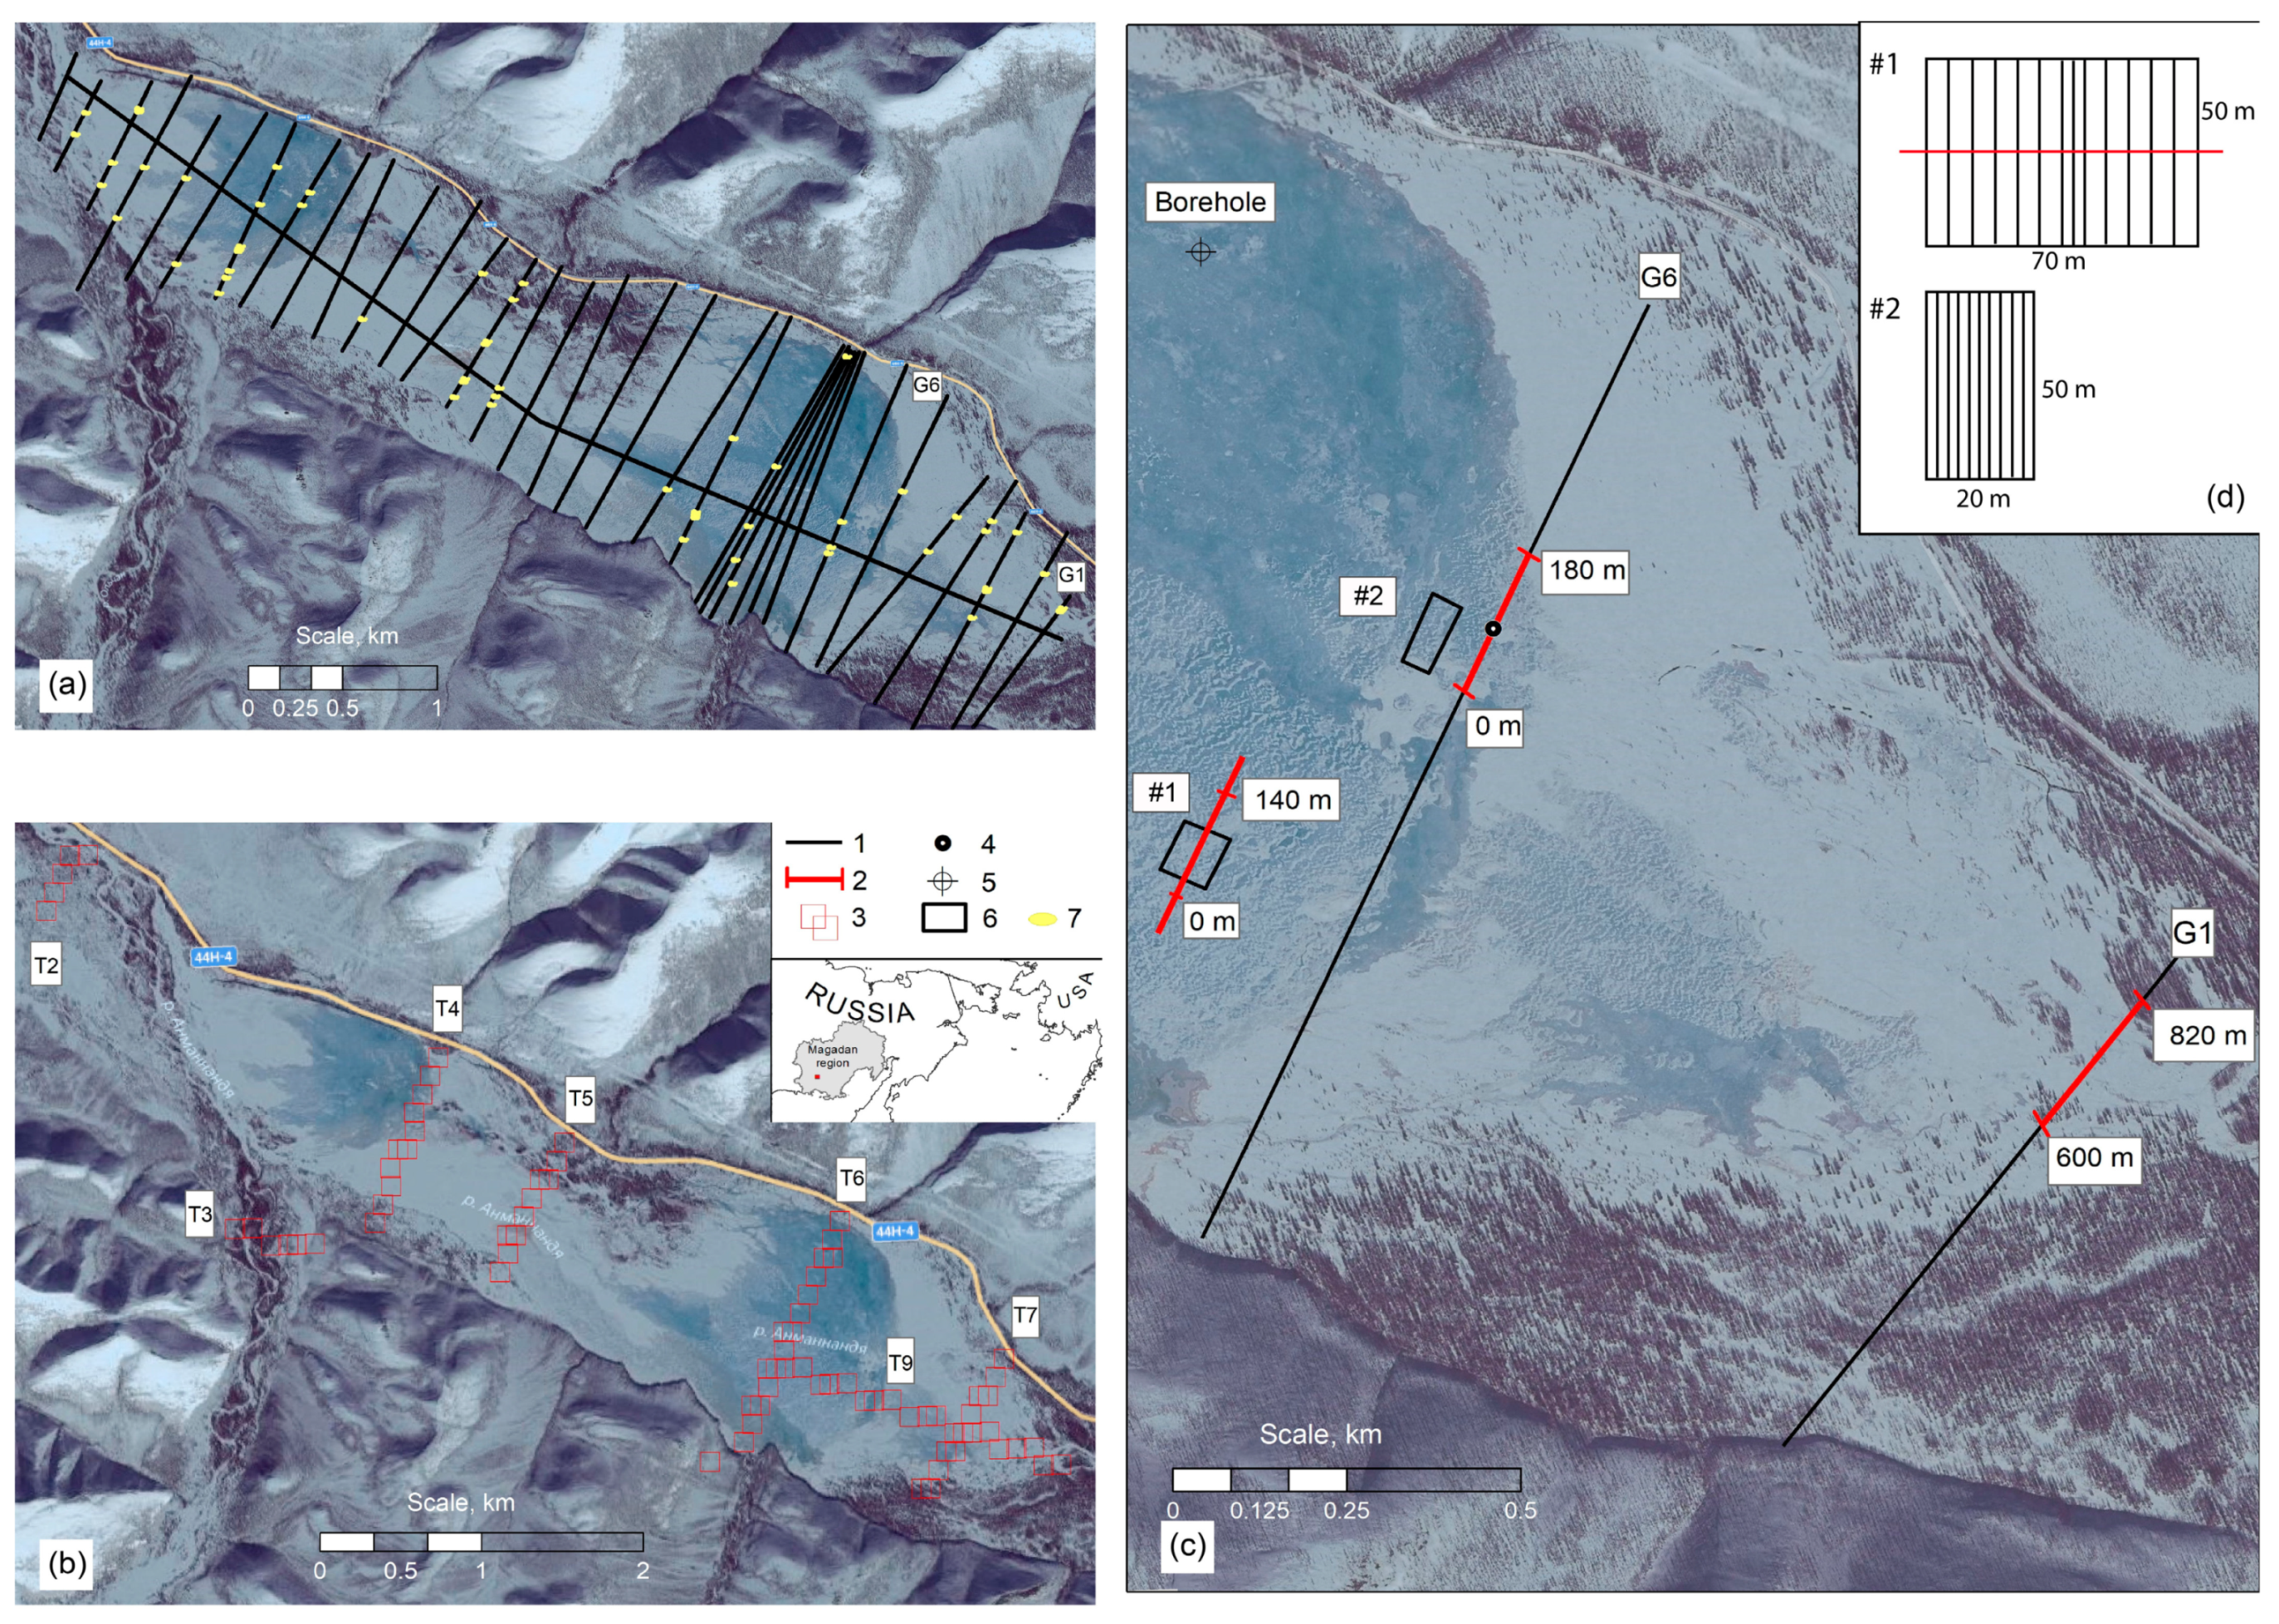
Figure 1. The scheme of study area with the locations of geophysical surveys in 2022 (c,d), GPR profiles in 2021 (a), and TEM profiles in 2021 (b) shown in a Bing satellite image: 1—GPR profiles in 2021; 2—CCERT profiles and survey intervals in 2022; 3—sounding location of TEM in 2021; 4—artesian borehole; 5—thermometric borehole; 6—key sites #1 and #2 in 2022; 7—spring. The geophysical studies were carried out at the Anmangynda aufeis located in the Magadan region of Russia.
Geosciences 13 00328 g001
Figure 2. The Anmangynda aufeis glade on a Sentinel satellite image, 31 July 2021. Scheme of ice depth distribution at the Anmangynda aufeis glade according to the interpolation of the GPR survey results in April 2021.
Geosciences 13 00328 g002
Figure 3. The section of the profile #1 through the valley of the Anmangynda River at the beginning of the aufeis glade (a) and its interpretation (b) according to ground-penetrating radar data: TWT—two-way travel time; 1—snow; 2—ice; 3—water; 4—thawed alluvium (a) and frozen alluvium (b); 5—bedrock (shale); 6—boundary of annual frost zone; 7—ascending filtration channels in alluvium.
Geosciences 13 00328 g003
Figure 4. Ground-penetrating radar section (a); resistivity section (b) and interpretation (c) of the section of profile #6. (a) GPR-sections: 1—reflecting ice-alluvium boundary; 2—reflecting boundary from the sole of the annual frost zone boundary; 3—abnormal signal in the area of cracks; 4—abnormal reflected signal within the ice mound; 5—hyperbole of diffraction in the zone of discharge of GW under ice. Geoelectric section according to the data of the CCERT measurements with reflective boundaries of the radar survey (b) and its interpretation (c): 1—ice; 2—water; 3—alluvium; 4—bedrock (a) fractured along the fault (b); 5—the boundary of annual frost zone; 6—the boundary of the permafrost rocks; 7—expected direction of movement of GW; 8—watered rocks through filtration channels.
Geosciences 13 00328 g004
Figure 5. The GPR section next to the thermometric well, the graph for ground temperature according to thermometric well data and the geological section: 1—alluvium; 2—shale; 3—watered rocks through filtration channels; 4—the boundary of annual frost zone; 5—the boundary of the permafrost rocks.
Geosciences 13 00328 g005
Figure 6. Summer orthophotoplan of the ice mound formation site (key site #1) (a) and the map of the depth of seasonal freezing Hsfl (m) according to the ground-penetrating radar survey in 2022 (b): 1—the place of ice mound formation and outlet of water on aufeis; 2—local anomalies of seasonal freezing depth.
Geosciences 13 00328 g006
Figure 7. Ground-penetrating radar section (a) through an ice mound (Key site #1) and comparison of the radarogram and the geoelectric section based on the results of 2D inversion of CCERT data (b): the arrow shows the place of water outlet to the ice.
Geosciences 13 00328 g007
Figure 8. Geoelectric section through aufeis with interpretation elements: 1—the boundary of annual frost zone; 2—the boundary of permafrost rocks; 3—the place of discharge of GW to aufeis from the ice mound.
Geosciences 13 00328 g008
Figure 9. Key site #2. Ground-penetrating radar section (a) and CCERT cross-section (b) according to the results of 3D inversion along the profile through the lens of water in ice: 1—ice; 2—frozen alluvium; 3—the boundary of annual frost zone; 4—local abnormality inside the ice.
Geosciences 13 00328 g009
Figure 10. TEM geoelectric sections at profile 1 (a) P and profile 2 (b) with interpretation elements: 1—alluvium; 2—clayey shale; 3—pyritization; 4—fault; 5—fault zone; 6—the boundary of the permafrost; 7—point TEM; 8—electrical resistivity of rocks according to TEM.
Geosciences 13 00328 g010
Figure 11. TEM geoelectric sections at profile 3 (a) and profile 4 (b) with interpretation elements: 1—sandy shale; 2—siltstone; 3—fault; 4—fault zone; 5—lithologic boundary; 6—point TEM; 7—electrical resistivity of rocks according to TEM.
Geosciences 13 00328 g011
Figure 12. TEM geoelectric sections at profile 5 with interpretation elements: 1—alluvium; 2—siltstone; 3—sandy shale; 4—fault; 5—fault zone; 6—the boundary of the permafrost; 7—point TEM; 8—electrical resistivity of rocks according to TEM.
Geosciences 13 00328 g012
Figure 13. TEM geoelectric sections at profile 6 with interpretation elements: 1—alluvium; 2—sandy shale; 3—fault; 4—fault zone; 5—the boundary of the permafrost; 6—lithologic boundary; 7—point TEM; 8—electrical resistivity of rocks according to TEM.
Geosciences 13 00328 g013
Figure 14. TEM geoelectric sections at profile 7 with interpretation elements: 1—alluvium; 2—clayey shale; 3—fault; 4—fault zone; 5—the boundary of the permafrost; 6—lithologic boundary; 7—point TEM; 8—electrical resistivity of rocks according to TEM.
Geosciences 13 00328 g014
Figure 15. TEM geoelectric sections at profile 8 with interpretation elements: 1—sandy shale; 2—clayey shale; 3—fault; 4—fault zone; 5—the boundary of permafrost; 6—lithologic boundary; 7—point TEM; 8—electrical resistivity of rocks according to TEM.
Geosciences 13 00328 g015
Figure 16. TEM geoelectric section at profile 9 with interpretation elements: 1—sandy shale; 2—clayey shale; 3—fault; 4—fault zone; 5—the boundary of permafrost; 6—lithologic boundary; 7—point TEM; 8—electrical resistivity of rocks according to TEM; ? — the assumption about the presence of the phenomenon is made.
Geosciences 13 00328 g016
Disclaimer/Publisher’s Note: The statements, opinions and data contained in all publications are solely those of the individual author(s) and contributor(s) and not of MDPI and/or the editor(s). MDPI and/or the editor(s) disclaim responsibility for any injury to people or property resulting from any ideas, methods, instructions or products referred to in the content.